b.
The
o IQR o range
13.3.3 Try It: Measures of Center and Variation
best summarizes the variation of
the data for the agent because …
1.
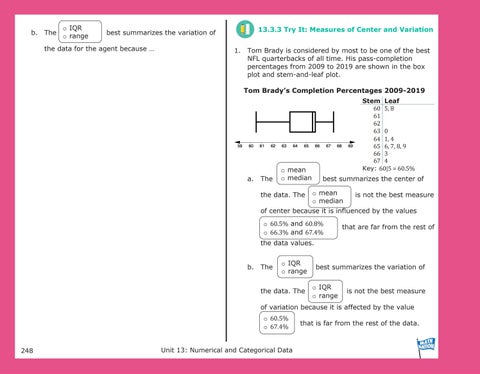
Tom Brady is considered by most to be one of the best NFL quarterbacks of all time. His pass-completion percentages from 2009 to 2019 are shown in the box plot and stem-and-leaf plot. Tom Brady’s Completion Percentages 2009-2019
a.
The
Stem Leaf 60 ͷǡ ͺ 61 62 63 Ͳ 64 ͳǡ Ͷ 65 ǡ ǡ ͺǡ ͻ 66 ͵ 7 Ͷ Key: 60ȁͷ α ͲǤͷΨ
o mean o median
the data. The
best summarizes the center of o mean o median
is not the best measure
of center because it is influenced by the values o 60.5% and 60.8% o 66.3% and 67.4%
that are far from the rest of
the data values. b.
The
o IQR o range
the data. The
best summarizes the variation of o IQR o range
is not the best measure
of variation because it is affected by the value o 60.5% o 67.4% 248
Unit 13: Numerical and Categorical Data
that is far from the rest of the data.