

Cover: Dolly Sods – Grant, Randolph and Tucker Counties, West Virginia


Commitment. It’s a word that the staff members of Mountain Health Network take very seriously. If you look up commitment in the dictionary, you’ll find its exact definition as “a willingness to give your time and energy to something that you believe in, or a promise or firm decision to do something.”
At Mountain Health Network, our commitment is to the health and well-being of our region. It’s something both Cabell Huntington Hospital and St. Mary’s Medical Center believe in very passionately and are more than willing to give our time, energy and talents toward. Our promise is to the more than one million children and adults in 23 counties in West Virginia, Southern Ohio and Eastern Kentucky we serve: That with our combined resources we are dedicated to improving their health and well-being through understanding, respecting and meeting their needs.
To guide our efforts and to further our commitment, we conducted a comprehensive Community Health Needs Assessment (CHNA) across our three-state service area from February to September 2019. The 2019 CHNA builds upon each hospital’s previous CHNAs conducted in 2016 and 2013. This three-year timeline complies with requirements set forth in the Affordable Care Act (ACA), and allows us to track changing trends across our region to better align our services with the priority needs of our community.
Mountain Health Network is pleased to present the 20192022 CHNA report for the communities we serve. This report
includes a comprehensive review and analysis of health and socio-economic data that impact the health of people across our service area. The purpose of this assessment is to identify the area’s health needs so that we may better align with stakeholders, such as public health and health care providers, about opportunities for improving the health of our region. These results allow Mountain Health, county public health departments, our community partners, and other providers to more strategically set priorities, develop interventions, and to commit the appropriate resources to these communities.
In other words, this document is further proof of our promise to our community and our commitment to its health. We will continually assess how we serve our region so we can provide not only outstanding care, but also provide the education and outreach activities that meet the area’s priority needs. We also acknowledge the resources and commitment of our community partners, the many organizations that are named throughout this report, who share our common goal of improving the health and well-being of the community we serve. We look forward to our continued work together.
Best of health to you,

Michael Mullins, FACHE President and CEO Mountain Health Network
The 2019 CHNA was led by representatives from Mountain Health Network (Mountain Health) to oversee regional research and stakeholder engagement. CHNA findings were reviewed with a wide representation of local and regional partners. Steering Committee members are listed below, along with consultant team members. Consultants assisted in all phases of the CHNA including project management, data collection and analysis, and report writing.
Mountain Health Network CHNA Steering Committee Members
Lisa Chamberlin Stump, Chief Strategy Officer, Mountain Health Network
Rebecca Bookwalter, Market Research Manager, Cabell Huntington Hospital
Doug Korstanje, Vice President of Marketing and Community Relations, St. Mary’s Medical Center
Consulting Team
Colleen Milligan, MBA, Director, CHNA Services
Catherine Birdsey, MPH, CHNA Project Manager
Jessica Losito, BA, Research Consultant
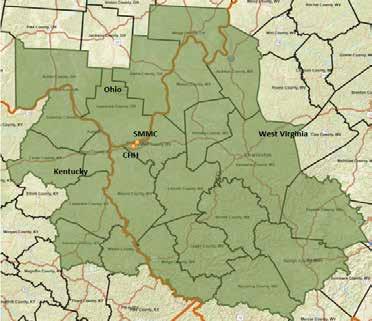
Mountain Health Network examined inpatient volumes for both Cabell Huntington Hospital (CHH) and St. Mary’s Medical Center (SMMC) to define the 2019 CHNA service area, consisting of 23 counties spanning Kentucky, Ohio, and West Virginia. The 23 counties comprise 95% of patients served by both medical facilities.
Mountain Health Network further defined primary service area zip codes, including 48 zip codes in and around
Huntington, West Virginia, the location of both medical facilities. Demographic and socioeconomic data specific to the primary service area zip codes are highlighted in the CHNA report to provide a detailed view of population statistics.
The 2019 CHNA was conducted from February to June 2019 and included quantitative and qualitative research methods to determine health trends and disparities within the Mountain Health Service Area compared to state and national health indicators. Primary study methods were used to solicit input from health care consumers and key community stakeholders representing the broad interests of the community. Secondary study methods were used to identify and analyze statistical demographic and health trends.
Specific CHNA study methods included:
• An analysis of existing secondary data sources, including public health statistics, demographic and social measures, and health care utilization
• A Key Informant Survey
• Focus Groups with health care consumers
• A Regional Health Summit with health and human service partners
The CHNA was conducted in a timeline to comply with IRS Tax Code 501(r) requirements to conduct a CHNA every three years as set forth by the Affordable Care Act (ACA). The findings will be used to guide the hospitals’ community benefit initiatives and engage local partners to collectively address identified health needs.

Health and social indicators for the Mountain Health Service Area indicate opportunity to significantly impact the health and well-being of residents
In assessing the health needs of the community, Mountain Health solicited and received input from persons who represent the broad interests of the community. These individuals provided wide perspectives on health trends, expertise about existing community resources available to meet those needs, and insights into service delivery gaps that contribute to health disparities.
Following the 2016 CHNA, in addition to being posted on the hospital websites, a copy of the CHNA Report and Implementation Plan were made available for public comment for a period of time during the 2019 assessment process. No written comments were received.
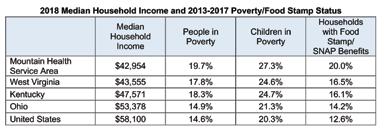
Health and social indicators within the Mountain Health Service Area indicate opportunity to significantly impact the health and well-being of residents of all ages. The median income of residents is lower than state and national benchmarks, and approximately 1 in 5 people and 1 in 4 children live in poverty. Poverty percentages among racial and ethnic minorities are consistently higher than the nation. Unemployment in the area is similar to the nation, but the workforce participation percent in West Virginia (51%) is the lowest in the US (60.4%), indicating larger numbers of working age adults who are not engaged in work. Fewer than 20% of adults across the service area have earned a bachelor’s degree.
Areas of opportunity across the Mountain Health Service Area continue to be centered on behavioral health and substance use disorder needs and chronic disease
prevention and management. Residents have greater risk factors for disease and, overall, experience more chronic diseases. While more residents have health insurance and the area is better served by primary care providers overall, all 23 service counties, except Putnam, have at least one Health Professional Shortage Area. Life expectancy in the region is lower than the nation, particularly among West Virginia service counties. There are higher death rates due to heart disease, diabetes, and respiratory disease, pointing toward a lack of adoption of preventive screenings by residents. The area also has higher rates of suicide and drug-induced deaths.
Mountain Health Network developed a comprehensive three-year plan, included on page 98, to address these areas of need, denoting the resources and expertise that will be committed to improve the health of the region’s population.
All 23 Mountain Health service counties, except Putnam, are designated Health Professional Shortage Areas for mental health care, particularly affecting low-income populations. Quantitative findings reinforce that residents find it challenging to access care when they need it. The suicide rate per age-adjusted 100,000 within the Mountain Health Service Area (18.5) increased over the past decade and is higher than the nation (14) and Healthy People 2020 goal (10.2). West Virginia overall has the highest suicide death rate in the region, at more than two times the Healthy People 2020 target.
Substance use, including alcohol, prescription drug use, and illicit drug use, can exacerbate underlying behavioral health problems, and create stress and anxiety for the individual using substances, as well as their families. Substance use disorder, including overdose, is above national levels in the Mountain Health Service Area. The 2017 drug-induced death rate per age-adjusted 100,000 is 82.2, compared to the national rate of 22.8.
Cabell County, West Virginia, the home county of CHH and SMMC, was among the hardest hit by the opioid epidemic. The 2013-2017 aggregate drug-induced death rate for Cabell County is 99.6 per 100,000. Community partners in Cabell County have collaborated to address the opioid epidemic and have positioned themselves as national pioneers in opioid solutions. Their efforts have resulted in declines in both nonfatal and fatal overdoses in Cabell County in 2017 and 2018. The following is a timeline summary of opioid solution initiatives across the county.
Alcohol consumption is widely accepted, which can also lead to abuse. About 1 in 10 adults in West Virginia and Kentucky and 1 in 5 adults in Ohio self-report excessive drinking, an increase from previous years. Approximately one-third of driving deaths in Ohio are due to DUI, exceeding the national benchmark. The percent of driving deaths due to DUI in West Virginia and Kentucky is only slightly lower at 30.7% and 27.3%, respectively.
Addiction impacts not only the person experiencing substance use disorder (SUD), but also their loved ones. Babies exposed to opiates in the womb, who present with symptoms of withdrawal after birth, are diagnosed with
Neonatal Abstinence Syndrome (NAS). Across the Tri-State region, approximately 2-4% of babies were born with NAS in recent years. The incidence of NAS diagnoses within the Mountain Health Service Area correlates to the overall rise in opioid-related overdoses and deaths. In response, CHH developed the Neonatal Therapeutic Unit to care for babies with NAS and their families by providing treatment, education, and support.
Healthy Living and Chronic Disease
Access to medical care is important, but it is not the only factor in living a long, healthy life. Health promoting activities and reduced disparity are also contributing factors to healthy communities. People living in the Mountain Health Service Area have higher rates of death due to the five national leading causes, four of which are chronic diseases: heart disease, cancer, chronic lower respiratory disease, and stroke. These outcomes are driven in part by smoking, obesity, and food insecurity, all of which are higher in the Mountain Health Service Area. Food insecurity in particular is a primary driver of health status, and is reflective of a variety of social factors including employment, income, and transportation, among others.
Mountain Health Network has implemented targeted interventions to promote healthy living and reduce chronic disease risk factors among residents. Many of these interventions are targeted towards youth to promote upstream prevention strategies. Other interventions, including support of Huntington’s Kitchen and FaithHealth Appalachia, promote community-wide initiatives to make it easier for people to live healthy lives.

Addressing underlying social determinants of health is key to improving health outcomes and eliminating social disparities
The median age of people living in the Mountain Health Service Area (43.0) is older than the national median (38.3), indicating proportionately more older adults and fewer youth. Older adults face a growing number of challenges related to health and well-being as they age, including vulnerability to chronic disease, social isolation, and disability. Older adults across West Virginia, Kentucky, and Ohio are disproportionately impacted by chronic disease with as many as 43% managing four or more conditions compared to 38% of older adults nationally. More older adults in the region live alone, contributing to social isolation and potentially exacerbating health conditions.
To support the needs of seniors, Mountain Health established dedicated health care and support services, including the Senior Services Department and SeniorWise at CHH. SeniorWise is a free membership program that includes free or discounted health screenings, educational opportunities, and smoking cessation classes, among others. Seniors in Motion is a complimentary program available at SMMC, offering free low-impact exercise classes.
Perhaps of greatest concern, regardless of sharing the same community, not all residents share in the same opportunities for optimal health and wellness. Socioeconomic disadvantages, an aging community, increased behavioral health needs, and limited specialty providers contribute to wide health disparities for many residents. Neighboring counties within the region experience premature death rates per 100,000 that range from 7,957 (Putnam, WV) to 15,682 (Logan, WV). More than half of children living within the primary service area zip codes of 25506, Branchland; 25523, Hamlin; 25703, Huntington; and 25570, Wayne experience poverty.
With a community level view of data, we can see more clearly the areas and populations on which to focus health improvement efforts. Residents in the counties of Johnson, KY; Lawrence, KY; Martin, KY; Gallia, OH; Scioto, OH; Cabell, WV; Logan, WV; Mingo, WV; and Wayne, WV; experience more socioeconomic challenges that consistently carry through to health measures. Individuals and families in these communities experience higher chronic disease and risk factors, more behavioral health needs, poorer birth outcomes, and lower life expectancy.
Addressing underlying social determinants of health is key to improving health outcomes and eliminating social disparities. Healthy People 2020 defines social determinants of health as conditions in the environments in which people are born, live, learn, work, play, worship, and age that affect a wide range of health, function, and quality of life outcomes and risks. Social determinants of health include wideranging factors, such as economic stability, neighborhood and physical environment, education, food, community and social context, and health care.

To work toward health equity and forward our commitment to the well-being of our region, it is imperative to prioritize resources and activities toward the most pressing and crosscutting health needs impacting residents. In determining the issues on which to focus efforts over the next three-year cycle, Mountain Health solicited input from community stakeholders. A summary of the process for identifying priority health needs is included on page 108 of this report.
Using feedback from stakeholders and taking into account the hospitals’ expertise and resources, Mountain Health will focus efforts on behavioral health and substance use disorder, including Neonatal Abstinence Syndrome, and chronic disease prevention and management, with a focus on diabetes, heart disease, and tobacco use/lung disease. Access to care and eliminating health disparities will continue to be cross-cutting strategies for the health system.
The Mountain Health 2019 CHNA Final Report and Implementation Plan were reviewed and approved by the Mountain Health Network, Cabell Huntingtin Hospital and St. Mary’s Medical Center Boards of Directors in September 2019. The report and plan are available for review and comment at: cabellhuntington.org, st-marys.org and mountainhealthnetwork.org.
For purposes of 2019-2022 CHNA, Mountain Health focused on the combined primary and secondary service areas of CHH and SMMC. The service area is comprised of 23 counties spanning Kentucky, Ohio, and West Virginia that account for 95% of patients served by both medical facilities.
Mountain Health Network further defined primary service area zip codes based on inpatient volumes for both CHH and SMMC. The service area includes 48 zip codes in and around Huntington, West Virginia, the location of both medical facilities.
Mountain Health Network Service Area

The median age of Mountain Health service area residents is nearly five years older than the national median
Health Network Service Area Demographic Data Analysis
Social determinants of health, they are defined as factors within the environment in which people live, work, and play that can affect health and quality of life.
Analyses of demographic and socioeconomic data are essential in understanding health trends and determining key drivers of health status. Socioeconomic indicators play a significant role in community and individual health. Known as social determinants of health they are defined as factors within the environment in which people live, work, and play that can affect health and quality of life. Social determinants of health are often the root causes of health disparities Healthy People 2020 defines a health disparity as “a particular type of health difference that is closely linked with social, economic, or environmental disadvantage.” All reported demographic and socioeconomic data were provided by ESRI Business Analyst, 2018 and the US Census Bureau, unless otherwise noted.
Population Trends
The 2018 population of the Mountain Health Service Area is 1,062,424. The population decreased 0.3% from the 2010 Census, and is projected to decrease an additional 1.5% through 2023. The demographic shift is contrary to the Tri-State area and the nation. The nation’s population is projected to grow 4.2% by 2023. Of the three states, Kentucky is projected to experience the greatest growth (2.6%), followed by Ohio (1.2%), and West Virginia (0.7%).
The 2018 population of the Mountain Health Service Area is 1,062,424 The population decreased 0.3% from the 2010 Census, and is projected to decrease an additional 1.5% through 2023. The demographic shift is contrary to the Tri-State area and the nation. The nation’s population is projected to grow 4.2% by 2023. Of the three states, Kentucky is projected to experience the greatest growth (2.6%), followed by Ohio (1.2%), and West Virginia (0.7%).
The Mountain Health Service Area is anticipated to become slightly more diverse by 2023, consistent with West Virginia, Kentucky, and Ohio in general. The region will still be less diverse than the nation. The Mountain Health Service Area will be more than 90% White, compared to 68.2% White nationwide in 2023.
Analyses of demographic and socioeconomic data are essential in understanding health trends and determining key drivers of health status. Socioeconomic indicators play a significant role in community and individual health. Known as social determinants of health, they are defined as factors within the environment in which people live, work, and play that can affect health and quality of life. Social determinants of health are often the root causes of health disparities. Healthy People 2020 defines a health disparity as “a particular type of health difference that is closely linked with social, economic, or environmental disadvantage.” All reported demographic and socioeconomic data were provided by ESRI Business Analyst, 2018 and the US Census
The population of the Mountain Health Service Area is different than the nation as a whole. People residing in the service area are predominantly White (93.4%), and are significantly less likely than other Americans to speak a language other than English at home (1.7% in the 23-county region versus 21.3% in the US).
*Data
The population of the Mountain Health Service Area is different than the nation as a whole. People residing in the service area are predominantly White (93.4%), and are significantly less likely than other Americans to speak a language other than English at home (1.7% in the 23-county region versus 21.3% in the US).
2018 Population Overview
White Black or African American Asian Hispanic or Latino (any
Residents living in the Mountain Health Service Area and across West Virginia, Kentucky, and Ohio are more likely to be age 55 or older than residents in the US overall. There are also fewer residents under the age of 25 in the Mountain Health Service Area and all three states than in the US. This difference is reflected in the higher median age in all three states as well as the Mountain Health Service Area (43.0) versus the US (38.3).
More than 1 in 4 children in the service area live in poverty, higher than benchmark states and the nation
West Virginia, Kentucky, and Ohio each have a lower median household income than the US overall. The Mountain Health Service Area has a lower median household income ($42,954) than all three states and the nation ($58,100). People in West Virginia, Kentucky, and Ohio are more likely to live in poverty than the typical American. In the Mountain Health Service Area, more than 1 in 4 children are currently living in poverty, more than the nation, and more than each of the three surrounding states.
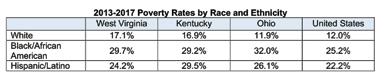
When stratified by race, people of color living in West Virginia, Kentucky, and Ohio are more likely to experience poverty than Whites living in those states. People of color living in Ohio experience the greatest poverty disparity
Workers living in West Virginia, Kentucky, and Ohio are slightly more likely than their peers throughout the nation to be blue collar workers. The overall percent unemployed is consistent across the Tri-State area and similar to the nation, but higher for people of color, particularly Blacks/African Americans.
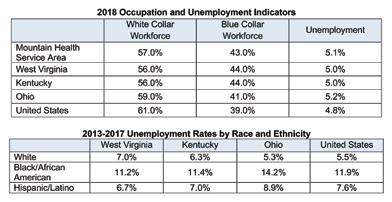
The employment to population ratio measures the employed workforce in comparison to the total workforce population. The ratio is an indicator of workforce participation. West Virginia has the lowest employment to population ratio in the nation, suggesting a discrepancy between the available skill sets among working age people living in the area and the skills needed in the industries available. The opioid epidemic has played a role in hurting the West Virginia workforce. Other contributing factors are overall health and disability.
The employment to population ratio measures the employed workforce in comparison to the total workforce population. The ratio is an indicator of workforce participation. West Virginia has the lowest employment to population ratio in the nation suggesting a discrepancy between the available skill sets among working age people living in the area and the skills needed in the industries available. The opioid epidemic has played a role in hurting the West Virginia workforce. Other contributing factors are overall health and disability.
Education is a strong predictor of income security and positive health outcomes. People living in the Mountain Health Service Area are less likely to have a bachelor’s degree or higher than others in the surrounding states and the nation. A higher percentage of residents either do not complete high school or conclude their education with a high school diploma.
The median home value in West Virginia, Kentucky, and Ohio is lower than the national median. In the Mountain Health Service Area, the median home value ($105,212) is less than half of the national median ($218,492). Residents in the service area are more likely to own their home than the nation or three surrounding states, and are less likely to be cost burdened by their home than their peers.
When stratified by race, people of color living in West Virginia, Kentucky, and Ohio are less likely to attain higher education than Whites living in those states. People of color living in Ohio experience the greatest education disparity in comparison to Whites.

The Mountain Health service area unemployment rate is about 5%, consistent with the nation
Mountain Health Network Service Area County and Zip Code Analysis
Where we live matters in determining health and longevity, and one of the most important predictors of health outcomes and disparity. The Community Need Index (CNI) was developed by Dignity Health and Truven Health Analytics to illustrate the potential for health disparity based on where people live. The CNI scores geographies on a scale of 1.0 (low need) to 5.0 (high need) based on data indicators for five socioeconomic barriers:
• Income: Poverty among elderly households, families with children, and single female-headed families with children
• Culture/Language: Minority populations and English language barriers
• Education: Population over 25 years without a high school diploma
• Insurance coverage: Unemployment rate among population 16 years or over and population without health insurance
• Housing status: Householders renting their home
Mountain Health Network Service Area counties are colorcoded by CNI score in the map below. Scores are highest for counties in eastern Kentucky, southern West Virginia, and Gallia and Scioto counties in Ohio. Detailed CNI score data are provided in the tables that follow.
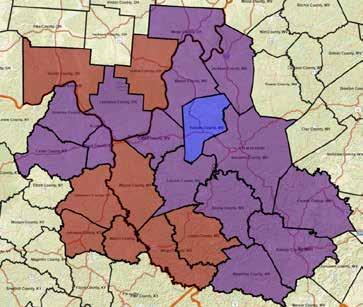
The following tables list the social determinants of health contributing to county CNI scores. Social determinant of health indicators are shown for all 23 service area counties. Counties are presented in descending order by CNI score. Cells that are more than 2% points higher than the average county percentage are highlighted in yellow to demonstrate areas of socioeconomic disparity. Note: The 2% point difference is intended to compare measures and may not represent statistical significance.
Social Determinants
The following tables list the social determinants of health contributing to county CNI scores. Social determinant of health indicators are shown for all 23 service area counties Counties are presented in descending order by CNI score Cells that are more than 2% points higher than the average county percentage are highlighted in yellow to demonstrate areas of socioeconomic disparity. Note: The 2% point difference is intended to compare measures and may not represent statistical significance.
Social Determinants and Health Indicators
The following tables list social determinants of health indicators for all 48 Mountain Health primary service area zip codes. Zip codes are presented in descending order by CNI score to allow Mountain Health to focus its health improvement efforts where it can have the greatest impact. Cells that are more than 2% points higher than the Mountain Health Service Area average percentage are highlighted in yellow to demonstrate areas of socioeconomic disparity. Note: The 2% point difference is intended to compare measures and may not represent statistical significance.
Social Determinants and Health Indicators
The following tables list social determinants of health indicators for all 48 Mountain Health primary service area zip codes Zip codes are presented in descending order by CNI score to allow Mountain Health to focus its health improvement efforts where it can have the greatest impact. Cells that are more than 2% points higher than the Mountain Health Service Area average percentage are highlighted in yellow to demonstrate areas of socioeconomic disparity. Note: The 2% point difference is intended to compare measures and may not represent statistical significance.
Social Determinants of Health by Primary Service Area Zip Code HHs in Poverty HHs Receiving Food Stamps/ SNAP Children in Poverty Language Other than English Spoken at Home Unempoyment Less than HS Diploma Without Health Insurance CNI Score
3.8 25661, Williamson, WV 26.0% 31.2% 48.2% 0.8% .2% 18.7% 4.2% 3.8
Huntington, WV 28.0% 19.3% 36.9% 3.6% 4.5% 10.5% 8.4% 3.6 25512, East Lynn, WV 31.0% 34.6% 6.0% 0.0% 13.6% 28.7% 6.7% 3.6 41230, Louisa, KY 24.9% 24.2% 28.4% 1.7% 3.9% 19.2% 10.6% 3.6
Ashland, KY 25.2% 22.9% 36.4% 2.0% 8.3% 9.4% 9.0% 3.6 25601, Logan, WV 21.7% 26.3% 22.9% 3.1% 5.5% 22.2% 9.1% 3.6 25801, Beckley, WV 18.0% 21.0% 25.6% 3.4% 3.3% 13.9% 9.0% 3.6
Social Determinants continued
Harts,
Genoa, WV 98.5% 0.1%
Health indicators were analyzed for a number of health issues, including: access to care, health behaviors and outcomes, chronic disease prevalence and mortality, behavioral health and substance use disorder, and maternal and child health. Data were compiled from secondary sources including state health departments, the Centers for Disease Control and Prevention (CDC), the Behavioral Risk Factor Surveillance System (BRFSS), and the County Health Rankings & Roadmaps program, a collaboration between the Robert Wood Johnson Foundation and the University of Wisconsin, among other sources. A comprehensive list of data sources is provided in Appendix A.
Health data focus on regional and county-level reporting, which is generally the most recent and most consistent data available. Health data for the counties are compared to state and national averages and Healthy People 2020 (HP 2020) goals, where applicable, to provide benchmark comparisons. Healthy People is a US Department of Health and Human Services health promotion and disease prevention initiative that sets science-based, 10-year national objectives for improving the health of all Americans.
Age-adjusted rates are referenced throughout the report to depict a comparable burden of disease among residents. Age-adjusted rates are summary measures adjusted for differences in age distributions so that data from one year to another, or between one geographic area and another, can be compared as if the communities reflected the same age distribution.
The BRFSS is a telephone survey of residents 18 years of age or older conducted nationally by states as required by the CDC. A consistent survey tool is used across the US to assess health risk behaviors, prevalence of chronic health conditions, access to care, and preventive health measures, among other health indicators.
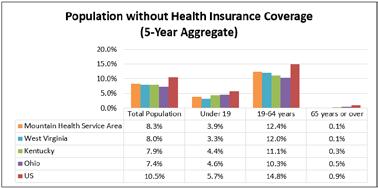
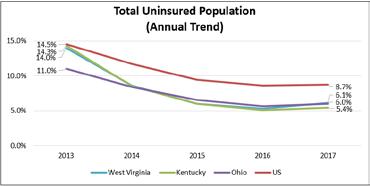
The percentage of uninsured residents is declining in all three states and lower than the nation
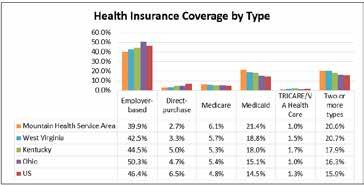
Health insurance coverage is an essential component enabling people to access health care. More than 90% of all people living in the Mountain Health Service Area have health insurance, similar to the three-state area, and higher than the nation.
The percentage of uninsured residents is declining in all three states and lower than the nation
Mountain Health Service Area residents are more likely to have Medicaid insurance coverage
Access to Health Care
Health insurance coverage is an essential component enabling people to access health care. More than 90% of all people living in the Mountain Health Service Area have health insurance, similar to the three-state area, and higher than the nation.
West Virginia, Kentucky, and Ohio, overall have fewer uninsured residents than the nation for people of all ages. In addition, the percent of uninsured in all three states is continuing to decline, indicating that even more people in this area are able to access health care. All three states expanded Medicaid under the Affordable Care Act, contributing to declining uninsured rates.
care All three states expanded Medicaid under the Affordable Care Act, contributing to declining uninsured rates.
West Virginia, Kentucky and Ohio overall have fewer uninsured residents than the nation for people of all ages. In addition, the percent of uninsured in all three states is continuing to decline, indicating that even more people in this area are able to access health care All three states expanded Medicaid under the Affordable Care Act, contributing to declining uninsured rates.

Source of Health Insurance
Source: US Census Bureau 2013-2017
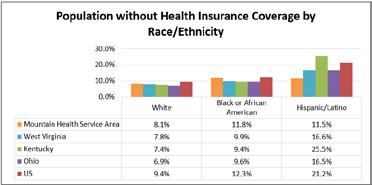
Race and Health Insurance
When stratified by race, White people are more likely to be insured. Across the service area, Black/African American and Hispanic/Latino people have a similar uninsured rate. Across the Tri-State area, Hispanic/Latinos have a higher uninsured rate than any other demographic, with the highest in Kentucky, impacting 1 in 4 residents.
When stratified by race, White people are more likely to be insured. Across the service area, Black/African American and Hispanic/Latino people have a similar uninsured rate. Across the Tri-State area, Hispanic/Latinos have a higher uninsured rate than any other demographic, with the highest in Kentucky, impacting 1 in 4 residents.
Blacks/African Americans and Hispanics/Latinos in the Mountain Health Service Area have a similar uninsured rate that is higher than the rate for Whites
Source of Health Insurance
Mountain Health Service Area residents are more likely to have Medicaid as their source of health insurance than their peers in the surrounding states and the nation. Approximately 40% of Mountain Health Service Area residents have employer-based health insurance coverage, lower than the national benchmark.
Mountain Health Service Area residents are more likely to have Medicaid as their source of health insurance than their peers in the surrounding states and the nation. Approximately 40% of Mountain Health Service Area residents have employer-based health insurance coverage lower than the national benchmark
Source: US Census Bureau,

Source: US Census Bureau, 2013-2017
Source: US Census Bureau 2013-2017
Source: US Census
Source of Health Insurance
Mountain Health Service Area residents are more likely to have Medicaid as their source of health insurance than their peers in the surrounding states and the nation. Approximately 40% of Mountain Health Service Area residents have employer-based health insurance coverage, lower than the national benchmark
Source: US Census Bureau 2013-2017 Mountain Health Service Area residents are more likely to have Medicaid insurance coverage
Source: US Census Bureau, 2013-2017
Source: US Census Bureau 2013-2017
Mountain Health Service Area residents are more likely to have Medicaid insurance coverage
Residents of the Mountain Health Service Area have better
access to primary care physicians than the nation overall, but lower access to dentists and mental health providers
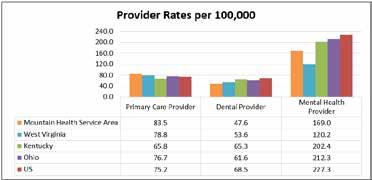
Another significant factor in ensuring access to care is the number of health care providers available in the area. As reported by the Health Resources & Services Administration and shown in the graph below, there are more primary care physicians per 100,000 population in the Mountain Health Service Area than in West Virginia, Kentucky, Ohio, and the US. This finding indicates that there are proportionately more primary care physicians available to serve the residents of the Mountain Health Service Area than most other places in the nation.
There are fewer dentists and mental health providers per 100,000 people in the Mountain Health Service Area than the nation overall. Lack of dental and mental health providers in the service area is a barrier for individuals accessing these services.
The Health Resources & Services Administration (HRSA) is responsible for designating Health Professional Shortage Areas (HPSAs). Shortage areas are determined based on a defined ratio of total health professionals to total population. All Mountain Health Service Area counties except Putnam have at least one designated HPSA. The table below identifies shortage areas by county. Shortage areas with particularly high need or only impacting low-income populations are noted.
Health Resources & Services Administration (HRSA) is responsible for
Shortage Areas (HPSAs). Shortage areas are determined based on a
West Virginia residents are more likely to report “poor” or “fair” health status and have the highest premature death rate
2019 CHNA Report DRAFT FOR REVIEW August 2019
Overall Health Status and Health Behaviors
Overall Health Status and Health Behaviors
County rankings for health outcomes are shown below, as reported by the 2018 County Health Rankings & Roadmaps program. Health outcomes are measured in relation to premature death (before age 75) and quality of life. Counties within the Mountain Health Service Area with the highest and lowest rankings in the three states are shown.
County rankings for health outcomes are shown below, as reported by the 2018 County Health Rankings & Roadmaps program. Health outcomes are measured in relation to premature death (before age 75) and quality of life. Counties within the Mountain Health Service Area with the highest and lowest rankings in the three states are shown
While medical care can treat disease and prolong life, longevity comes from healthy communities and healthy lifestyle choices. Residents of West Virginia, Kentucky, and Ohio report more poor physical and mental health days than most Americans. Residents of these three states are also more likely to describe their overall health as “poor” or “fair” than most Americans.
2019 County Health Rankings Health Outcomes
ratio of total health professionals to total population. All Mountain Health Service Area counties except Putnam have at least one designated HPSA. The table below identifies shortage areas by county. Shortage areas with particularly high need or only impacting low-income populations are noted.
Federally Qualified Health Centers (FQHCs) are defined as “community-based health care providers receiving funds from the HRSA Health Center Program to provide primary care services in underserved areas.” Services are provided on sliding fee scale based on patient ability to pay. FQHCs are critical to serving the health care needs of medically underserved populations. FQHCs within the primary service area zip codes are listed in Appendix D
Federally Qualified Health Centers (FQHCs) are defined as “community-based health care providers receiving funds from the HRSA Health Center Program to provide primary care services in underserved areas.” Services are provided on a sliding fee scale based on patient ability to pay. FQHCs are critical to serving the health care needs of medically underserved populations. FQHCs within the primary service area zip codes are listed in Appendix D.
Health Professional Shortage Areas by Discipline and Affected Population
County Primary Care Dental Health Mental Health
Boone County, WV HPSA (low-income pop.) HPSA (low-income pop.) HPSA (low-income pop.)
Cabell County, WV HPSA (low-income pop.) HPSA (low-income pop.) HPSA (low-income pop.)
Fayette County, WV HPSA (low-income pop.) HPSA (low-income pop.) HPSA (low-income pop.)
Jackson County, WV HPSA (all residents) HPSA (low-income pop.) HPSA (low-income pop.)
Kanawha County, WV HPSA (low-income pop.) HPSA (low-income pop.) HPSA (low-income pop.)
Lincoln County, WV HPSA (low-income pop.) HPSA (high need area) HPSA (low-income pop.)
Logan County, WV HPSA (low-income pop.) HPSA (low-income pop.) HPSA (high need area)
Mason County WV HPSA (low-income pop.) HPSA (low-income pop.) HPSA (all residents)
Mingo County, WV HPSA (low-income pop.) HPSA (high need area) HPSA (high need area)
Raleigh County, WV HPSA (low-income pop.) HPSA (low-income pop.)
Wayne County, WV HPSA (low-income pop.) HPSA (low-income pop.)
Wyoming County, WV HPSA (high need area) HPSA (low-income pop.) HPSA (high need area)
Boyd County, KY HPSA (low-income pop.) HPSA (low-income pop.) HPSA (low-income pop.)
Carter County, KY HPSA (low-income pop.) HPSA (low-income pop.) HPSA (low-income pop.)
Greenup County, KY HPSA (low-income pop.) HPSA (low-income pop.)
Johnson County, KY HPSA (high need area)
Lawrence County, KY HPSA (high need area)* HPSA (low-income pop.) HPSA (low-income pop.) Martin County, KY HPSA (high need area) HPSA (high need area)
County, OH HPSA (low-income pop.) HPSA (high
West Virginia (55 counties total)
Best Ranking: #3 Putnam County
Worst Ranking: #54 Mingo County
Kentucky (120 counties total)
Best Ranking: #37 Greenup County
Worst Ranking: #109 Martin County
Ohio (88 counties total)
Best Ranking: #83 Lawrence County
Worst Ranking: #86 Gallia County
While medical care can treat disease and prolong life, longevity comes from healthy communities and healthy lifestyle choices. Residents of West Virginia, Kentucky, and Ohio report more poor physical and mental health days than most Americans. Residents of these three states are also more likely to describe their overall health as “poor” or “fair” than most Americans. Quality of Life Indicators
Source: Centers for Disease Control and Prevention, 2016
Virginia residents are more likely to report “poor” or “fair” health status and have the highest premature death rate
Residents of West Virginia, Kentucky, and Ohio are less likely to live as long as other Americans, as evidenced by higher premature death rates. Within the Mountain Health Service Area, all counties also have premature death rates that are higher than the nation. The 10 counties with the highest premature death rate are shown in the table below.
Consistent with the 2016 CHNA, Logan and Mingo counties have the highest premature death rate in the Mountain Health Service Area; Cabell County, the home county of Mountain Health, is ranked 3rd
Logan County, Mingo County, and Cabell County, all in West Virginia, have premature death rates more than two times higher than the national rate.
The premature death rate in Cabell County, the home county of Mountain Health increased from a rate of 9,938 (2016 CHNA) to 14,699.
Residents of West Virginia, Kentucky, and Ohio are less likely to live as long as other Americans, as evidenced by higher premature death rates. Within the Mountain Health Service Area, all counties also have premature death rates that are higher than the nation. The 10 counties with the highest premature death rate are shown in the table below.
Logan County, Mingo County, and Cabell County, all in West Virginia, have premature death rates more than two times higher than the national rate. The premature death rate in Cabell County, the home county of Mountain Health, increased from a rate of 9,938 (2016 CHNA) to 14,699.
Logan County, WV 15 682
Mingo County, WV 14 858
Cabell County, WV 14 699
Wyoming County, WV 13 639
Martin County, KY 13 604
Lincoln County, WV 12 944
Boone County, WV 12 793
Raleigh County, WV 12 774
Fayette County, WV 12 764
County, KY 12
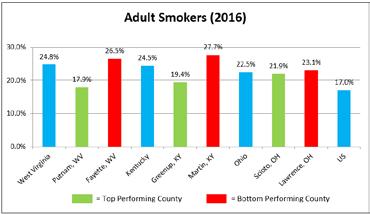
disease, cancer, and other chronic diseases. Healthy People 2020 set a target of no more than 12% of adults reporting smoking. In West Virginia and Kentucky, 1 in 4 adults report smoking, more than double the Healthy People 2020 target. At 21%, Ohio fares only slightly better in this category.
and HP 2020 targets
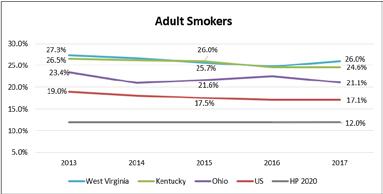
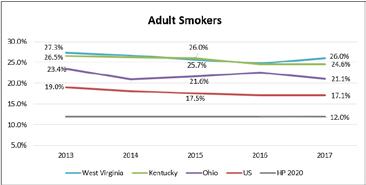
The percentage of adult smokers is generally decreasing in KY and OH, but stagnant in WV.
All state percentages exceed national and Healthy People 2020 targets
Health Behaviors
Individual health behaviors include risky behaviors like smoking and obesity, or positive behaviors like exercise, good nutrition, and stress management. Health behaviors may increase or reduce the likelihood of disease or early death. The prevalence of these health behaviors is provided below, with benchmark comparisons, as available.
Source: Centers for Disease Control and Prevention, 2013-2017
Individual health behaviors include risky behaviors like smoking and obesity, or positive behaviors like exercise, good nutrition, and stress management. Health behaviors may increase or reduce the likelihood of disease or early death. The prevalence of these health behaviors is provided below, with benchmark comparisons, as available.
Smoking
Smoking is a significant contributor to increased risk for heart disease, cancer, and other chronic diseases. Healthy People 2020 set a target of no more than 12% of adults reporting smoking. In West Virginia and Kentucky, 1 in 4 adults report smoking, more than double the Healthy People 2020 target. At 21%, Ohio fares only slightly better in this category.
Smoking is a significant contributor to increased risk for heart disease, cancer, and other chronic diseases. Healthy People 2020 set a target of no more than 12% of adults reporting smoking. In West Virginia and Kentucky, 1 in 4 adults report smoking, more than double the Healthy People 2020 target. At 21%, Ohio fares only slightly better in this category.
When broken down by county within the Mountain Health Service Area, there is large variability in the percent of adult smokers, but all of the counties have more adult smokers than the nation, and all have a long way to go to meet the Healthy People 2020 12% target.
County-level adult smoking rates are most ecent for 2016. When broken down by county within the Mountain Health Service Area here is large variability in the percent of adult smokers but all of the counties have more adult smokers than the nation, and all have a long way to go to meet the Healthy People 2020 12% target
The percentage of adult smokers is generally decreasing in KY and OH, but stagnant in WV. All state percentages exceed national and HP 2020 targets
Source: National Center for Health Statistics, 2015-2017
Source: National Center for Health Statistics, 2015-2017
Source: Centers for Disease Control and Prevention 2013-2017
Source: Centers for Disease Control and Prevention, 2013-2017
Source: Centers for Disease Control and Prevention, 2016
Source: Centers for Disease Control and Prevention, 2016
County-level adult smoking rates are most recent for 2016. When broken down by county within the Mountain Health Service Area, there is large variability in the percent of adult smokers, but all of the counties have more adult smokers than the nation, and all have a long way to go to meet the Healthy People 2020 12% target.


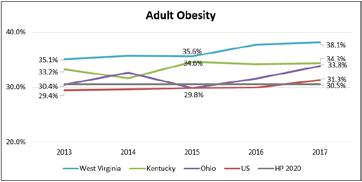
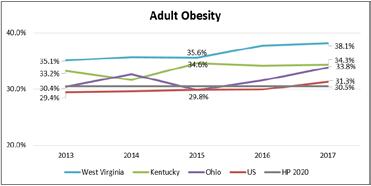
all adults being obese. Obesity has increased across the nation and slightly exceeds that Healthy People 2020 goal. Adult obesity in West Virginia (38.1%), Kentucky (34.3%), and Ohio (33.8%) exceeds both national and Healthy People 2020 targets. Obesity increased in West Virginia and Ohio and remained stagnant in Kentucky.
One-third or more of adults in all three states are obese, more than the nation
Obesity
Healthy People 2020 set the goal of having no more than 30.5% of all adults being obese. Obesity has increased across the nation and slightly exceeds that Healthy People 2020 goal. Adult obesity in West Virginia (38.1%), Kentucky (34.3%), and Ohio (33.8%) exceeds both national and Healthy People 2020 targets. Obesity increased in West Virginia and Ohio and remained stagnant in Kentucky.
Healthy People 2020 set the goal of having no more than 30.5% of all adults being obese. Obesity has increased across the nation and slightly exceeds that Healthy People 2020 goal. Adult obesity in West Virginia (38.1%), Kentucky (34.3%), and Ohio (33.8%) exceeds both national and Healthy People 2020 targets. Obesity increased in West Virginia and Ohio and remained stagnant in Kentucky.
Source: Centers for Disease Control and Prevention 2013-2017
One-third or more of adults in all 3 states are obese, more than the nation
Source: Centers for Disease Control and Prevention 2013-2017
Source: Centers for Disease Control and Prevention, 2013-2017
Consistent with the 2016 CHNA, Cabell County, WV and Gallia County, OH are he top performing service counties within their respective states
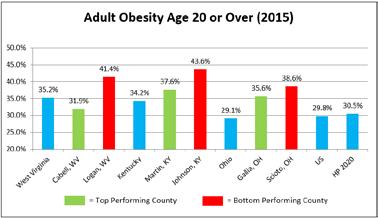
County-level adult obesity rates are most recent for 2015. When broken down by county within the Mountain Health Service Area, all counties have more obese adults than the nation. Consistent with the 2016 CHNA, Cabell County, WV and Gallia County, OH are the top performing service counties within their respective states.
County-level adult obesity rates are most recent for 2015. When broken down by county within the Mountain Health Service Area, all counties have more obese adults than the nation.
Consistent with the 2016 CHNA, Cabell County, WV and Gallia County, OH are he top performing service counties within their respective states

Source: Centers for Disease Control and Prevention 2015 *County level data are only available through 2015.
County-level adult obesity rates are most recent for 2015. When broken down by county within the Mountain Health Service Area all counties have more obese adults than the nation.
Source: Centers for Disease Control and Prevention, 2015 *County level data are only available through 2015.
Health Network
In Kentucky, Boyd County residents have the greatest access to physical activity and the lowest percentage of physically inactive adults. Conversely, Carter County residents have the lowest access to physical activity and the highest percentage of physically inactive adults.
In Kentucky, Boyd County residents have the greatest access to physical activity and the lowest percentage of physically inactive adults. Conversely, Carter County residents have the lowest access to physical activity and the highest percentage of physically inactive adults.
Access to free and reduced lunch for low-income school children can help reduce food insecurity for households with children. Eligibility for free lunch includes households with an income at or below 130% of the poverty threshold, while eligibility for reduced price lunch includes households with an income between 130% and 185% of the poverty threshold.
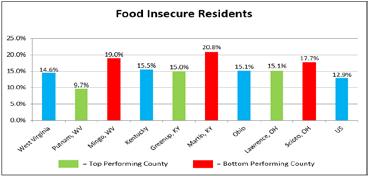
15% of residents across all three states are food insecure; the percentage in “bottom performing” counties is approximately 20%
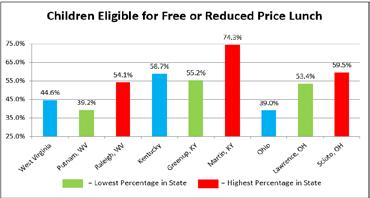
Martin County, KY has the highest rate of food insecurity and the highest percentage of children eligible for free or reduced price lunch
School Lunches
Access to free and reduced lunch for low-income school
Nearly half of children in West Virginia and more than half of children in Kentucky are eligible for free and reduced price lunch. While Ohio has fewer eligible children for this benefit, 2 out of 5 children are still at 185% of the federal poverty level or below.
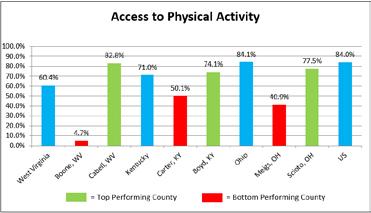
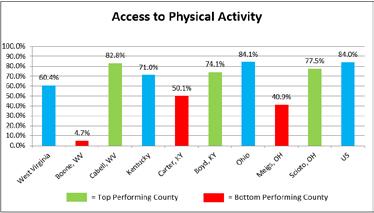
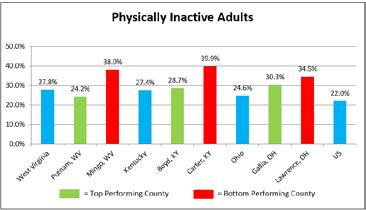
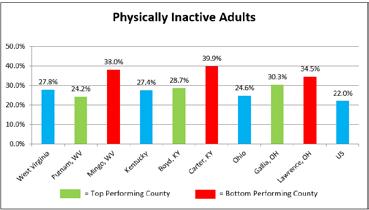
Residents of KY and WV have lower access to physical activity options, and a higher percentage of physically inactive adults
children can help reduce food insecurity for households with children. Eligibility for free lunch includes households with an income at or below 130% of the poverty threshold, while eligibility for reduced price lunch includes households with an income between 130% and 185% of the poverty threshold.
Martin County, KY has the highest rate of food insecurity and the highest percentage of children eligible for free or reduced price lunch
Food insecurity, defined as being without a consistent source of sufficient and affordable nutritious food, negatively impacts the opportunity for healthy eating and healthy weight management. Food insecurity is reflective of a variety of social factors including employment, income, access to healthy food options, transportation, housing, and other factors. People living in West Virginia, Kentucky, and Ohio are more likely to be food insecure than the typical American. Among the bottom performing service counties in each of these states, nearly 1 in 5 residents are food insecure.
Nearly half of children in West Virginia and more than half of children in Kentucky are eligible for free and reduced price lunch. While Ohio has fewer eligible children for this benefit, 2 out of 5 children are still at 185% of the federal poverty level or below.
Source: National Center for Education Statistics, 2016-2017
Source: National Center for Education Statistics, 2016-2017
Children Eligible
Among the bottom performing service counties in each of these states, nearly 1 in 5 residents are food insecure.
Source: Feeding America, 2016
Access to free and reduced lunch for low-income school children can help reduce food insecurity for households with children. Eligibility for free lunch includes households with an income at or below 130% of the poverty threshold, while eligibility for reduced price lunch includes households with an income between 130% and 185% of the poverty threshold. Nearly half of children in West Virginia and more than half of children in Kentucky are eligible for free and reduced price lunch. While Ohio has fewer eligible children for this benefit, 2 out of 5 children are still at 185% of the federal poverty level or below.
Martin County, KY has the highest rate of food insecurity and the highest percentage of children eligible for free or reduced price lunch in the Mountain Health Service Area. Martin County Schools has supported programs to provide meals to all students at no charge and the Summer Food Service Program to provide meals at daily sites across the county. Across KY, OH, and WV similar Food Service Programs are offered during the summer months including Cabell County Schools Food Service Department’s summer food program with 42 locations at schools, libraries, summer camps, churches and community centers.
Source: National Center for Education Statistics, 2016-2017
When reviewed at the county level, more than half of all children in nearly all Mountain Health service counties qualify for free or reduced price lunch. While this means that more than half of all children are able to access food at school, it also suggests there are barriers such as income to ensuring access to a healthy diet.
Martin County, KY has the highest rate of food insecurity and the highest percentage of children eligible for free or reduced price lunch in the Mountain Health Service Area. Martin County Schools has supported programs to provide meals to all students at no charge, and the Summer Food Service Program to provide meals at daily sites across the county. Across KY, OH, and WV similar Food Service Programs are offered during the summer months, including Cabell County Schools’ Food Service Department’s summer food program with 42 locations at schools, libraries, summer camps, churches, and community centers.
Martin County, KY has the highest rate of food insecurity and the highest percentage of children eligible for free or reduced price lunch in the Mountain Health Service Area. Martin County Schools has supported programs to provide meals to all students at no charge and the Summer Food Service Program to provide meals at daily sites across the county. Across KY, OH, and WV similar Food Service Programs are offered during the summer months, including Cabell County Schools Food Service Department’s summer food program with 42 locations at schools, libraries, summer camps, churches, and community centers
When reviewed at the county level, more than half of all children in nearly all Mountain Health service counties qualify for free or reduced price lunch. While this means that more than half of all children are able to access food at school, it also suggests there are barriers such as income to ensuring access to a healthy diet.
When reviewed at the county level more than half of all children in nearly all Mountain Health service counties qualify for free or reduced price lunch. While this means that more than half of all children are able to access food at school, it also suggests there are barriers such as income to ensuring access to a healthy diet
Source: National Center for Educati
Source: National Center for Education Statistics, 2016-2017
Physical Inactivity
Compared to the US residents of West Virginia, Kentucky, and Ohio are less likely to have access to physical activity and/or are more likely to be physically inactive as adults. Individuals are considered to have access to physical activity if they reside in a census block that is within a half mile of a park, or reside in an urban census block that is within one mile o a recreational facility, or reside in a rural census block that is within three miles of a recreational facility.
Compared to the US, residents of West Virginia, Kentucky, and Ohio are less likely to have access to physical activity and/or are more likely to be physically inactive as adults. Individuals are considered to have access to physical activity if they reside in a census block that is within a half mile of a park, or reside in an urban census block that is within one mile of a recreational facility, or reside in a rural census block that is within three miles of a recreational facility.
Residents of KY and WV have lower access to physical activity options, and a higher percentage of physically inactive adults
In Kentucky, Boyd County residents have the greatest access to physical activity and the lowest percentage of physically inactive adults. Conversely, Carter County residents have the lowest access to physical activity and the highest percentage of physically inactive adults.
In Kentucky, Boyd County residents have he greatest access to physical activity and the lowest percentage of physically inactive adults. Conversely, Carter County residents have the lowest access to physical activity and the highest percentage of physically inactive adults.
Physical Activity
Access
Source: Business Analyst, Delorme Map Data, ESRI, & US Census Files, 2018; Centers for Disease Control and Prevention, 2015
Source: Business Analyst, Delorme Map Data, ESRI, & US Census Files, 2018
Source: Centers for Disease Control and Prevention, 2015
Americans is higher than the nation and all three states. Among Hispanic/Latinos living in the Mountain Health Service Area, the death rate is lower than for Hispanic/Latinos living in Kentucky, Ohio, and the US.
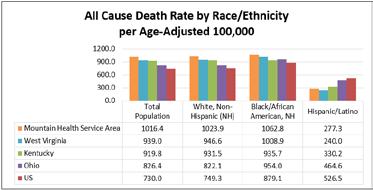
The Mountain Health Service Area has a higher overall rate of death than the Tri-State area and nation
The following graph depicts the all cause age-adjusted death rate by race and ethnicity. The age-adjusted death rate for the total population of the Mountain Health Service Area, as well as for Whites and Blacks/African Americans is higher than the nation and all three states. Among Hispanic/Latinos living in the Mountain Health Service Area, the death rate is lower than for Hispanic/Latinos living in Kentucky, Ohio, and the US.
The following graph depicts the all cause age-adjusted death rate by race and ethnicity. The age-adjusted death rate for the total population of the Mountain Health Service Area, as well as for Whites and Blacks/African Americans is higher than the nation and all three states. Among Hispanic/Latinos living in the Mountain Health Service Area, the death rate is lower than for Hispanic/Latinos living in Kentucky, Ohio, and the US.
Source: Centers for Disease Control and Prevention 2013-2017
Source: National Center for Education Statistics, 2016-2017
Source: Centers for Disease Control and Prevention 2013-2017
The Mountain Health Service Area has a higher overall rate of death than the Tri-State area and nation
are
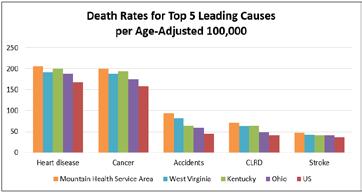
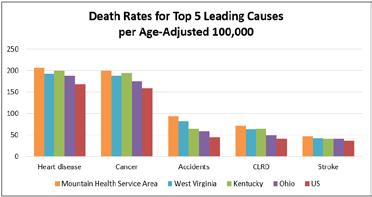
The top five causes of death in the nation and the Mountain Health Service Area based on a five-year aggregate, in rank order, are heart disease, cancer, accidents, chronic lower respiratory disease, and stroke. The Mountain Health Service Area and the states of West Virginia, Kentucky, and Ohio all have higher rates of death from the top five causes than the US in general.
Area has a higher overall rate of death than the Tri-State area and nation

rank order, are heart disease, cancer, accidents, chronic lower respiratory disease, and stroke. The Mountain Health Service Area and the states of West Virginia, Kentucky, and Ohio all have higher rates of death from the top five causes than the US in general.
The top five causes of death in the nation and the Mountain Health Service Area based on a five-year aggregate, in rank order, are heart disease, cancer, accidents, chronic lower respiratory disease, and stroke. The Mountain Health Service Area and the states of West Virginia, Kentucky, and Ohio all have higher rates of death from the top five causes than the US in general.
Source: Centers for Disease Control and Prevention, 2013-2017
Source: Centers for Disease Control and Prevention 2013-2017 The Mountain
is provided to reduce
Heart Disease and Stroke
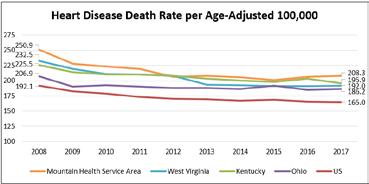
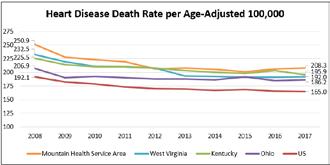
Heart disease is the leading cause of death in the nation and in the Mountain Health Service Area. The age-adjusted heart disease death rate in the Mountain Health Service Area and throughout the three-state region is higher than the national rate but declined over the past decade.
The Mountain Health service area heart disease death rate declined over the last decade, but remains higher than state and national benchmarks
Chronic Diseases
Chronic diseases such as heart disease, stroke, and diabetes account for much of the underlying causes of death and disability. Many chronic diseases can be prevented by avoiding or reducing negative health behaviors like smoking and alcohol use, and by increasing physical activity and healthy eating. Most chronic diseases are treatable if detected early, and if support is provided to reduce risk behaviors and increase health promoting behaviors.
Chronic diseases such as heart disease, stroke, and diabetes account for much of the underlying causes of death and disability. Many chronic diseases can be prevented by avoiding or reducing negative health behaviors like smoking and alcohol use, and by ncreasing physical activity and healthy eating. Most chronic diseases are treatable if detected early, and if support is provided to reduce risk behaviors and increase health promoting behaviors.
Heart Disease and Stroke
Heart disease is the leading cause of death in the nation and in the Mountain Health Service Area. The age-adjusted heart disease death rate in the Mountain Health Service Area and throughout the three-state region is higher than the national rate but declined over the past decade.
Heart disease is the leading cause of death in the nation and in the Mountain Health Service Area. The age-adjusted heart disease death rate in the Mountain Health Service Area and throughout the three-state region is higher than the national rate, but declined over the past decade.
The Mountain Health Service Area heart disease death rate declined over the last decade, but remains higher than state and national benchmarks
Source: Centers for Disease Control and Prevention 2008-2017
When stratified by race, the heart disease death rate for non-Hispanic White people throughout West Virginia, Kentucky and Ohio is higher than the national rate. Among non-Hispanic White people living in the Mountain Health Service Area the death rate due to heart disease is also higher than the US as well as the highest of any other population in the area.
Heart Disease Death Rate per Age-Adjusted 100,000 by Race and Ethnicity (Red = Higher than State and National Benchmarks)
Source: Centers for Disease Control and Prevention 2008-2017
When stratified by race, the heart disease death rate for non-Hispanic White people throughout West Virginia, Kentucky and Ohio is higher than the national rate. Among non-Hispanic White people living in the Mountain Health Service Area, the death
due
is also higher than the US as well as the highest of any other population in the area.
When stratified by race, the heart disease death rate for non-Hispanic White people throughout West Virginia, Kentucky, and Ohio is higher than the national rate. Among non-Hispanic White people living in the Mountain Health Service Area, the death rate due to heart disease is also higher than the US, as well as the highest of any other population in the area.
The following counties exceed the Mountain Health Service Area 2013-2017 heart disease death rate (205.9) by more than 10 points.
Coronary
Coronary heart disease (CHD) is characterized by the buildup of plaque inside the coronary arteries. Several types of heart disease, including CHD, are risk factors for stroke.
Source: Centers for Disease Control and Prevention 2013-2017
Coronary heart disease
Coronary heart disease (CHD) is characterized by the buildup o plaque inside the coronary arteries. Several types of heart disease, including CHD, are risk factors for stroke.
Ø Healthy People 2020 set a target for the CHD death rate at 103.4 per 100,000, which the US in general has met. West Virginia, Kentucky, and Ohio do not meet the Healthy People 2020 target for CHD, and the Mountain Health Service Area exceeds the target by almost 30 points.
All 3 states exceed the nation for death due to CHD and stroke; the Mountain Health Service Area exceeds the 3 states
Ø Healthy People 2020 set a target for stroke death rate at 34.8, which the US has not yet met. West Virginia, Kentucky, and Ohio also do not meet the Healthy People 2020 target, and exceed the national benchmark. The stroke death rate in the Mountain Health Service Area is 12 points higher than the Healthy People 2020 target Coronary
and Stroke
State and National Benchmarks
Source: Centers for Disease Control and Prevention 2013-2017
Cancer Cancer remains a leading cause of death, but if detected early, can often be effectively treated. Therefore, the incidence of cancer indicates both the detected presence of the disease in the community and an opportunity to treat the disease.
All three states have a higher cancer incidence and death rate than the nation, indicating delayed detection and treatment
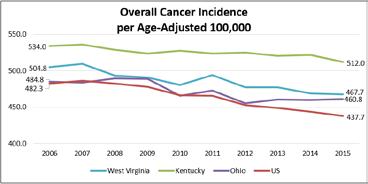
The incidence of al cancers is higher in West Virginia, Kentucky, and Ohio than the nation in general. Kentucky has the highest incidence of all cancers of any state in the region. Aggregate incidence rates for cancers are not available for the area served by Mountain Health
Coronary heart disease
Coronary heart disease (CHD) is characterized by the buildup of plaque inside the coronary arteries. Several types of heart disease, including CHD, are risk factors for stroke.
• Healthy People 2020 set a target for the CHD death rate at 103.4 per 100,000, which the US in general has met. West Virginia, Kentucky, and Ohio do not meet the Healthy People 2020 target for CHD, and the Mountain Health Service Area exceeds the target by almost 30 points.
Ø Healthy People 2020 set a target for the CHD death rate at 103.4 per 100,000, which the US in general has met. West Virginia, Kentucky and Ohio do not meet the Healthy People 2020 target for CHD, and the Mountain Health Service Area exceeds the target by almost 30 points.
• Healthy People 2020 set a target for stroke death rate at 34.8, which the US has not yet met. West Virginia, Kentucky, and Ohio also do not meet the Healthy People 2020 target, and exceed the national benchmark. The stroke death rate in the Mountain Health Service Area is 12 points higher than the Healthy People 2020 target.
The following counties exceed the Mountain Health Service Area 2013-2017 CHD death rate (131.8) by more than 10 points. Logan County, West Virginia is the only county in the service area that exceeds the Mountain Health Service Area 2013-2017 stroke death rate (46.8) by more than 10 points. The Logan County stroke death rate is 59.8, 25 points greater than the Healthy People 2020 target.
The following counties exceed the Mountain Health Service Area 2013-2017 CHD death rate 131.8 by more than 10 points. Logan County, West Virginia is the only county in the service area that exceeds the Mountain Health Service Area 2013-2017 stroke death rate (46.8) by more than 10 points. The Logan County stroke death rate is 59.8 25 points greater than the Healthy People 2020 target Counties with the
All 3 states exceed the nation for death due to CHD and stroke; the Mountain Health Service Area exceeds the 3 states
Ø Healthy People 2020 set a target for stroke death rate at 34.8, which the US has not yet met. West Virginia, Kentucky, and Ohio also do not meet the Healthy People 2020 target, and exceed the national benchmark. The stroke death rate in the Mountain Health Service Area is 12 points higher than the Healthy People 2020 target
Coronary Heart Disease and Stroke Death Rates Red = Higher than State and National Benchmarks Coronary Heart Disease
Source: Centers for Disease Control and Prevention
The following counties exceed the Mountain Health Service Area 2013-2017 CHD death rate (131.8) by more than 10 points. Logan County, West Virginia is the only county in the service area that exceeds the Mountain Health Service Area 2013-2017 stroke death rate (46.8) by more than 10 points. The Logan County stroke death rate is 59.8 25 points greater than the Healthy People 2020 target
Counties with the Highes CHD Death Rate per Age-Adjusted
Source Centers for Disease Control and Prevention 2013-2017
Cancer remains a leading cause of death, but if detected early, can often be effectively treated. Therefore, the incidence of cancer indicates both the detected presence of the disease in the community and an opportunity to treat the disease.
Cancer remains a leading cause of death, but if detected early, can often be effectively treated. Therefore, the incidence of cancer indicates both the detected presence of the disease in the community and an opportunity to treat the disease.
All 3 states have a higher cancer incidence and death rate than the nation, indicating delayed detection and treatment
Source: Centers for Disease Control and Prevention 2006-2015
When stratified by race, the incidence of cancer in Kentucky is higher than the surrounding states and the nation for people of all races. In West Virginia, the incidence of cancer is higher for non-Hispanic Whites compared to their peers in Ohio and across the nation, as well as people of other races living in West Virginia. In Ohio, the incidence of cancer is lower than neighboring states, and nearly equal among Whites and Blacks/African Americans.
When stratified by race, the incidence of cancer in Kentucky is higher than the surrounding states and the nation for people of all races. In West Virginia, the incidence of cancer is higher for non-Hispanic Whites compared to their peers in Ohio and across the nation as well as people of other races living in West Virginia. In Ohio, the incidence of cancer is lower han neighboring states, and nearly equal among Whites and Blacks/African
The incidence of all cancers is higher in West Virginia, Kentucky, and Ohio than the nation in general. Kentucky has the highest incidence of all cancers of any state in the region. Aggregate incidence rates for cancers are not available for the area served by Mountain Health
The incidence of all cancers is higher in West Virginia, Kentucky, and Ohio than the nation in general. Kentucky has the highest incidence of all cancers of any state in the region. Aggregate incidence rates for cancers are not available for the area served by Mountain Health.
Source: Centers for Disease Control and Prevention 2006-2015
When stratified by race, the incidence of cancer in Kentucky is higher than the surrounding states and the nation or people of all races. In West Virginia, the incidence of cancer is higher for non-Hispanic Whites compared to their peers in Ohio and across the nation as well as people of other races living in West Virginia. In Ohio, the incidence of cancer is lower than neighboring states, and nearly equal among Whites and Blacks/African Americans.
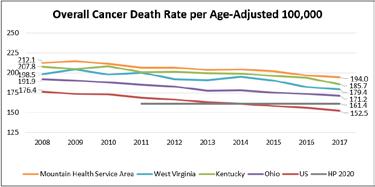
deaths per 100,000 people, which the US has met. West Virginia, Kentucky and Ohio have not yet met the national or Healthy People 2020 benchmarks. The Mountain Health Service Area is further from the Healthy People 2020 target than the three states, at more than 30 points above the 161.4 benchmark.
The Mountain Health Service Area exceeds the HP 2020 goal for cancer death by more than 30 points
The following counties exceed the Mountain Health Service Area 2013-2017
The Mountain Health service area has higher death rates than the nation
(200.2 by more than 10 points exceeding the Healthy People 2020 target by more than 50 points Counties with the Highest Cancer Death Rate per Age-Adjusted
Cancer Incidence
An aggregate cancer incidence rate for the Mountain Health Service Area is not available. Individual county incidence rates are reported below. Consistent with statewide findings, Carter and Lawrence counties in KY have the highest cancer incidence rates.
An aggregate cancer incidence rate for the Mountain Health Service Area is not available. Individual county incidence rates are reported below. Consistent with statewide findings, Carter and Lawrence counties in KY have the highest cancer incidence rates.
Cancer Target
Kentucky has the highest cancer incidence rate in the region; KY counties within the Mountain Health Service Area also have the highest incidence rate 2019 CHNA Report DRAFT FOR REVIEW August 2019
Kentucky has the highest cancer incidence rate in the region; KY counties within the Mountain Health Service Area also have the highest incidence rate
Overall Cancer Incidence per Age-Adjusted 100,000 by County in Descending Order County Incidence Rate County Incidence Rate
County, KY 595.4
Healthy People 2020 sets a target of no more than 161.4 cancer deaths per 100,000 people, which the US has met. West Virginia, Kentucky, and Ohio have not yet met the national or Healthy People 2020 benchmarks. The Mountain Health Service Area is further from the Healthy People 2020 target than the three states, at more than 30 points above the 161.4 benchmark.
Healthy People 2020 sets a target of no more than 161.4 cancer deaths per 100,000 people, which the US has met. West Virginia, Kentucky, and Ohio have not yet met the national or Healthy People 2020 benchmarks. The Mountain Health Service Area is further from the Healthy People 2020 target than the three states, at more than 30 points above the 161.4 benchmark.
The Mountain Health Service Area exceeds the HP 2020 goal for cancer death by more than 30 points
487.2
Source: National Cancer Institute, 2011-2015
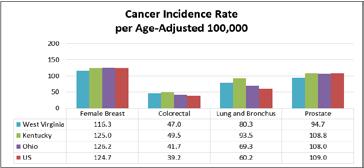
Virginia, Kentucky, and Ohio have higher incidence of lung and colorectal cancers than the US. The incidence of female breast cancer and prostate cancer is lower than or similar to the national rate in all three states.
Leading types of Cancers When the leading types of cancers are separated out, West Virginia, Kentucky, and Ohio have higher incidence of lung and colorectal cancers than the US. The incidence of female breast cancer and prostate cancer is lower than or similar to the national rate in all three states.
Source: National Cancer Institute, 2011-2015 Source: National Cancer Institute, 2008-2017
Consistent with having higher smoking rates, all 3 states have higher cancer incidence and death rates for lung cancer compared to the nation
When the leading types of cancers are separated out, West Virginia, Kentucky, and Ohio have higher incidence of lung and colorectal cancers than the US. The incidence of female breast cancer and prostate cancer is lower than or similar to the national rate in all three states.
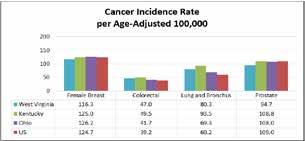
Consistent with having higher smoking rates, all 3 states have higher cancer incidence and death rates for lung cancer compared to the nation
Source: Centers for Disease Control and Prevention 2011-2015
Source Centers for Disease Control and Prevention 2008-2017
Cancer Death Rate
When stratified by race, the death rate due to cancer is higher in West Virginia, Kentucky, Ohio, and the Mountain Health Service Area for both non-Hispanic Whites and Black/African Americans than it is across the US Contrary to national trends, Whites in the Mountain Health Service Area have a higher rate of death than Blacks/African Americans.
Cancer Death Rate per Age-Adjusted 100,000 by Race and Ethnicity (Red = Higher than State and National Benchmarks)
Source: Centers for Disease Control and Prevention 2013-2017
Source Centers for Disease Control and Prevention 2008-2017
Cancer Death Rate
When stratified by race, the death rate due to cancer is higher in West Virginia, Kentucky, Ohio, and the Mountain Health Service Area for both non-Hispanic Whites and Black/African Americans than it is across the US. Contrary to national trends, Whites in the Mountain Health Service Area have a higher rate of death than Blacks/African Americans.
When stratified by race, the death rate due to cancer is higher in West Virginia, Kentucky, Ohio and the Mountain Health Service Area for both non-Hispanic Whites and Black/African Americans than it is across the US Contrary to national trends, Whites in the Mountain Health Service Area have a higher rate of death than Blacks/African Americans. Cancer Death Rate per Age-Adjusted 100,000 by Race and Ethnicity (Red = Higher than State and National Benchmarks)
Source: Centers for Disease Control and Prevention 2013-2017
Source: Centers for Disease Control and Prevention, 2013-2017
2019 CHNA Report DRAFT FOR REVIEW August 2019
Healthy People 2020 for all commonly diagnosed cancers except prostate Mountain Health Network 39
The following counties exceed the Mountain Health Service Area 2013-2017 cancer death rate (200.2) by more than 10 points, exceeding the Healthy People 2020 target by more than 50 points.
The following counties exceed the Mountain Health Service Area 2013-2017 cancer death rate (200.2) by more than 10 points exceeding the Healthy People 2020 target by more than 50 points
Counties with the Highest Cancer Death Rate per Age-Adjusted 100,000 County Death Rate County Death Rate Lawrence County,
Source: Centers for Disease Control and Prevention 2013-2017
Source: Centers for Disease Control and Prevention, 2013-2017
Most Common Cancers
The four most common types of cancers leading to death are reviewed for the Mountain Health Service Area and the three surrounding states n the graph below, along with national and Healthy People 2020 benchmarks. The ageadjusted death rate due to female breast, colorectal, and lung cancers are higher in West Virginia, Kentucky, Ohio, and the Mountain Health Service Area than the nation and Healthy People 2020 targets.
The Mountain Health Service Area has higher death rates than the nation and HP 2020 for all commonly diagnosed cancers except prostate
The four most common types of cancers leading to death are reviewed for the Mountain Health Service Area and the three surrounding states in the graph below, along with national and Healthy People 2020 benchmarks. The ageadjusted death rate due to female breast, colorectal, and lung cancers are higher in West Virginia, Kentucky, Ohio, and the Mountain Health Service Area than the nation and Healthy People 2020 targets.
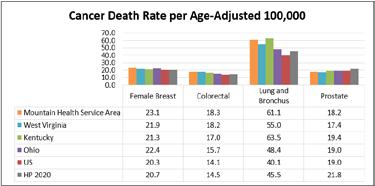
Source: Centers for Disease Control and Prevention, 2013-2017
Mammography
Mammography
statement from the American College of Radiology recommends annual mammography for women over age 40. Mountain Health Network hospitals also recommend annual mammography for all women over age 40. Medicare enrollees in West Virginia and Kentucky are less likely than their peers across the nation to have regular mammograms. Although Ohio is commensurate with the general US percentage, 60% of Medicare enrollees are still not taking advantage of this screening.
The Mountain Health Service Area cancer death rate is highest for lung cancer, but the rate is declining
Mammography Screening among Medicare Enrollees 65-74
of Females Receiving Mammogram
Source: Centers for Medicare & Medicaid Services, 2016
Lung Cancer
Early detection of cancer leads to more effective treatments and better long-term outcomes. Mammography is one form of early detection, specifically for breast cancer. The 2018 position statement from the American College of Radiology recommends annual mammography for women over age 40. Mountain Health Network hospitals also recommend annual mammography for all women over age 40. Medicare enrollees in West Virginia and Kentucky are less likely than their peers across the nation to have regular mammograms. Although Ohio is commensurate with the general US percentage, 60% of Medicare enrollees are still not taking advantage of this screening.
Within the Mountain Health Service Area, lung cancer is responsible for the majority of cancer-related deaths compared to the other most common forms of cancer.
Within the Mountain Health Service Area, lung cancer is responsible for the majority of cancer-related deaths compared to the other most common forms of cancer.
Early detection of cancer leads to more effective treatments and better long-term outcomes. Mammography is one form of early detection, specifically for breast cancer. The 2018 position statement from the American College of Radiology recommends annual mammography for women over age 40. Mountain Health Network hospitals also recommend annual mammography for all women over age 40. Medicare enrollees in West Virginia and Kentucky are less likely than their peers across the nation to have regular mammograms. Although Ohio is commensurate with the general US percentage, 60% of Medicare enrollees are still not taking advantage of this screening.
Mammography Screening among Medicare Enrollees 65-74
Mammogram
Source: Centers for Medicare & Medicaid Services
Lung Cancer
The Mountain Health Service Area cancer death rate is highest for lung cancer, but the rate is declining
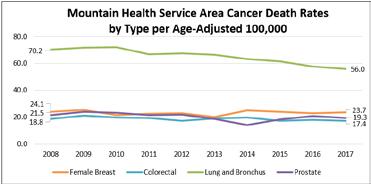
Source: Centers for Disease Control and Prevention 2008-2017
Chronic Lower Respiratory Disease
Chronic lower respiratory disease (CLRD) encompasses diseases like chronic obstructive pulmonary disorder (COPD), emphysema, and asthma, all of which contribute to lower quality of life and increased risk of early death.
Smoking is a key risk factor for CLRD, not only for smokers, but also their families and household members
Within the Mountain Health Service Area lung cancer is responsible for the majority of cancer-related deaths compared to the other most common forms of cancer. The Mountain Health Service Area cancer death rate is highest for lung cancer, but the rate is declining
The Mountain Health Service Area CLRD death rate is 30 points higher than the national rate, and highest among Whites
Chronic lower respiratory disease (CLRD) encompasses diseases like chronic obstructive pulmonary disorder (COPD), emphysema, and asthma, all of which contribute to lower quality of life and increased risk of early death. Smoking is a key risk factor for CLRD, not only for smokers, but also their families and household members.
The following counties exceed the Mountain Health Service Area 2013-2017 CLRD death rate (71.4) by more than 10 points, exceeding the national rate by more than 40 points.
Source: Centers for Disease Control and Prevention, 2013-2017
2019 CHNA Report DRAFT FOR REVIEW August 2019
The death rate due to CLRD is higher for the total population, as well as non-Hispanic White and Black/African American people, living in West Virginia, Kentucky, and Ohio than the nation overall. The CLRD death rate in the Mountain Health Service Area exceeds all states for the total population and non-Hispanic White and Black/African American people.
The death rate due to CLRD is higher for the total population, as well as non-Hispanic White and Black/African American people, living in West Virginia, Kentucky, and Ohio than the nation overall. The CLRD death rate in the Mountain Health Service Area exceeds all states for the total population and non-Hispanic White and Black/African American people.
Death Rate per Age-Adjusted 100,000 by Race and Ethnicity (Red = Higher than State and National Benchmarks)
Source: Centers for Disease Control and Prevention 2013-2017 *Hispanic/Latino death rates are limited due to low counts.
Source: Centers for Disease Control and Prevention, 2013-2017 *Hispanic/Latino death rates are limited due to low counts.
The following counties exceed the Mountain Health Service Area 2013-2017 CLRD death rate (71.4 by more than 10 points exceeding the national rate by more than 40 points Counties with the Highest CLRD Death Rate per Age-Adjusted 100,000 County Death Rate County
Source: Centers for Disease Control and Prevention 2013-2017
Source: Centers for Disease Control and Prevention, 2012-2016
From 2013 to 2017, diabetes prevalence increased in WV and KY and remained stagnant in OH
Among West Virginia and Ohio service counties, Logan, WV, and Scioto, OH, are “bottom performing counties” for both obesity and diabetes. Consistent with the 2016 CHNA, Logan County has the highest diabetes death rate in the service area (65.9). Wyoming County, WV, also has a higher diabetes death rate (48.7), exceeding the Mountain Health Service Area death rate (35.3) by more than 10 points. Among Kentucky service area counties, Martin County is a “top performing county” for both obesity and diabetes.
Among WV and OH service counties, adults in Logan, WV, and Scioto, OH, had that highest rates of obesity and diabetes
Senior Medicare beneficiaries in all 3 states are more likely to have 4 or more chronic conditions than the nation
Diabetes is among the top 10 causes of death in the nation and can lead to a decreased quality of life and disability. According to the American Diabetes Association, diabetes and prediabetes affect more than 110 million Americans and cost $322 billion per year. Type II diabetes, the most common form, is preventable, and if diagnosed early, can often be treated through improved diet and increased exercise.
Diabetes is among the top 10 causes of death in the nation and can lead to a decreased quality of life and disability. According to the American Diabetes Association, diabetes and prediabetes affect more than 110 million Americans and cost $322 billion per year. Type II diabetes, the most common form, is preventable, and if diagnosed early, can often be treated through improved diet and increased exercise.
The table below demonstrates that diabetes is more prevalent among adults in West Virginia and Kentucky than in Ohio or the US in general.
The table below demonstrates that diabetes is more prevalent among adults in West Virginia and Kentucky than in Ohio or the US in general.
From 2013 to 2017, diabetes prevalence increased in WV and KY and remained stagnant in OH
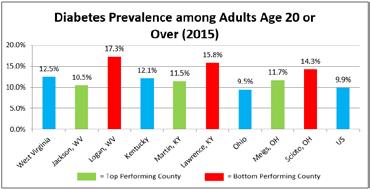
Source: Centers for Disease Control and Prevention, 2015
Source: Centers for Disease Control and Prevention, 2013-2017
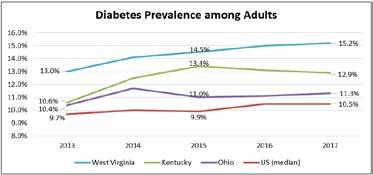
Source: Centers for Disease Control and Prevention, 2012-2016
Source: Centers for Disease Control and Prevention, 2012-2016
When stratified by race, the age-adjusted death rate due to diabetes is higher for people of all races in West Virginia, Kentucky, Ohio, and the Mountain Health Service Area than their peers throughout the nation. Among the geographies included, the rate of death due to diabetes is highest in the Mountain Health Service Area.
According to the 2019 Senior Report published by America’s Health Rankings, “More than 50 million seniors live in the United States, an increase of 45 percent since 2000. As this population grows, policy-makers, public health officials, and community leaders are increasingly concerned with how to improve their health and well-being, as well as address new health challenges that come with growing older and living longer.” The following are select findings from the report:
• The number of home health and personal care aides per 1,000 adults aged 75 and older increased 21% in the past year and 44% in the past six years.
• Food insecurity among seniors decreased 14% since 2017 and SNAP enrollment increased 13%, but continues to be a challenge for seniors, contributing to negative health outcomes and increased risk of chronic disease.
• Nearly 4 million seniors report frequent mental distress, impacting 7.9 percent of the senior population. Excessive drinking increased 12% among seniors from 2016 to 2019. Women are more likely than men to report mental distress, but men experience more suicides.
• Obesity increased 13% among seniors over the past six years.
These data indicate that seniors in West Virginia, Kentucky, and Ohio are more likely to have 4 or more chronic conditions than other seniors across the nation. They are also more likely than other seniors nationwide to be diagnosed with the most common chronic conditions affecting people over age 65.
Among West Virginia and Ohio service counties, Logan, WV, and Scioto, OH, are “bottom performing counties” for both obesity and diabetes. Consistent with the 2016 CHNA, Logan County has the highest diabetes death rate in the service area (65.9). Wyoming County, WV, also has a higher diabetes death rate (48.7), exceeding the Mountain Health Service Area death rate (35.3) by more than 10 points.
Among West Virginia and Ohio service counties, Logan, WV, and Scioto, OH, are “bottom performing counties” for both obesity and diabetes. Consistent with the 2016 CHNA, Logan County has the highest diabetes death rate in the service area (65.9). Wyoming County, WV, also has a higher diabetes death rate (48.7), exceeding the Mountain Health Service Area death rate (35.3) by more than 10 points. Among Kentucky service area counties, Martin County is a “top performing county” for both obesity and diabetes.
Among WV and OH service counties, adults in Logan, WV, and Scioto, OH, had that highest rates of obesity and diabetes
Among Kentucky service area counties, Martin County is a “top performing county” for both obesity and diabetes.
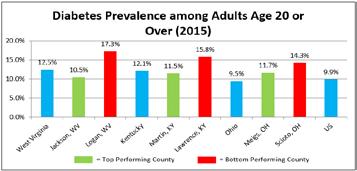
Source: Centers for Disease Control and Prevention, 2013-2017 *Hispanic/Latino death rates are limited due to low counts.
seniors live in the
States, an increase of 45 percent since 2000. As this population grows, policy-makers, public health officials and community leaders are increasingly concerned with how to improve their health and well-being, as well as address new health challenges that come with growing older and living longer.”
According to the CDC, “Among Medicare fee-for-service beneficiaries, people with multiple chronic conditions account for 93% of total Medicare spending.” The tables below note the percentage of Medicare beneficiaries who have been diagnosed with a chronic condition.
Source: Centers for Medicare & Medicaid Services, 2015
As seniors age, they are at risk for isolation due to physical limitations and decreasing social circles. Social isolation can have negative effects on disease risk factors and disease management. One indicator of isolation is the percentage of seniors age 65 or over who live alone. Seniors living in West Virginia, Kentucky, Ohio, and the Mountain Health Service Area are more likely to live alone than other Americans over age 65.
As seniors age, they are at risk for isolation due to physical limitations and decreasing social circles. Social isolation can have negative effects on disease risk factors and disease management. One indicator of isolation is the percentage of seniors age 65 or over who live alone. Seniors living in West Virginia, Kentucky, Ohio and the Mountain Health Service Area are more likely to live alone than other Americans over age 65.
Behavioral Health
2019 CHNA Report DRAFT FOR REVIEW August 2019
Mental and behavioral disorders
Behavioral Health and Substance Use Disorder
2019 CHNA Report DRAFT FOR REVIEW August 2019
Mountain Health Service Area
According to the National Institute on Aging, “Although one does not die of Alzheimer’s disease, during the course of the disease, the body’s defense mechanisms ultimately weaken, increasing susceptibility to catastrophic infection and other causes of death related to frailty.”
seniors are more likely to live alone than seniors across the nation
Alzheimer's disease
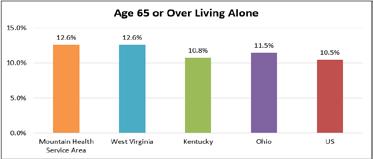
Source: US Census Bureau, 2013-2017
Source: US Census Bureau, 2013-2017
According to the National Institute on Aging, “Although one does not die of Alzheimer's disease, during the course of the disease, the body's defense mechanisms ultimately weaken, increasing susceptibility to catastrophic infection and other causes of death related to frailty.
The age-adjusted death rate due to Alzheimer’s disease in West Virginia is commensurate with the national rate. The rate of death due to Alzheimer’s disease in Kentucky, Ohio, and the Mountain Health Service Area is higher than West Virginia and the nation.
The age-adjusted death rate due to Alzheimer’s disease in West Virginia is commensurate with the national rate. The rate of death due to Alzheimer’s disease in Kentucky, Ohio, and the Mountain Health Service Area is higher than West Virginia and the nation
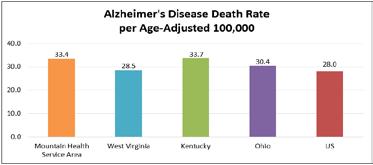
Source: Centers for Disease Control and Prevention, 2013-2017
Source: Centers for Disease Control and Prevention, 2013-2017
Behavioral Health and Substance Use Disorder
Behavioral Health
Mental and behavioral health disorders are major contributors to decreased quality of life and premature death, but if properly diagnosed, there are many effective treatments.
Behavioral Health
Mental and behavioral health disorders are major contributors to decreased quality of life and premature death but if properly diagnosed, there are many effective treatments.
Mental and behavioral health disorders are major contributors to decreased quality of life and premature death but if properly diagnosed, there are many effective treatments.
Healthy People 2020 set a target for suicide death at no more than 10.2 per 100,000 people. None of the areas reviewed in this study meets the Healthy People 2020 target. Ohio has a similar suicide death rate to the nation, while the death rate in Kentucky, West Virginia, and the Mountain Health Service Area exceeds Ohio and the nation. West Virginia has the highest suicide death rate, at more than two times the Healthy People 2020 target.
Healthy People 2020 set a target for suicide death at no more than 10.2 per 100,000 people. None of the areas reviewed in this study meets the Healthy People 2020 target. Ohio has a similar suicide death rate to the nation, while the death rate in Kentucky, West Virginia, and the Mountain Health Service Area exceeds Ohio and the nation. West Virginia has the highest suicide death rate, at more than two times the Healthy People 2020 target.
Healthy People 2020 set a target for suicide death at no more than 10.2 per 100,000 people. None of the areas reviewed in this study meets the Healthy People 2020 target. Ohio has a similar suicide death rate to the nation, while the death rate in Kentucky, West Virginia, and the Mountain Health Service Area exceeds Ohio and the nation. West Virginia has the highest suicide death rate, at more than two times the Healthy People 2020 target.
The Mountain Health Service Area suicide rate increased over the past decade and exceeds the nation; WV counties have the highest suicide rate in general
and behavioral disorders
Mental and behavioral disorders span a wide range of disorders, including disorders due to psychoactive substance use, anxiety disorders, Schizophrenia and other delusional disorders, and mood or personality disorders. The disorders are not induced by alcohol and other psychoactive substances, but they may result from longterm substance abuse.
2019 CHNA Report DRAFT FOR REVIEW August 2019
Mental and behavioral disorders span a wide range of disorders, including disorders due to psychoactive substance use, anxiety disorders, Schizophrenia and other delusional disorders, and mood or personality disorders. The disorders are not induced by alcohol and other psychoactive substances, but they may result from long-term substance abuse.
Mental and behavioral disorders
The Mountain Health Service Area suicide rate increased over the past decade and exceeds the nation; WV counties have the highest suicide rate in general
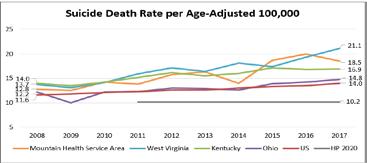
Source: Centers for Disease Control and Prevention 2008-2017
Source: Centers for Disease Control and Prevention, 2008-2017
Source: Centers for Disease Control and Prevention 2008-2017
The following counties exceed the Mountain Health Service Area 2013-2017 suicide death rate (17.5) by more than 10 points.
The following counties exceed the Mountain Health Service Area 2013-2017 suicide death rate (17.5) by more than 10 points. Counties with the Highest Suicide Death Rate per Age-Adjusted 100,000 County Death Rate County
Counties with the Highest Suicide Death Rate per Age-Adjusted 100,000
County Death Rate Wyoming County, WV 23.9 Gallia County, OH 19.7 Boone County, WV 22.8 Logan County, WV 19.2 Meigs County, OH 22.6 Mingo County, WV 19.1 Kanawha County, WV 22.5 Fayette County, WV 18.7
Raleigh County, WV 20.7
Source: Centers for Disease Control and Prevention 2013-2017
Source: Centers for Disease Control and Prevention 2013-2017
Source: Centers for Disease Control and Prevention, 2013-2017 2019 CHNA Report DRAFT FOR REVIEW August 2019
Mental and behavioral disorders span a wide range of disorders, including disorders due to psychoactive substance use, anxiety disorders, Schizophrenia and other delusional disorders, and mood or personality disorders. The disorders are not induced by alcohol and other psychoactive substances, but they may result from long-term substance abuse.
West Virginia, Kentucky, Ohio, and the Mountain Health Service Area all have higher ageadjusted death rates due to mental and behavioral disorders than the nation. While the rate of death due to mental and behavioral disorders is high in the Mountain Health Service Area, it is trending downward
West Virginia, Kentucky, Ohio, and the Mountain Health Service Area all have higher age-adjusted death rates due to mental and behavioral disorders than the nation. While the rate of death due to mental and behavioral disorders is high in the Mountain Health Service Area, it is trending downward.
West Virginia, Kentucky, Ohio, and the Mountain Health Service Area all have higher ageadjusted death rates due to mental and behavioral disorders than the nation. While the rate of death due to mental and behavioral disorders is high in the Mountain Health Service Area, it is trending downward
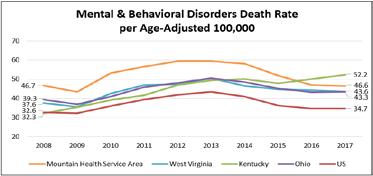
Source: Centers for Disease Control and Prevention
The following counties exceed the Mountain Health Service Area 2013-2017 suicide death rate 17.5 by more than 10 points.
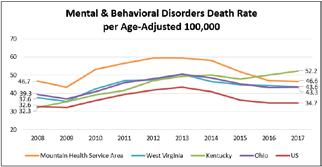
Centers for Disease Control and Prevention,
The following counties exceed the mental and behavioral disorders death rate (52.5 by more than 10
Source: Centers for Disease Control and Prevention 2008-2017
The following counties exceed the Mountain Health Service Area 2013-2017 mental and behavioral disorders death rate 52.5 by more than 10 points and the national rate by 30 points or more.
The following counties exceed the Mountain Health Service Area 2013-2017 mental and behavioral disorders death rate (52.5) by more than 10 points and the national rate by 30 points or more.
Counties with the Highest Mental & Behavioral Disorders Death Rate per Age-Adjusted County Death
Source: Centers for Disease Control and Prevention 2013-2017
Source: Centers for Disease Control and Prevention,
KY and WV service counties,
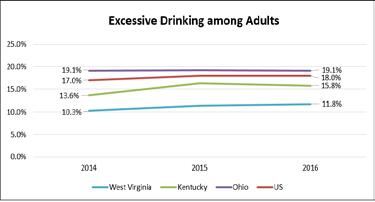
Source: Centers for Disease Control and Prevention 2014-2016
The category of substance use disorder includes alcohol and drug use, including the use of prescription drugs outside of the prescribed use.
2019 CHNA Report DRAFT FOR REVIEW August 2019
The Mountain Health Service Area drug-induced death rate is more than seven times greater than the Healthy People 2020 target death rate
Drug-induced deaths
2019 CHNA Report DRAFT FOR REVIEW August 2019
Substance Use Disorder
The category of substance use disorder includes alcohol and drug use, including the use of prescription drugs outside of the prescribed use.
Excessive drinking includes binge drinking, heavy drinking, and any drinking by pregnant women or people younger than age 21. Both West Virginia and Kentucky have fewer excessive drinkers than the nation, but the percentage is increasing. Ohio exceeds both neighboring states and the nation, with nearly 1 in 5 adults reporting excessive drinking. Approximately one-third of driving deaths in Ohio are due to DUI, exceeding the national percent. The percent of driving deaths due to DUI in West Virginia and Kentucky is only slightly lower, at 30.7% and 27.3% respectively.
Excessive drinking includes binge drinking, heavy drinking, and any drinking by pregnant women or people younger than age 21. Both West Virginia and Kentucky have fewer excessive drinkers than the nation, but the percentage is increasing. Ohio exceeds both neighboring states and the nation, with nearly 1 in 5 adults reporting excessive drinking. Approximately one-third of driving deaths in Ohio are due to DUI, exceeding the national percent. The percent of driving deaths due to DUI in West Virginia and Kentucky is only slightly lower, at 30.7% and 27.3% respectively
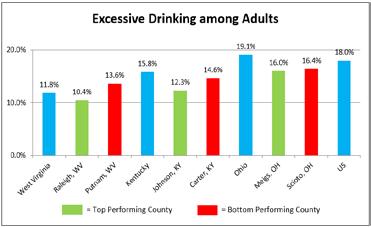
Source: Centers for Disease Control and Prevention 2016
Source: Centers for Disease Control and Prevention, 2016
Among KY and WV service counties, Carter, KY and Putnam, WV have the highest percent of adults who drink excessively and the highest percent of deaths due to DUI Mountain Health Network 49
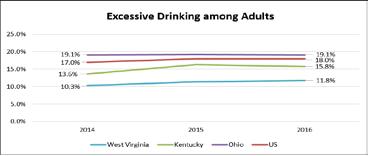
Source: Centers for Disease Control and Prevention 2014-2016
Source: Centers for Disease Control and Prevention, 2014-2016
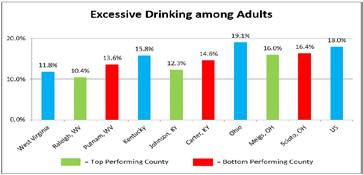
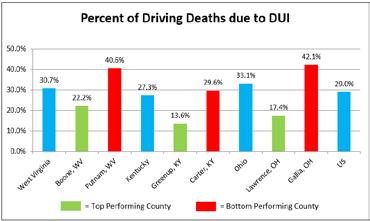
Source: National Highway Traffic Safety Administration, 2013-2017 Drug-induced deaths Drug-induced deaths include all deaths for which drugs are the underlying cause, including drug overdoses and deaths from medical conditions resulting from chronic drug use. Healthy People 2020 set a target of no more than 11.3 drug-induced deaths per 100,000 people. In recent years, the national druginduced death rate is double the Healthy People 2020 target.
Source: National Highway Traffic Safety Administration, 2013-2017
Source: National Highway Traffic Safety Administration, 2013-2017
Drug-induced deaths include all deaths for which drugs are the underlying cause, including drug overdoses and deaths from medical conditions resulting from chronic drug use. Healthy People 2020 set a target of no more than 11.3 drug-induced deaths per 100,000 people. In recent years, the national drug-induced death rate is double the Healthy People 2020 target.
Drug-induced deaths
Drug-induced deaths include all deaths for which drugs are the underlying cause, including drug overdoses and deaths from medical conditions resulting from chronic drug use. Healthy People 2020 set a target of no more than 11.3 drug-induced deaths per 100,000 people. In recent years, the national druginduced death rate is double the Healthy People 2020 target.
Drug-induced deaths are a growing problem nationally, and have hit the Mountain Health Service Area and its surrounding states particularly hard. Among the three states, Kentucky fares the best, but the death rate is still three times greater than the Healthy People 2020 target, and nearly 17 points above the national rate. The Mountain Health Service Area is most affected by drug-induced deaths with a death rate that is more than seven times greater than the Healthy People 2020 target, and 60 points higher than the national rate.
The Mountain Health Service Area drug-induced death rate is more than 7 times greater than the HP 2020 target death rate
Drug- induced deaths are a growing problem nationally, and have hit the Mountain Health Service Area and its surrounding states particularly hard. Among the three states, Kentucky fares the best, but the death rate is still three times greater than the Healthy People 2020 target, and nearly 17 points above the national rate. The Mountain Health Service Area is most affected by drug-induced deaths with a death rate that is more than seven times greater than the Healthy People 2020 target, and 60 points higher than the national rate.
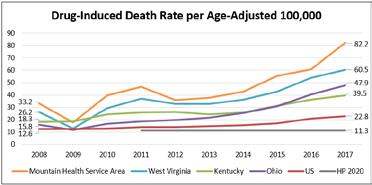
Source: Centers for Disease Control and Prevention 2008-2017
Source: Centers for Disease Control and Prevention, 2008-2017
Mountain Health Network 50
CHNA Report
The following counties exceed the Mountain Health Service Area 2013-2017 aggregate drug-induced death rate (55.4) by more than 10 points.
Source: Centers for
Source: Centers for Disease Control and Prevention, 2013-2017
Drug overdoses, particularly opioid drug overdoses, have fueled much of the increase in drug-induced deaths nationwide and in the Mountain Health Service Area. According to the National Institute on Drug Abuse, “Opioids were involved in 47,600 overdose deaths in 2017 (67.8% of all drug overdose deaths).” West Virginia had the highest rate of overdose deaths in the United States in 2017. Ohio had the second highest overdose death rate. The rate of overdose deaths increased in all three states from 2016 to 2017.
drug overdose deaths).” West Virginia had the highest rate of overdose deaths in the United States in 2017. Ohio had the second highest overdose death rate. The rate of overdose deaths increased in all three states from 2016 to 2017.
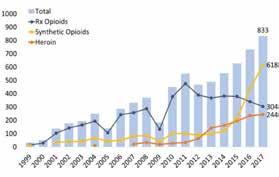
Drug overdoses, particularly opioid drug overdoses, have fueled much of the increase in druginduced deaths nationwide and in the Mountain Health Service Area. According to the National Institute on Drug Abuse, “Opioids were involved in 47,600 overdose deaths in 2017 (67.8% of all drug overdose deaths).” West Virginia had the highest rate of overdose deaths in the United States in 2017. Ohio had the second highest overdose death rate. The rate of overdose deaths increased in all three states from 2016 to 2017.
Trended Drug Overdose Death Rate per Age-Adjusted 100,000
Drug-induced deaths – continued
Source: National Institute on Drug Abuse, 2018
Across all three states, opioid-related overdose deaths due to prescription opioids stabilized or decreased in recent years, while deaths due to heroin and synthetic opioids, like fentanyl, increased.
2019 CHNA Report DRAFT FOR REVIEW August 2019
Neonatal Abstinence Syndrome (NAS) as “a group of conditions that occur when your baby withdraws from drugs they were exposed to in the womb”
Across all three states opioid-related overdose deaths due to prescription opioids stabilized or decreased in recent years, while deaths due to heroin and synthetic opioids, like fentanyl, increased.
Number of Overdose Deathssssss Involving Opioids in West Virginia, by Opioid Category
Number of Overdose Deaths Involving Opioids in West Virginia, by Opioid Category
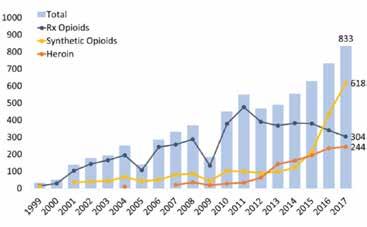
Source: National Institute on Drug Abuse, 2018
of Overdose Deaths Involving Opioids in Kentucky, by Opioid Category
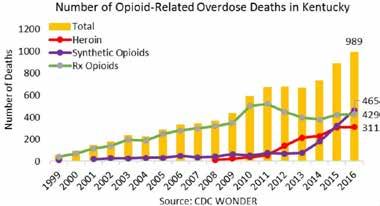
Number of Overdose Deaths Involving Opioids in Kentucky by Opioid Category
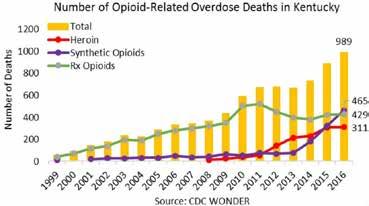
Source: *2017 data for Kentucky is not yet available.
Source: National Institute on Drug Abuse, 2018 *2017 data for Kentucky is not yet available.
Source: National Institute on Drug Abuse, 2018 *2017 data for Kentucky is not yet available. ategory
Source: *2017 data for Ohio is not yet available. 2019 CHNA Report DRAFT FOR REVIEW August 2019 Number of Overdose Deaths nvolving Opioids in Kentucky by Opioid Category
Neonatal Abstinence Syndrome
The March of Dimes defines Neonatal Abstinence Syndrome (NAS) as “a group of conditions that occur when your baby withdraws from drugs they were exposed to in the womb.” Across West Virginia from 2014 to 2018, 3.8% of babies were born with NAS. The percentage was higher for more recent years (4.4% in 2018, 4.6% in 2016 and 2017). Among Mountain Health service counties, Mason and Cabell counties had the highest percentage of NAS births from 2014 to 2018 at nearly 5%. Preliminary data for 2018 shows that the percentage of NAS births may be declining in Mason and Cabell counties. The following tables indicate the burden of NAS in Kentucky, Ohio and West Virginia.
Source: Ohio Department of Health, 2013-2017
*Data are not shown for counties with a population under 20,000 or data counts of 10 or less.
Source: Ohio Department of Health, 2013-2017 *Data are not shown for counties with a population under 20,000 or data counts of
Number of Overdose Deaths nvolving Opioids in Ohio, by Opioid Category
Source: National Institute on Drug Abuse, 2018 Mountain Health Network 51
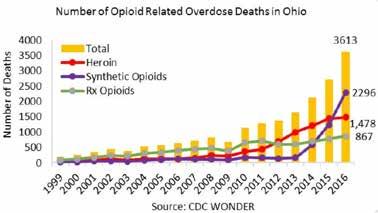
Source: National Institute on Drug Abuse, 2018 *2017 data for Ohio is not yet available.
Source: National Institute on Drug Abuse, 2018 *2017 data for Ohio is not yet available.
The March of Dimes defines Neonatal Abstinence Syndrome (NAS) as “a group of conditions that occur when your baby withdraws from drugs they were exposed to in the womb.” Across West Virginia from 2014 to 2018, 3.8% of babies were born with NAS. The percentage was higher for more recent years (4.4% in 2018, 4.6% in 2016 and 2017). Among Mountain Health service counties, Mason and Cabell counties had the highest percentage of NAS births from 2014 to 2018 at nearly 5%. Preliminary data for 2018 shows that the percentage of NAS births may be declining in Mason and Cabell counties The following tables indicate the burden of NAS in Kentucky, Ohio and West Virginia.
Neonatal Abstinence Syndrome Births by West Virginia County 2014-2018 County NAS Births Percentage of All Births
Mason County 65 4.8%
Cabell County 235 4.4%
Lincoln County 48 4.0%
County 15 1.0% West Virginia Total 3,675 3.8%
Source: West Virginia Department of Health & Human Resources, 2014-2018
Source: West Virginia Department of Health & Human Resources, 2014-2018
According to the Ohio Department of Health, 15,441 inpatient hospitalizations for NAS occurred between 2006 and 2017. In 2017 alone, there were 1,986 admissions, which equates to more than five admissions per day. The following table depicts the number of NAS hospitalizations for Mountain Health service counties in Ohio for the most recent five-year period (2013-2017). Hospitalizations for Neonatal Abstinence Syndrome by Ohio County,
According to the Ohio Department of Health, 15,441 inpatient hospitalizations for NAS occurred between 2006 and 2017. In 2017 alone, there were 1,986 admissions, which equates to more than five admissions per day. The following table depicts the number of NAS hospitalizations for Mountain Health service counties in Ohio for the most recent five-year period (2013-2017).
Across Kentucky, approximately 2% of live births from 2015 to 2017 were reported to have NAS. The percentage decreased by .1% annually over the three-year period.
or less. Across Kentucky,
for Health and Family
Source: Kentucky Cabinet for Health and Family Services Department for Public Health, 2015-2017
The birth rate for Kentucky and Ohio is similar to the national birth rate, while the birth rate for West Virginia is slightly lower. The majority of births in the region are to NonHispanic White mothers, consistent with the demographics of the area. Less than 6% of births in any state are to Latina mothers compared to nearly one-quarter nationally.
and Ohio is similar to the national birth
The birth rate for Kentucky and Ohio is similar to the national birth rate, while the birth rate for West Virginia is slightly lower. The majority of births in the region are to Non-Hispanic White mothers, consistent with the demographics of the area. Less than 6% of births in any state are to Latina mothers compared to nearly onequarter nationally.
2017 Births by Race and Ethnicity
Less than 6% of births n KY, OH, and WV were to Latina mothers compared to 23% nationally
West Virginia has done a better job of engaging pregnant women in prenatal care during the first trimester than the nation
Source: Centers for Disease Control and Prevention, 2017
The percent of all births to teens 19 and younger is declining in West Virginia, Kentucky, and Ohio, consistent with national trends. The downward trends are promising, but the percent of births to teens is still higher in all three states than the nation.
The percent of all births to teens 19 and younger is declining in West Virginia, Kentucky, and Ohio, consistent with national trends. The downward trends are promising, but the percent of births to teens is still higher in all three states than the nation.
Prenatal Care
Engaging in early prenatal care increases the chances that a mother and her baby will have a healthy pregnancy and a healthy birth. Entry into prenatal care after the first trimester can suggest barriers to care such as lack of information, lack of access to health care or transportation, or behavioral health barriers.
The teen birth percentage continues to decline in all 3 states, but it is higher than the nation
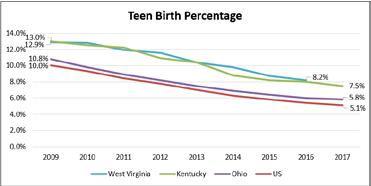
Low birth weight
WV has
the highest percentage of low birth weight babies, despite greater prenatal care access among mothers
Source: Centers for Disease Control and Prevention, 2016-2017; West Virginia Department of Health & Human Resources, 2009-2016; Kentucky Cabinet for Health and Family Services, 2009-2017; Ohio Department of Health, 2009-2017
*West Virginia data are only available through 2016.
All three states
Healthy People 2020 set a target of 77.9% of pregnant women accessing prenatal care in the first trimester. West Virginia has done a better job of engaging pregnant women in prenatal care during the first trimester than the nation and has met the Healthy People 2020 target. Kentucky and Ohio have lower percentages of mothers engaging in first trimester prenatal care but are within reach of the Healthy People 2020 target.
Healthy People 2020 set a target of 77.9% of pregnant women accessing prenatal care in the first trimester. West Virginia has done a better job of engaging pregnant women in prenatal care during the first trimester than the nation and has met the Healthy People 2020 target. Kentucky and Ohio have lower percentages of mothers engaging in first trimester prenatal care but are within reach of the Healthy People 2020 target.
Source: Centers for Disease Control and Prevention, 2009-2017; West Virginia Department of Health & Human Resources, 2009-2016; Kentucky Cabinet for Health and Family Services, 2009-2017; Ohio Department of Health, 2009-2017 *West Virginia data are only available through 2016.
Source: Centers for Disease Control and Prevention, 2009-2017; West Virginia Department of Health & Human Resources, 2009-2016; Kentucky Cabinet for Health and Family Services, 2009-2017; Ohio Department of Health, 2009-2017 *West Virginia data are only available through 2016.
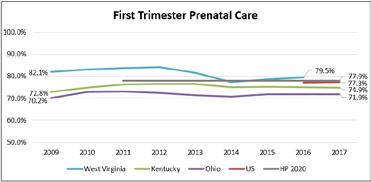
Source: Centers for Disease Control and Prevention, 2016-2017; West Virginia Department of Health & Human Resources, 2009-2016; Kentucky Cabinet for Health and Family Services, 2009-2017; Ohio Department of Health, 2009-2017 *West Virginia data are only available through 2016. **Starting in 2016, all of the US reported data based on the 2003 US Certificate of Live Birth, providing national indicators for timing of prenatal care. Data prior to 2016 are not reported. Mountain Health Network 54
Source: Centers for Disease Control and Prevention, 2016-2017; West Virginia Department of Health & Human Resources, 2009-2016; Kentucky Cabinet for Health and Family Services, 2009-2017; Ohio Department of Health, 2009-2017
Engaging in early prenatal care increases the chances that a mother and her baby will have a healthy pregnancy and a healthy birth. Entry into prenatal care after the first trimester can suggest barriers to care such as lack of information, lack of access to health care or transportation, or behavioral health barriers.
*West Virginia data are only available through 2016.
**Starting in 2016, all of the US reported data based on the 2003 US Certificate o Live Birth, providing national indicators for timing of prenatal care Data prior to 2016 are not reported.
The following Mountain Health service counties do not meet the Healthy People 2020 goal for mothers receiving first trimester prenatal care. Counties are presented in ascending order by percentage of mothers receiving first trimester prenatal care. Counties That Do Not Meet the Healthy People 2020
Delayed prenatal care can contribute to ow birth weight. Low birth weight is defined as a birth weight of less than 5 pounds, 8 ounces, and is often a result of premature birth, fetal growth restrictions, or birth defects. Healthy People 2020 set a target of no more than 7.8% of all births as low birth weight. The percent of low birth weight babies in West Virginia, Kentucky, and Ohio is greater than the nation, and has not yet met the Healthy People 2020 target.
**Starting in 2016, all of the US reported data based on the 2003 US Certificate o Live Birth, providing national indicators for timing of prenatal care Data prior to 2016 are not reported.
The following Mountain Health service counties do not meet the Healthy People 2020 goal for mothers receiving first trimester prenatal care. Counties are presented in ascending order by percentage of mothers receiving first trimester prenatal care.
The following Mountain Health service counties do not meet the Healthy People 2020 goal for mothers receiving first trimester prenatal care. Counties are presented in ascending order by percentage of mothers receiving first trimester prenatal care.
Counties That Do Not Meet the Healthy People 2020 Goal (77.9%) for Mothers Receiving First Trimester Prenatal Care County Percentage
County, KY
County, KY
County, WV
County, KY
Gallia County, OH
Boone County, WV
Jackson County, WV
Scioto County, OH
Logan County, WV
Wyoming County, WV 76.9%
Source: West Virginia Department of Health & Human Resources, 2016; Kentucky Cabinet for Health and Family Services, 2017; Ohio Department of Health, 2017
Source: West Virginia Department of Health & Human Resources, 2016; Kentucky Cabinet for Health and Family Services, 2017; Ohio Department o Health, 2017
2020 set a target of no more than 7.8% of all births as low birth weight. The percent of low birth weight babies in West Virginia, Kentucky, and Ohio is greater than the nation, and has not yet met the Healthy People 2020 target.
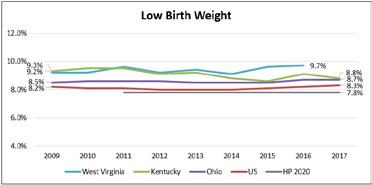
Source: Centers for Disease Control and Prevention, 2009-2017; West Virginia Department of Health & Human Resources, 2009-2016; Kentucky Cabinet for Health and Family Services, 2009-2017; Ohio Department of Health, 2009-2017
*West Virginia data are only available through 2016.
Source: Centers for Disease Control and Prevention, 2009-2017; West Virginia Department of Health & Human Resources, 2009-2016; Kentucky Cabinet for Health and Family Services, 2009-2017; Ohio Department of Health, 2009-2017 *West Virginia data are only available through 2016.
Source: Centers for Disease Control and Prevention, 2009-2017;
Mountain Health Network 55
Delayed prenatal care can contribute to low birth weight. Low birth weight is defined as a birth weight of less than 5 pounds, 8 ounces, and is often a result of premature birth, fetal growth restrictions, or birth defects. Healthy People 2020 set a target of no more than 7.8% of all births as low birth weight. The percent of low birth weight babies in West Virginia, Kentucky, and Ohio is greater than the nation, and has not yet met the Healthy People 2020 target.
The following Mountain Health service counties do not meet the Healthy People 2020 goal for low birth weight babies by at least three percentage points. Counties are pres ented in descending order by percentage of low birth weight babies.
The following Mountain Health service counties do not meet the Healthy People 2020 goal for low birth weight babies by at least three percentage points. Counties are presented in descending order by percentage of low birth weight babies.
Source: West Virginia Department of Health & Human Resources, 2016; Ohio Department of Health, 2017
The proportion of mothers in the Tri-State region who smoke during pregnancy is higher than the nation, but declining
Smoking during pregnancy
Smoking during pregnancy
Smoking during pregnancy is associated with a variety of negative birth outcomes, including low birth weight. Healthy People 2020 set a goal of reducing the number of pregnant women who smoke to 1.4%. The proportion of women in Ohio, Kentucky, and West Virginia who smoke during pregnancy is higher than the nation, but declining West Virginia has the highest proportion of mothers who smoke at 25%.
Smoking during pregnancy is associated with a variety of negative birth outcomes, including low birth weight. Healthy People 2020 set a goal of reducing the number of pregnant women who smoke to 1.4%. The proportion of women in Ohio, Kentucky, and West Virginia who smoke during pregnancy is higher than the nation, but declining. West Virginia has the highest proportion of mothers who smoke at 25%.
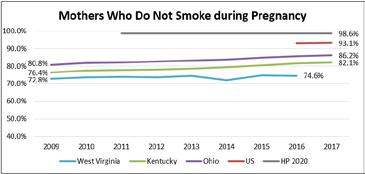
Source: Centers for Disease Control and Prevention, 2016-2017; West Virginia Department of Health & Human Resources, 2009-2016; Kentucky Cabinet for Health and Family Services, 2009-2017; Ohio Department of Health, 2009-2017
*West Virginia data are only available through 2016.
The percentage of preterm births in all three states is higher than the nation and Healthy People 2020 goal
Health Indicators by Race and Ethnicity
2019 CHNA Report DRAFT FOR REVIEW August 2019
Preterm birth
**Starting in 2016, all of the US reported data based on the 2003 US Certificate of Live Birth, providing national indicators for tobacco use during pregnancy Data prior to 2016 are not reported.
The following Mountain Health service counties report more than 1 in 4 (25%) mothers who smoke during pregnancy. Counties are presented in descending order by percentage of mothers who smoke during pregnancy.
The following Mountain Health service counties report more than 1 in 4 (25%) mothers who smoke during pregnancy. Counties are presented in descending order by percentage of mothers who smoke during pregnancy.
The proportion of mothers in the Tri-State region who smoke during pregnancy is higher than the nation, but declining
Counties that Report More Than 25% of Mothers Smoking during Pregnancy County Percentage
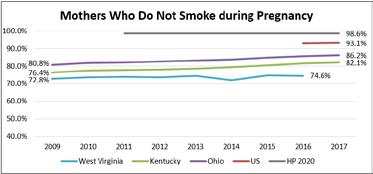
Source: Centers for Disease Control and Prevention, 2016-2017; West Virginia Department of Health & Human Resources, 2009-2016; Kentucky Cabinet for Health and Family Services, 2009-2017; Ohio Department of Health, 2009-2017
Virginia data are only available through 2016.
*West Virginia data are only available through 2016.
**Starting in 2016, all of the US reported data based on the 2003 US Certificate of Live Birth, providing national indicators for tobacco use during pregnancy Data prior to 2016 are not reported.
**Starting in 2016, all of the US reported data based on the 2003 US Certificate of Live Birth, providing national indicators for tobacco use during pregnancy. Data prior to 2016 are not reported.
The following Mountain Health service counties report more than 1 in 4 (25%) mothers who smoke during pregnancy. Counties are presented in descending order by percentage of mothers who smoke during pregnancy.
Counties that Report More Than 25% of Mothers Smoking during Pregnancy County Percentage
County, WV
County, WV
County, WV
County, WV
Carter County, KY
Lincoln County, WV
Fayette County, WV
Mason County, WV
Kanawha County, WV 26.6%
Raleigh County, WV 26.1% Scioto County, OH 25.2%
Source: West Virginia Department of Health & Human Resources, 2016 Kentucky Cabinet for Health and Family Services, 2017; Ohio Department of Health, 2017
Source: West Virginia Department of Health & Human Resources, 2016; Kentucky Cabinet for Health and Family Services, 2017; Ohio Department of Health, 2017
Preterm birth
Preterm birth is defined as birth before 37 weeks of pregnancy, and can esult in infant disability or even death. Healthy People 2020 set a goal of no more than 9.4% of all births before 37 weeks of pregnancy. More than 1 in 10 births in West Virginia, Kentucky, and Ohio occurs before 37 weeks of pregnancy, slightly higher than the nation in general. None of the states in this area or the nation has met the Healthy People 2020 target for this indicator yet.
Preterm birth is defined as birth before 37 weeks of pregnancy, and can result in infant disability or even death. Healthy People 2020 set a goal of no more than 9.4% of all births before 37 weeks of pregnancy. More than 1 in 10 births in West Virginia, Kentucky, and Ohio occurs before 37 weeks of pregnancy, slightly higher than the nation in general. None of the states in this area or the nation has met the Healthy People 2020 target for this indicator yet.
Preterm birth is defined as birth before 37 weeks of pregnancy, and can result in infant disability or even death. Healthy People 2020 set a goal of no more than 9.4% of all births before 37 weeks of pregnancy. More than 1 in 10 births in West Virginia, Kentucky, and Ohio occurs before 37 weeks of pregnancy, slightly higher than the nation in general. None of the states in this area or the nation has met the Healthy People 2020 target for this indicator yet.
The percentage of preterm births in all 3 states is higher than the nation and HP 2020 goal
The percentage of preterm births in all 3 states is higher than the nation and HP 2020 goal
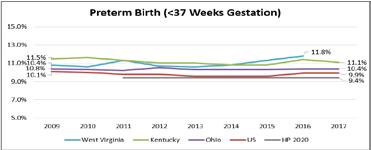
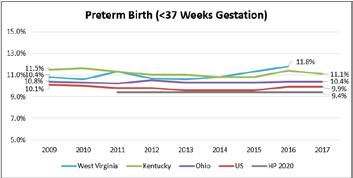
Source: Centers for Disease Control and Prevention, 2009-2017; West Virginia Department of Health & Human Resources, 2009-2016; Kentucky Cabinet for Health and Family Services, 2009-2017; Ohio Department of Health, 2009-2017 *West Virginia data are only available through 2016.
Source: Centers for Disease Control and Prevention, 2009-2017; West Virginia Department of Health & Human Resources, 2009-2016; Kentucky Cabinet for Health and Family Services, 2009-2017; Ohio Department of Health, 2009-2017 *West Virginia data are only available through 2016.
Source: Centers for Disease Control and Prevention, 2009-2017; West Virginia Department of Health & Human Resources, 2009-2016; Kentucky Cabinet for Health and Family Services, 2009-2017; Ohio Department of Health, 2009-2017
*West Virginia data are only available through 2016.
The following Mountain Health service counties do not meet the Healthy People 2020 goal for preterm births by at least three percentage points. Counties are presented in descending order by percentage of preterm births. Note: County-level data are not available for West Virginia.
The following Mountain Health service counties do not meet the Healthy People 2020 goal for preterm births by at least three percentage points. Counties are presented in descending order by percentage of preterm births. Note: County-level data are not available for West Virginia.
Counties that Do Not Meet the Healthy People 2020 Goal (9 4%) For Preterm Births by at Least 3 Points County Percentage
The following Mountain Health service counties do not meet the Healthy People 2020 goal for preterm births by at least three percentage points. Counties are presented in descending order by percentage of preterm births. Note: County-level data are not available for West Virginia.
Boyd County, KY 15.8% Greenup County, KY 14.7% Meigs County, OH 14.1% Lawrence County, OH
Carter County, KY
Counties that Do Not Meet the Healthy People 2020 Goal 9 4%) For Preterm Births by at Least 3 Points County
Source: Kentucky Cabinet for Health and Family Services, 2017; Ohio Department of Health, 2017
Source: Kentucky Cabinet for Health and Family Services, 2017 Ohio Department of Health, 2017
Source: Kentucky Cabinet for Health and Family Services, 2017; Ohio Department of Health, 2017
Health Indicators by Race and Ethnicity Maternal and child health indicators are presented in the table below by race and ethnicity. Across all three states the percentage of Black/African American and Hispanic/Latina mothers receiving first trimester prenatal care is lower than the percentage of White mothers receiving care. Black/African American mothers experience higher percentages of low birth weight and preterm births compared to their White and Hispanic/Latina peers. White mothers are more likely to smoke during pregnancy than Black/African American and Hispanic/Latina mothers.
Black/African American and Hispanic/Latina mothers are less likely than White Mothers to receive first trimester prenatal care
Maternal and child health indicators are presented in the table below by race and ethnicity. Across all three states, the percentage of Black/African American and Hispanic/ Latina mothers receiving first trimester prenatal care is lower than the percentage of White mothers receiving care. Black/ African American mothers experience higher percentages of low birth weight and preterm births compared to their White and Hispanic/Latina peers. White mothers are more likely to smoke during pregnancy than Black/African American and Hispanic/Latina mothers.
Source: West Virginia Department of Health & Human Resources, 2016; Kentucky Cabinet for Health and Family Services, 2017; Ohio Department of Health, 2017
*West Virginia data are only available for 2016 Kentucky and Ohio data are reported for 2017 Additionally, ethnicity is not indicated or West Virginia maternal and child health indicators; reported data reflect White and Blacks/African Americans, regardless o ethnicity
Source: West Virginia Department of Health & Human Resources, 2016; Kentucky Cabinet for Health and Family Services, 2017; Ohio Department o Health, 2017 *West Virginia data are only available for 2016; Kentucky and Ohio data are reported for 2017. Additionally, ethnicity is not indicated for West Virginia maternal and child health indicators; reported data reflect Whites and Blacks/African Americans, regardless of ethnicity.
Sexually Transmitted Infections
Sexually transmitted infections (STIs) that require reporting to the CDC and state and local health bureaus upon detection include chlamydia, gonorrhea, and HIV/AIDS.
Mountain Health Service Area rates of chlamydia, gonorrhea, and HIV infection are lower than the nation
Chlamydia and gonorrhea are both preventable and treatable, but when left untreated can lead to serious complications and decreased quality of life.
Chlamydia and gonorrhea are less prevalent in West Virginia, Kentucky, and the Mountain Health Service Area than in Ohio and the nation in general. The prevalence of chlamydia and gonorrhea infection in Ohio is greater than the surrounding states and the nation.
Infant mortality rate
The infant mortality rate is an important contributor to a community’s life expectancy, and an important indicator of maternal and child health. The infant mortality rate is the number of deaths per 1,000 live births of children under one year of age. The top three leading causes of infant mortality in the US are birth defects, preterm birth and low birthweight, and maternal pregnancy complications. Healthy People 2020 sets a target of no more than 6.0 deaths in the irst year of life per 1,000 live births. The US in general has met this target. Although there has been great variability in recent years, West Virginia, Kentucky, Ohio and the Mountain Health Service Area have not met the Healthy People 2020 target or the national rate.
The infant mortality rate is an important contributor to a community’s life expectancy, and an important indicator of maternal and child health. The infant mortality rate is the number of deaths per 1,000 live births of children under one year of age. The top three leading causes of infant mortality in the US are birth defects, preterm birth and low birthweight, and maternal pregnancy complications. Healthy People 2020 sets a target of no more than 6.0 deaths in the first year of life per 1,000 live births. The US in general has met this target. Although there has been great variability in recent years, West Virginia, Kentucky, Ohio, and the Mountain Health Service Area have not met the Healthy People 2020 target or the national rate.
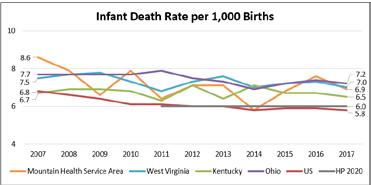
Source: Centers for Disease Control and Prevention, 2007-2017
Source: Centers for Disease Control and Prevention, 2007-2017
The following table depicts five-year (2013-2017) infant mortality rates and counts for counties with a reportable death rate. Kanawha County in West Virginia is the only county that has met the Healthy People 2020 target.
The following table depicts five-year (2013-2017) infant mortality rates and counts for counties with a reportable death rate Kanawha County in West Virginia is the only county that has met the Healthy People 2020 target.
Source: Centers for Disease Control and Prevention 2013-2017
Source: Centers for Disease Control and Prevention, 2013-2017
HIV prevalence is the number of people living with HIV infection at a given time. According to the CDC, “At the end of 2015, an estimated 1.1 million persons aged 13 and older were living with HIV infection in the United States, including an estimated 162,500 (15%) persons whose infections had not been diagnosed.” While there is no cure for HIV yet, it is preventable and is treatable as a chronic disease if diagnosed.
Sexually transmitted infections (STIs) that require reporting to the CDC and state and local health bureaus upon detection include chlamydia, gonorrhea, and HIV/AIDS.
The prevalence of HIV is lower in West Virginia, Kentucky, Ohio, and the Mountain Health Service Area than the nation. Nonetheless, this area epresents an opportunity for continued intervention to ensure people living with HIV are accessing consistent and proper care for the maintenance of their disease, and that efforts are continued towards prevention, education, and testing.
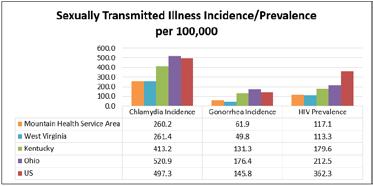
HIV prevalence is the number of people living with HIV infection at a given time. According to the CDC, “At the end of 2015, an estimated 1.1 million persons aged 13 and older were living with HIV infection in the United States, including an estimated 162,500 (15%) persons whose infections had not been diagnosed.” While there is no cure for HIV yet, it is preventable and is treatable as a chronic disease if diagnosed.
The prevalence of HIV is lower in West Virginia, Kentucky, Ohio, and the Mountain Health Service Area than the nation. Nonetheless, this area represents an opportunity for continued intervention to ensure people living with HIV are accessing consistent and proper care for the maintenance of their disease, and that efforts are continued towards prevention, education, and testing.
Source: Centers for Disease Control and Prevention, 2016
Source: Centers for Disease Control and Prevention, 2016
Chlamydia and gonorrhea are both preventable and treatable, but when left untreated can lead to serious complications and decreased quality of life. Chlamydia and gonorrhea are less prevalent in West Virginia, Kentucky, and the Mountain Health Service Area than in Ohio and the nation in general. The prevalence of chlamydia and gonorrhea infection in Ohio is greater than the surrounding states and the nation.
Health Network 61

A Key Informant Survey was conducted with community representatives across Mountain Health’s 23-county service area to solicit information about health needs among residents. A total of 151 individuals responded to the survey, including health and social service providers; community and public health experts; civic, religious, and social leaders; policy makers and elected officials; and others representing diverse populations, including minority, low-income, and other underserved or vulnerable populations. A list of the represented community organizations and the key informants’ respective titles is included in Appendix B. Key informant names are withheld for confidentiality.
These “key informants” were asked a series of questions about their perceptions of community health including health drivers, barriers to care, community infrastructure, and missing resources within the community. A summary of findings from their responses is included below.
• Drug use disorder was identified as the top community health concern with 75% of informants selecting it among their top three choices and 50% selecting it as their No. 1 choice. Other top health concerns, according to key informants, were overweight/obesity and diabetes.
• The top contributing factors to resident health concerns, in rank order according to key informants, were health habits (diet, physical activity), drug/alcohol use, and poverty. Informants also identified the built environment, declining economy, and loss of family structure as key underlying factors to health concerns. Low income, poor, and rural populations were seen as the most at risk for poor health outcomes.
• Informants indicated that the region is diverse, representing both areas of prosperity and deprivation. The needs of individuals living in areas of deprivation are exacerbated by pride, and a lack of willingness to accept help.
• Approximately 75% of informants “disagreed” or “strongly disagreed” that the community they serve is healthy and 71% “disagreed” or “strongly disagreed” that residents prioritize their health. Access to community services – including affordable, safe housing; affordable, nutritious foods; and public transportation were seen as key contributors.
• When asked to rate community dimensions impacting social determinants of health, respondent mean scores were between 2.04 and 3.08 out of 5, indicating overall “poor” or “average” ratings. Health and health care was seen as the strongest dimension.
• Approximately 60% of informants rated mental health services and healthy food options as the top missing resources in the community. Substance abuse services and transportation options were chosen as the top missing resources in the community by more than 50% of informants.
• Nearly three-quarters of informants indicated that residents learn about health services by word of mouth. More than 50% of informants indicated that residents learn about health services from doctor’s offices/clinics and TV.
• When asked about their awareness of specific Mountain Health programs, 80% of informants indicated they were aware of Cabell Huntington Hospital’s Senior Services program and 63% were aware of St. Mary’s Total Woman Program.
Survey Participants
Key Informants represented all 23 counties in the Mountain Health Service Area. Approximately 92% of key informants indicated that they served residents of Cabell County, West Virginia, the home county of Mountain Health. More than half of key informants served the neighboring counties of Wayne, Putnam, and Lincoln in West Virginia and Lawrence in Ohio.
Health Perceptions
Percentages do not add
Nearly half of key informants indicated that they served all populations within their service area. The most commonly served special population groups were low income/poor, children/youth, and families. “Other” populations served included individuals with substance use disorder and addiction, infants with Neonatal Abstinence Syndrome and their families, individuals with traumatic brain injuries and/or intellectual and developmental disabilities, and persons diagnosed with HIV and/or hepatitis.
Nearly half of key informants indicated that they served all populations within their service area. The most commonly served special population groups were low income/poor, children/youth, and families. “Other” populations served included individuals with substance use disorder and addiction, infants with Neonatal Abstinence Syndrome and their families, individuals with traumatic brain injuries and/ or intellectual and developmental disabilities, and persons diagnosed with HIV and/or hepatitis.
Choosing from a wide-ranging list of health issues, key informants were asked to rank order what they perceived as the top three health concerns impacting the population(s) they serve. An option to “write in” any issue not included on the list was provided. The top responses are depicted in the table below. The table is rank ordered by the percentage of respondents that selected the issue within the top three health concerns. The number of informants that selected the issue as the No. 1 health concern is also shown.
2019 CHNA Report DRAFT FOR REVIEW August 2019
Health Perceptions
Key informants were asked to similarly rank order what they perceived as the top three contributing factors to the health concerns they had indicated in the previous question. An option to “write in” any contributing factor not included on the list was provided. The top responses are depicted in the table below. The table is rank ordered by the percentage of respondents that selected the issue within the top three contributing factors. The number of informants that selected the issue as the No. 1 contributing factor is also shown.
to 100%. *Key informants were able to select multiple populations. Percentages do not add up to 100%.
Choosing from a wide-ranging list of health issues, key informants were asked to rank order what they perceived as the top three health concerns impacting the population(s) they serve. An option to “write in” any issue not included on the list was provided The top responses are depicted in the table below. The table is rank ordered by the percentage of respondents that selected the issue within the top three health concerns. The number of informants that selected the issue as the No. 1 health concern is also shown.
Correlation between the percent of informants selecting a health concern within their top three choices and the percent of informants selecting a health concern as their No. 1 choice demonstrates consistent perspectives regarding the top selection: drug use disorder. Nearly 75% of informants chose drug use disorder among the top three health concerns, and 50% of informants selected it as the No. 1 health concern. Overweight/ Obesity and diabetes were also selected as top three health concerns by one-third to one-half of informants, but only about 1 in 10 informants selected them as the No. 1 health concerns.
Correlation between the percent of informants selecting a health concern within their top three choices and the percent of informants selecting a health concern as their No. 1 choice demonstrates consistent perspectives regarding the top selection: drug use disorder. Nearly 75% of informants chose drug use disorder among the top three health concerns, and 50% of informants selected it as the No. 1 health concern. Overweight/ Obesity and diabetes were also selected as top three health concerns by onethird to one-half of informants, but only about 1 in 10 informants selected them as the No. 1 health concerns.
Top Health Concerns Affecting Residents
More than half of informants chose health habits (diet, physical activity) among the top three contributing factors to community health concerns, and 21% selected it as the No. 1 contributing factor. While fewer informants (47%) selected drug/alcohol use within the top three contributing factors, more informants selected it as the No. 1 contributing factor (27%). Poverty was the third ranked contributing factor by 37% of informants; 14% selected it as the No. 1 contributing factor.
*Key informants were able to select multiple health concerns. Percentages do not add up to 100%.
equity, but 21% “disagreed” or “strongly disagreed.”
Approximately 75% of informants “disagreed” or “strongly disagreed” that the community they serve is healthy and 71% “disagreed” or “strongly disagreed” that residents prioritize their health. Informants noted the negative impact of social determinants of health on residents, with more than 50% “disagreeing” or “strongly disagreeing” that residents can easily access public transportation or have access to affordable, nutritious ood. Safe housing and neighborhoods are also concerns with approximately 4 in 10 informants “disagreeing” or “strongly disagreeing” that they are available.
Approximately 35% of informants “agreed” or “strongly agreed” that residents can get help with social needs when they need it. More than half of informants “disagreed” or had neutral perceptions.
Informants were asked to share open-ended feedback about community health concerns and contributing factors. Many informants spoke to the impact of drug use disorder on the community, and among all generations. They identified a declining economy as one of the top contributors to drug use. Informants also identified the built environment as a contributor to drug use and other health concerns. The built environment includes access to healthy foods, safe options for exercise, quality housing, and transportation, among others. Low-income, poor, and working class individuals were seen as the most at risk for identified health concerns. Comments by key informants are included below.
• “Children have been most adversely affected by the mental health and substance use disorders of their parents and families. These adverse experiences in childhood increase the likelihood of early onset behavioral and physical health problems.”
• “Drug use continues to bring long term issues to our communities. Things we didn’t necessarily expect: For instance, an increase in the homeless population in our more urban areas.”
• “I believe our bleak economy has transformed our population from a people of hardworking independence to rampant hopelessness. We have also perpetuated a culture of relying on government assistance for survival. Now we have a couple of generations of Appalachians where the expectations are severely lowered.”
• “It is not easy to tell a patient to walk 30 minutes a day when it is very unsafe to walk alongside a road without an adequate shoulder or sidewalk.”
• “‘Mental health conditions are THE health problem in our area. This goes from depression/anxiety/trauma which then leads to overeating/obesity/addiction.”
• “People are simply ground down by poverty, discrimination, too obvious differences between ‘haves’ and ‘have nots’.”
• “Poverty affects citizens trying to access health care. They often don’t see a medical provider until they are very ill. Then guideline directed treatment is a challenge because new medications are expensive and they often choose between food or medicine… Unemployment may not be as big a problem as underemployment. There aren’t many high paying jobs in the community. Without the university and the health care industry, there isn’t much else out there for employment opportunity. I believe these problems have been existent for at least 10-15 years. When industries and plants started leaving the area, we saw an uptick in social issues.”
• “I believe we are making inroads on the reduction of drug use and poverty. The opioid and drug abuse epidemic is just so overwhelming it has crippled our systems. There are a lot of good people working to turn things around but it is just a massive job. The collateral damage of addiction and its effects on social problems is pretty catastrophic.”
• “Poverty or inadequate insurance is not just about those that are poor, it also includes the lower working class and some middle working class. These groups of people struggle to make ends meet, they often live paycheck to paycheck. Therefore they often delay medical care & treatment until it is too late. Poor home environments also play a role in the behaviors that children learn: bad diets, poor dental hygiene, sedentary life styles, etc.”
Key informants were asked to rate their agreement to statements pertaining to access to care and other community services using a scale of (1) “strongly disagree” to (5) “strongly agree.” Their responses are outlined in the table below.
The ability of residents to receive specialty medical care when needed received the highest mean score among access indicators. Residents experiencing equity received the next highest mean score. However, informants had differing perspectives on the percentage of residents experiencing equity. Approximately 53% of informants “agreed” or “strongly agreed” that residents experience equity, but 21% “disagreed” or “strongly disagreed.”
Approximately 75% of informants “disagreed” or “strongly disagreed” that the community they serve is healthy and 71% “disagreed” or “strongly disagreed” that residents prioritize their health. Informants noted the negative impact of social determinants of health on residents, with more than 50% “disagreeing” or “strongly disagreeing” that residents can easily access public transportation or have access to affordable, nutritious food. Safe housing and neighborhoods are also concerns with approximately 4 in 10 informants “disagreeing” or “strongly disagreeing” that they are available.
Approximately 35% of informants “agreed” or “strongly agreed” that residents can get help with social needs when they need it. More than half of informants “disagreed” or had neutral perceptions.
Informants provided the following comments related to community access.
• “Each county looks different in terms of community supports for families and services available. Some are very good and some are not. Many have difficulty accepting help.”
• “Healthy foods... residents need more education on exactly what healthy foods are. Lots of processed foods. Residents, especially elderly, don’t feel safe, because of the out of control drug use and crime in communities.”

• “I think most of what the community needs is available, but their barriers include unawareness and inability to navigate the system.”
• “It is harder to access services in rural locations. Sometimes this requires trips of 2 - 3 hours.”
• “Services are available for them but will they use it? Every single school located in Cabell County has a food and clothes pantry....from elementary to high school. All Cabell County schools qualify for all students to have free meals due to percentage of low income students.”
• “Substance use disorder clients have little or no access to medical care.”
• “This region is a mix from extreme poverty to better income levels. Some people live in more rural areas, and if they do not have dependable transportation, gaining access to some services can be challenging.”
Social Determinants of Health
Key informants acknowledged the impact of social determinants as key underlying factors of health issues within the community. Specific comments by informants are included below.
2019 CHNA Report DRAFT FOR REVIEW August 2019
Social Determinants of Health
Healthy People 2020 defines social determinants of health as conditions in the environments in which people are born, live, learn, work, play, worship, and age that affect a wide range of health, function, and quality of life outcomes and risks. Informants were asked to rate five community dimensions that most highly impact social determinants of health: economic stability; education; health and health care; neighborhood and built environment; and social and community context; using a scale of (1) “very poor” to (5) “excellent.”
Social Determinants of Health
Healthy People 2020 defines social determinants of health as conditions in the environments in which people are born, live, learn, work, play, worship, and age that affect a wide range of health, function, and quality of life outcomes and risks. Informants were asked to rate five community dimensions that most highly impact social determinants of health: economic stability; education; health and health care; neighborhood and built environment; and social and community context; using a scale of (1) “very poor” to (5 “excellent.”
The mean score for each dimension is listed in the table below in rank order, followed by a graph showing the scoring frequency. Mean scores were between 2.04 and 3.08 out of 5, with most respondents rating the listed dimensions as “poor” or “average.” Health and health care was seen as the strongest community dimension, while economic stability was seen as the weakest community dimension.
• “Environment crime is still an issue and transportation. In some cases patients travel >1.5 hours to see a specialist. Health literacy and comprehension are two different [things] yet of equal importance. Access is good to both health care and primary care, but health literacy still is average.”
Healthy People 2020 defines social determinants of health as conditions in the environments in which people are born, live, learn, work, play, worship, and age that affect a wide range of health, function, and quality of life outcomes and risks. Informants were asked to rate five community dimensions that most highly impact social determinants of health: economic stability; education; health and health care; neighborhood and built environment; and social and community context; using a scale of (1) “very poor” to (5 “excellent.”
The mean score for each dimension is listed in the table below in rank order, followed by a graph showing the scoring frequency. Mean scores were between 2.04 and 3.08 out of 5, with most respondents rating the listed dimensions as “poor” o “average.” Health and health care was seen as the strongest community dimension, while economic stability was seen as the weakest community dimension.
The mean score for each dimension is listed in the table below in rank order, followed by a graph showing the scoring frequency. Mean scores were between 2.04 and 3.08 out of 5, with most respondents rating the listed dimensions as “poor” or “average.” Health and health care was seen as the strongest community dimension, while economic stability was seen as the weakest community dimension.
Ranking of Community Dimensions Impacting Social Determinants of Health in Descending Order by Mean Score
Ranking of Community Dimensions Impacting Social Determinants of Health in Descending Order by Mean Score
• “I think several of these categories I would rank in between 2 and 3 simply because again while several in our populous are thriving, there are those still falling through the cracks. We can always find ways to make things better, I feel!”
• “Many of these problems are directly related to the breakdown in families that is multifactorial in origin.”
• “The rural communities are especially burdened by access barriers and cultural disparities in wellness.”
• “There are wide disparities based on which area of the community you live.”
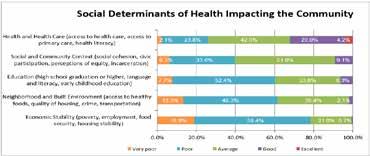
• “This is such a wide spectrum. Health care is there and available, people just have to use it and often they don’t. There are two groups of people, those that are good or excellent to all of the above and those that are poor or very poor to all of the above. Those that have the means and support do well. Those that don’t never get out of that dead end cycle of poor grades, poor health, low paying jobs, etc. A lot of it is due to their environment. An addict will never get better if he is thrown back into the same environment from which he came. The surroundings and expectations have to change.”
informants acknowledged the impact of social determinants as key underlying factors of health issues within the community. Specific comments by informants are included below.
• “Environment crime is still an issue and transportation n some cases patients travel >1.5 hours to see a specialist. Health literacy and comprehension are two different [things] yet of equal importance Access is good to both health care and primary care but health literacy still is average
• “ think several of these categories would rank in between 2 and 3 simply because again while several in our populous are thriving, there are those still falling through the cracks. We can always find ways to make things better, feel!
• “Many of these problems are directly related to the breakdown in families that s multifactorial in origin.”
• “The rural communities are especially burdened by access barriers and cultural disparities in wellness.”
• “There are wide disparities based on which area of the community you live.
• “This is such a wide spectrum. Health care is there and available, people just have to use and often they don't. There are two groups of people, those that are good or excellent to all of the above and those that are poor or very poor to all of the above Those that have the means and support do well. Those that don't never get out of that dead end cycle of poor grades, poor health, low paying jobs, etc. A lot of it is due to their environment. An addict will never get better if he is thrown back into the same environment from which he came. The surroundings and expectations have to change.”
Leveraging Community Resources to Impact Health
Key informants were asked what resources are missing in the community that would help residents optimize their health. Respondents could choose as many options as they saw as needed. Nearly 60% of informants chose mental health services and healthy food options as missing resources within the community. Substance abuse services and transportation options were also selected as missing resources within the community by more than 50% of informants.
Key informants were asked what resources are missing in the community that would help residents optimize their health. Respondents could choose as many options as they saw as needed. Nearly 60% of informants chose mental health services and healthy food options as missing resources within the community. Substance abuse services and transportation options were also selected as missing resources within the community by more than 50% of informants. Adult daycare providers rounded out the top five selections by informants with approximately 46% selecting it as a missing resource.
Adult daycare providers rounded out the top five selections by informants with approximately 46% selecting it as a missing resource. Top Missing Resources within the Community to Optimize Health
1
Specific comments related to missing resources in the community are included below.
Specific comments related to missing resources in the community are included below.
• “Given the various counties/communities served, not all have much needed services and the distance to find them is too great in some areas.”
• “Many elderly are raising their grandchildren due to drug addiction of the parents and there are not good options for childcare assistance.”
• “Given the various counties/communities served, not all have much needed services and the distance to find them is too great in some areas.”
• “Many of the issues associated with health care are consumer choice They were not raised to go to a doctor unless they were really sick due to the cost associated.
• “Most individuals never access these services because they have no one to advocate for them, like a care coordinator/case manager.”
• “Many elderly are raising their grandchildren due to drug addiction of the parents and there are not good options for childcare assistance.”
• “It seems that most resources now are focused toward addictions. That is good and needed but most of those people come from impoverished or poor living environments. If their living situations were better then chances are they would not have gotten involved in drugs to begin with. This is of course not all cases, but many. It also seems that those that work in these areas of services do not provide the best care. Social workers or those that follow up on issues seem to be overwhelmed. Teachers say that they have numerous children that need assistance. Maybe if we put more resources into the schools, social workers, nutritionists, nursing, we could change these bad habits when the kids are young. Get them started on the right track.”
• “Many of the issues associated with health care are consumer choice. They were not raised to go to a doctor unless they were really sick due to the cost associated.”
• “Most of the tems checked are available, but not to those who can't afford it. We need more free easy access and available services.”
• “[Need] outlets or exercise equipment for elderly or older adults who cannot afford a gym membership.
• “Substance abuse and substantive mental health service availability is poor in our area to say the least.”
• “Most individuals never access these services because they have no one to advocate for them, like a care coordinator/case manager.”
• “It seems that most resources now are focused toward addictions. That is good and needed, but most of those people come from impoverished or poor living environments. If their living situations were better, then chances are they would not have gotten involved in drugs to begin with. This is of course not all cases, but many. It also seems that those that work in these areas of services do not provide the best care. Social workers or those that follow up on issues seem to be overwhelmed. Teachers say that they have numerous children that need assistance. Maybe if we put more resources into the schools, social workers, nutritionists, nursing, we could change these bad habits when the kids are young. Get them started on the right track.”
• “Most of the items I checked are available, but not to those who can’t afford it. We need more free easy access and available services.”
• “[Need] outlets for exercise equipment for elderly or older adults who cannot afford a gym membership.”
• “Substance abuse and substantive mental health service availability is poor in our area to say the least.”
• “We have a lot of services. The main issue, in my experience, is that all of these services are not always communicated and streamlined.”
Informants were asked to rate regional health and human service providers on how well they are meeting the needs of residents, using a scale of (1) “very poorly” to (5) “very well.” Approximately 56% of informants rated providers as “average,” while 21% said they are doing “well” or “very well.”
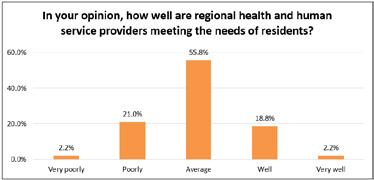
Informants were asked to share any other insights that could help improve health among residents across the region. Informants provided the following suggestions.
Informants were asked to share any other insights that could help improve health among residents across the region. Informants provided the following suggestions.
• “Focusing more on the social determinants of health and prevention measures. Promoting health vs. treating sick.”
• “Taking a very strong look at the organizations in the community and partnering with the ones that could provide the greatest benefit to the population.”
• “The population is aging and we need to look at resources to assist the elderly. Adult day care so people can work while their elderly parents with dementia or other health care needs are cared for. Transportation to get the elderly to their doctor’s appointments. We have the bus service but not everyone lives in town. Perhaps a mobile clinic that could go into rural areas and provide screenings, draw labs, allow the patient to be seen by a nurse practitioner or physician.”
• “We need to reach out to communities too poor to travel to health care.”
• “Focusing more on the social determinants of health and prevention measures. Promoting health vs. treating sick.”
• Health care options in our community are available due to the 2 local hospitals, and Marshall University Medical School. However, most of the resources are limited to those tha have health care insurance coverage.”
• Improving our health literacy is key. Public health strategies are needed for both physical and behavioral health issues.”
• More parks and activities in the area for families. Doesn't seem like many things for families to do.”
• “Health care options in our community are available due to the two local hospitals, and Marshall University Medical School. However, most of the resources are limited to those that have health care insurance coverage.”
• Start this process early…when the person is young. Put the resources in the schools. Don't wait and have to build numerous facilities for addictions. Stop it before it starts. Put these resources in the young life of the person. Children should have to keep their doctor appointments, dental appointments, etc
Key informants were asked to select the top three ways that residents learn about health services. Nearly three-quarters of informants selected word of mouth, and more than 50% selected doctor’s office/clinic and TV.
• Taking a very strong look at the organizations in the community and partnering with the ones that could provide the greatest benefit to the population.
• “Improving our health literacy is key. Public health strategies are needed for both physical and behavioral health issues.”
• “More parks and activities in the area for families. Doesn’t seem like many things for families to do.”
• The population is aging and we need to look at resources to assist the elderly. Adult day care so people can work while their elderly parents with dementia or other health care needs are cared for. Transportation to get the elderly to their doctor's appointments. We have the bus service but not everyone lives in town. Perhaps a mobile clinic that could go into rural areas and provide screenings, draw labs, allow the patient to be seen by a nurse practitioner or physician.”
• We need to reach out to communities too poor to travel to health care.
• “Start this process early…when the person is young. Put the resources in the schools. Don’t wait and have to build numerous facilities for addictions. Stop it before it starts. Put these resources in the young life of the person. Children should have to keep their doctor appointments, dental appointments, etc.”
*Other responses included social media, the school system, patient portals, managed care plans, the Emergency Department, and family and friends in the health field.
Wellness Programs Lastly, key informants were asked to rate their awareness of
Top Ways Residents Learn about Health
Wellness Programs
Wellness Programs
Lastly, key informants were asked to rate their awareness of select health and wellness programs offered by Cabell Huntington Hospital and St. Mary’s Medical Center. Approximately 80% of informants indicated that they were aware of Cabell Huntington Hospital’s Senior Services Program and more than 60% of informants indicated that they were aware of St. Mary’s Total Woman Program. Key Informant Survey findings were considered in conjunction with statistical secondary data to identify health priorities. Key Informant Survey data is valuable in informing community strengths and gaps in services, as well as wider community context for secondary data findings.
Lastly, key informants were asked to rate their awareness of select health and wellness programs offered by Cabell Huntington Hospital and St. Mary’s Medical Center. Approximately 80% of informants indicated that they were aware of Cabell Huntington Hospital’s Senior Services Program and more than 60% of informants indicated that they were aware of St. Mary’s Total Woman Program. Key Informant Survey findings were considered
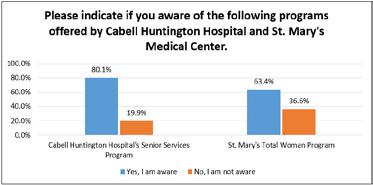
conjunction with statistical secondary data to identify health priorities. Key Informant Survey data is valuable in informing community strengths and gaps in services, as well as wider community context for secondary data findings.

Focus Groups were conducted with residents of the Mountain Health Service Area who had experience with chronic conditions and/or behavioral health comorbidities. The objectives of the Focus Groups were to define barriers to accessing health care services and disease management; assess attitudes and perceptions toward behavioral health and substance use disorder; and identify available and needed community supports to improve health. A total of 25 people participated in the Focus Groups.
Personal relationship and listening skills are the most valued characteristics of primary care doctors.
Huntington is well served by primary care doctors, and participants have options to find one that they like. Participants valued providers who take the time to listen and talk with patients and take a patient-centered approach to care. Participants also valued providers who oversee their care if they are in the hospital.
My doctor doesn’t go to the hospital. When go to the hospital, they don’t know me when I go in or when I leave. I would like one [a doctor] that goes to the hospital.”
“My last doctor had never had a weight problem and just told me to take a pill and count calories. I didn’t understand so I only ate one meal a day. My body was in starvation mode. My new doctor said, ‘lets talk about this.’ She gave me the tools to lose weight. She saved my life.”
“There’s tons of doctors in town. You doctor shop till you find a good one.”
Communication and accurate information sharing are central to building trust with patients.
Health care was seen as changing, limiting the amount of time that providers spend with patients and the amount of information and follow-up care that they provide. Participants equated lack of communication or miscommunication as provider’s lack of caring for their health.
“What was communicated to me was incorrect. It caused stress, unnecessary appointments, and cost. It ruined the trust.”
Patient advocates, care managers are needed to coordinate and monitor care instructions.
A few participants felt that they had to become their own health care advocates when seeking and receiving health care. Participants would prefer that primary care offices have a dedicated staff member to provide patient care instructions and coordination services.
“I take the word of my doctor as the word of God. My wife now comes with me to be my advocate. She asks the tough questions.”
“We need a liaison at the doctor’s office to explain care to you. There’s nothing like that.”
Participants are supportive of the local teaching hospitals and Resident physicians, but some fear they lose quality of care due to inexperience and rotating providers.
“It’s totally fine to have Resident physicians, but when tell them I’ve lost my quality of life, my independence, they seem to be uncertain.”
“Every doctor wants to do something different.”
“You lose continuity of care. I have to bring out my notebook about my condition at each visit. You can’t build a relationship.”
It’s difficult for patients to find Medicaid providers, particularly specialists.
The Medicaid approval process for specialty care is time intensive. Once approved, participants may travel outside of their county to find a provider who will accept their insurance, presenting transportation barriers. Participants recommended a volunteer specialty physician program within Huntington to meet the needs of Medicaid patients.
“If you have to go out of town for care, you have to get off work, you have to find a car. We’re poor. We had to figure it out or I wouldn’t make it.”
“These doctors are going elsewhere, like Doctors without Borders, but we have need here.”
Lack of Medicaid coverage for adult dental and vision care prevents patients from receiving these services.
Free or reduced cost services are offered by clinics like
“Ebenezer offers free dental care once per year. The parking lot opens at midnight, they start handing out tickets at 3 a.m., and it opens at 6 a.m. There are hundreds of people there.”
Health care costs were significant barriers to care. Participants were frustrated by health care costs, identifying out-of-pocket expenses as the primary reason for foregoing care or not following care instructions. Prescription costs, particularly for non-generic medications, were a top barrier for Medicaid patients. Seniors were among the most impacted by health care costs due to fixed incomes.
“If you don’t have insurance, you’re stuck. My husband could retire, but our deductible would increase to $2,300 for hospitalizations. That’s a big deal.”
“It can cost $1,400 out of pocket for non-generic meds. You just suffer instead.”
“Money is a major issue with your health. There are so many things, like dental care, that people living on social security can’t afford.”
Participants want a better understanding of their bills and payment options.
Participants had difficulty reading and understanding medical bills, including their financial responsibility and the collection process for overdue bills. Clearly itemized medical bills outlining specific charges were preferred.
Affordable senior care options are missing services in the community.
A few of the participants were caregivers for senior family members. These participants identified a lack of dementia services and resources, as well as affordable assisted living and nursing homes. One participant also identified the need for advocacy services to protect the rights of seniors who are cognitively impaired and/or living in residential care.
“Dementia is affecting people across the community, but they don’t know the signs and symptoms.”
“It’s $5,700 or more per month for residential care. I’m looking around now to see where can get money to pay these people. I’m lucky I have assets, but what do other people do?”
“My wife has late stage Alzheimer’s. I’ve learned with mental diseases, you don’t know where to go to get help.”
Substance use disorders are becoming destigmatized from communication and intervention, but other behavioral health diseases are still stigmatized.
According to participants, the community’s focus on improving the opioid epidemic has sometimes shifted attention away from other behavioral health concerns. Participants noted they are uncomfortable talking about their behavioral health due to fear that others may “lump them in with the addicts” or label them as “crazy.”
“Addicts are a community banded together. It’s not that way for mental health patients.”
“It’s [behavioral health] still taboo, even in the medical community.”
“Mental health is just as important to me as my physical health. In our current socioeconomic climate, it’s easy to ignore your mental health.”
The majority of participants are screened for behavioral health by their primary care provider, but stigma and perceived lack of support precludes them from answering questions honestly.
Some participants would prefer that behavioral health screening questions be asked as part of the patientprovider interview. Others would feel targeted by a direct conversation and prefer the questionnaire.
“It’s too easy to lie. Most people lie.”
“You’re filling out a piece of paper [screening] and handing it to someone. Who’s going to see it, what are they going to do with it?”
The option to meet with a behavioral health professional during primary care visits is valued by some. The Marshall Health ALS Clinic was seen as a model for integrated physical and behavioral health care.
“If was having issues, I would like to have someone at the end [of my appointment] to talk to.” Other participants, “Just want to go home at the end.”
Participants saw inequity in the number of resources aimed at opioid use disorder, while individuals with other substance use disorders or behavioral health concerns struggle to access care.
“Doctors are scared to death of the addiction problem. I have back problems and no one is doing anything. If told them I was an addict, they would be pulling out their hair to help me.”
“If there’s a lack in the medical field, it’s in the mental health field.”
“There is a whole response team for individuals who overdose, but there’s nothing for alcoholics. I went to jail, but if you overdosed, they’ll revive you and get you back on your feet.”
The community has made huge strides in addressing the opioid epidemic. Additional steps are needed to support long-term recovery.
Narcan availability, lack of recovery houses, and lack of opioid-free, safe spaces are current barriers to long-term recovery.
“For recovery, you need to get away from people who are using. But there’s nowhere to go to get away from it.”
“People aren’t afraid to die because we’ve got Narcan. If want to get high, it’s okay because someone will bring me back.”
“They sleep four to a bedroom at recovery houses.”
New opioid prescribing practices are a barrier to receiving pain medication.
Participants with chronic pain had trouble obtaining prescription opioids, and perceived that they were stigmatized or labeled as addicts for seeking pain medication. Alternative pain management options were seen as either ineffective or not offered by providers.
“I’m a legal opioid user. People look at you funny when you say you’re on opioids. They think you’re a drug addict.”
“I’m not asking for pain medication, I’m just asking to not be in pain.”
Affordable, safe housing is a missing resource in the community.
Residents who are not able to afford to own their home choose between high rent costs or unsafe living conditions.
“You can either buy or rent and pay $1,900 for a nice unit. There are places to rent for $400 per month, but nothing is fixed or updated. You either get a slum lord or pay a fortune for where you live.”
Community resources to address food insecurity are available, but fresh fruits, vegetables, and meats are limited.
Access to healthy foods was seen as key to promoting mental wellness. Participants recommended more community gardens, as well as partnerships with local businesses to donate leftover fresh foods, to address fresh food access.
“Eating healthy helps you with a lot of mental issues, but you can’t afford it. There’s not a lot of money in Huntington.”
“Food pantries give you a bunch of foods that don’t go together or are expired. You never get fresh stuff or meat. People fight over canned meat.”
“People dig through the dumpster at Aldi’s because they throw away a lot of produce.”
Senior exercise and wellness programs offered by Mountain Health are valued by residents.
Seniors who use these programs recognized the physical health benefits, as well as the impact on social connectedness. To improve these options, seniors would like to see more indoor pools and aquatic classes for lowimpact activities.
“I had no idea how much better I would feel before I got into an exercise program.”
“The exercise program has been my lifesaver.”
Affordable, safe recreation outlets are needed for residents of all ages.
The cost of gym memberships is covered by Medicare, but not Medicaid. Many Medicaid patients cannot afford gym memberships and are unaware of free options. Public parks were perceived as unsafe due to potential needle sticks.
“A lot of doctors say you should exercise, but I can’t. Let me go spend money don’t have on the only indoor pool in town.”
“You can’t walk across the park barefoot like you used to. The needles have gotten better, but you still don’t feel safe.”

Time constraints, physical limitations, and lack of motivation are top barriers to regular exercise.
Comradery and competition were seen as successful tactics for engaging residents in exercise. For seniors, participants recommended more age-friendly exercises to account for physical limitations.
“As you get older, you find yourself being more alone because your friends can’t participate with you. I do so many things alone.”
“How are they going to incentivize me enough to come and engage me enough to stay? It’s easier to be distracted and to say ‘no’ to healthy eating and exercise.”
“The first time I was on an elliptical, I could only go for 30 seconds. But saw my friend going for 30 minutes and it pushed me.”
Support groups are seen as valuable for health information sharing, health behavior change.
Participants preferred support groups that were specific to their condition. Some participants also preferred support groups that were led by a health professional and included education and live demonstrations. A few participants used online support groups when in-person options were not available.
Focus Group findings were reviewed with the CHNA committee and correlated with statistical secondary data and Key Informant Survey findings to inform priority health needs and community health improvement strategies.
Research from the CHNA was presented at the session with audience discussion and questions. Discussion culminated with a live voting session for participants to rank community health needs based on defined criteria. Following the ranking of the community health priorities, participants were divided into small groups for in-depth discussion of priority areas.
Prioritization of Identified Community Needs
A list of four key community health needs derived from an analysis of the CHNA research was presented to Regional Health Summit participants. The table below shows these four health needs and contributing factors and opportunities for improvement. Social determinants of health were considered key contributors across all health issues.
The third annual Regional Health Summit was held at the St. Mary’s Conference Center in Huntington, WV. The twoday event included a CHNA Partner Forum on Wednesday, May 8, 2019 and local, state, and national speakers on Thursday, May 9. This year’s theme was “Shaping Stronger Communities.”
The following report is a summary of the May 8, 2019 CHNA Partner Forum. A total of 91 people attended the Partner Forum representing Mountain Health and regional health and social service agencies, senior services, local government, and civic organizations. The objectives of the forum were to share data from the CHNA and garner feedback on community health priorities, as well as opportunities for collaboration among partner agencies.
Research from the CHNA was presented at the session with audience discussion and questions. Discussion culminated with a live voting session for participants to rank community health needs based on defined criteria. Following the ranking of the community health priorities, participants were divided into small groups for in-depth discussion of priority areas.
Prioritization of Identified Community Needs
A list of four key community health needs derived from an analysis of the CHNA research was presented to Regional Health Summit participants. The table below shows these four health needs and contributing factors and opportunities for improvement. Social determinants of health were considered key contributors across all health issues.
Identified Community Health Needs and Contributing Factors Across the Tri-State Region
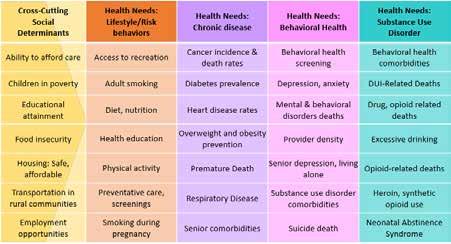
To prioritize the identified health needs, consultants led the participants through facilitated discussion to define the areas that most impact resident health. Through large group discussion, participants identified the following health needs as top priorities for the Tri-State region:
• Behavioral Health
• Cancer
• Chronic Obstructive Pulmonary Disease (COPD)
• Diabetes • Domestic Violence
• Heart Disease
• Infectious Disease
• Neonatal Abstinence Syndrome (NAS)
• Substance Use Disorder • Suicide • Tobacco
Priority Issues Ranking
Consultants then led participants through a live voting exercise to rank the priority health issues by rating each need on a scale of 1 (low) to 4 (very high). Each issue was scored independently for the following criteria:
Scope: How many people are affected?
• Widespread or affecting few individuals
• Inequities or disparities among residents
Severity: How critical is the issue?
• Cost or burden of the issue on the community (e.g. dollars, time, social)
• Negative outcomes or causes harm
Ability to Impact: Can we achieve the desired outcome?
• Resource availability
• Known practices to address the issue
• Short-, medium-, or long-term outcomes
Community Readiness: Is the community prepared to take action?
• Supportive leaders or policy makers
• Prevailing attitude of the community toward the issue
• Community capacity
Community Health Priorities
Results from the live voting, as shown below, were shared with the participants. Across most issues, “ability to impact” and “community readiness” scored lower than “scope” and “severity,” pointing at the need for increased resources, learning, and policy to address these needs.
instructed through a three-part facilitation that asked
Following the voting exercise, volunteer facilitators led table discussions for the top five priority areas. A common discussion guide was used to capture participant insights.
Participants were instructed through a three-part facilitation that asked them to:
1) Define how the issue impacts the community
2) Describe a vision of community if the issue were met
3) Outline actions needed to achieve the vision
The following section summarizes key themes and specific comments from the small group discussion across the top five priority health needs.
Impact of issue on community
• Overdose deaths due to synthetic opiates are increasing, while deaths due to prescription opiates are decreasing
• Overdose death data only captures accidental overdose deaths; the death rate is likely higher when considering suicides related to overdose
• The premature death rate is increasing and life expectancy is decreasing due to overdose death
• Community-wide Narcan availability may be the root cause of fewer overdose-related EMS calls
• Methamphetamine, fentanyl, and kratom are more readily available than heroin
• Need to address polysubstance abuse as well as alcoholism, DUI-related deaths
• Families and children are among the most impacted by SUD
• Communities across the Tri-State region are dealing with similar SUD-related issues
Vision of community if need was met:
• Affordable insurance coverage, Medicaid waiver program for SUD treatment services
• Everyone who wants help, can get help, even in the most underserved counties
• A stronger economy, supported by an engaged workforce
• Higher life expectancy, fewer deaths among young people
• Lower prevalence of depression
• Stronger nuclear and extended families
• Reduced stigma associated with SUD; positive recovery stories are highlighted
• Open-mindedness to hiring people with SUD; increased employment of individuals in recovery
• Community focus on retention of SUD recovery
Actions to achieve vision:
• Engage partners to work to provide safe, affordable recovery housing
• Engage the Governor’s Taskforce on Substance Abuse to better understand current and planned initiatives, foster collective impact
• Work with partners to focus on growing the economy, job opportunities, and education for all residents
• Continue working through PROACT to enhance economic opportunities to individuals leaving SUD treatment; partner with businesses to promote hiring of these individuals
• Support the West Virginia Second Chance Bill, allowing individuals convicted of nonviolent misdemeanors to petition to have their record expunged
• Identify and promote best practice solutions for addressing SUD
• Support individuals in recovery, promote long-term intensive recovery
• Engage all “change-makers” (politicians, faith-based communities, businesses, educators, and residents) to create buy-in for SUD initiatives, prevent future road blocks
• Engage West Virginia Department of Health and Human Resources, West Virginia Bureau for Behavioral Health, and Governor Jim Justice (“Jim’s Dream”) as partners
• Develop a Peer Recovery Coach model to support individuals in SUD treatment
Impact of issue on community
• Stigma, difficulty in accessing and navigating the health system, and lack of transportation prevent people from receiving care
• Loss of youth, children to mental health disorders
• Lack of adequate providers, funding for behavioral health services
• Lack of treatment options contributes to self-medication with substances, runaways
• Need to focus on solution and the problem: define “mental wellness” as well as “mental health”
• Need to engage community partners in long-term solutions; there is no “quick fix”
• Need to address abuse and violence as comorbidities
• Families of individuals with behavioral health disorders are often not engaged in the treatment process
• Social determinants of health, particularly poverty, contribute to behavioral health needs
• Need for peer support programs for individuals in recovery
Vision of community if need was met:
• No stigma related to behavioral health conditions; normalized behavioral health experience
• Behavioral health has the same emphasis, importance as physical health; seen as playing a central role in all aspects of wellness
• Immediate access to services when needed, regardless of social determinants of health
• Policies and legislation support behavioral health funding, services
• Availability of behavioral health providers meets the demand for services
• Mental wellness seen as a lifelong journey, supported by the community
• Integrated locations for behavioral health services within schools, medical community
• Youth feel safe in their community, and are free from violence or abuse
• Stronger, more cohesive family structures
Actions to achieve vision:
• Engage policy makers to identify new, affordable payment structures for mental health services
• Promote resiliency, coping mechanisms for prevention and treatment; start with children
• Engage immediate and extended family members in treatment and recovery process
• Implement behavioral health workforce recruitment strategies
• Address personal safety issues (“Good Touch, Bad Touch”) within schools
• Engage health insurance providers, policy makers as partners to improve access to services
• Engage employers as mental health partners to improve “bottom line,” workforce productivity
• Engage schools as active behavioral health educators, providers of student services
• Leverage the faith-based community in promoting mental wellness, access to services
• Provide community education for identifying behavioral health symptoms, resources
• Identify grants, other funding opportunities to support community initiatives
Impact of issue on community
• Communities of color are disproportionately impacted by diabetes prevalence, death rates
• Diabetes is hereditary, impacting multiple generations
• Increasing prevalence of type 2 diabetes among children under 3 years
• Decline in family structure and time constraints contribute to poor dietary habits
• Cost of nutritious foods prevents people from eating healthy diets; single parents and grandparents raising grandchildren are most impacted
• Lack of community nutrition education
• Lack of transportation to grocery stores is a barrier to accessing healthy foods, particularly in rural communities where local grocery stores have closed
• Economic impact of missed days of school or work
• Lack of basic housing, including refrigeration, limits access to insulin
Vision of community if need was met:
• Healthier communities and residents overall; stronger family units
• Health education classes, physical education integrated into the student curriculum
• Community-wide safe places for youth exercise
• Available healthy activities for families; social connectedness
• Patient-centered care approach to diabetes prevention, management
• Reduced stigma associated with diabetes
Actions to achieve vision:
• Work with and encourage Dollar stores and other local, discount providers to offer fresh, healthy foods
• Work with and encourage school systems to offer nutrition education, healthy food preparation in schools, e.g. Life Science classes
• Leverage the Appalachian Diabetes Coalitions to offer healthy lifestyles courses, physical activity opportunities (e.g. walking challenge) in schools; involve families in these efforts
• Evaluate feasibility of hiring or work with FaithHealth Appalachia to develop a cohort of volunteer Community Health Workers to conduct regular patient check-ins, assessments
• Offer free, drop-in clinics for A1c testing
• Develop a community awareness campaign on diabetes, healthy lifestyles
• Engage businesses as partners in promoting healthy lifestyles, managing diabetes
• Increase awareness of available diabetes management programs offered by insurance providers
• Promote joint efforts among health and human service partners to address diabetes prevention
• Implement a community program, similar to “Neighborhood Watch,” for residents to identify and support healthy lifestyle needs
Impact of issue on community
• The prevalence of heart disease is underreported due to the reporting of other, comorbid diagnoses as the primary diagnosis
• Heart disease is typically seen among older adults, but starts in middle adulthood
• Late detection, disease mismanagement contributes to higher acuity patients
• Men and women are equally affected, but men are less likely to receive early, proactive care
• Poor health outcomes are driven by obesity and underlying socioeconomic factors
• Rural communities are disproportionately affected by poor health outcomes due to lower health care access
• Heart disease impacts mental wellness; mental disorders are often co-occurring conditions
• Community perception of heart disease fatalism
Vision of community if need was met:
• A community focused on prevention of heart disease, healthy lifestyles
• All residents have access, awareness, and affordability for disease prevention and health care
• Healthy choices are easy choices, driven by a community culture of health
• Workplaces that support and incentivize healthy employees
• Early identification, management of heart disease
• Increased physical activity among youth
• Cohesive disease management approach by health care, social service, and education providers
• Heart disease is no longer seen as an inevitable outcome of aging
Actions to achieve vision:
• Focus funding on prevention efforts for youth; improve nutrition and physical activity
• Address heart disease from a whole-family approach, assisting adults with heart disease manage their condition, while preventing future heart disease among their children
• Address social determinants of health as underlying factors for disease prevalence, management
• Engage schools, churches, FaithHealth as partners in prevention
• Evaluate feasibility of hiring or work with FaithHealth Appalachia to develop a cohort of volunteer Community Health Workers with lived experience to assist in disease management
• Partner with employers to incentivize employees to be healthy, manage their heart disease
Impact of issue on community
• NAS is a standalone issue, but also directly related to SUD and behavioral health issues
• The long-term health outcomes of NAS are still unknown
• NAS is often misdiagnosed at the time of birth
• Lack of consistency among providers in documenting NAS diagnoses
• Medication assisted treatment (MAT) for mothers with SUD may cause NAS symptoms
Vision of community if need was met:
• Decreased prevalence of NAS due to decreased prenatal exposure
• Family members are prepared for the signs and symptoms of NAS, and the appropriate response
• Reduced stigma associated with NAS support services
• The long-term health outcomes of NAS are known and addressed in treatment
• Consistent diagnosis criteria and provider consistency in documenting NAS
• The needs of babies, the mother, and other caregivers are met
Actions to achieve vision:
• Engage front-end staff, OB/GYN offices to screen for NAS and document occurrences
• Provide rooming-in opportunities for babies with NAS and their caregivers to improve outcomes, and learn the signs and symptoms of NAS
• Offer NAS education for caregivers to recognize the signs and symptoms of NAS
• Develop consistent NAS diagnosis reporting system; incentivize providers to document NAS
• Define treatment protocols for pregnant women seeking MAT to limit the risk of NAS symptoms
Impact of issue on community
• Affects all populations from prenatal to adulthood
• Increased prevalence of chronic conditions, particularly COPD and emphysema
• Nicotine is a gateway drug to use of illicit substances
• Vaping is increasing among youth; vaping devices are not easily identifiable
• Difficult to enforce anti-tobacco policies, particularly in rural areas where use is socially acceptable
• Employer bans on smoking are not reducing smoking rates; employees smoke in their cars
• Policies to ban smoking within proximity to public buildings are not enforced
• Health behaviors, like smoking, are difficult to impact; change is slow
• Individuals in poverty are among the most likely to initiate smoking
• Individuals with behavioral health and/or SUDs selfmedicate with tobacco
• Potential legalization of marijuana presents the need for more prevention efforts
• Tobacco cessation resources are available, but underutilized by both adults and youth
Vision of community if need was met:
• Decreased initiation of tobacco by youth
• Decreased prevalence of chronic conditions
• Reinforced support, funding for tobacco prevention and cessation
• Lower initiation of use of illicit drugs
Actions to achieve vision:
• Educate parents, communities on available vaping devices, and how to recognize them
• Support the West Virginia Senate bill to increase the age for tobacco use from 18 to 21
• Initiate a tobacco, vaping public education campaign
• Increase copays, other health insurance costs for tobacco use
• Plan for alternative revenue streams when tobacco tax dollars decline due to lower smoking rates
• Work with rural community partners to change the culture of acceptance for tobacco use
• Engage key influencers (restaurants, physicians, law makers, hospitals, recreation commissions) to enact and enforce policies that limit tobacco use
• Allocate school education funds to tobacco prevention programs, as well as behavior modification programs for youth who have initiated smoking
Regional Health Summit findings were reviewed with the CHNA committee and correlated with statistical secondary data, Key Informant Survey findings, and Focus Group feedback, to inform priority health needs and community health improvement strategies.
Cabell Huntington Hospital identified and prioritized significant community health needs in 2016 to guide community benefit and population health improvement activities across our service area. The plan built upon past efforts and led to the development of goals and objectives to improve access to care, chronic disease management and prevention, and behavioral health.
The hospital identified access to care as an overarching priority for the 2016-2019 Implementation Plan, addressing it as a cross-cutting strategy for all other priority areas. The following details progress in those areas since 2016.
Goal:
Improve access to comprehensive, quality health care services.
Objectives:
• Conduct a health care summit with other providers to identify health care access needs, resources and opportunities
• Summit outcomes may lead to an increase in the proportion of individuals who have a specific source of ongoing care
• Summit outcomes may lead to a reduction in the proportion of persons who are unable to obtain, or experience a delay in obtaining, necessary medical care
Strategies:
Collaborate with community partners to provide primary, preventative care in communities
o On June 1-2, 2017, CHH held the first Regional Health Summit, bringing together over 150 health care and public health professionals, nonprofit and academic partners, state governmental officials, and elected officials as key stakeholders representing more than 40 organizations from 21 counties in the Tri-State region of Kentucky, Ohio, and West Virginia. The central purpose of the Summit was to strengthen strategic efforts across health care, public health, and community organizations to improve health, wellness, and prevention efforts by enhancing multi-sector collaboration at a regional level. Keynote speakers focused on access to care from national and local perspectives. The Summit’s focus was to build strategy around population health, focused on four key themes of access to care, behavioral health and substance abuse, chronic disease, and data and technology.
o A Regional Health Summit Workshop was conducted on August 22, 2017 in partnership with Marshall Health to host a keynote speaker from Christiana Care Health System in Delaware. The session focused on the Project Engage Model to identify persons with addictions in the hospital setting, treat addiction withdrawal, and link persons to recovery services.
o On September 11, 2017, a Summit team of more than 50 individuals from CHH, Marshall Health, SMMC, and key community partners initiated strategic planning for the first Project Engage Program in West Virginia, which began in summer 2018.
o October 22-24, 2017, a Regional Health Summit Team traveled to Wake Forest, North Carolina, to attend their FaithHealthNC Learning Forum and meet with members of the FaithHealthNC Team at Wake Forest Baptist Medical Center. A collaborative partnership was established with Wake Forest Baptist Medical Center’s FaithHealth Program to evaluate an innovative strategy for identifying and linking people to needed health care and other services. From this partnership, FaithHealth Appalachia was established, based on the FaithHealth Model, as a key strategy to increase access to medical care and other services. The FaithHealth Appalachia Executive Director, an employee of CHH, was hired on November 30, 2018, and the FaithHealth Appalachia Board of Directors was established in April 2019. The organization is currently undergoing approval to become a 501c3. For more information about FaithHealth Appalachia, reference Appendix E.
o In December 2017, in partnership with Marshall Health and SMMC, Health Summit Grand Rounds were held to focus on the Project Engage Model. This effort served as an initial orientation and training of medical, nursing, case management, and social work staff about the concepts and foundation of Project Engage. More than 50 physicians, residents, and medical students, as well as 120 nurses attended.
o In January 2018, a FaithHealth Learning Forum and Asset Mapping and Capacity Building Workshop took place in partnership with the Cabell-Huntington Health Department to focus on building relationships based on the strengths of congregations, aligned with the strengths of health systems. From these workshops, the FaithHealth Appalachia Advisory Group of 18 Summit partners was established.
o In April 2018, PROACT (Provider Response Organization for Addiction Care and Treatment) was announced as a community-based center and one-stop shop for individuals seeking SUD treatment and recovery services. More than $3 million was committed to support the initiative. PROACT officially opened in October 2018. An open house and dedication ceremony was held on November 7, 2018, with more than 150 people touring the facility. PROACT’s goal is to provide individuals and their families with a viable system that provides positive outcomes. The center functions as the centralized hub for treatment, recovery, therapy, education, research, workforce opportunities, and support for those affected by addiction. PROACT aims to improve and increase access for patients dealing with SUD as well as provide the necessary support for all community physicians treating patients with the disorder. Between October 1, 2018 and May 31, 2019, 672 unique individuals received services at PROACT.
o In May 2018, Jerome Adams, MD, the U.S. Surgeon General was the keynote speaker for Day One of Working across the Region to Create Meaningful Change. The Surgeon General also toured the CHH Neonatal Therapeutic Unit and Lily’s Place. Tony Buettner, Senior Vice President of Business Development at Blue Zones, was the afternoon keynote speaker.
o In August 2018, the Regional Health Summit hosted a special event with keynote speaker Dr. Robert Redfield, Director of the Centers for Disease Control and Prevention. The Summit meeting also highlighted a speaker panel on The Huntington Community Response to the Opioid Crisis. More than 200 broad-based partners attended the event, including but not limited to, representatives from law enforcement, first responders, health care providers, health care system/hospital staff, public health, non-profit organizations, community health centers, and academic partners.
o In May 2019, the Regional Health Summit offered a half-day CHNA Workshop, sharing secondary research findings with attendees and prioritizing community health needs through large group discussion, live voting, and focus groups. On the second day, the Regional Health Summit attendees heard speakers from the American Hospital Association, the WV Department of Health and Human Resources, the Appalachian Regional Commission, and panel discussions including an economic development panel and Huntington’s Road to Recovery (substance abuse) panel.
A summary of Regional Health Summit agendas and participating partners is included in Appendix C.
o CHH, in partnership with Marshall Health, began making house calls in 2018. CHH Home Care Medicine provides pre and post-acute care for homebound patients ages 18 and older, throughout the Tri-State. Skilled and highly trained physicians and nurse practitioners provide many of the same services received in a physician’s office within the comfort of the patient’s home.
Enhance partnerships with community agencies to support behavioral health treatment services
The Hoops Family Children’s Hospital at CHH opened the Child Advocacy Center (CAC) to offer children and families compassionate care to reduce the trauma often experienced by children who are victims of abuse. The CAC is a safe, child-friendly place for children to speak with trained professionals and medical providers. A thorough evaluation with the children is conducted to identify the appropriate care and services needed. Children share their story to a trained interviewer and then, based on that interview, a team of professionals make decisions together on how best to help the child, alleviating the need for a child to tell their traumatic story over and over to doctors, law enforcement, investigators, and others. Services may include therapy, courtroom preparation, victim advocacy, and medical exams. Between September 2017 and June 2019, 332 children were served by the CAC.
Provide disease-specific community-based screenings, targeting underserved and at- risk populations
o Healthy numbers blood profiles are offered to community members for $25 during the months of October, January, April and July each year. A1C tests are provided free (with coupon). Hemoglobin A1C tests are offered each February and March.
o In partnership with Marshall Health, CHH opened the Center for Healthy Aging and the Senior Pain and Wellness Center.
o CHH continues to financially support Ebenezer Medical Outreach (EMO) with more than $40,000 each year. EMO is a full service medical clinic that provides services to the working uninsured of the Tri-State region of West Virginia, Kentucky, and Ohio. EMO provides access to primary and specialty health care for financially eligible patients as well as prescription assistance, a dental clinic and education, counseling, and screening referrals for breast, cervical, ovarian, and prostate cancers.
o Resulting from its involvement with the Fairfield Alliance, which consists of more than 40 members from local, state, and federal organizations working together for the betterment of the Fairfield neighborhood where CHH is located, CHH established a $1 million endowment for the AD Lewis Center in FY 2017. The donation will be used to support enrichment and mentoring programming for the children and young adults of the Fairfield neighborhood.
o In FY 2017, CHH provided free screenings, education, and outreach to nearly 9,500 people and donated $336,400.50 in in-kind labor and supplies.
o In FY 2018, CHH provided free screenings, education, and outreach to more than 16,350 people and donated $324,842 in in-kind labor and supplies.
o Community building, in the form of greater than $1.4 million, was provided for economic development to Huntington Area Development; community support, such as funding playgrounds and parks to keep children active; donation of trauma kits for the safety of police, and community health improvement through Huntington’s Kitchen, YMCA Kids in Motion, Shepherd’s House Recovery Program, and the Children’s Play Space at the Huntington Mall.
o In 2018, CHH expanded lab services to include toxicology for drug screenings, confirmations, and secondary analysis using different technology to identify specific drugs, their levels, and other more minute aspects of the initial drug screening. This is significant not only in providing more timely and precise results, but also allows this important service to be provided in WV. Previously, all drug testing confirmations in WV were outsourced to vendors in a number of states. Officials estimate that approximately $120-$140 million (in health care costs) is exported. With the addition of the new CHH laboratory, those health care dollars will stay in the state. The new toxicology lab, developed in collaboration with Marshall University’s nationally recognized Forensics Science Graduate Program, assisted in the region’s response to the opioid epidemic by offering a full range of toxicology lab services.
Provide insurance enrollment and information assistance at the hospital and in partnership with community agencies
o CHH is dedicated to providing assistance for emergency and other medically necessary care to anyone in need regardless of their ability to pay. CHH strives to ensure the financial capacity of people who need medical services does not prevent them from seeking or receiving care. Financial counselors in the main registration area are on hand Monday through Friday from 8 a.m. to 5 p.m. to address concerns or may be reached by phone.
o In 2018, in an innovative regional partnership, Marshall Health, Huntington Internal Medicine Group (HIMG), and CHH, joined to create MHC Accountable Care Organization, LLC MHC ACO) to participate in the Medicare Shared Savings Program (MSSP). As part of the MSSP, partners will work with other health care providers to ensure that traditional Medicare patients in the Tri-State region attributed to MHC ACO receive the right care, in the right place, at the right time.
Priority Area: Chronic Disease Prevention & Management
Goal:
Reduce causes of death and positively impact the rates of chronic disease in the CHH service area.
Objectives:
• Provide community education and outreach that promotes chronic disease prevention
• Provide knowledge and education to help reduce prevalence of obesity for those at risk or diagnosed with chronic conditions
• Provide awareness and knowledge as well as work with community partners to reduce the initiation of tobacco use among children, adolescents, and young adults
Strategies:
Continue to host senior-specific programming (e.g. SeniorFest, Senior Focus Fridays, and SeniorWise) to provide health education, screenings, and services that support a healthy lifestyle
o On July 30, 2018, Senior Services launched a unique non-contact exercise program, Rock Steady Boxing, based on training used by boxing pros and adapted to people with all levels of Parkinson’s disease. The goal of the program is to help patients stay active and reduce their Parkinson’s disease symptoms. Two members of Senior Services and two YMCA trainers are certified trainers of Rock Steady Boxing.
o CHH worked with Marshall University to open the new Marshall Senior Pain & Wellness Center in 2018.
More than 360 classes for the community were held at Huntington’s Kitchen
o CHH Senior Services holds SeniorFest each fall. The senior health fair offers free flu shots, various screenings including blood pressure, blood sugar, and prostate exams, and health education seminars. In 2018, there were 2,142 attendees, and staff provided 1,087 free flu shots and 175 free prostate exams. The screenings found 45 people who required follow-up appointments after the prostate exams, 19 follow-up joint replacement appointments, and 60 colonoscopy appointments. Ten people were connected to home care. SeniorFest attendees who completed the event survey identified the following unmet community health needs: routine check-ups (35.02%); food insecurity/hunger (28.62%); place to walk/exercise (27.95%); and access to care/transportation (26.09%). Multiple responses were allowed.
Provide education about healthy lifestyles and chronic disease prevention at Huntington’s Kitchen through community events and education
o More than 360 classes for the community were held at Huntington’s Kitchen in FY 2017, FY 2018, and the first three quarters of FY 2019.
o Huntington’s Kitchen class participant evaluations from FY 2017 – FY 2019 showed a good mix of first time attendees (58%) and return participants (42%).
o Word of mouth about Huntington’s Kitchen is positive and the method by which 45% of evaluation respondents learned of events at the Kitchen. An additional 35% learned of events online via website or email.
o 54% of evaluation respondents live in Cabell County, 16% in Lawrence County, Ohio, 15% in Wayne County, and 15% in other counties in the Tri-State region.
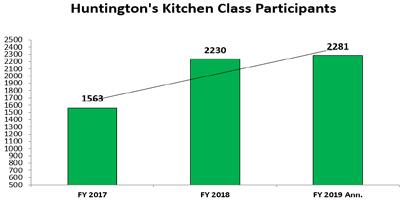
o Evaluation respondents identified in these age cohorts: <35 years old (34%); 35 to 49 years old (27%); 50 to 64 (25%); and 65+ years old (13%).
o Huntington’s Kitchen class participant evaluations from FY 2017 – FY 2019 showed a good mix of first time attendees (58%) and return participants (42%).
o Word of mouth about Huntington’s Kitchen is positive and the method by which 45% of evaluation respondents learned of events at the Kitchen. An additional 35% learned of events online via website or email.
o Participants were asked: What will you start doing tomorrow as a result of taking this class?
Top Responses include
o 54% of evaluation respondents live in Cabell County, 16% in Lawrence County, Ohio, 15% in Wayne County, and 15% in other counties in the Tri-State region.
o Evaluation respondents identified in these age cohorts: <35 years old (34%); 35 to 49 years old (27%); 50 to 64 (25%); and 65+ years old (13%).
o Participants were asked: What will you start doing tomorrow as a result of taking this class?
• Cooking classes: cook more at home and eat out less often; cook healthier meals at home and have my children help me cook; control salt/sodium intake; meal-prep and freeze meals ahead of time; and incorporate more vegetables into our meals.
§ Top cooking class participant answers included: cook more at home and eat out less often; cook healthier meals at home and have my children help me cook; control salt/sodium intake; meal-prep and freeze meals ahead of time; and incorporate more vegetables into our meals.
• Senior Focus Friday: adopt a healthier lifestyle by exercising more and watching diet; train my brain through activities; take advantage of free health screenings when offered; make sure I keep my doctor appointments; and monitor my weight on a daily basis.
§ Top Senior Focus Friday participant answers included: adopt a healthier lifestyle by exercising more and watching diet; train my brain through activities; take advantage of free health screenings when offered; make sure keep my doctor appointments; and monitor my weight on a daily basis.
• Dining with a Doc: look into genetic testing; eat more plant-based foods; try to lose weight (“I didn’t know 10 pounds of weight was 3x more on the joints”); check websites to learn more.
§ Top Dining with a Doc participant answers included: look into genetic testing; eat more plant-based foods; try to lose weight (“I didn’t know 10 pounds of weight was 3x more on the joints”); check websites to learn more.
• In addition to class attendance, Huntington’s Kitchen has served 19,252 people through outreach and community events and partnerships.
o In addition to class attendance, Huntington’s Kitchen has served 19,252 people through outreach and community events and partnerships.
• Support the Kids in Motion (KIM) program to provide counsel and intervention to obese and at- risk children and families
o 2017: Over 1,200 participants in the mobile unit in schools/after-school programs
Support the Kids in Motion (KIM) program to provide counsel and intervention to obese and at- risk children and families
o 2017: Over 1,200 participants in the mobile unit in schools/after-school programs
o 2018: The KIM program had 300 participants. The outreach at community events and schools was well over 400, making the total for 2018 approximately 700.
o 2019: Kids in Motion followed 13 participants in a longitudinal study, evaluating pre- and postperformance on a half-mile run, push-ups, sit-ups, and flexibility. Eight of the 13 improved 61% on the half-mile run; 7 improved 58% on push-ups; 7 improved 53% on sit-ups; and 7 improved 53% on flexibility.
o In addition to KIM, CHH collaborated with SMMC, Marshall University, the City of Huntington, and other community groups to offer the Greater Huntington Walks program to the entire community. More than 2,500 people throughout the Huntington area participate in walking challenges tracked through the programs. Between July 2018 and December 2019, registered walkers combined to walk the equivalent of the distance to the moon and back in the first hosted program, Walking to the moon and back. In FY 2019, 2,845 registered walkers participated in quarterly challenges with a goal to walk a combined 5 million miles.
o CHH also sponsored the Color for a Cure 5K in FY 2017 and FY 2018 with a combined 2,700 registered participants.
Provide support groups specific to health conditions and target populations
CHH holds monthly support groups for people and their family members living with the following health conditions: Gynecologic Cancer, Diabetes, Breast Cancer, Alzheimer’s Epilepsy, Stroke, and Parkinson’s disease. CHH holds monthly breastfeeding support groups, surgical weight-control support groups, childbirth classes, Infant CPR classes, Medicare Workshops, and free diabetic foot screenings, as well as grief and loss support groups.
Priority Area: Behavioral Health
Goal:
Improve outcomes for residents with a mental health or substance abuse condition and their families.
Objectives:
• Increase public education and awareness for signs and symptoms of mental health and substance abuse issues, and awareness of available community resources
• Increase understanding of root causes of behavioral health needs and opportunities for collective impact among partner organizations
Strategies:
Host a regional behavioral health summit, convening community agencies and potential partners for addressing prevention and management needs
o On June 1-2, 2017, CHH held the first Regional Health Summit, bringing together over 150 health care and public health professionals, nonprofit and academic partners, state governmental officials, and elected officials as key stakeholders representing more than 40 organizations from 21 counties in the Tri-State region of Kentucky, Ohio, and West Virginia. The central purpose of the Summit was to strengthen strategic efforts across health care, public health and community organizations to improve health, wellness, and prevention efforts by enhancing multi-sector collaboration at a regional level. Keynote speakers focused on access to care from national and local perspectives.
o The Summit’s focus was to build strategy around population health, focused on four key themes of access to care, behavioral health and substance abuse, chronic disease and data and technology.
Implement the use of early identification substance abuse screening tools throughout the lifespan of all CHH primary care patients
o Project Engage was formally implemented at CHH and SMMC in November 2018, and is supported by the Hospitalist program. Individuals struggling with SUD are usually admitted to the hospital for reasons not related to overdose. Project Engage is an evidence-based practice of screening, identifying, and offering treatment for adult inpatients with symptomatic opioid withdrawal. Providers often address the physical needs of the patients and do not recognize or acknowledge signs and symptoms of addiction. This has led to missed opportunities for a ‘reachable moment’ for possible intervention. Project Engage has created a standard of care in the hospital setting for patients with addiction. CHH implemented a model from ChristianaCare which has provided our practitioners tools for identifying and guidelines for addressing the needs of a patient with addiction. The approach includes: screening and identification; rapid treatment of withdrawal; medication assisted therapy if needed; peer mentor support system; referral to community-based care. As of June 2019, Project Engage at CHH had engaged with 359 patients. Peer mentor support for inpatients started May 2019. Peer mentors or recovery coaches, provide emotional support to the patient and are able to identify with patients as “someone who has walked in their shoes.”
Provide support for Lily’s Place, a non-profit leader in Neonatal Abstinence Syndrome, in caring for drug-exposed newborns and their families
o In addition to providing continued financial and provider support for Lily’s Place, the Hoops Family Children’s Hospital at CHH, recognizing that recovery from addiction takes a village, created a program that provides comprehensive addiction treatment services to mothers and their babies at the hospital. CHH launched the MOMS (Maternal Opiate Medication Support) Program in August 2018. The MOMS program begins as soon as a mother gives birth to promote bonding between mother and child. The program provides addiction treatment services for mothers while their babies recover from NAS in the Neonatal Therapeutic Unit. Services provided include medication-assisted therapy, women’s health, contraception, individual and group counseling, case management, and pastoral care. Since opening in August 2018 through June 2019, the MOMS Program served 57 mothers.
o The Neonatal Therapeutic Unit at CHH provides care for babies born prenatally exposed to substances that can cause symptoms of withdrawal after birth. The unit is dedicated to caring for the entire family by providing treatment, education, and support in a non-judgmental environment.
o As a result of her focused efforts to decrease newborn effects of opioids, Neonatal Therapeutic Unit Nurse Manager Sara Murray, was invited to the White House for the President’s Christmas Reception in 2018.
Provide discharge education to CHH patients discharged with opiate prescriptions.
CHH provides education on pain medication (including information about addictive qualities, the risks associated with pain medications) on admission and upon discharge. Pain medication education information is also provided at discharge for patients heading home after outpatient surgeries and procedures.

In 2016, SMMC completed a CHNA and developed a supporting three-year Implementation Plan for community health improvement. The 2016 CHNA revealed that our community is greatly challenged by chronic disease management, nutrition and exercise, and mental health and substance abuse. St. Mary’s Medical Center made a commitment to focus community health improvement efforts on these needs as part of the 2016-2019 Implementation Plan.
The SMMC 2016 Implementation Plan outlined specific action items to address identified priority health needs. The plan leveraged resources across the hospital and the community, drawing on existing partnerships. The following section highlights SMMC’s approach to addressing priority areas, and outcomes from the implemented action items.
Priority Area: Chronic Disease Management
Strategies:
Provide heart failure management education to help heart failure patients achieve their optimal level of health through treatment, education, and rehabilitation.
o St. Mary’s Regional Heart Institute provides education to every patient who is admitted and diagnosed with heart failure. The following is the number of patients who received verbal and written communication by the Certified Heart Failure Nurse Practitioner at St. Mary’s:
• FY 2017 - 696 patients
• FY 2018 - 685 patients
• FY 2019 (October thru March 2019) - 354 patients
o St. Mary’s also established a heart failure clinic for patients who are not attached to a primary care provider (PCP) or who can’t see their PCP within 7 days. A mid-level practitioner sees these patients as part of the clinic. The number of patients seen is provided as follows.
• FY 2017 - 85 patients
• FY 2018 - 101 patients
• FY 2019 (October thru March 2019) - 52 patients
Promote cardiac rehabilitation to help patients recover quickly and improve their overall physical and mental functioning after having a heart procedure.
o The cardiac rehab department staff visits inpatients to provide information at the bedside about postheart procedure rehabilitation opportunities and education. Many of those patients then return to the St. Mary’s Wellness Center for carefully monitored exercise that helps heart patients regain strength and lead healthier lifestyles.
• FY 2017
Inpatient visits- 4,828
Outpatient visits- 19,059
• FY 2018
Inpatient visits- 6,367
Outpatient visits-16,864
• FY 2019 (October through March 2019)
Inpatient visits- 3,167
Outpatient visits- 9,889
Establish a mid-level, post-hospitalization clinic for unattached patients until they are seen by a primary care physician.
St. Mary’s established a pilot project in April 2019 to work with unattached patients on two inpatient units (Telemetry and Medical-Surgical 1). So far, 100 patients have been assigned a new PCP or information has been updated in their charts to reflect the correct physician for follow-up primary care. A task force is working to identify barriers to physician access and determine if a mid-level post-hospitalization clinic is needed for unattached patients.
Promote management of diabetes though education in partnership with the Joslin Diabetes Center Education Affiliate at SMMC, including blood sugar monitoring, carbohydrate counting, medication, exercise, heart-healthy eating, and goal setting.
o St. Mary’s partners with the world-renowned Joslin Diabetes Center at Harvard University in Boston to provide patients with education and disease management locally at SMMC. Patient visits for diabetes management included:
• FY 2017 - 1,403
• FY 2018 - 1,216
• FY 2019 (October through March 2019) – 658
o In FY 2018, SMMC hired an inpatient diabetes educator to provide diabetes education to our inpatient population when consulted, and also identify patients in need of education through various reports related to diagnosis, patient history, and HgbA1c. The educator works to ensure every diabetic patient has knowledge gaps addressed, while streamlining processes, workflow, and education and recruiting patients into the Joslin diabetes outpatient diabetes education program.
Priority Area: Nutrition and Exercise
Strategies:
Collaborate with members of Regional Health Connect to improve health, fitness, and quality of life of residents in the service area through daily physical activity.
St. Mary’s collaborated with CHH, Marshall University, the City of Huntington, and other community groups to offer the Greater Huntington Walks program to the entire community. More than 2,500 people throughout the Huntington area participate in walking challenges tracked through the programs. Between July 2018 and December 2019, registered walkers combined to walk the equivalent of the distance to the moon and back in the first hosted program, Walking to the moon and back. In FY 2019, 2,845 registered walkers participated in quarterly challenges with a goal to walk a combined 5 million miles.
Provide personal nutrition coaching and counseling with a registered dietician to help participants make healthy lifestyle and nutrition choices.
A St. Mary’s registered dietitian interacted with community members and provided nutrition coaching, including:
Nutrition counseling and coaching to St. Mary’s employees:
2017=5
2018= 10
2019= 3
Individualized counseling to community patients:
2017=40
2018= 37
2019= 6
Community nutrition classes:
2017 = 447 across 12 classes
2018 = 525 people across 16 classes
2019 = 105 people across 3 classes
Presentation/Class Titles:
• Chose to Lose Weight Control
• Rethink Your Drink
• Healthy Snacking for Kids and Teens
• Better Eating for Cancer Prevention
• Healthy Eating and Exercise for Weight Loss
• Sodium Control
• Healthy Holiday eating
• Portion Distortion
• Cardiac Risk Factors
• Food and Fitness for Older Adults
• Nutrition & Exercise for Better Health
• Nutrition Labels
• Healthy Grocery Store Tours
• Emerging Fad Diets
Support childhood nutrition, exercise, and esteem programs like Kids in Motion, Girls on the Run of Cabell and Wayne counties, and GoNoodle Plus to reach as many children as possible.
o Launched in 2013, GoNoodle designs mobile games, interactive activities, and kid-friendly entertainment to provide “brain breaks” that promote physical activity, active learning,heightened engagement, and enhanced focus. Choosing from hundreds of customized videos, teachers and parents use GoNoodle to effectively direct a child’s energy, while breaking away from traditional methods of teaching to make the learning experience fun and entertaining.
St. Mary’s and CHH provided funding to make the Plus service, which provides additional resources, free to local schools as follows:
School year 2017-2018: Provided GoNoodle Plus to 6 counties (Cabell, Wayne, Putnam, Mason, and Lincoln in West Virginia and Lawrence in Ohio) with an addressable market of 26,700 kids in 82 schools.
A monthly average of 12,000 active kids in 500 active classrooms completed nearly 99,000 plays with a cumulative 6.1 million active minutes of exercise throughout the school year.
School year 2018-2019 (through March 2019): Provided GoNoodle Plus to 12 counties (Cabell, Wayne, Putnam, Mason, Lincoln, Logan, Mingo, and Boone in West Virginia, Lawrence in Ohio, and Boyd, Lawrence, and Greenup in Kentucky) with an addressable market of 41,000 kids in 142 schools. A monthly average of 18,000 active kids in 800 active classrooms completed over 117,000 plays with a cumulative 7.1 million minutes of exercise throughout the school year. Students living in those 12 counties are also able to access GoNoodle Plus from home
o Girls on the Run is an international non-profit program that works to encourage pre-teen girls to develop self-respect and healthy lifestyles through dynamic, interactive lessons and running games, culminating in a celebratory 5K run. St. Mary’s provides funding for the local council, Girls on the Run of Cabell and Wayne counties.
2017 275 girls completed the self-esteem program 2018: Approximately 100 girls completed the program 2019: The program is scheduled for Fall 2019
Continue to collaborate with the Rahall Transportation Institute, City of Huntington and others to provide support for further development of the Paul Ambrose Trail for Health. The Paul Ambrose Trail for Health (PATH) is a pedestrian and bicycle trail through the City of Huntington and its surrounding neighborhoods. PATH is named in honor and memory of Dr. Paul Ambrose, a Huntington physician, who died during the terrorist attack on September 11, 2001. St. Mary’s provided funding support through FY 2017. Multiple sections of the trail have been completed and are being used by the community throughout the Huntington area.
Offer various wellness classes to individuals and groups in the community, including the following: FY 2017
• Seniors in Motion – 1,000 participant visits
• Zumba – 455 participant visits
• Yoga – 320 participant visits

Nutrition and Exercise – continued
FY 2018
• Seniors in Motion – 600 participant visits
• Zumba – 630 participant visits
• Yoga – 40 participant visits
FY 2019 (October through March 2019)
• Seniors in Motion – 475 participant visits thus far
• Zumba - 250 participants
Sponsor events throughout the community that promote physical activity, such as the St. Mary’s- Marshall University Marathon, St. Mary’s Triathlon, and Colors for a Cure.
FY 2017
• St. Mary’s Triathlon - 200+ Participants
• Colors for a Cure 5K – 1,600 Registered Participants
FY 2018
• Colors for a Cure 5K – 1,100 Registered Participants
Identify ways to offer workforce wellness education to local employers.
St. Mary’s provides corporate health fairs to the following businesses and government entities:
• Amazon
• City of Huntington
• Marathon Petroleum
• Pepsi
• Service Wire
• V.A. Medical Center
o St. Mary’s offers wellness classes/information on healthy eating, weight and portion control, smoking cessation, stroke risk, bone density, body fat, colon cancer, lung health, health risks, and physical activity/exercise tailored to group needs based on corporate wellness surveys and requests.
• FY 2017 = 428+ individuals served
• FY 2018 = approximately 270+ individuals served
• FY 2019 (partial year) = 80 individuals served
Priority Area: Substance Abuse and Mental Health
Strategies:
Collaborate with members of Regional Health Connect to improve emotional and behavioral health and reduce substance abuse in our community.
o St. Mary’s joined multiple health care and community organizations to combat the opioid epidemic in our community. Cabell County’s overdose totals have decreased by 41 percent in the first six months of 2018 (564) compared with the first six months of 2017 (953), according to records logged by Cabell County EMS.
o The use of naloxone - the drug used by first responders to reverse an opioid-induced overdosefell by 49 percent compared to the first half of 2017.
o Project Engage is a health care-based approach, where hospital staff members identify patients who may be struggling with Substance Use Disorder (SUD) to effectively connect them with treatment programs and other resources during hospitalization. The initiative was born from the Regional Health Summit. Between December 1, 2017 and May 19, 2019, St. Mary’s addiction staff members saw 827 patients; 319 came through the Emergency Department (ED).
o St. Mary’s moved in a different and more effective direction to help people with SUD when it joined with other hospitals and health providers to launch PROACT. This outpatient medical facility serves as a single regional referral point to assess patients following discharge from local emergency rooms and inpatient detox units and by referral from our
quick response teams and other emergency medical response teams. PROACT also accepts self-referrals and referrals from community providers. The goal of the program is to effectively serve, educate, and treat individuals through and beyond the initial stages of recovery until they become long-term, committed members of society. The facility on 20th Street and 8th Avenue in Huntington, West Virginia, opened in 2018.
Determine feasibility of developing a detoxification unit. Instead of opening a detoxification unit, St. Mary’s opted to work with patients in the ED and inpatient units and refer them to outside facilities upon discharge.
Identify opportunity and feasibility of developing a physical activity program for those recovering from substance abuse (e.g., The Phoenix model).
St. Mary’s continues to explore opportunities to work with area partners, such as Recovery Point, on a sober living active fitness program similar to The Phoenix model in Denver, Colorado. Presently, the Greater Huntington Walks program, cosponsored by St. Mary’s (see Priority Area 2, Point 1) provides physical activity opportunities, and is open to all members of the community.
Establish protocols (Acute Opiate Withdrawal, Acute Opiate Overdose, Acute Pain Management in Chronic Opiate Misuse Syndrome) in collaboration with Pharmacy and the Drug Enforcement Agency for long-term treatment and management of symptoms for inpatients.
o The Inpatient Addictions Program started at SMMC in December of 2017 with the addition of an RN Addictions Coordinator and a Medical Director of the SMMC Addictions Program. These leaders work with
nurses and physicians and peer mentors to engage every inpatient who has a substance abuse issue. Results from the first year of the program are as follows:
• 518 patients seen by addiction program staff
• 61% of those patients were discharged to some form of inpatient or outpatient treatment program
• Of the 61%, 35% entered a Medication Assisted Treatment program
Collaborate with long-term care facilities to establish agreements to treatments and modified patient consents to insure continuity of care among organizations.
St. Mary’s collaborates with long term substance treatment facilities, Medication Assisted Treatment clinics, and outpatient providers to guide patients into the substance treatment program of their choice; however, long term skilled nursing facilities tend to decline patients with SUD when referrals are made by social work. This has been an issue across the Tri-State area.
Continue to develop a credentialed peer mentoring program.
St. Mary’s now has three full-time peer recovery specialists working at SMMC (Two in the ED and one in the Inpatient Units as of 4/14/19). The first specialist started in September of 2018. From September 2018 through January 2019, the specialists engaged with 104 out of 107 patients, and the majority of those were linked to outpatient services or inpatient SUD treatment.
Provide education to physicians regarding the difference in roles of peer mentors, Social Service and Case Management, along with other state and local resources available to them for their patients.
SMMC Addictions Medical Director and Nurse meet monthly with the St. Mary’s hospitalists group to provide education and updates and to answer any questions that they may have pertaining to the Addiction Program. Coordinators also meet with the Marshall University Internal Medicine attending/ resident physicians to provide education and answer questions.
Provide education on the patient education channel and consider developing web-based AA/NA meetings for inpatients.
The SMMC committee decided that direct personal communication was most effective for AA/NA meetings and patient education. All patients identified with addiction issues are seen and counseled by addiction specialists.
Expand the Employee Assistance Program (EAP) to include support and coping skills for staff directly involved with patients’ substance abuse issues.
EAP counseling is available at no cost to all St. Mary’s employees and their families. Any staff member working with patients’ substance abuse issues can make use of the service. More targeted initiatives are in planning.
Mountain Health Network shared findings from the CHNA research with community partners and key stakeholders during the Regional Health Summit to gain feedback on community health priorities. A formal presentation of data was made to summit attendees; participants were then asked to develop a list of community needs based on the research and their experience within the community. A voting exercise was conducted for members to individually score each issue based on four criteria. Results were then shared and reviewed with attendees for final insights.
Scope of the issue:
• Widespread or affecting few individuals
• Inequities or disparities among residents
Severity of the issue:
• Cost or burden of the issue on the community
(e.g. dollars, time, social)
• Negative outcomes or causes harm
Ability to Impact the issue:
• Resource availability
• Known practices to address the issue
• Short-, medium-, or long-term outcomes
Community Readiness to Address the issue:
• Supportive leaders or policy makers
• Prevailing attitude of the community toward the issue
• Community capacity
The voting results are displayed below in order of overall score.
Mountain Health Network used this information to determine system-wide priorities on which to focus community health and benefit activities over the next three-year cycle. Cabell Huntington Hospital and St. Mary’s Medical Center each developed an Implementation Plan in support of these priorities. By adopting system-wide priorities, Mountain Health seeks to promote a regional approach to addressing community health needs and foster partner collaboration.

Mountain Health Network, Cabell Huntington Hospital and St. Mary’s Medical Center each developed an Implementation Plan to guide their community benefit activities across the service area. As determined through the prioritization process, both medical facilities will devote resources and expertise to address behavioral health and substance use disorder, including Neonatal Abstinence Syndrome, and chronic disease prevention and management, with a focus on diabetes, heart disease, and tobacco use/lung disease. Access to care and eliminating health disparities will continue to be cross-cutting strategies for Mountain Health.
The Implementation Plan builds upon previous health improvement activities and takes into consideration the evaluation of impact from the 2016-2019 Implementation Plan cycle, while recognizing new health needs and a changing health care delivery environment identified in the 2019 – 2022 CHNA.
Mountain Health Network, Cabell Huntington Hospital and St. Mary’s Medical Center identified system-wide priorities and aligned their Implementation Plans to coordinate efforts and track progress across overall community efforts. Systemwide goals and objectives, and hospital-specific strategies from the plans are outlined on the following pages.
Mountain Health Network Goal: Support substance use disorder efforts in our community, and improve outcomes for people with a behavioral health and/or substance use disorder and their families, including infants with Neonatal Abstinence Syndrome (NAS).
Mountain Health Network Objectives
• Encourage the use of early identification screening tools among primary care patients of all ages.
• Collaborate with community agencies to improve access to behavioral health and substance use disorder support services for patients and their families.
• Support public education and awareness for signs and symptoms of behavioral health conditions and substance use disorders and awareness of available community resources.
• Support treatment and transition services for infants diagnosed with Neonatal Abstinence Syndrome and their families.
Mountain Health Network Collective Strategies:
• Continue Screening, Brief Intervention and Referral to Treatment (SBIRT) and behavioral health screenings to identify and treat individuals with substance use disorders and/or behavioral health conditions.
• Partner with the City of Huntington, Cabell County EMS, Marshall Health, and several other agencies, participate in Quick Response Teams to personally visit every patient within 72 hours following an overdose to assess their needs, develop a personalized plan for intervention, and connect them with addiction service providers.
• Participate in Healthy Connections a local coalition of 20 community organizations dedicated to finding solutions to the region’s high rate of NAS, substance abuse, and the resulting consequences for child development and family stability, by better integrating the existing programs and services in the community and building upon them.
• Encourage early identification screening tools in PCP offices.
• Provide community screening to identify behavioral health symptoms and available resources to treat behavioral health conditions.
• Provide grief support groups for the community.
• Collaborate with youth engagement activities and educational opportunities to promote resiliency and coping mechanisms for prevention of behavioral health and substance use disorders.
• Continue the annual Regional Health Summit, convening health and human service providers across the Tri-State region, to strengthen strategic efforts to improve health, wellness, and prevention efforts by enhancing multi-sector collaboration.
• Support PROACT (Provider Response Organization for Addiction Care and Treatment), a non-profit organization to address the clinical, behavioral, spiritual, and professional needs of those affected by substance use disorder. Explore opportunities to advocate for increased employment of individuals in recovery.
• Support Project Engage an evidence-based practice for individuals with substance use disorder who seek treatment through the ED, or are admitted as an inpatient or to mother/baby. All patients are screened as to whether they have an SUD and if they go into withdrawal, and will be offered peer recovery coaches for support and the option of medication assisted treatment, as well as referrals for community-based treatment and recovery services.
• Explore opportunities to provide support groups and other recovery programs for family members of individuals with behavioral health conditions and/or substance use disorder.
• Support the FaithHealth Appalachia program, serving the faith-based community and community at large, by providing health training, supporting faith-based health improvement efforts, and engaging faith leaders in new cooperative efforts for earlier prevention of chronic disease and healthier outcomes.
Cabell Huntington Hospital Strategies
• Provide the Hoops Family Children’s Hospital Child Advocacy Center, where young victims of abuse and neglect receive services in a child-friendly environment.
• Provide the Hoops Family Children’s Hospital Maternal Opioid Medical Support (MOMS) program to provide addiction treatment services, psychological and medical treatment, education, and training to postpartum women, while their babies recover from NAS.
• Provide the Neonatal Therapeutic Unit (NTU), a specialized unit for infants with NAS, providing a therapeutic environment and medication to treat withdrawal symptoms.
• Collaborate with Project Hope for Women and Children, a collaboration with Healthy Connections, MOMS Program, and Marshall Health’s Maternal Addiction Recovery Center, to support mothers and their families on the road to addiction recovery.
• Coordinate services with Lily’s Place, a non-profit leader in NAS, to care for drug-exposed newborns and their families.
• Coordinate services with Prestera, a regional provider of support and services for people with behavioral health and substance abuse needs, specializing in helping individuals who have a dual diagnosis.
St. Mary’s Medical Center Strategies
• Continue to provide inpatient behavioral health services, and explore opportunities to expand services to meet delivery gaps.
• Offer well-being classes and services at a discounted rate, including yoga and massage therapy.
• Provide a new Families Assisting Recovery monthly support group for family members of those struggling with substance use disorder.
• Provide the St. Mary’s Addiction Recovery Team (SMART), a partnership with Addiction Recovery Care, to provide care coordination for patients with substance use disorder receiving care in the ED, as well as addiction education for providers.
• Provide trained peer support specialists and counselors as part of SMART to assess the needs of patients with SUD and connect them with recovery supports.
• Support PROACT by providing a full-time chaplain beginning in Fall 2019.
• Support the Compass program, which provides training, classes, and a wellness center to help first responders in Huntington improve their mental health, by providing Spiritual Care and Employee Assistance Program services. St. Mary’s will also explore additional opportunities to provide similar programs within other counties in the service area.
Mountain Health Network Goal
Reduce the burden of chronic disease through prevention, detection, and treatment of risk factors, and improve quality of life for people living with chronic disease, with an emphasis on obesity/diabetes and heart disease, and tobacco use/lung disease.
Mountain Health Network Objectives
• Support disease management among individuals diagnosed with a chronic condition.
• Increase access to screenings and chronic disease education among adults.
• Provide community education and outreach that promotes chronic disease prevention, targeting people at high risk for chronic disease.
• Reduce barriers to health through telehealth.
Mountain Health Network Collective Strategies
• Host senior-specific programming (e.g. SeniorFest, Senior Focus Fridays, Seniors in Motion, and SeniorWise) and support the Marshall Family Medicine Center for Healthy Aging to provide health education and services that support a healthy, age-friendly lifestyle.
• Provide financial counselors to ensure the financial capacity of people who need medical services does not prevent them from seeking or receiving care.
• Provide free or discounted disease-specific communitybased screenings, targeting underserved and at-risk populations.
• Provide support groups for individuals with chronic disease and their families.
• Provide youth opportunities for physical activity and health education, through support of local parks, playgrounds, and fun runs.
• Sponsor physical activity programs in partnership with Marshall University, the City of Huntington, and other community groups.
• Support Ebenezer Medical Outreach, a full-service medical clinic providing access to free, comprehensive health care to financially eligible clients.
• Explore opportunities to address medical transportation barriers through creative partnerships with Uber, FaithHealth Appalachia, and churches, among others.
• Explore opportunities to provide Huntington’s Kitchen education to neighborhoods and populations at-risk for chronic disease.
• Launch and promote Mountain telehealth
• Collaborate with the Cabell-Huntington Health Department on tobacco cessation education
Cabell Huntington Hospital Strategies
• In partnership with Marshall Health, provide pre- and post-acute home care for homebound patients age 18 or over throughout the Tri-State region.
• Provide education about healthy lifestyles and chronic disease prevention at Huntington’s Kitchen and at various community events.
• Support FaithHealth Appalachia, based on the FaithHealth Model, as a key strategy to increase access to medical care and other services among member congregations.
• Collaborate with the Marshall Health Chertow Diabetes Center for diabetes education and services
St. Mary’s Medical Center Strategies
• Offer a heart failure clinic for patients who do not have a medical home or who cannot see their primary care doctor within seven days of discharge from the hospital.
• Partner with the world-renowned Joslin Diabetes Center at Harvard University in Boston, and our inpatient diabetes educator, to provide education and disease management for individuals with diabetes.
• Provide a tobacco cessation program in partnership with St. Mary’s Pulmonary Rehabilitation, including three half-hour, confidential counseling sessions provided by a certified tobacco treatment specialist.
• Provide nutrition counseling and coaching by a registered dietitian at various community events.
• Support youth programs that encourage healthy lifestyles.
Mountain Health Network leadership and staff share a common value and commitment to providing excellent care and community services that promote lifelong good health. Cabell Huntington Hospital and St. Mary’s Medical Center have a long tradition for caring for the needs of the communities they serve, and are dedicated to improving the health of the more than one million children and adults across their Tri-State service area. Collectively, the hospitals will continue to assess the needs of community residents to focus health improvement efforts where they can have the greatest impact on the region.
We encourage you to visit the CHNA websites to learn more about our community health activities: mountainhealthnetwork.org, cabellhuntington.org and st-marys.org.
Centers for Disease Control and Prevention. (2017). BRFSS prevalence & trends data. Retrieved from http://www.cdc. gov/brfss/brfssprevalence/index.html
Centers for Disease Control and Prevention. (2018). CDC wonder. Retrieved from http://wonder.cdc.gov/
Centers for Disease Control and Prevention. (2018). National vital statistics system. Retrieved from https:// www.cdc.gov/nchs/nvss/births.htm
Centers for Disease Control and Prevention. (2019). United States diabetes surveillance system. Retrieved from hhttps://www.cdc.gov/diabetes/data/index.html
Centers for Medicare & Medicaid Services. (2017). Chronic conditions. Retrieved from https://www.cms.gov/ResearchStatistics-Data-and-Systems/Research-Statistics-Data-andSystems.html
Centers for Medicare & Medicaid Services. (2019). National provider identification file. Retrieved from http://www. countyhealthrankings.org/
Centers for Medicare & Medicaid Services. (2018). Office of minority health. Retrieved from https://www.cms.gov/aboutcms/agency-information/omh/omh-mapping-medicaredisparities.html
County Health Rankings & Roadmaps. (2019). Explore health rankings. Retrieved from http://www. countyhealthrankings.org/
Dignity Health/Truven Health Analytics. (2018). Community need index. Retrieved from http://cni.chw-interactive.org/
ESRI. (2018). Business Analyst. Retrieved from https://www. esri.com/en-us/home
Feeding America. (2018). Map the meal gap 2018. Retrieved from http://www.feedingamerica.org/
Health Resources & Services Administration. (2019). Area health resources files. Retrieved from http://www. countyhealthrankings.org/
Health Resources and Services Administration. (2018). Data warehouse. Retrieved from https://datawarehouse.hrsa.gov/ Tools/Tools.aspx
Healthy People 2020. (2010). 2020 topics and objectives –objectives a-z. Retrieved from http://www.healthypeople. gov/2020/topics-objectives
National Cancer Institute. (2019). State cancer profiles. Retrieved from https://statecancerprofiles.cancer.gov/datatopics/incidence.html
National Center for Education Statistics. (2019). Children eligible for free or reduced price lunch. Retrieved from http://www.countyhealthrankings.org/
National Center for Health Statistics. (2019). Premature death. Retrieved from http://www.countyhealthrankings.org/
National Highway Traffic Safety Administration. (2019). Fatality analysis reporting system. Retrieved from http:// www.countyhealthrankings.org/
National Institute on Drug Abuse. (2018). Opioid summaries by state. Retrieved from https://www.drugabuse.gov/drugsabuse/opioids/opioid-summaries-by-state
United States Census Bureau. (n.d.). American community survey. Retrieved from http://factfinder.census.gov/faces/ nav/jsf/pages/index.xhtml
United States Department of Health & Human Services. (n.d.). Health indicators warehouse. Retrieved from https:// healthdata.gov/dataset/health-indicators-warehouse
West Virginia Department of Health & Human Resources, Health Statistics Center. (2016). West Virginia Vital Statistics. Retrieved from http://www.wvdhhr.org/bph/hsc/statserv/ VitalStats.asp
Marshall Health Physician
Marshall Health Physician
Marshall Health Registered Nurse
Marshall Health Director of Pharmacy Services
Marshall Health Family Nurse Practitioner
Marshall Health MD, Nephrology Director of Inpatient and Outpatient Dialysis
Marshall Health - Internal Medicine Assistant Professor of Internal Medicine (Attending Physician)
Marshall Health Cardiovascular Professor
Marshall Health Surgery Physician
Marshall Health, Division of Addiction Sciences in Family Medicine Associate Director of Operations Addiction Sciences
Coroner and Medical Director
Lawrence County Health Department Public Health Director
Lily's Place Director of Nursing
Lincoln County Schools Pre-K Coordinator, ECE Literacy
Madison Avenue Christian Church (Disciples of Christ) Pastor
Marshall Health Chair
Marshall Health Associate Director of Operations, Division of Addiction Sciences in Family Medicine
Marshall Health Associate Professor
Marshall Health Associate Professor of Medicine
Marshall Health Clinical Research Coordinator
Marshall Health Family Nurse Practitioner
Marshall Health Nurse Practitioner
Marshall Health Physician
Marshall Health Physician
Marshall Health Physician
Marshall Health Physician
Marshall Health Physician
Marshall Health Registered Nurse
Marshall Health Director of Pharmacy Services
Marshall Health Family Nurse Practitioner
Marshall Health MD, Nephrology Director of Inpatient and Outpatient Dialysis
Marshall Health - Internal Medicine Assistant Professor of Internal Medicine (Attending Physician)
Marshall Health Cardiovascular Professor
Marshall Health Surgery Physician
Marshall Health, Division of Addiction Sciences in Family Medicine Associate Director of Operations Addiction Sciences
Marshall Health/Cabell Huntington Hospital Professor of Surgery
Marshall Health/Cabell Huntington Hospital Assistant Professor Family Medicine
Marshall Health/Hoops’ Children’s Assistant Professor
Marshall Health/St Mary’s Medical Center Pathologist/MD
Marshall Orthopaedics Orthopaedic Surgeon
Marshall University Assistant Professor
Marshall University Associate Professor of Surgery
Marshall University Physician
Key Informant Organization Key Informant Title/Role
Marshall University Director of Clinical Education, Department of Communication Disorders
Marshall University Research Corporation Applied Research
Radiology, Inc. Interventional
Radiology, Inc. MD
Radiology, Inc. Physician
Radiology, Inc. Physician
Radiology, Inc. Physician Assistant
Radiology, Inc. Radiologist
Radiology, Inc. Radiologist
ReClaim Church Barboursville Campus Pastor
River Park Hospital CEO Self Self/Personal entity
St. Mary’s
Marshall Health/Cabell Huntington Hospital Professor of Surgery
Marshall Health/Cabell Huntington Hospital Assistant Professor Family Medicine
Marshall Health/Hoops’ Children’s Assistant Professor
Marshall Health/St Mary’s Medical Center Pathologist/MD
Marshall Orthopaedics Orthopaedic Surgeon
Marshall University Assistant Professor
Marshall University Associate Professor of Surgery
Marshall University Physician
Key Informant Organization Key Informant Title/Role
Marshall University Director of Clinical Education, Department of Communication Disorders
Marshall University Research Corporation Applied Research
Mountain Health Network 115
Marshall University School of Medicine MD
Marshall University School of Medicine MD/Faculty
Marshall University School of Medicine Physician
Marshall University School of MedicineFamily Medicine/Ebenezer Medical Outreach Assistant Professor/Medical Director EMO
Marshall University School o Medicine/Marshall Health Psychologist
Marshall University School of Pharmacy Faculty Member
Marshall University/Marshall Health Physician
Marshall University/Marshall University School of Medicine Professor of Medicine
Midland Behavioral Health MD
Milton Presbyterian Church Pastor
Mingo County Health Department Administrator
Mountain Health Network CFO
Northstar Anesthesia Certified Registered Nurse Anesthetist
Northstar Anesthesia Certified Registered Nurse Anesthetist
Our Lady of Bellefonte Hospital Director, Community Health Kentucky
Pleasant Valley Hospital Executive Director, Physician Services & CCO
Pleasant Valley Hospital Chief of Staff
Prestera Center CEO
Prestera Center Development Director
Quality Insights Lead Projec Coordinator
Quality Insights CEO
Quick Response Team Faith Leader
Radiology, Inc. Chief Administrative Officer
Radiology, Inc. Interventional Radiology
Radiology, Inc. MD
Radiology, Inc. Physician
Radiology, Inc. Physician
Radiology, Inc. Physician Assistant
Radiology, Inc. Radiologist
Radiology, Inc. Radiologist
ReClaim Church Barboursville Campus Pastor
River Park Hospital CEO
Self Self/Personal entity
St. Mary’s Women & Family Care OB/GYN Physician
St. Mary's Medical Center MD, Neuroscience Center
St. Mary's Medical Center Physician
St. Mary's Medical Center ER Physician, Medical Director
St. Mary's Medical Center Clinical Manager
St. Mary's Medical Center ED physician
St. Mary's Medical Center Heart Failure Nurse Practitioner
St. Mary's Medical Center NA
St. Mary's Medical Center Nurse Practitioner
Key Informant Organization Key Informant Title/Role
St. Mary's Medical Center Physician
St. Mary's Medical Center Registered Nurse
St. Mary's Medical Center Urology
St. Mary's Medical Center Physician
St. Mary's Medical Center/PROACT Chaplain
Mountain Health Network 116
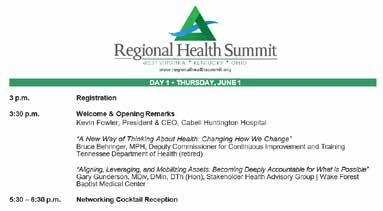
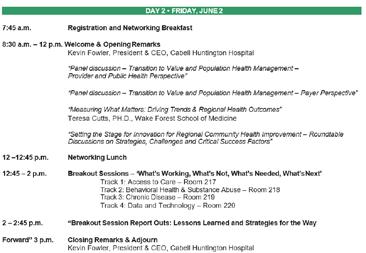
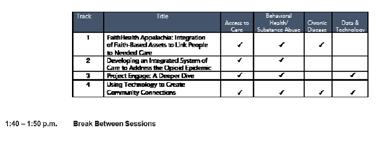
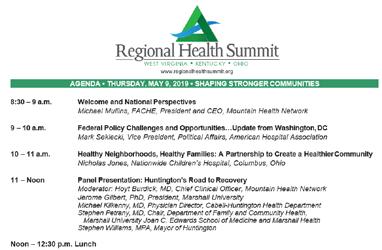
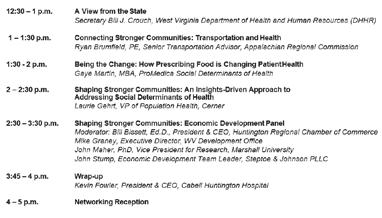
www.regionalhealthsummit.org
for Medical Services
Bill Bissett, President & CEO, Huntington Regional Chamber of Commerce
Hoyt Burdick, MD, Chief Clinical Officer, Mountain Health Network (MHN)
David Campbell, Executive Director Healthcare Innovation, CHH
Todd Campbell, President & CEO, St. Mary’s Medical Center (SMMC)
Bill Dingus, Executive Director, Greater Lawrence County Area Chamber of Commerce and Lawrence County Development Corporation
Michael Kilkenny, MD, physician director, Cabell-Huntington Health Department
Deb Koester, PhD, executive director, West Virginia Local Health Inc. and assistant professor, Department of Family and Community Health, Marshall Health, Joan C. Edwards School of Medicine (JCESOM)
Doug Korstanje, Vice President Marketing and Community Relations, SMMC
Amber Kuhl, MD, United Health Professionals
Mark Morgan, CEO, HIMG
Dave Ramsey, President & CEO, Charleston Area Medical Center
Joseph I. Shapiro, MD, Dean, Marshall University JCESOM
Steve Shattls, President & CEO, Valley Health Systems, Inc.
Vicki Smith, board of directors, SMMC
Lisa Chamberlin Stump, Chief Strategy Officer, MHN
Glen Washington, CEO, Pleasant Valley Hospital
Steve Williams, Mayor, City of Huntington

Cabell Salt Rock Medical Center: 5490 WV-10, Salt Rock, WV 25559
Kanawha Southern West Virginia Health System – Sand Plant: 1563 Sand Plant Rd, Charleston, WV 25309
Lincoln Mustang Health Center: 267 Midway Rd, Alum Creek, WV 25003
Lincoln Ranger Health Center: 59 Vanatters Crk, Ranger, WV 25557
Lincoln Duval Yellowjacket Center: 5304 Straight Frk, Griffithsville, WV 25521
Lincoln Guyan Valley Wildcat Center: 5322 McClellan Ave, Branchland, WV 25506
Lincoln LCHS Panther Center: 81 Lincoln Panther Way, Hamlin, WV 25523
Lincoln County Primary Care Center, Inc.
Raleigh Associates in OBGYN
25312
410 Carriage Dr, Beckley, WV 25801
Raleigh Bill Baker Way
202 Bill Baker Way, Beckley, WV 25801
Raleigh Daniels
2157 Ritter Dr, Daniels, WV 25832
Raleigh Glen Daniel
7127 Harper Rd, Glen Daniel, WV 25844
Community Health Systems, Inc.
Raleigh Mabscott:
200 Raleigh Ave, Beckley, WV 25801
Raleigh Professional Medical Ultrasonics
200 Carriage Dr, Beckley, WV 25801
Raleigh Raleigh Psychiatric Services:
28 Mallard Ct, Beckley, WV 25801
Raleigh Rural Acres Drive
252 Rural Acres Dr, Beckley, WV 25801
Raleigh Stanaford
201 Woodcrest Dr, Beckley, WV 25801
New River Health Association, Inc.
Valley Health Systems, Inc.
Lincoln Lincoln Primary Care Center: 7400 Lynn Ave, Hamlin, WV 25523
Logan Chapmanville Regional H.S. Tiger Center for Health: 200 Vance St, Chapmanville, WV 25508
Logan Logan Wildcat Health Center: 1 Wildcat Way, Logan, WV 25601
Logan Southern West Virginia Health System – Logan: 122 Nick Savas Dr, Logan, WV 25601
Logan Pioneer Health Center: 1 Pioneer Path, Man, WV 25635
Logan Southern West Virginia Health System – Man: 650 E McDonald Ave, Man, WV 25635
Mingo Southern West Virginia Health System - Delbarton: 5027 Helena Ave, Delbarton, WV 25670
Mingo Southern West Virginia Health System – Gilbert: 202 Larry Joe Harless Dr, Gilbert, WV 25621
Raleigh Sophia & Sophia Pharmacy: 302 W Main St, Sophia, WV 25921
Raleigh Coal City Elementary School-Based Health Center: PO Box 1240, Coal City, WV 25823
Raleigh Independence High School-Based Health Center: PO Box 1595, Coal City, WV 25823
Cabell Valley Health – Highlawn: 2585 3rd Ave, Huntington, WV 25703
Cabell Valley Health – Huntington: 1301 Hal Greer Blvd, Huntington, WV 25701
Cabell Valley Health – Huntington High: Highlander Way, Huntington, WV 25701
Cabell Valley Health – Huntington Middle/Southside Elementary: 930 2nd St, Huntington, WV 25701
Health Systems, Inc.
Cabell Valley Health – Milton: 1 Harbour Way, Milton, WV 25541
Cabell Valley Health – 10th Street: 540 10th St, Huntington, WV 25701
Cabell Valley Health – A Woman’s Place: 1630 13th Ave, Huntington, WV 25701
Cabell Valley Health – Cabell Midland: 2300 US Route 60 East, Ona, WV 25545
Cabell Valley Health – Diagnostics (Lab): 307 5th Ave G, Huntington, WV 25702
Cabell Valley Health – East Huntington: 3377 Route 60, Huntington, WV 25705
Cabell Valley Health – FoodFair: 6350 US Route 60, Barboursville, WV 25504
Cabell Valley Health – Ear, Nose and Throat: 3 Stonecrest Dr, Huntington, WV 25701
Cabell Valley Health – Harmony House: 627 4th Ave, Hungtington, WV 25701
Cabell Valley Health – Southside: 723 9th Ave, Huntington, WV 25701
Cabell Valley Health - Prestera: 3375 US Route 60 East, Huntington, WV 25705
Cabell Valley Health – PROACT: 800 20th St Huntington, WV 25703
Kanawha Valley Health – Upper Kanawha: 408 Alexander St, Cedar Grove, WV 25039
Lincoln Valley Health – Harts: 22 Fleming Dr, Harts, WV 25524
Lincoln Valley Health – Harts Intermediate: 1246 McClellan Hwy, Harts, WV 25524
Mason Valley Health – Gallipolis Ferry: 15167 Huntington Rd, Gallipolis Ferry, WV 25515
Mason Valley Health – Point Pleasant Pediatrics: 2801 Jackson Ave, Point Pleasant, WV 25550
Putnam Valley Health – Hurricane: 3729 Teays Valley Rd Ste 100, Hurricane, WV 25526
Putnam Valley Health – Teays Valley: 1100 Hospital Dr, Hurricane, WV 25526
Wayne Valley Health – Mountwest: 1 Mountwest Way, Huntington, WV 25701
Wayne Valley Health – Spring Valley: 1 Timberwolf Ln, Huntington, WV 25704
FaithHealth Appalachia “Be the Bridge”
Walking beside individuals to be the bridge between health care, faith communities and community to promote an atmosphere of holistic health, healing and wellness.
Vision: To promote a passion for a holistic approach to wellness which focuses on mind, body and spirit through the bridging together of the healthcare, faith communities, and community.
Mission: To be a conduit of transformation that connects community resources, hospitals, faith communities, health care facilitates and social service programs that is based on truth, care, and education to improve the total wellness of individuals and community.
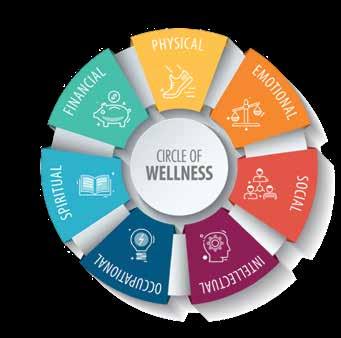
The Goals:
1.) To bridge the gaps that exists between healthcare providers, faith communities, community organizations and resources to better care for the physical, psychosocial, and spiritual needs that exist within the community.
2.) To help integrate a segment of our population who are or feel isolated from the greater community within the greater population for better care physically, emotionally, and spiritually.
3.) To help create a culture of wellness by improving access to resources that will elevate holistic wellness in the community.
“Real Life” examples of how FaithHealth Appalachia will address needs include:
• Developing ‘fresh food pharmacies’ to provide healthy foods to individuals struggling to follow prescribed nutrition practices that are vital to their health and well-being by partnering with existing food pantries in the community.
• ‘Following the patient home’ by identifying community resources available to individuals by bridging the gap to access points through community connectors
• Walk beside faith communities to establish wellness initiatives that fit within their mission as a congregation
• Training and creating a network for Faith community nurses in local congregations
FaithHealth Appalachia Community Work:
FaithHealth Appalachia (FHA) is building a network of faith communities in the Highlawn, Fairfield, and West End neighborhoods of Huntington, WV. Community asset mapping was conducted in each of these three areas to identify existing resources and potential partners.
FHA seeks to empower faith communities to transform the health and well-being of Appalachia. Currently, FHA is working with faith communities and stakeholders in the Highlawn area of Huntington, WV on their Healthy Happy Highlawn Initiative. As part of this initiative, faith communities and stakeholders planted 100 trees, raised $50,000 to build a habitat house for a local resident, conducted a Thanksgiving worship service and prayer walks, and raised an additional $750 for the St. Mary’s Hospitality House. The initiative recently received $200,000 from the Foundation for the Tri-state America’s Best Communities funding. The funding will be used to continue the initiative’s health and well-being strategies, including: access to healthy, fresh, local produce; family education, such as parenting, cooking, high school completion/GED, and financial navigation classes; building a local picnic shelter for community gatherings; developing safe transportation routes to the new elementary school that are bikeable and walkable; women’s health initiatives; and quality housing for women and children.
FHA is also working in the Fairfield community with a focus on physical health. The lead initiative, “Our Great Harvest,” will seek to educate, provide access, and promote physical wellbeing in prominently African American churches. Beginning in Fall 2019, FHA will partner with four local faith communities to provide education on the impact of healthy eating on overall health and well-being. “Our Great Harvest” will then work with local food distributers to provide pop-up markets to increase access to healthier foods, while also providing cooking demonstrations. Markets will rotate between the four local congregations and will be available to both the congregation and the larger community.
FHA is also working with faith communities in Lawrence County, Ohio in partnership with the Joan C. Edwards School of Medicine. The focus of the work in Lawrence County is to address the needs of individuals and families who are struggling with Substance Use Disorder. Community asset mapping was conducted in Lawrence County in July 2019.