10th June 2022
MADARA Cosmetics AS
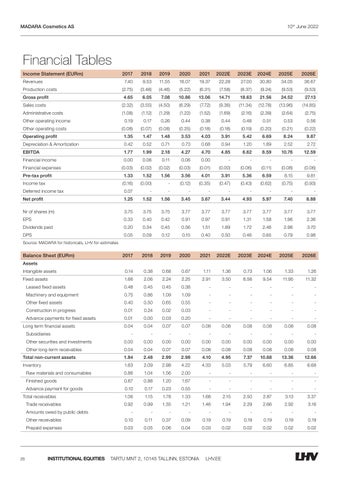
Financial Tables Income Statement (EURm) Revenues Production costs
2017
2018
2019
2020
2021
2022E
2023E
2024E
2025E
2026E
7.40
9.53
11.55
16.07
19.37
22.28
27.00
30.80
34.05
36.67
(2.75)
(3.48)
(4.46)
(5.22)
(6.31)
(7.58)
(8.37)
(9.24)
(9.53)
(9.53)
Gross profit
4.65
6.05
7.08
10.86
13.06
14.71
18.63
21.56
24.52
27.13
Sales costs
(2.32)
(3.55)
(4.50)
(6.29)
(7.72)
(9.36)
(11.34)
(12.78)
(13.96)
(14.85)
Administrative costs
(1.08)
(1.12)
(1.29)
(1.22)
(1.52)
(1.69)
(2.16)
(2.39)
(2.64)
(2.75)
0.19
0.17
0.26
0.44
0.38
0.44
0.48
0.51
0.53
0.56
Other operating income
(0.08)
(0.07)
(0.08)
(0.25)
(0.18)
(0.18)
(0.19)
(0.20)
(0.21)
(0.22)
Operating profit
Other operating costs
1.35
1.47
1.48
3.53
4.03
3.91
5.42
6.69
8.24
9.87
Depreciation & Amortization
0.42
0.52
0.71
0.73
0.68
0.94
1.20
1.89
2.52
2.72
EBITDA
1.77
1.99
2.18
4.27
4.70
4.85
6.62
8.59
10.76
12.59
Financial income
0.00
0.06
0.11
0.06
0.00
-
-
-
-
-
(0.03)
(0.02)
(0.02)
(0.03)
(0.01)
(0.00)
(0.06)
(0.11)
(0.08)
(0.06)
1.33
1.52
1.56
3.56
4.01
3.91
5.36
6.59
8.15
9.81
Financial expenses Pre-tax profit Income tax
(0.16)
(0.00)
-
(0.12)
(0.35)
(0.47)
(0.43)
(0.62)
(0.75)
(0.93)
Deferred income tax
0.07
-
-
-
-
-
-
-
-
-
Net profit
1.25
1.52
1.56
3.45
3.67
3.44
4.93
5.97
7.40
8.88
Nr of shares (m)
3.75
3.75
3.75
3.77
3.77
3.77
3.77
3.77
3.77
3.77
EPS
0.33
0.40
0.42
0.91
0.97
0.91
1.31
1.58
1.96
2.36
Dividends paid
0.20
0.34
0.45
0.56
1.51
1.89
1.72
2.46
2.98
3.70
DPS
0.05
0.09
0.12
0.15
0.40
0.50
0.46
0.65
0.79
0.98
2017
2018
2019
2020
2021
2022E
2023E
2024E
2025E
2026E
0.14
0.38
0.68
0.67
1.11
1.36
0.73
1.06
1.33
1.26
Source: MADARA for historicals, LHV for estimates
Balance Sheet (EURm) Assets Intangible assets Fixed assets
1.66
2.06
2.24
2.25
2.91
3.50
6.56
9.54
11.95
11.32
0.48
0.45
0.45
0.38
-
-
-
-
-
-
Machinery and equipment
0.75
0.86
1.09
1.09
-
-
-
-
-
-
Other fixed assets
0.40
0.50
0.65
0.55
-
-
-
-
-
-
Construction in progress
0.01
0.24
0.02
0.03
-
-
-
-
-
-
0.01
0.00
0.03
0.20
-
-
-
-
-
-
0.04
0.04
0.07
0.07
0.08
0.08
0.08
0.08
0.08
0.08
Leased fixed assets
Advance payments for fixed assets Long term financial assets Subsidiaries Other securities and investments Other long-term receivables
-
-
-
-
-
-
-
-
-
-
0.00
0.00
0.00
0.00
0.00
0.00
0.00
0.00
0.00
0.00
0.04
0.04
0.07
0.07
0.08
0.08
0.08
0.08
0.08
0.08
Total non-current assets
1.84
2.48
2.99
2.98
4.10
4.95
7.37
10.68
13.36
12.66
Inventory
1.63
2.09
2.98
4.22
4.33
5.03
5.79
6.60
6.85
6.68
Raw materials and consumables
0.86
1.04
1.56
2.00
-
-
-
-
-
-
Finished goods
0.67
0.88
1.20
1.67
-
-
-
-
-
-
Advance payment for goods
0.10
0.17
0.23
0.55
-
-
-
-
-
-
1.06
1.15
1.78
1.33
1.68
2.15
2.50
2.87
3.13
3.37
0.92
0.99
1.35
1.21
1.46
1.94
2.29
2.66
2.92
3.16
-
-
-
-
-
-
-
-
-
-
Other receivables
0.10
0.11
0.37
0.09
0.19
0.19
0.19
0.19
0.19
0.19
Prepaid expenses
0.03
0.05
0.06
0.04
0.03
0.02
0.02
0.02
0.02
0.02
Total receivables Trade receivables Amounts owed by public debts
28
INSTITUTIONAL EQUITIES
TARTU MNT 2, 10145 TALLINN, ESTONIA
LHV.EE


