Tourism statistics
99
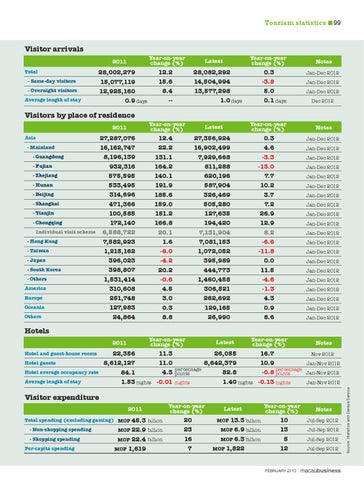
Visitor arrivals Year-on-year change (%)
2011 Total - Same-day visitors - Overnight visitors Average length of stay
28,002,279 15,077,119 12,925,160 0.9 days
Year-on-year change (%)
Latest
28,082,292 14,504,994 13,577,298 1.0 days
12.2 15.6 8.4 --
0.3 -3.8 5.0 0.1 days
Notes Jan-Dec 2012 Jan-Dec 2012 Jan-Dec 2012 Dec 2012
Visitors by place of residence Year-on-year change (%)
2011 Asia - Mainland - Guangdong - Fujian - Zhejiang - Hunan - Beijing - Shanghai - Tianjin - Chongqing Individual visit scheme - Hong Kong - Taiwan - Japan - South Korea - Others America Europe Oceania Others
27,287,076 16,162,747 8,196,139 932,316 575,595 533,495 314,696 471,366 100,585 172,140 6,588,722 7,582,923 1,215,162 396,023 398,807 1,531,414 310,608 251,748 127,983 24,864
Year-on-year change (%)
Latest
12.4 22.2 131.1 164.2 140.1 191.9 185.6 159.0 151.2 166.8
27,356,924 16,902,499 7,929,668 811,288 620,196 587,904 326,469 505,280 127,635 194,420
20.1 1.6 -6.0 -4.2 20.2 -0.6 4.5 3.0 0.3 8.8
7,131,904 7,081,153 1,072,052 395,989 444,773 1,460,458 306,521 262,692 129,165 26,990
Notes
0.3 4.6
Jan-Dec 2012
-3.3 -13.0 7.7 10.2 3.7 7.2 26.9 12.9 8.2 -6.6 -11.8 0.0 11.5 -4.6 -1.3 4.3 0.9 8.6
Jan-Dec 2012
Jan-Dec 2012
Jan-Dec 2012 Jan-Dec 2012 Jan-Dec 2012 Jan-Dec 2012 Jan-Dec 2012 Jan-Dec 2012 Jan-Dec 2012 Jan-Dec 2012 Jan-Dec 2012 Jan-Dec 2012 Jan-Dec 2012 Jan-Dec 2012 Jan-Dec 2012 Jan-Dec 2012 Jan-Dec 2012 Jan-Dec 2012 Jan-Dec 2012
Hotels Hotel and guest-house rooms Hotel guests Hotel average occupancy rate Average length of stay
11.3 22,356 11.0 8,612,127 4.3 84.1 1.53 nights -0.01
percentage points nights
Latest
Year-on-year change (%)
26,055 16.7 8,642,379 10.9 percentage 82.8 -0.8 points 1.40 nights -0.13 nights
Notes Nov 2012 Jan-Nov 2012 Jan-Nov 2012 Jan-Nov 2012
Visitor expenditure 2011 Total spending (excluding gaming) MOP 45.3 billion - Non-shopping spending - Shopping spending Per-capita spending
MOP 22.9 billion
22.4 billion MOP 1,619 MOP
Year-on-year change (%)
20 23 16 7
Latest MOP 13.3 billion MOP 6.9 billion MOP 6.3 billion MOP 1,822
Year-on-year change (%)
10 13 5 12
FEBRUARY 2013
Notes Jul-Sep 2012 Jul-Sep 2012 Jul-Sep 2012 Jul-Sep 2012
Source: Statistics and Census Service
Year-on-year change (%)
2011