Strategic Report
Key Performance Indicators
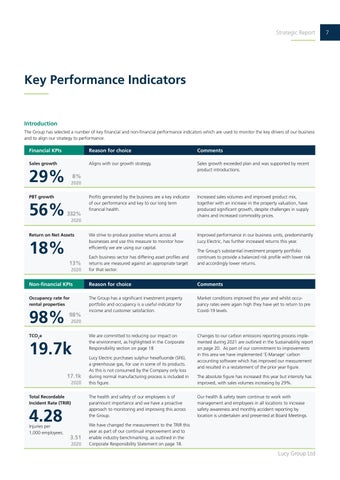
Introduction The Group has selected a number of key financial and non-financial performance indicators which are used to monitor the key drivers of our business and to align our strategy to performance.
Financial KPIs
Reason for choice
Comments
Sales growth
Aligns with our growth strategy.
Sales growth exceeded plan and was supported by recent product introductions.
Profits generated by the business are a key indicator of our performance and key to our long term financial health.
Increased sales volumes and improved product mix, together with an increase in the property valuation, have produced significant growth, despite challenges in supply chains and increased commodity prices.
We strive to produce positive returns across all businesses and use this measure to monitor how efficiently we are using our capital.
Improved performance in our business units, predominantly Lucy Electric, has further increased returns this year.
29%
8% 2020
PBT growth
56%
332% 2020
Return on Net Assets
18% 13% 2020
Each business sector has differing asset profiles and returns are measured against an appropriate target for that sector.
The Group’s substantial investment property portfolio continues to provide a balanced risk profile with lower risk and accordingly lower returns.
Non-financial KPIs
Reason for choice
Comments
Occupancy rate for rental properties
The Group has a significant investment property portfolio and occupancy is a useful indicator for income and customer satisfaction.
Market conditions improved this year and whilst occupancy rates were again high they have yet to return to pre Covid-19 levels.
We are committed to reducing our impact on the environment, as highlighted in the Corporate Responsibility section on page 18
Changes to our carbon emissions reporting process implemented during 2021 are outlined in the Sustainability report on page 20. As part of our commitment to improvements in this area we have implemented ‘E-Manage’ carbon accounting software which has improved our measurement and resulted in a restatement of the prior year figure.
98%
98% 2020
TCO2e
19.7k 17.1k 2020 Total Recordable Incident Rate (TRIR)
The health and safety of our employees is of paramount importance and we have a proactive approach to monitoring and improving this across the Group.
4.28
Injuries per 1,000 employees.
Lucy Electric purchases sulphur hexafluoride (SF6), a greenhouse gas, for use in some of its products. As this is not consumed by the Company only loss during normal manufacturing process is included in this figure.
3.51 2020
The absolute figure has increased this year but intensity has improved, with sales volumes increasing by 29%. Our health & safety team continue to work with management and employees in all locations to increase safety awareness and monthly accident reporting by location is undertaken and presented at Board Meetings.
We have changed the measurement to the TRIR this year as part of our continual improvement and to enable industry benchmarking, as outlined in the Corporate Responsibility Statement on page 18.
Lucy Group Ltd
7


