CENLA ECONOMIC DASHBOARD
July 22, 2021.
Dr.RandallDupont Dean,CollegeofBusinessLouisianaStateUniversityofAlexandria
rdupont@lsua.edu


July 22, 2021.
Dr.RandallDupont Dean,CollegeofBusinessLouisianaStateUniversityofAlexandria
rdupont@lsua.edu
Region 6 (central Louisiana) continues to rank as the second lowest vaccinated region in the state with 27% of the population fully vaccinated, up from 24% in June. Covid cases are beginning to trend up and the trend is across all age groups. Hospitalizations have increased sharply for the region.
Employment in Cenla remained steady in May with a 5.5% unemployment rate compared to 6.7% for the state. Rapides reported a 4.6% unemployment rate, slightly up from 4.5% inApril and almost a percentage point below the region and two points below the state. However, the statewide unemployment rate rose to 7.4% in June. Local unemployment data for June will be available next month.
Hiring pressures have eased some statewide, but remains tight in theAlexandria metro area standing at two openings for each unemployed. Moderate hiring difficulties are expected to continue through the summer. For the thirteenth straight month, theAlexandria MSA had the lowest unemployment rate in the state among metro areas with a rate of 4.6%, with New Orleans reporting the highest at 8.1%.
Statewide initial unemployment claims fell -23% in June and -21% in central Louisiana. Continued claims were little changed in June, falling -1.4% statewide and -2% in central Louisiana.

Changes in consumer spending are measured by changes in sales tax revenue. Sales taxes collected in June reflect activity in May. Spending in May was down compared to March andApril, which were buoyed by stimulus money. The decrease was across the board affecting all jurisdictions reported here. However, year-to-date comparisons remain very positive with spending up between 13% to 69% so far this year.
Vehicle sales were mixed for the month ranging from -8% in St. Landry to 7% in Rapides. So far this year, vehicle sales are up from 25% in St. Landry to 49% in Rapides. Logistical and supply issues along with strong demand have cut auto inventories. Auto dealers are increasingly selling cars before they even hit the lot.
Travelers are on the road again and taking to the skies! While hotel occupancy was mixed for the month, up 5% in Avoyelles and down -10% in Rapides, the industry is having a far better summer than June of last year with increases of 249% and 103%, respectively. Year-to-date local hotel occupancy is up 17% to 20%.
AEX continues to lead recovery of the air transportation sector statewide, with passenger traffic at 109% of the 2019 level in June compared to 74% state and nationwide. Gasoline sales inApril, the latest available data, remained at the highest level since May 2019 and was 49% aboveApril 2020, the first full month of the pandemic shutdown.
Permit data is sending a mixed signal. Commercial permits inAlexandria were surprisingly strong at $4.8 million, with YTD figures up 23%. Residential permits inAlexandria, however, were down -39% for June compared to a month earlier. Overall, residential construction has been weaker throughout the Cenla this Summer with area jurisdictions reporting a -27% decrease in June 2021 compared to a year earlier.
Home sellers were returning to the market in June with active listings up 25% and higher prices have not slowed sales. In June the average listing price increased 6%, while the median listing price was up 11%.And the pace of sales accelerated. Median days on the market fell -32% in June from May and -46% from June 2020. Homes took an average of 38 days to sell in June compared to 70 days a year ago, the fastest pace in 5 years and the second straight monthly record. Lumber prices have pulled back slightly in June falling 1.5%, but remain 39% higher than the first of the year.
New business growth remains strong in central Louisiana. The number of new businesses established in Rapides in June 2021 fell -26% from May, but is 17% higher than June 2020. Year-to-date new businesses in Rapides were up 44% over 2020. Occupational licenses tell a similar story. So far in 2021, licenses are up 3% for the year with rural areas of Rapides growing the fastest at 7%.
COVID-19 vaccinations as a percent of region population as of July 15, 2021.
Region 6 continues to have the second lowest vaccination rate in the state with 27% of the population vaccinated, up from 24% in June.
Region 1 (New Orleans) and Region 2 (Baton Rouge) have the highest rates of vaccination at 47% and 39%, respectively.
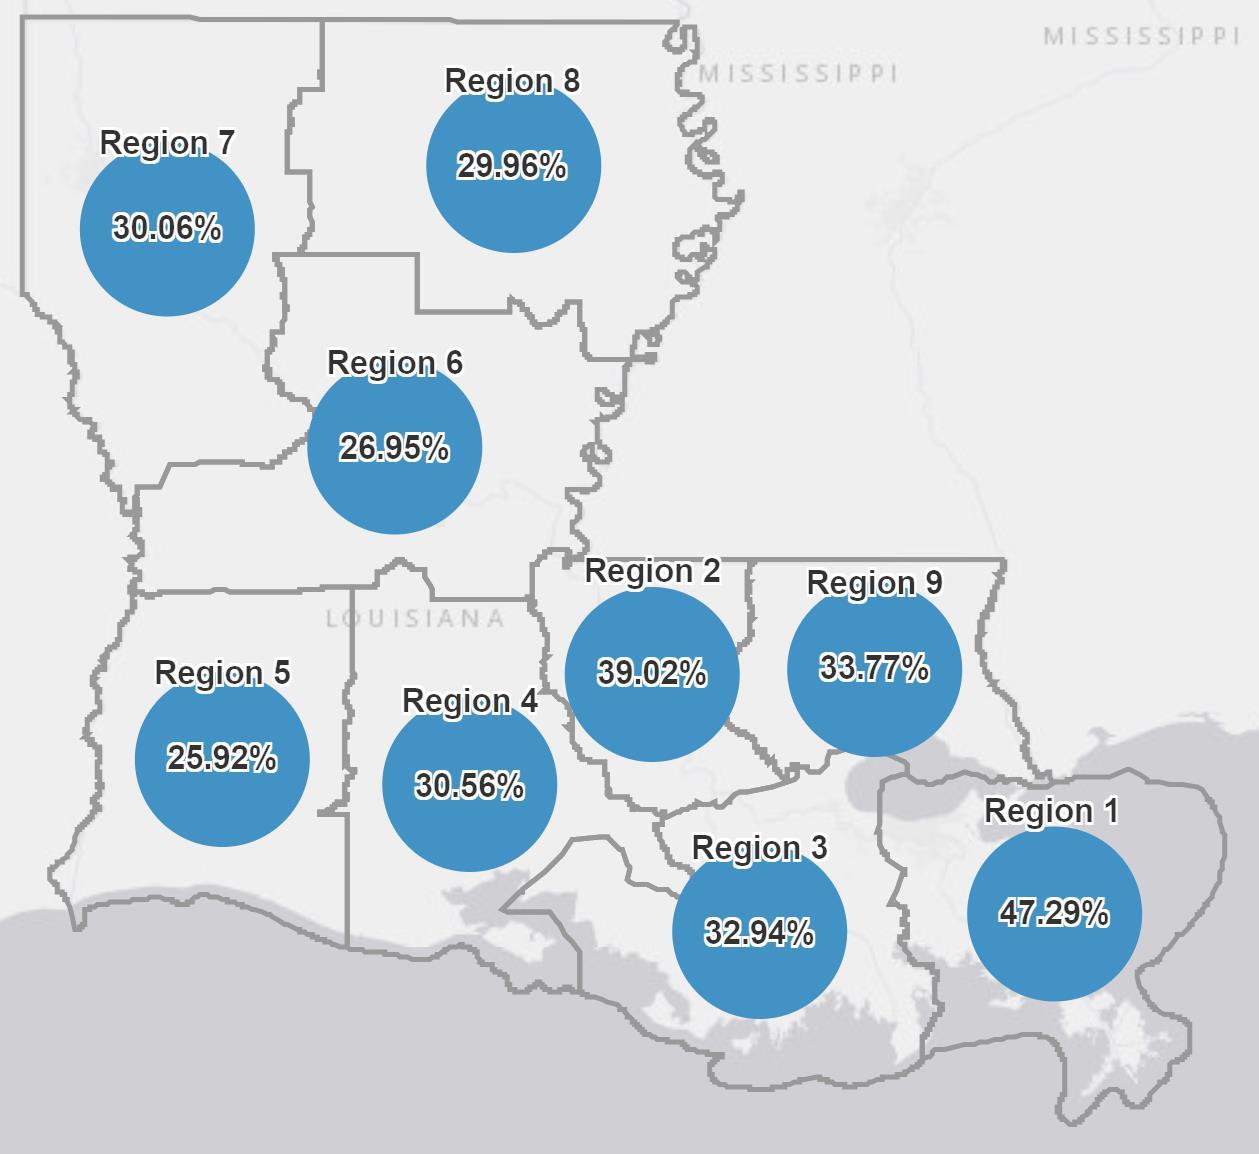
Source: Louisiana Office of Public Health, https://ldh.la.gov/covidvaccine, July 15, 2021
COVID-19 vaccinations as a percent of parish population as of July 15, 2021.
Rapides and Natchitoches have the highest percentage of completed vaccinations in Region 6 at 31% and 29% respectively, up from 28% and 27% a month ago.
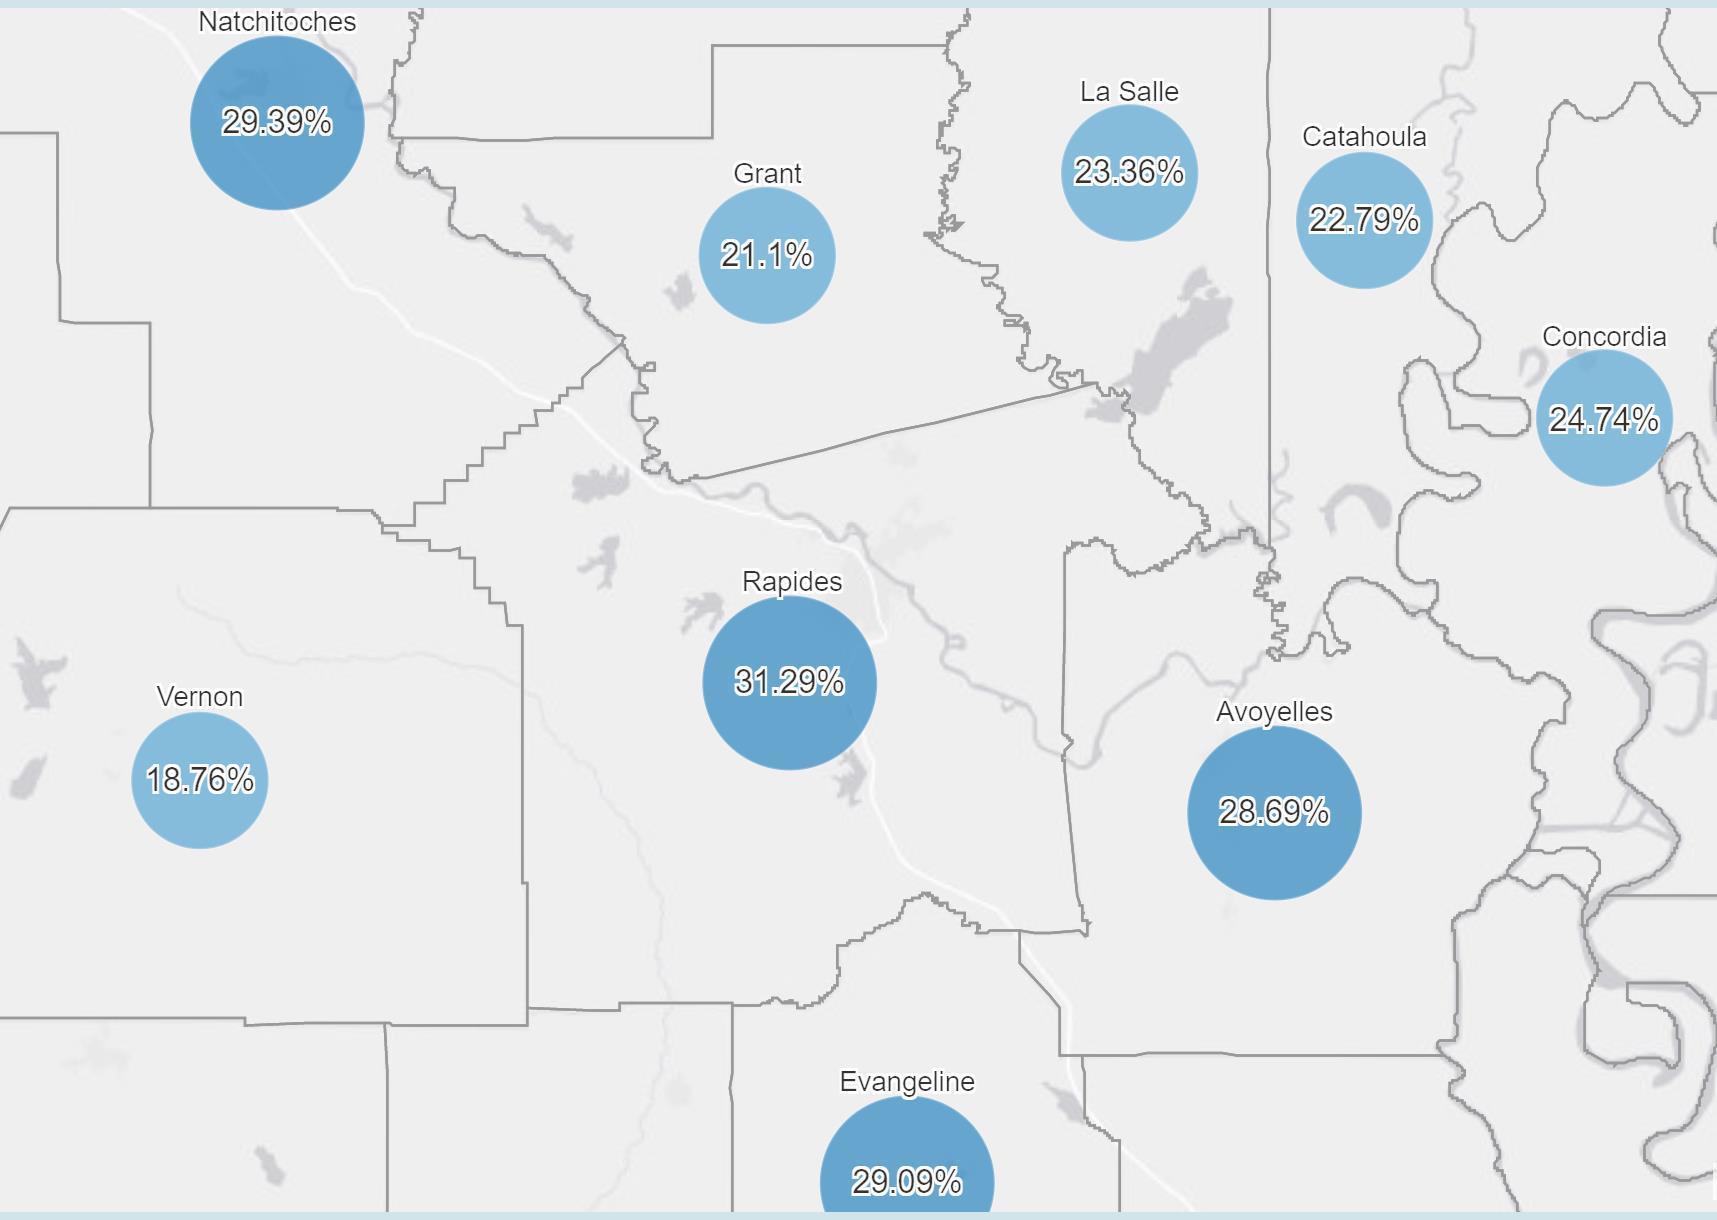
Since the last report,Avoyelles increased from 26.4% to 28.7%, Evangeline 26.6% to 29.0%, Vernon 15.7% to 18.7%, and LaSalle 20.8% to 23.4%.
Source: Louisiana Office of Public Health, https://ldh.la.gov/covidvaccine, July 15, 2021
COVID-19 cases by collection date as of July 15, 2021 in Region 6 with a 7-day moving average.
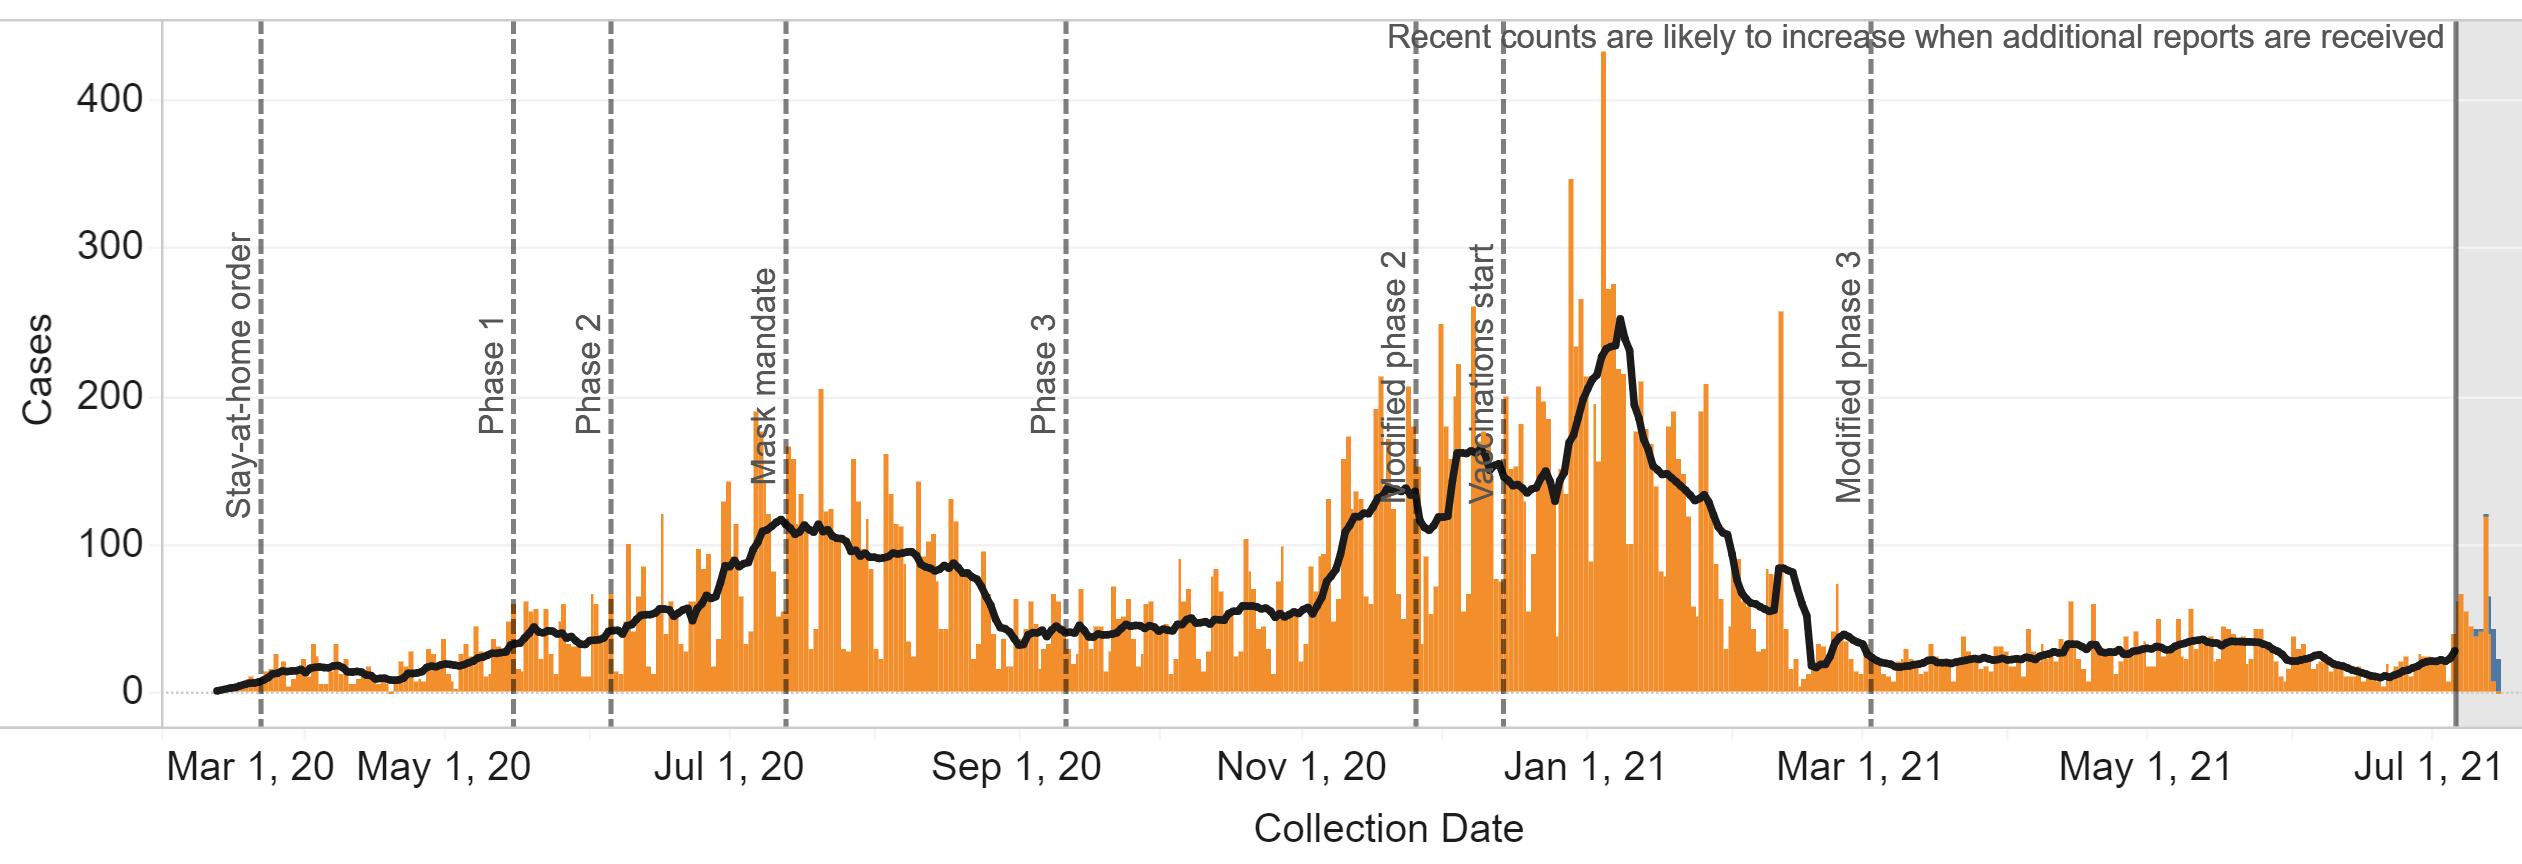
Source: Louisiana Office of Public Health, Region 6 (Central Louisiana), July 15, 2021.
Watch for a change in trend.
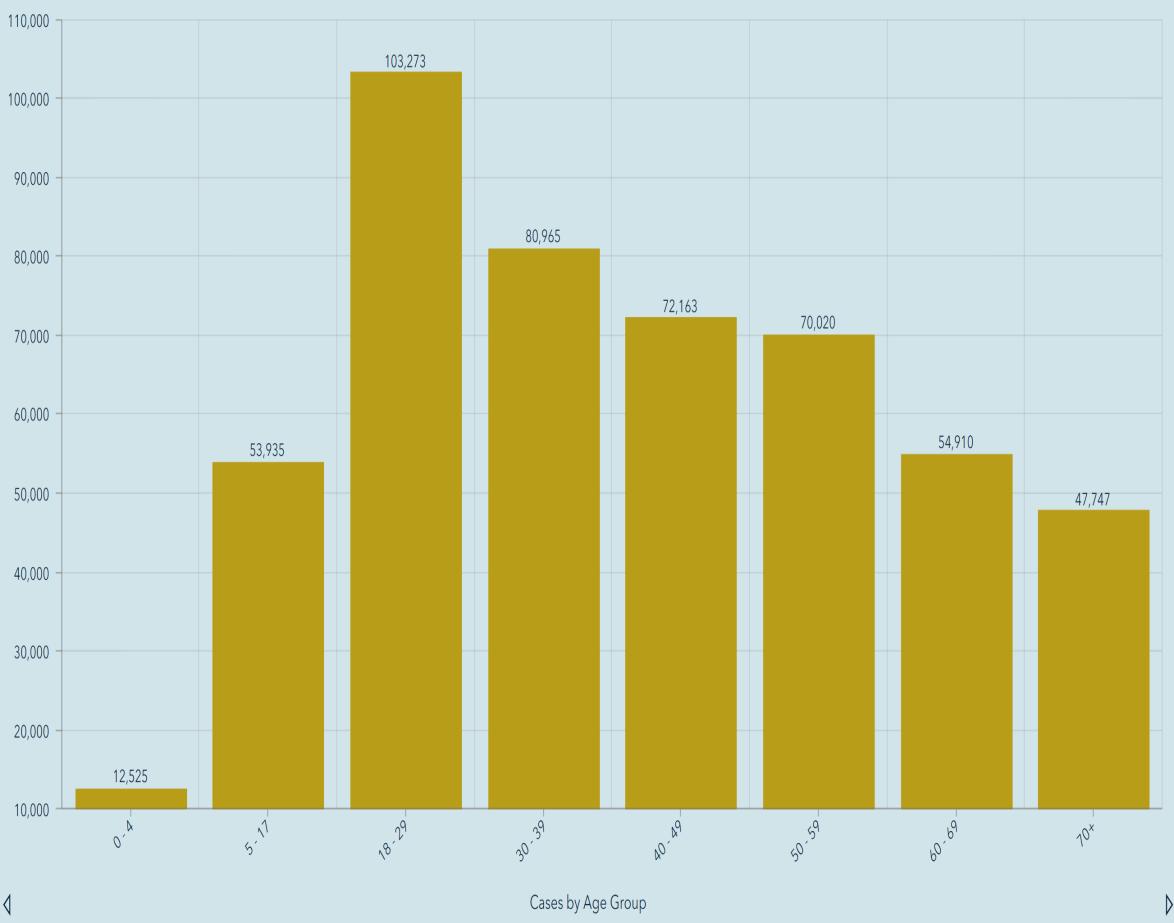
Cases over time by age group in Region 6 through July 15, 2021.
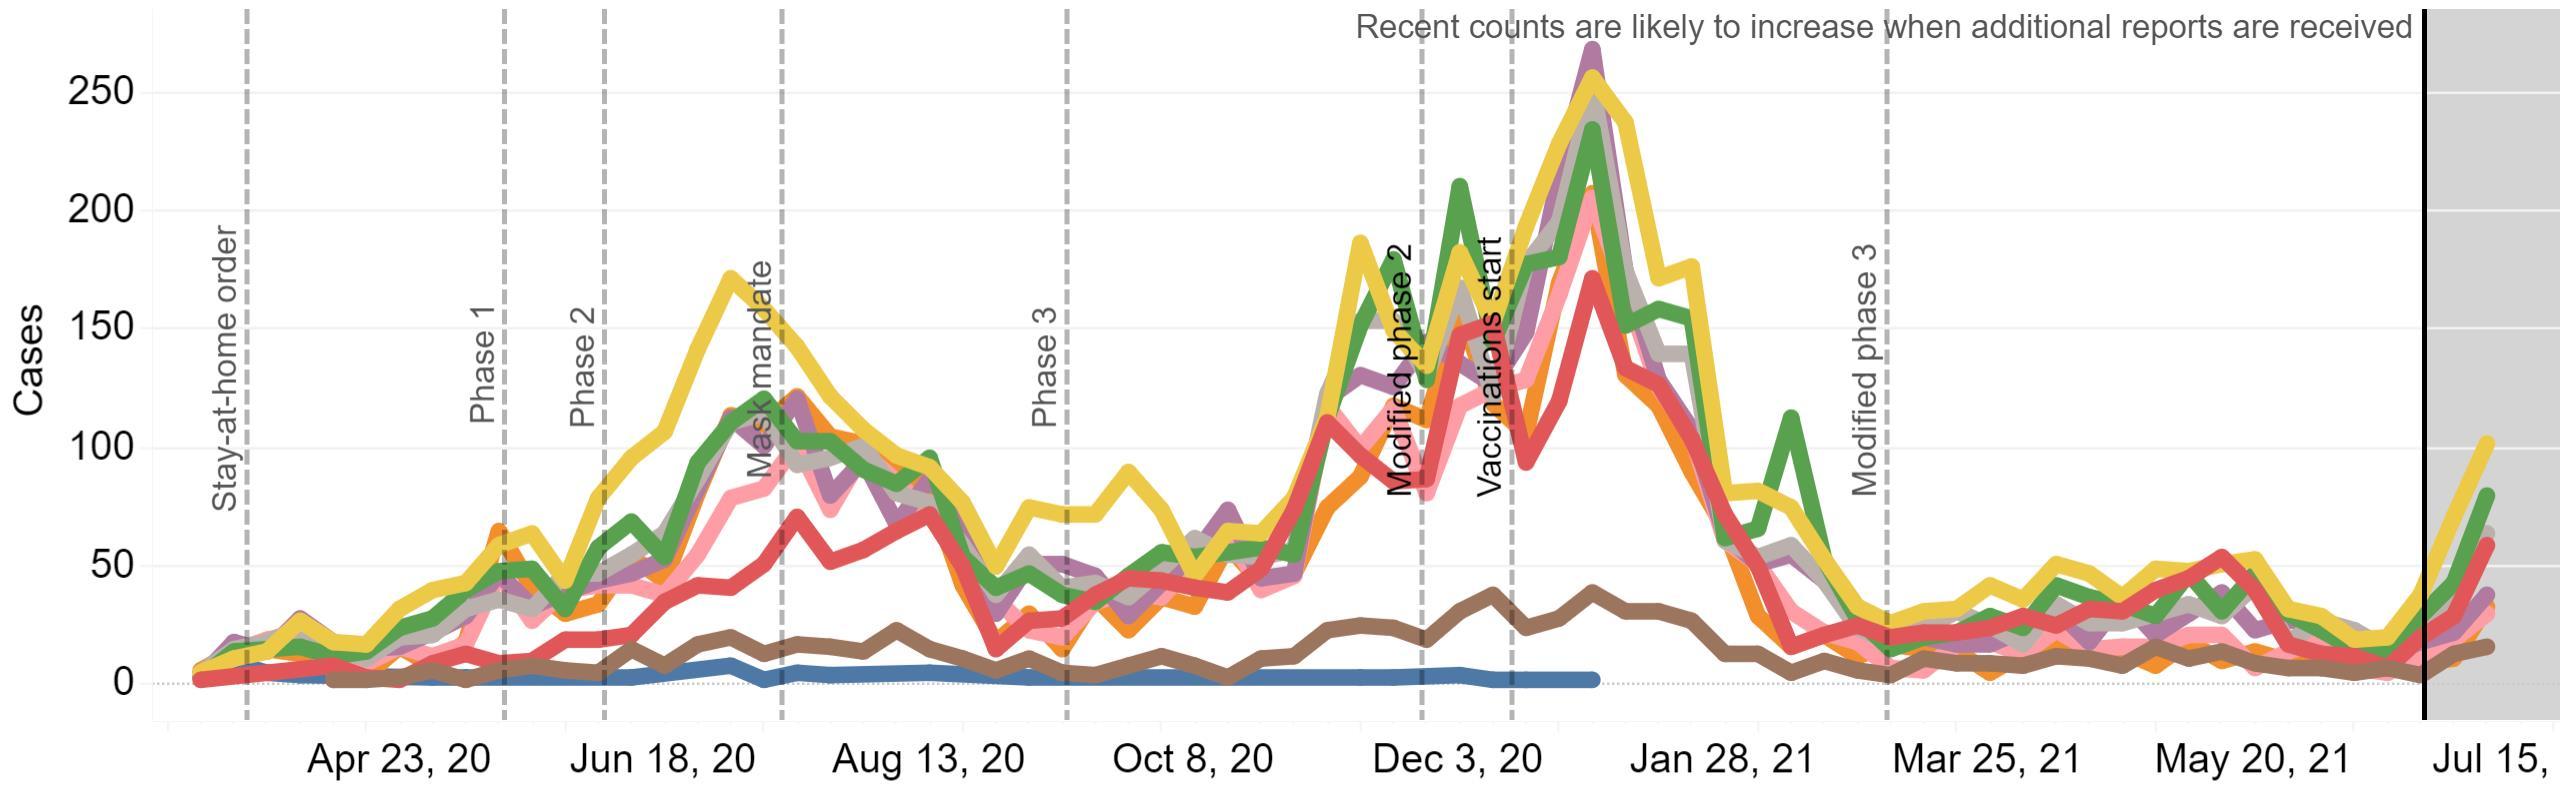
Source: Louisiana Office of Public Health, Region 6 (Central Louisiana), July 15, 2021.

COVID-19 percent positive and test volume in Region 6 as of July 15, 2021.
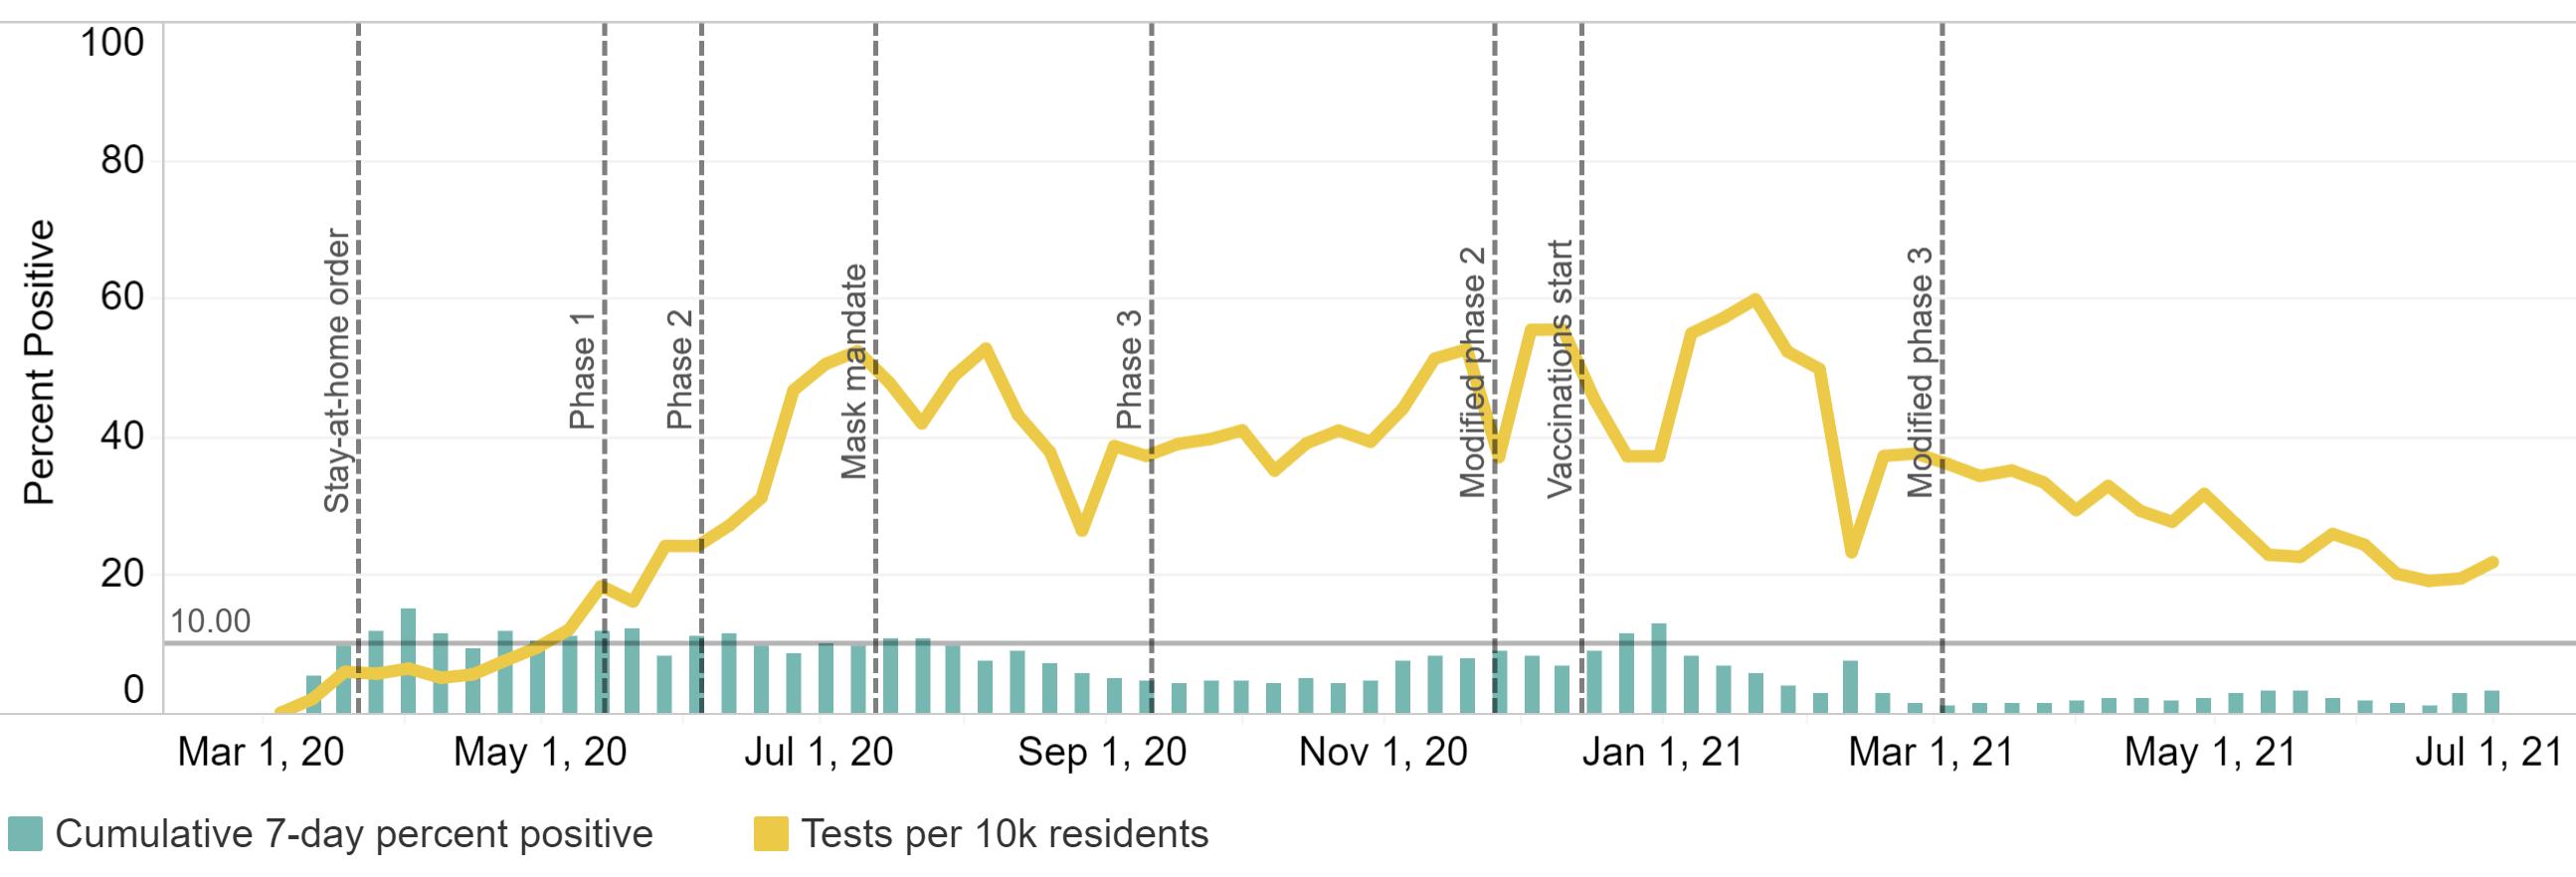
Source: Louisiana Office of Public Health, Region 6 (Central Louisiana), July 15, 2021..
COVID-19 statewide risk by parish.
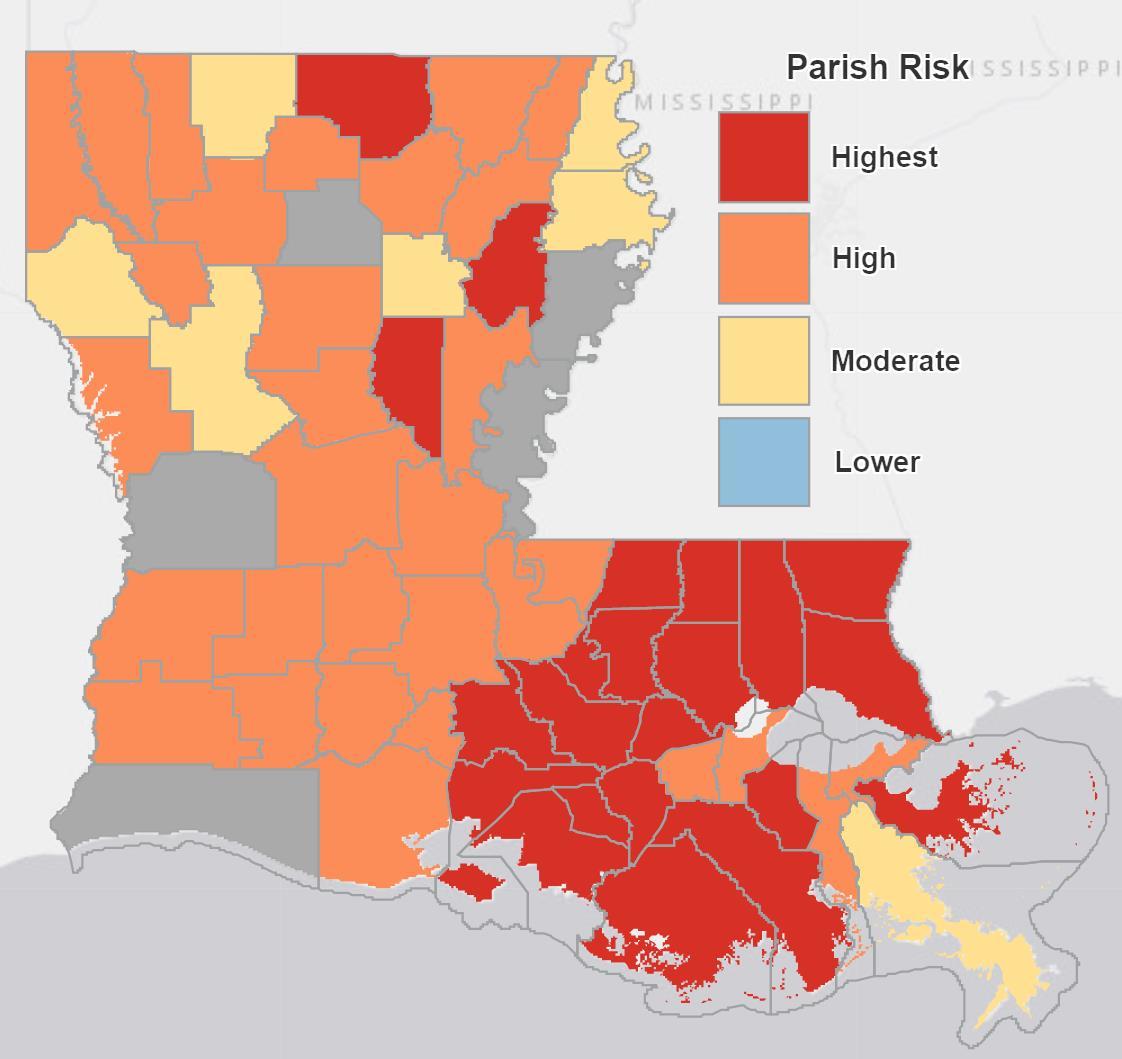
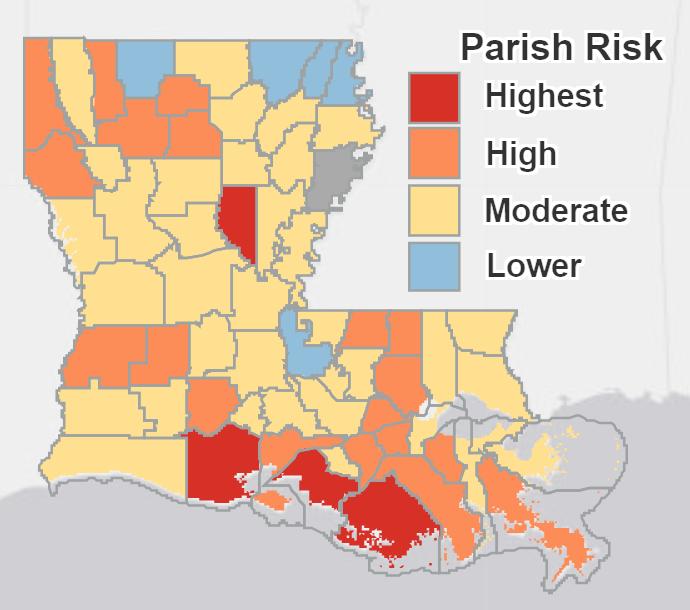
June 11, 2021
July 15, 2021
Source: Louisiana Office of Public Health, Region 6 (Central Louisiana), July 15, 2021.
Number of cases hospitalized (green line) and ventilated (yellow line) in Region 6 as of July 15, 2021.
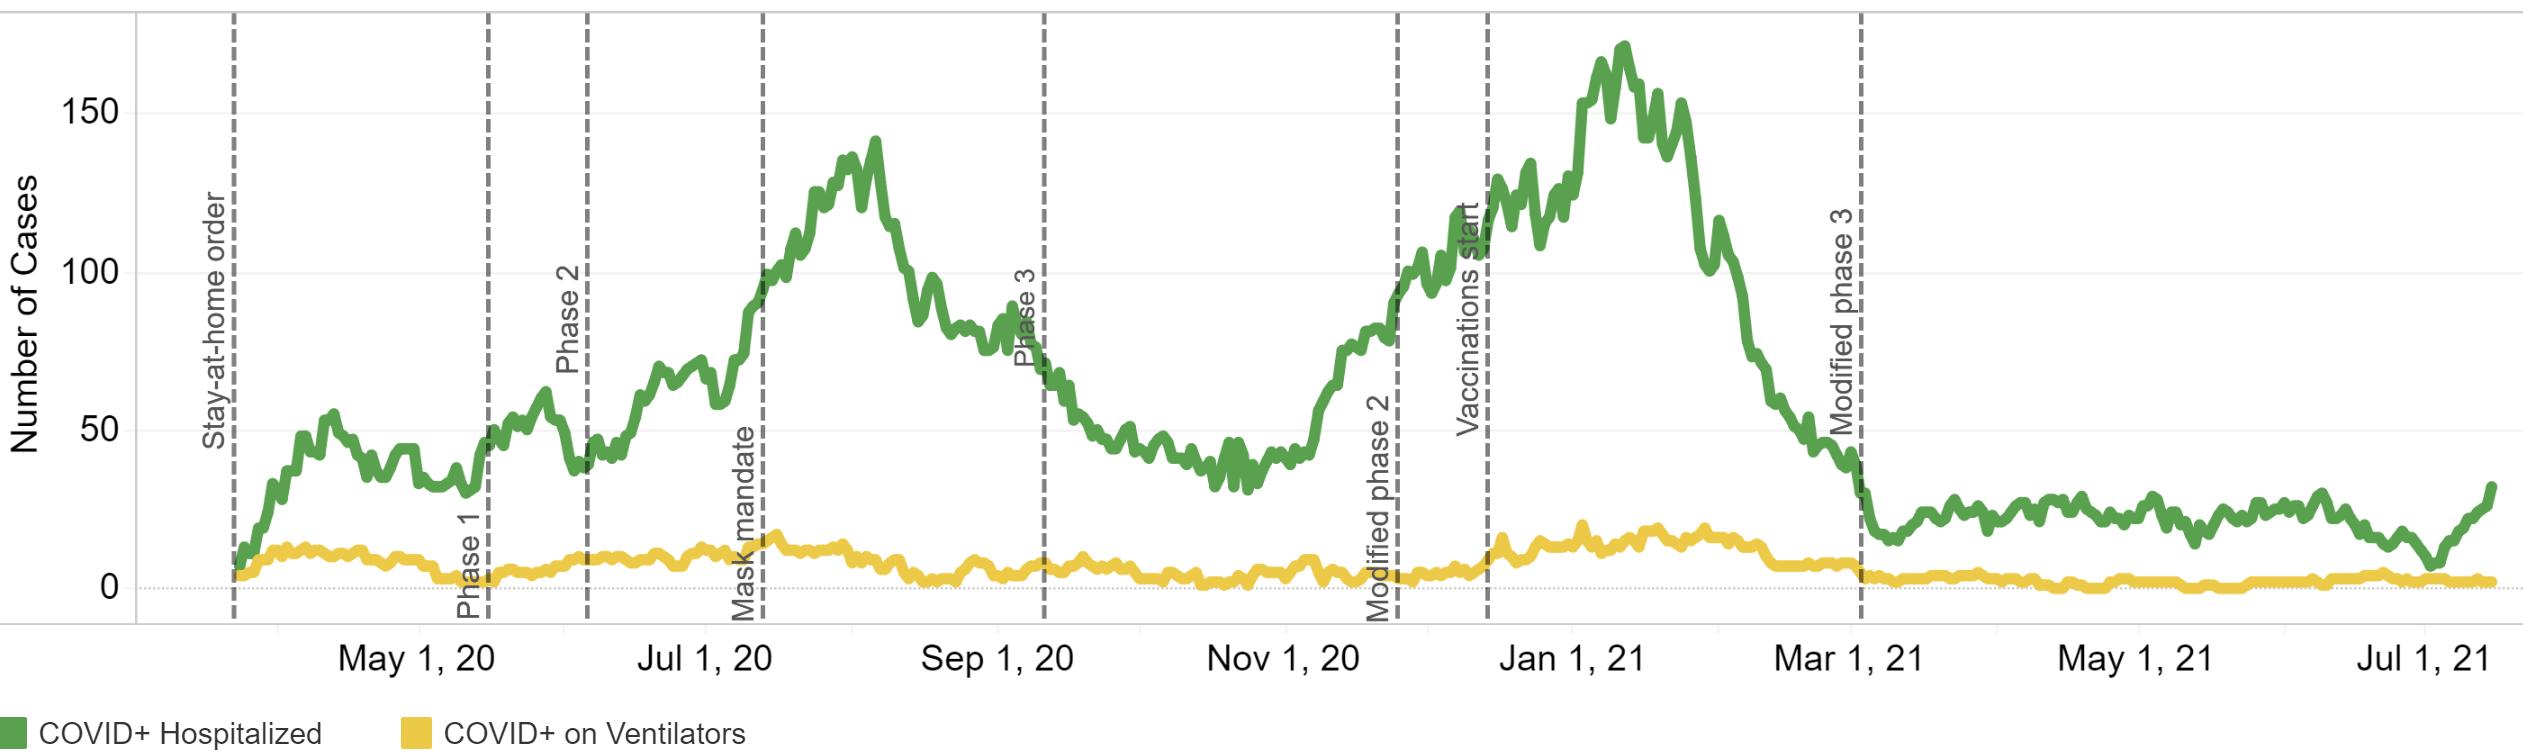
Source: Louisiana Office of Public Health, Region 6 (Central Louisiana), July 15, 2021.
COVID-19 deaths by date of death statewide as of July 15, 2021.
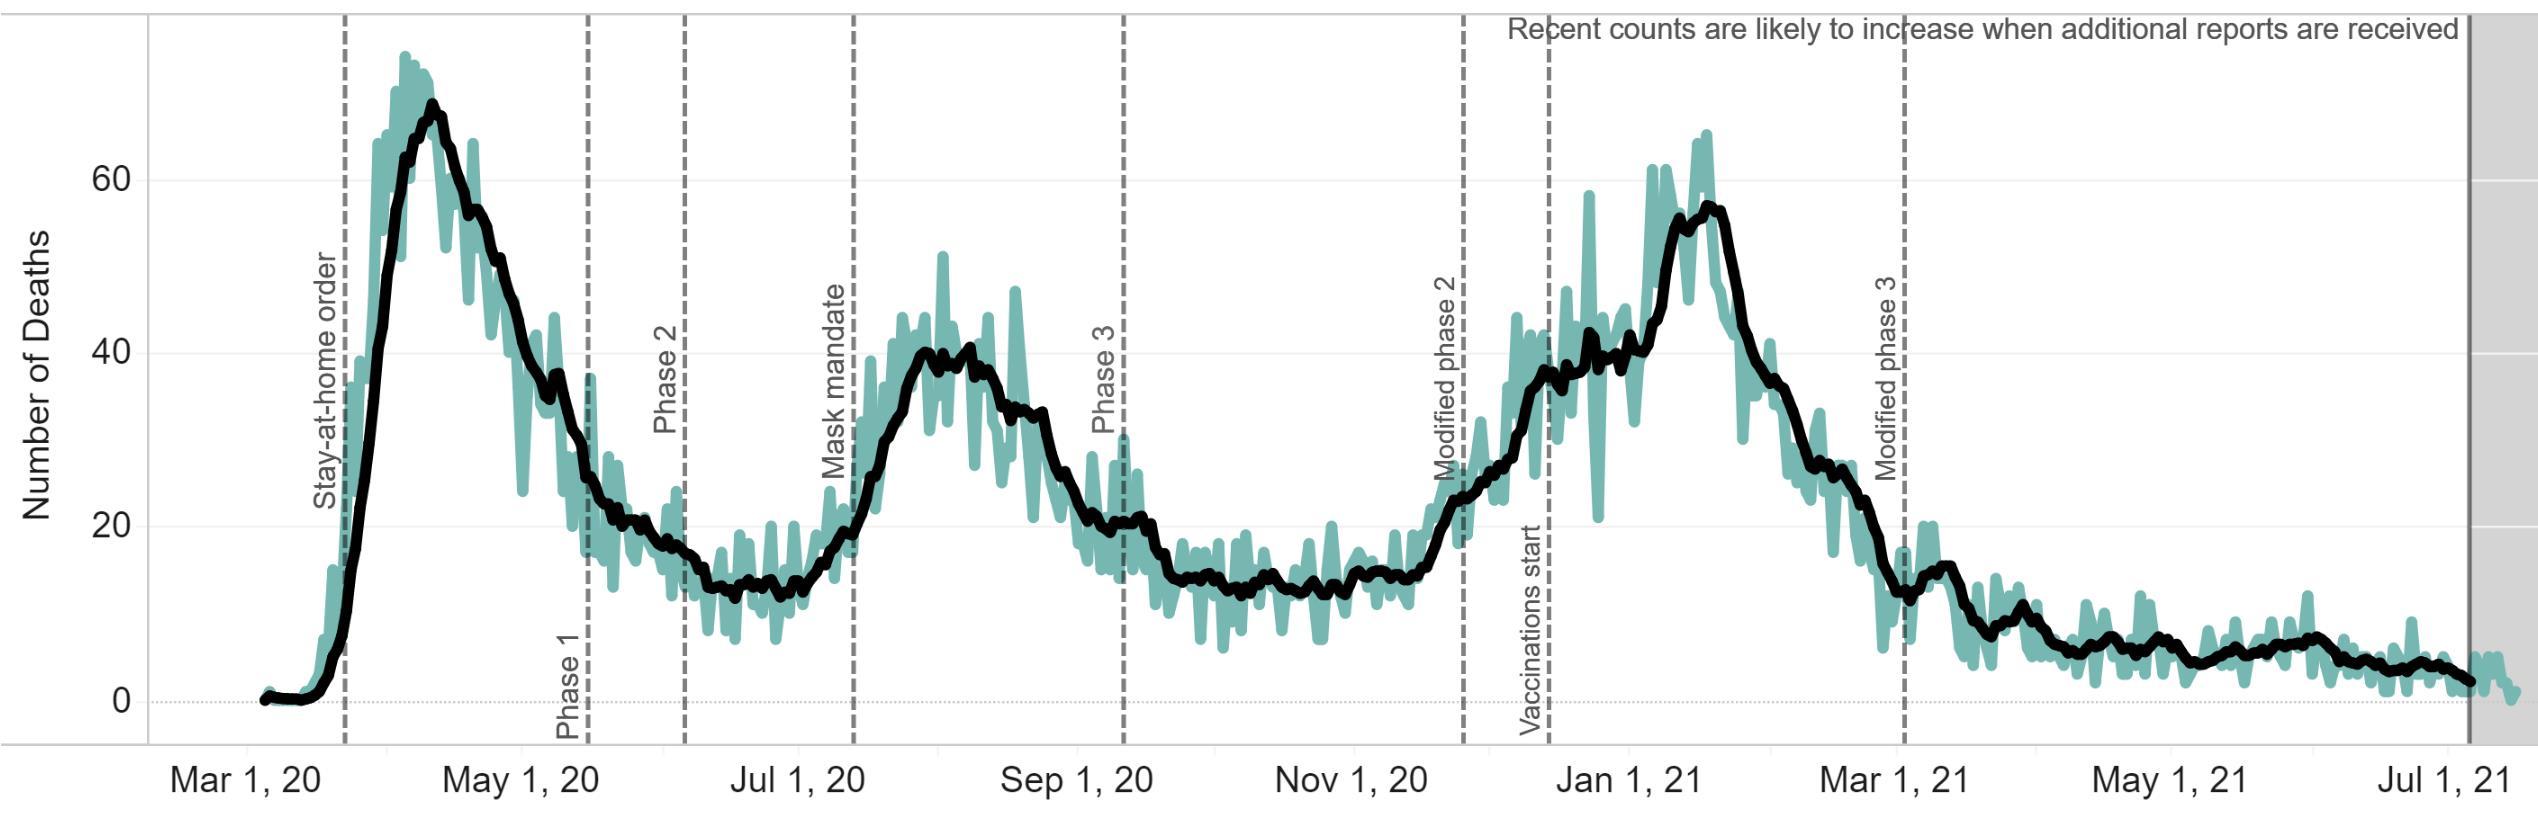
Source: Louisiana Office of Public Health, Region 6 (Central Louisiana), July 15, 2021.
COVID-19 cases (left) and deaths (right) statewide by age group as of July 15, 2021.
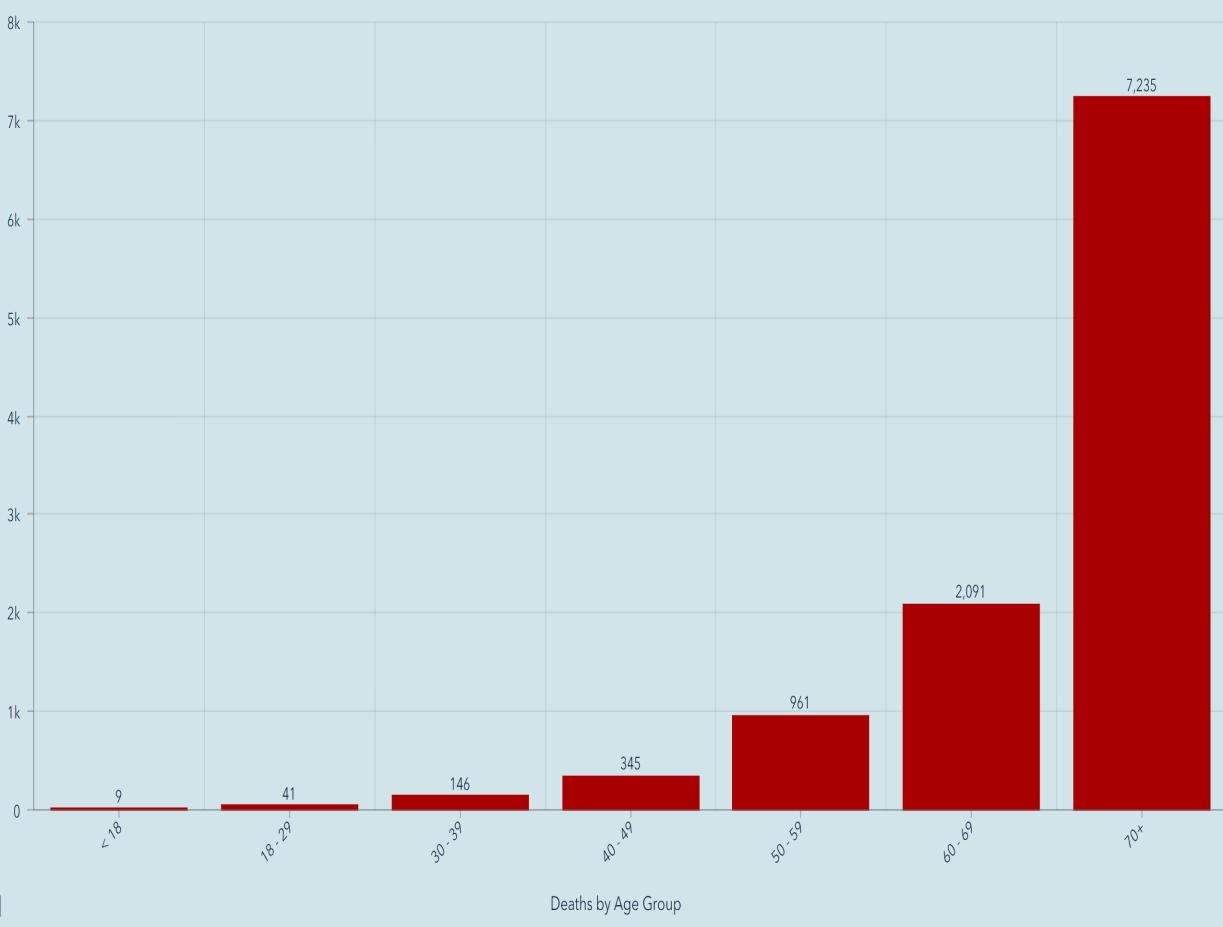
Source: Louisiana Office of Public Health, Region 6 (Central Louisiana), July 15, 2021.
Employed persons in the Alexandria MSA from 2019 – 2021.
In May 2021, 60,506 were employed, which is up 0.15% fromApril’s 60,404.
Source: Louisiana Workforce Commission, July 17, 2021
Initial and continued unemployment claims in Louisiana from January to June 2021.


Statewide average weekly initial unemployment claims filed in June fell to 4,813 from 6,261 in May, a -23% decrease.
Statewide average weekly continued unemployment claims filed in June fell slightly to 49,631 from 50,366 in June, a -1.4% decrease.
Source: Louisiana Workforce Commission, July 21, 2021
Unemployment Claims in Louisiana January - June 2021 Continued Initial
Initial and continued unemployment claims in central Louisiana from January to June 2021.

Average weekly initial unemployment claims in central Louisiana fell to 371 in June from 469 in May, a -21% decrease.
Average weekly continued unemployment claims in central Louisiana fell to 3,261 in June from 3,314 in May, a -2% decrease.
Source: Louisiana Workforce Commission, July 21, 2021
Unemployment Claims in CENLA January - June 2021
The table below shows May 2021 preliminary unemployment rate, labor force, and employment data for central Louisiana parishes.
In May, parishes in central Louisiana had an average unemployment rate of 5.5% compared to 6.7% statewide.
At 3.5%, La Salle Parish had the lowest unemployment rate in the state.
Data Source: Louisiana Workforce Commission, July 21, 2021.
The table below shows May 2021 preliminary unemployment rate, labor force, and employment data for Metropolitan Statistical Areas in Louisiana.
At 4.6%, the Alexandria MSAhad the lowest unemployment rate among the state’s major metro areas for the thirteenth straight month, up 0.2% from the previous month.
Louisiana’s unemployment rate increased 0.1% in May to 6.7%.
Data Source: Louisiana Workforce Commission, July 21, 2021.
The table below shows the number of unemployed, number of advertised jobs online, and the ratio of unemployed to advertised job openings online for Metropolitan Statistical Areas in Louisiana in May 2021.
In May, the Alexandria metro area continues to have the tightest labor market in the state with only 0.55 unemployed persons per job opening.
In May, Louisiana had an unemployed to job openings ratio of 1.25, and 1.41 in June.
An overview of sales, vehicle sales, and hotel occupancy taxes collected in the June 2021 reflecting sales activity in May 2021.
Note: June tax revenue reflects sales activity in May. N/a = Not available
Data Source noted in detailed reports.
An overview of sales tax revenue in Rapides Parish other towns and cities in June 2021 (excluding Alexandria and Pineville).


Note: Current tax revenue reflects sales activity in prior month.


(TR) Alexandria total sales tax revenue for June with previous month, year, and YTD comparisons.
(BR) Alexandria total monthly sales tax revenue from 2019 to present.
Note: June sales tax revenue reflects sales activity in May.
Data Source: Rapides Parish Police Jury Treasurer’s Reports, July 2021.
Avoyelles Parish total sales tax revenue for June with previous month, year, and year-to-date comparisons. Vehicle and hotel tax revenues are excluded. Data
Avoyelles Parish vehicle sales tax revenue for June with previous month, year, and year-to-date comparisons.
Note: June sales tax revenue reflects sales activity in May.
Data Source: Avoyelles Parish School Board. July 2021
Catahoula Parish total sales tax revenue for June with previous month, year, and year-to-date comparisons.
Note: June sales tax revenue reflects sales activity in May.
Data Source: Catahoula Parish Tax Administrator July 2021
Concordia Parish total sales tax revenue for June with previous month, year, and year-to-date comparisons.
Note: June sales tax revenue reflects sales activity in May.
Data Source: Concordia Parish Tax Administrator. July 2021
Evangeline Parish total sales tax revenue for June with previous month, year and YTD comparisons.
Note: June sales tax revenue reflects sales activity in May.
Data Source: Evangeline Parish Sales Tax Commissioner. July 2021
Evangeline Parish vehicle sales tax revenue for June with previous month, year and YTD comparisons.
Note: June sales tax revenue reflects sales activity in May.
Data Source: Evangeline Parish Sales Tax Commissioner. July 2021
La Salle Parish total sales tax revenue for June with previous month, year, and year-to-date comparisons.
Note: June sales tax revenue reflects sales activity in May.
Data Source: La Salle Parish Tax Administrator, July 2021

(TR) Pineville sales tax revenue for June with previous month, year, and YTD comparisons.
(BR) Pineville monthly sales tax revenue from 2019 to present.
Note: Current sales tax revenue reflects sales activity in the prior month.
Data Source: Rapides Parish Police Jury Treasurer’s Reports, July 2021.
Rapides Parish occupational license revenue YTD with previous YTD comparisons.
Note: Rapides Parish reflects unincorporated areas.
Data Source: Rapides Parish Police Jury Treasurer’s Reports, July 2021.
(TR) Rapides Parish sales tax revenue for June with previous month, year, and YTD comparisons.
(BR) Rapides monthly sales tax revenue from 2019 to present.
Note: Current sales tax revenue reflects sales activity in the prior month.
Data Source: Rapides Parish Police Jury Treasurer’s Reports, July 2021.
Rapides Parish vehicle sales tax revenue for June with previous month, year, and YTD comparisons. Data Source:
St. Landry Parish sales tax revenue for June with previous month, year, and YTD comparisons.
Note: June sales tax revenue reflects sales activity in May.
Data Source: Tax revenue data from St. Landry Parish School Board. July 2021
St. Landry Parish vehicle sales tax revenue for June with previous month, year, and YTD comparisons.
Note: June sales tax revenue reflects sales activity in May.
Data Source: Tax revenue data from St. Landry Parish School Board. July 2021
Remote seller tax revenue is tax revenue from online sales by location of the seller at the time of purchase.
August 2020 - June 2021
SinceAugust 2020, $13.2 million in sales tax revenue have been collected from online sales in central Louisiana.
Online sales tax revenue in June increased 15% from May.
Note: Sales tax revenue collected in June reflects sales activity in May.
Data Source: Louisiana Sales and Use Tax Commission for Remote Sellers. August 2020 – July 2021


Remote sellers tax revenue is tax revenue from online sales by location of the seller at the time of purchase.
Note: Sales tax revenue collected in one month reflects sales activity in the prior month.
Data Source: Louisiana Sales and Use Tax Commission for Remote Sellers. August 2020 – July 2021


Remote sellers tax revenue is tax revenue from online sales by location of the seller at the time of purchase.
Note: Sales tax revenue collected in one month reflects sales activity in the prior month.
Data Source: Louisiana Sales and Use Tax Commission for Remote Sellers. August 2020 – July 2021


Remote sellers tax revenue is tax revenue from online sales by location of the seller at the time of purchase.
Note: Sales tax revenue collected in one month reflects sales activity in the prior month.
Data Source: Louisiana Sales and Use Tax Commission for Remote Sellers. August 2020 – July 2021
The valuation (estimated development cost) of new commercial construction permits issued by the City of Alexandria in June 2021 with previous month, year, and YTD comparisons.
The valuation (estimated development cost) of new residential construction permits issued by the City of Alexandria in June 2021 with previous month, year, and YTD comparisons.
This chart shows the valuation of permits issued by Rapides Area Planning Commission in Allen Parish in June between 2018-2021 with month-tomonth, year-to-year, and year-to-date comparisons.
Data Source: RapidesArea Planning Commission, July, 2021
This chart shows the valuation of permits issued by Rapides Area Planning Commission in Avoyelles Parish in June between 2019-2021 with month-to-month, year-to-year, and year-to-date comparisons.
Data Source: RapidesArea Planning Commission, July 2021.
This chart shows the valuation of permits issued by Rapides Area Planning Commission in Evangeline Parish in June between 2018-2021 with month-to-month, year-to-year, and year-to-date comparisons.
Data Source: RapidesArea Planning Commission, July 2021.
This chart shows the valuation of permits issued by Rapides Area Planning Commission in the City of Pineville in June between 20182021 with month-to-month, year-to-year, and year-to-date comparisons.
Data Source: RapidesArea Planning Commission, July 2021.
This charts shows the valuation of permits issued by Rapides Area Planning Commission in Rapides Parish (excluding Alexandria) in June between 20182021 with month-to-month, year-to-year, and year-to-date comparisons.
Data Source: RapidesArea Planning Commission, July 2021.
New residential construction permit valuation (estimated development cost) issued by Rapides Area Planning Commission by jurisdiction in June 2021 compared to June 2020.
Valuation of New Residential Construction
June 2020 vs June 2021
Year-over-year value of residential construction in the RAPC jurisdictions decreased from $8.17 million to $5.94 million.
Note: City ofAlexandria permits are accounted for separately.
Data Source: RapidesArea Planning Commission, July 2021.
The chart represents the lumber price index in the U.S. from January 2020 – June 2021.
Monthly Price Index of Lumber 2020 - 2021
In June 2021, the US Lumber Price Index declined 1.5% from the previous month.
The US Lumber Price Index has risen in 8 of the last 12 month.
Since January 2021, the US Lumber Price Index rose from 321 to 445, a 39% increase.
Data Source: Fed Reserve Economic Database, St. Louis Federal Reserve Bank, July 17, 2021.

The count of active single-family and condo/townhome listings for Alexandria MSA (excludes pending listings) for June 20182021 with month-to-month and year-over-year comparisons.
Active listings in June increased 25% but remain -44% below June 2020.

The count of pending single-family and condo/townhome listings for Alexandria MSA for June 2018-2021 with month-to-month and year-over-year comparisons.
Pending listings decreased -7.5% over last month but remain up 9.1% since last June.

Median days on the market fell -32% in June from May 2021 and -46% from June 2020.
Homes took an average of 38 days on the market to sell in June, the quickest in 5 years and second straight record.
The median number of days property listings spend on the market in Alexandria MSA for June 2018-2021 with month-to-month and year-over-year comparisons. Data Source: Realtor.com. Retrieved from FRED, Federal Reserve Bank of

The median listing price of houses in Alexandria MSA for June 20182021 with month-to-month and year-over-year comparisons.
The median listing price rose 11% over last month from $161,500 to $179,900, but still remains -15% below the June 2020 level.

The average listing price of houses in Alexandria MSA for June 2018-2021 with month-to-month and year-over-year comparisons.
The average listing price rose 6.1% to $252,577 this month from $238,110 in May, and is only -1.8% below the year ago level.
Avoyelles Parish hotel occupancy tax revenue for June with previous month, year, and year-to-date comparisons.
Note: June tax revenue reflects hotel occupancy activity in May. Hotel occupancy tax revenue is used as a proxy for hotel occupancy rate.
Data Source: Avoyelles Parish School Board. July 2021.
Rapides Parish hotel occupancy tax revenue for June 2020 with previous month, year, and YTD comparisons.
Note: June tax revenue reflects hotel occupancy activity in May. Hotel occupancy tax revenue is used as a proxy for hotel occupancy rate.
Data Source: Rapides Parish Police Jury Treasurer’s Reports, July 2021.
This chart shows total passenger throughput at AEX and other Louisiana airports in June 2021 as a percent of traffic in 2019. AEX is the solid black line. Data Source:
Passenger Throughput at AEX as a Percent 2019 Traffic (June 2021)

AEX had the highest percentage of total passenger throughput in the state in June 2021 at 109% of the June 2019 level. The state average is 74%.

Nationwide daily percentage of passengers passing through current TSA checkpoints in 2021 expressed as a percentage of 2019 traffic.
U.S. Airport Passenger Throughput Traffic in 2021 as a Percent of 2019 Traffic
Nationally, air passenger traffic in June was up 14% over May 2021 and was up 284% from a year ago. However, traffic remains -26% below the June 2019 level.
Data Source: DHS, Transportation Security Administration, https://www.tsa.gov/coronavirus/passenger-throughput, July 17, 2021
Total gasoline sales in Louisiana in 2019 - 2021.


InApril 2021, Louisiana gasoline sales reached the highest level since May 2019.
April 2021 gasoline sales remained near the previous month’s level, but was 49% aboveApril 2020, the first full month of the pandemic shutdown.
Data Source: U.S. Energy Information Administration, Prices, Sales Volumes & Stocks by State, July 17, 2021
The chart below represents the number of new businesses established each month in Rapides from January 2019 through June 2021.


The number of new businesses established in Rapides in June 2021 fell -26% in June from May, but are 17% higher than June 2020.
Year-to-date new businesses in Rapides are up 44% over 2020.
Data Source: Rapides Parish Sales and Use Tax Department, July 17, 2021.
These graphs represents the percent change in average consumer credit and debit card spending in Louisiana as of June 13, 2021 with January 2020 as the baseline.
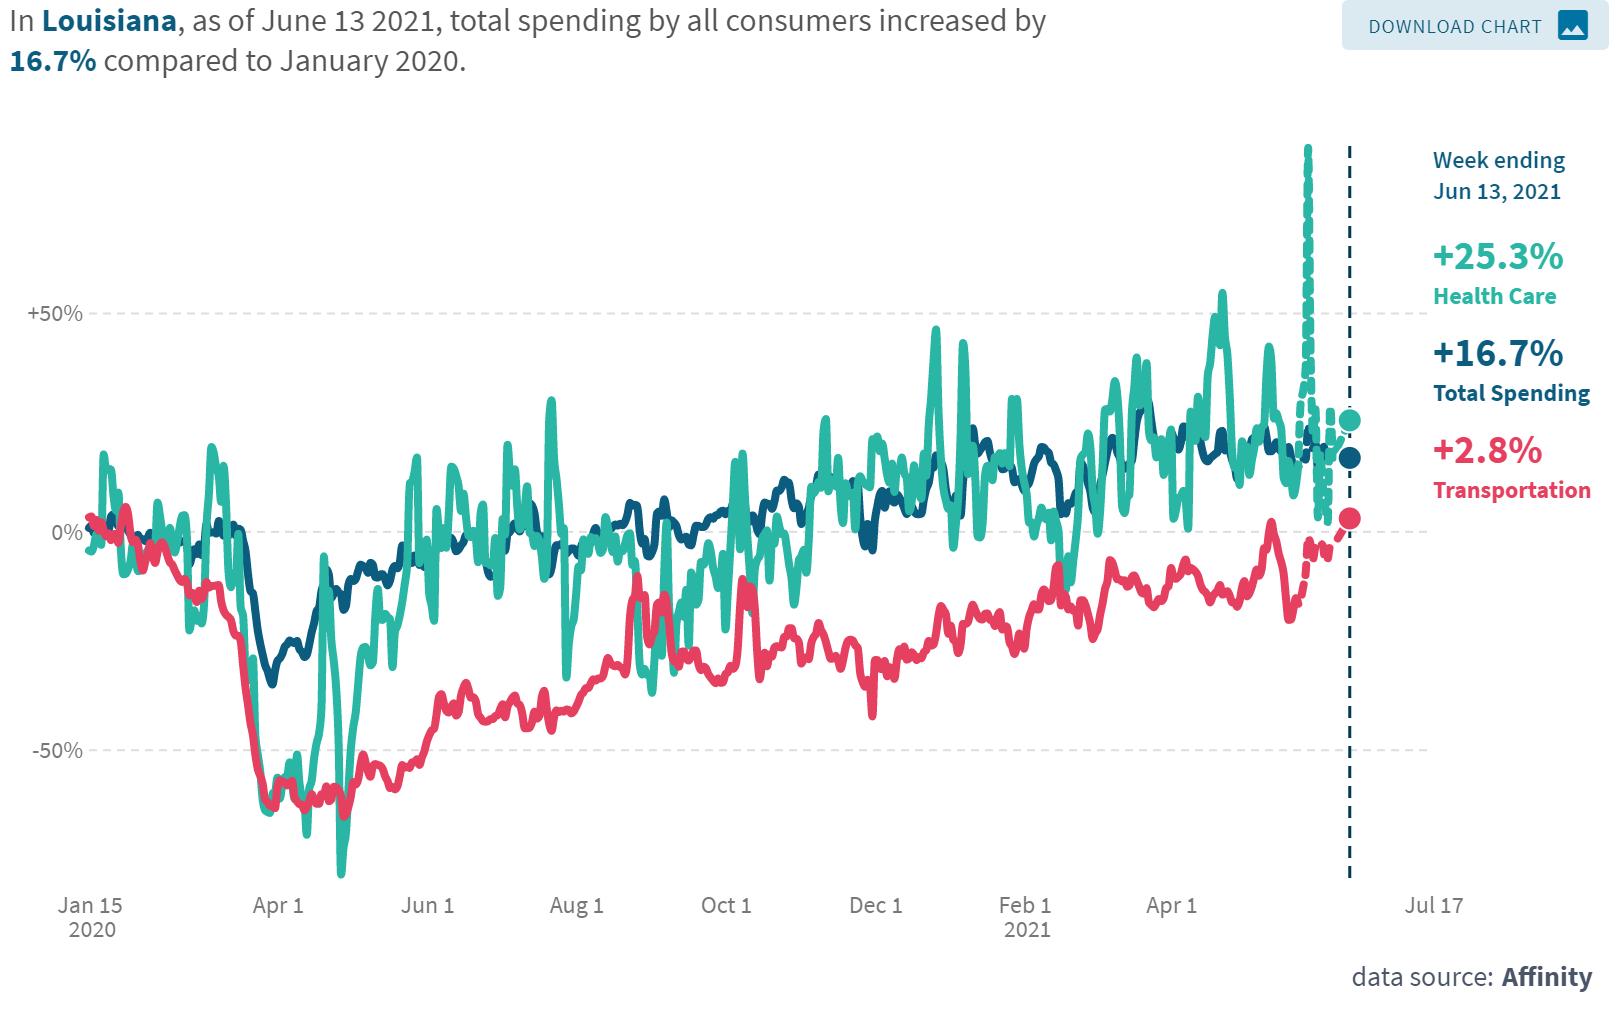
Consumer spending on health care and transportation in Louisiana have reached new pandemic highs. Health care spending reached a new pandemic high on May 27, exceeding the January 2020 baseline by +88%.
Transportation spending reached a new pandemic high on June 13, exceeding the January 2020 baseline by +2.8%.
• Total consumer spending on June 13, 2021 in Louisiana was up 17% compared to January 2020, with retail spending up 31%and entertainment and recreation spending up 12%. Grocery spending was up 11%, health care up 25%, and restaurants up 8%. This is the first time since the start of the pandemic that spending is above the January 2020 baseline in every major category.
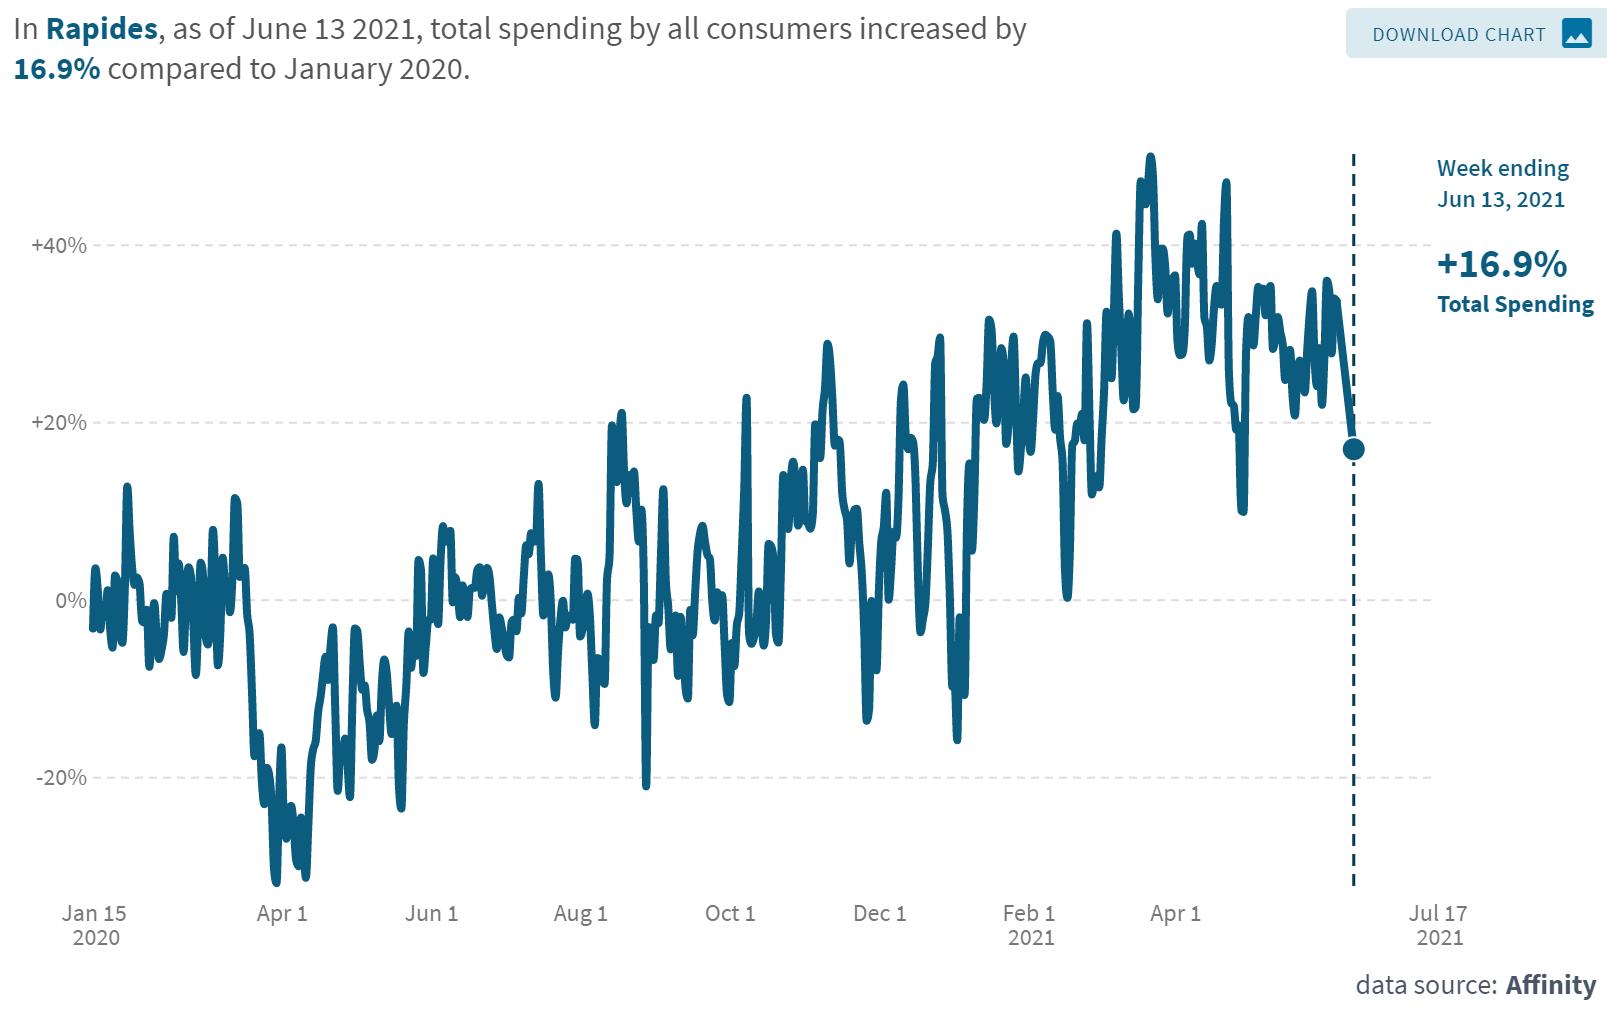
The table and chart represents the percent change in average consumer credit and debit card spending in Cenla as of June 13, 2021 with January 2020 as the baseline, while the chart represents Rapides.
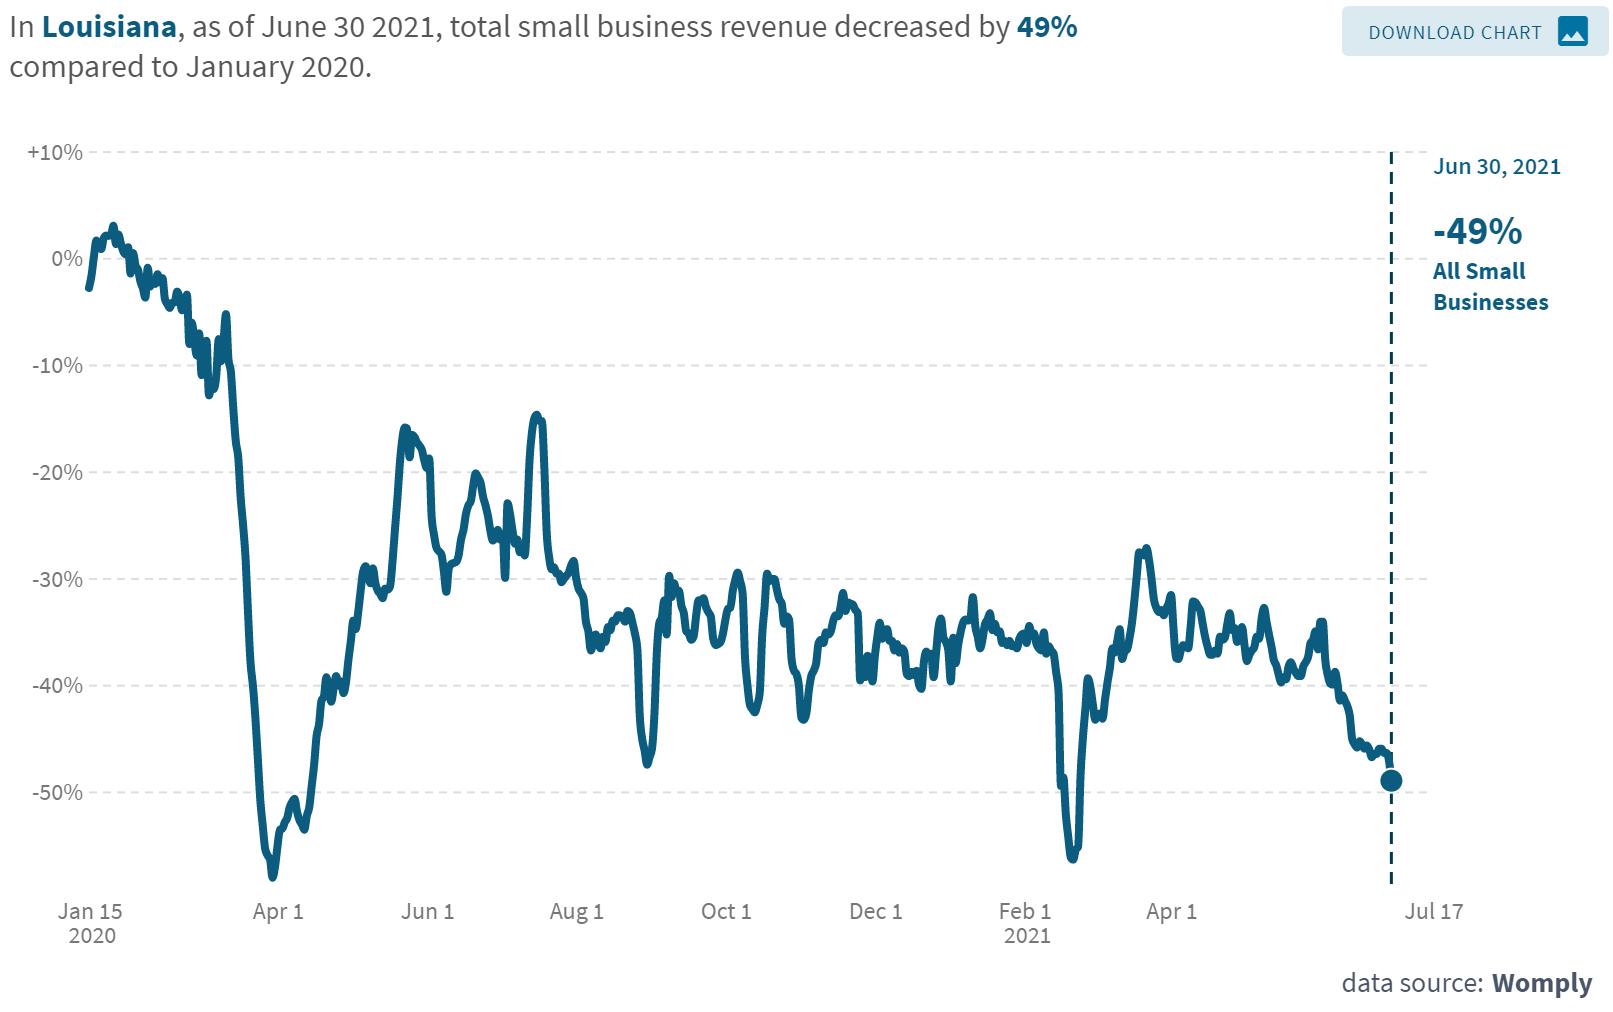
The chart below represents the percent change in small business revenue in Louisiana as of June 30, 2021 with January 2020 as the baseline. The table shows the percentage change for small business revenue by industry.
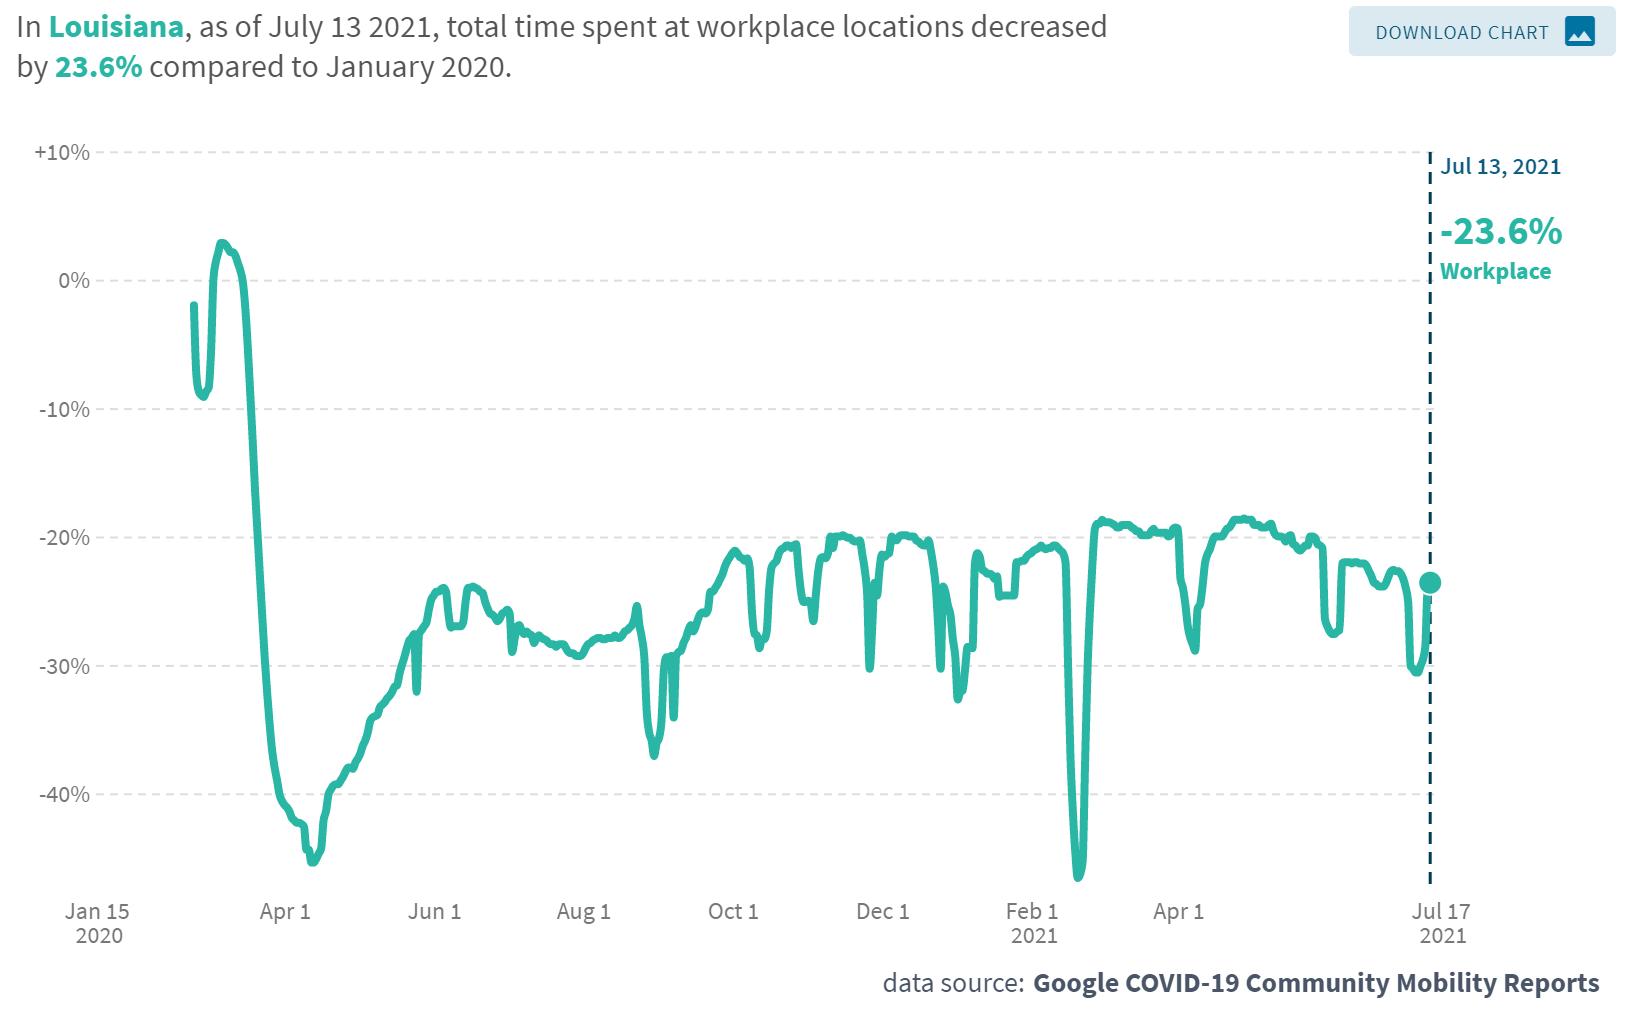
The chart represents the percent of time employees in Cenla and statewide spent at work as of July 13, 2021 with January 2020 as the baseline.
The Coincident Economic Activity Index for Louisiana includes four indicators: nonfarm payroll employment, the unemployment rate, average hours worked in manufacturing and wages and salaries. The index is set to match the trend for gross state product.
Coincident Economic Activity Index for Louisiana
The Index for May 2021 remained unchanged over April, indicating the economic recovery in Louisiana is stalling.

Data Source: FRED Economic Data, Federal Reserve Bank of St. Louis, July 17, 2021. https://fred.stlouisfed.org/series/LAPHCI
Represents the number of drilling rigs actively exploring for or developing oil or natural gas in Louisiana and the U.S.


In June 2021, the rig count in Louisiana decreased by 2% over May 2021, reversing last month’s trend.
In Louisiana, the rig count is up 57% from a year ago and 69% nationwide.
Source: Baker Hughes, https://rigcount.bakerhughes.com/na-rig-count, July 17, 2021
Gaming revenue in Louisiana for June 2021 with previous month and year comparisons.
Casinos were reopened May 15, 2020.
Data Source: Louisiana Gaming Control Board, July 17, 2021. http://lgcb.dps.louisiana.gov/revenue_reports.html
Monthly U.S. economic indicators for May 2021.
Data Source: U.S. Census, https://www.census.gov/economic-indicators/ July 18, 2021.
The data presented throughout the CENLA Economic Dashboard reflects contributions from the following local organizations.
• Rapides Parish Policy Jury Treasurer
• Rapides Sales TaxAdministrator
• Avoyelles Parish School Board
• Alexandria International Airport
• RapidesArea Planning Commission
• City ofAlexandria Planning Division
• Evangeline Parish Sales Tax Commissioner
• Concordia, Catahoula, & La Salle TaxAdministrator
• Louisiana Office of Public Health, Region 6
• St. Landry Parish School Board
Also, special thanks to the following partners for distributing the dashboard.
Next Issue: Week of August 16th
• LSUAFoundation
• Central Louisiana Regional Chamber of Commerce
• Marksville Chamber of Commerce
• Bunkie Chamber of Commerce
• Evangeline Chamber of Commerce
• Concordia Chamber of Commerce
• St. Landry Chamber of Commerce
• Greater Vernon Chamber of Commerce