
Quarterly Market Report
COLORADO’S FRONT RANGE

Welcome
Purchasing a home is one of the greatest investments you will make. We hope this report helps you navigate this fast-moving and ever-changing real estate market.
As we follow the market to see how it will develop towards the end of the year, the Colorado Front Range is still experiencing relatively steady levels of home buying and selling. The number of homes sold across the state decreased in comparison to the previous year, however, median home prices have only slightly shifted year-overyear. Interest rates seem to have plateaued, and homes continue to sell for list price, with
a slight decrease in price adjustments over last year. The real estate market throughout Colorado’s Front Range is making its way back to its regularly observed seasonal buying and selling trends.
We recognize each locality is unique and no two regions respond to market shifts the same way. To aid in presenting an accurate picture of each of the areas that make up Colorado, LIV Sotheby’s International Realty is proud to present our Quarterly Market Report for Colorado’s Front Range representing the metrics of many key and beloved neighborhoods.
2 | livsothebysrealty.com
FRONT RANGE REAL ESTATE MARKET
January - September 2023 | 3 *Denver Metro $575,000 33,038 30 $305 $9,250,000 -1.7% South Metro $700,000 4,368 37 $293 $7,800,000 -1.5% West Metro & Foothills $630,000 5,351 27 $341 $6,100,000 -1.4% Boulder $725,000 2,916 54 $438 $13,000,000 -4.0% Northern Colorado $537,000 5,999 38 $282 $16,000,000 -1.4% Colorado Springs $444,852 5,837 42 $229 $3,955,000 99% Median Price Properties Sold Avg. Days on Market Price per Sq. Ft. Highest Sale List Price to Sold Price *Denver
Q3 $16,000,000 Highest Sold Price
Average Days on Market +37.5% +45.5% 2022 vs 2023 % Change
Properties Sold
Colorado’s Front Range
Metro Counties: Arapahoe, Adams, Denver, Broomfield, Douglas, and Jefferson. All residential properties.
37
44,360
- 34.8%
Greater Denver Metro
As a city with a focus on the outdoors and 300 days of sunshine, it’s no wonder people choose to call Denver and the surrounding communities home. Denver Metro boasts some of the best entertainment options, business opportunities, and outdoor access in the country and for those reasons and many more, this city and its neighboring areas will continue to be a popular choice for home buyers and sellers. As this year progresses, this high-demand market will continue to create opportunities for both buyers and sellers to create the life they love.

Jan - Sept 2023
Median Sold Price
$575,000 -2.5%
Properties Sold 33,038 -26.0%
Average Days on Market 30 46.7%
Average Price per Sq. Ft. $305 -3.0%
% Sold Price, to List Price 99.3% -1.7%
AT A GLANCE
% Change
Counties: Arapahoe, Adams, Denver, Broomfield, Douglas, and Jefferson. All residential properties.
YTD 2022 vs 2023
Total Sales Volume - 26.9% 2022 vs 2023 % Change
$22,270,669,765
$9,250,000 Highest Sold Price
January - September 2023 | 5 Based on Information from REColorado for the period January 1st, 2023 - September 30th, 2023 (Powered by LiveBy). This representation is based in whole or in part on data supplied by REColorado. REColorado does not guarantee nor is in any way responsible for its accuracy. Data maintained by REColorado may not reflect all real estate activity in the market. October 2022 - September 2023 AVERAGE DAYS ON MARKET Jun Jul Aug Sep Oct Nov Dec Jan Feb Mar Apr May 23 35 40 45 49 51 39 30 22 October 2022 - September 2023 TOTAL SALES VOLUME Jun Jul Aug Sep Oct Nov Dec Jan Feb Mar Apr May $1.0B $1.5B $2.0B $2.5B $1.6B $2.3B $2.2B $2.6B $1.1B $1.5B $1.7B $1.9B $3.0B October 2022 - September 2023 MEDIAN SOLD PRICE Jun Jul Aug Sep Oct Nov Dec Jan Feb Mar Apr May $525k $550k $575k $600k $625k
$2.6B 29 23 24 $2.2B $2.3B $1.9B
Denver Metro

$550,000 Median Sold Price
19,889 Properties Sold
% Change
30 Average Days on Market
$339 Price Per Square Foot
6 | livsothebysrealty.com
YTD 2022
2023
-3.5% YTD 2022
2023
+46.7% YTD 2022 vs 2023 % Change -2.2% YTD 2022 vs 2023 % Change
-36.2%
vs
vs
% Change
January - September 2023 | 7 Live Data Live Data Live Data Live Data Live Data Live Data Live Data Live Data Live Data Live Data Live Data City of Denver 6,063 $574,750 28 Broomfield 574 $675,000 26 Commerce City 884 $532,000 35 Englewood 284 $560,000 25 Littleton 364 $617,500 26 Aurora 3,573 $479,000 31 Centennial 919 $652,000 25 Greenwood Village 120 $1,805,000 31 Cherry Hills Village 75 $3,350,000 39 Thornton 1,287 $550,000 30 Westminster 971 $531,000 22 Properties Sold Median Sold Price Average Days on Market Click for Live Data Click for Community Data Live Data
South Metro
$700,000 Median Sold Price
4,368 Properties Sold

-27.6%
YTD 2022 vs 2023
37 Average Days on Market
-1.7% YTD 2022 vs 2023 % Change +48.6%
8 | livsothebysrealty.com
YTD 2022 vs 2023
$293 Price Per Square Foot -0.9% YTD 2022 vs 2023
% Change
% Change
% Change
January - September 2023 | 9 Click for Community Data Highlands Ranch 913 $700,000 22 Lone Tree 91 $1,117,500 32 Parker 798 $650,000 36 Castle Rock 995 $655,000 33 Castle Pines 197 $939,892 40 Sedalia 18 $1,147,850 93 Franktown 2 $1,100,000 106 Larkspur 59 $940,500 52 Properties Sold Median Sold Price Average Days on Market Click for Live Data Live Data Live Data Live Data Live Data Live Data Live Data Live Data Live Data Live Data
West Metro & Foothills

5,351 Properties Sold 27 Average Days on Market
$341 Price Per Square Foot
10 | livsothebysrealty.com
$630,000 Median Sold Price
-29.7% YTD 2022 vs 2023 % Change -1.2% YTD 2022 vs 2023 % Change +44.4% YTD 2022 vs 2023 % Change -1.2% YTD 2022 vs 2023 % Change
January - September 2023 | 11 Arvada 1,211 $615,000 26 Lakewood 1,283 $580,000 22 Wheat Ridge 290 $630,000 27 Evergreen 102 $883,500 28 Morrison 76 $818,700 35 Golden 122 $804,750 25 Conifer 123 $827,000 36 Live Data Live Data Live Data Live Data Live Data Live Data Live Data Properties Sold Median Sold Price Average Days on Market Click for Live Data Click for Community Data Live Data
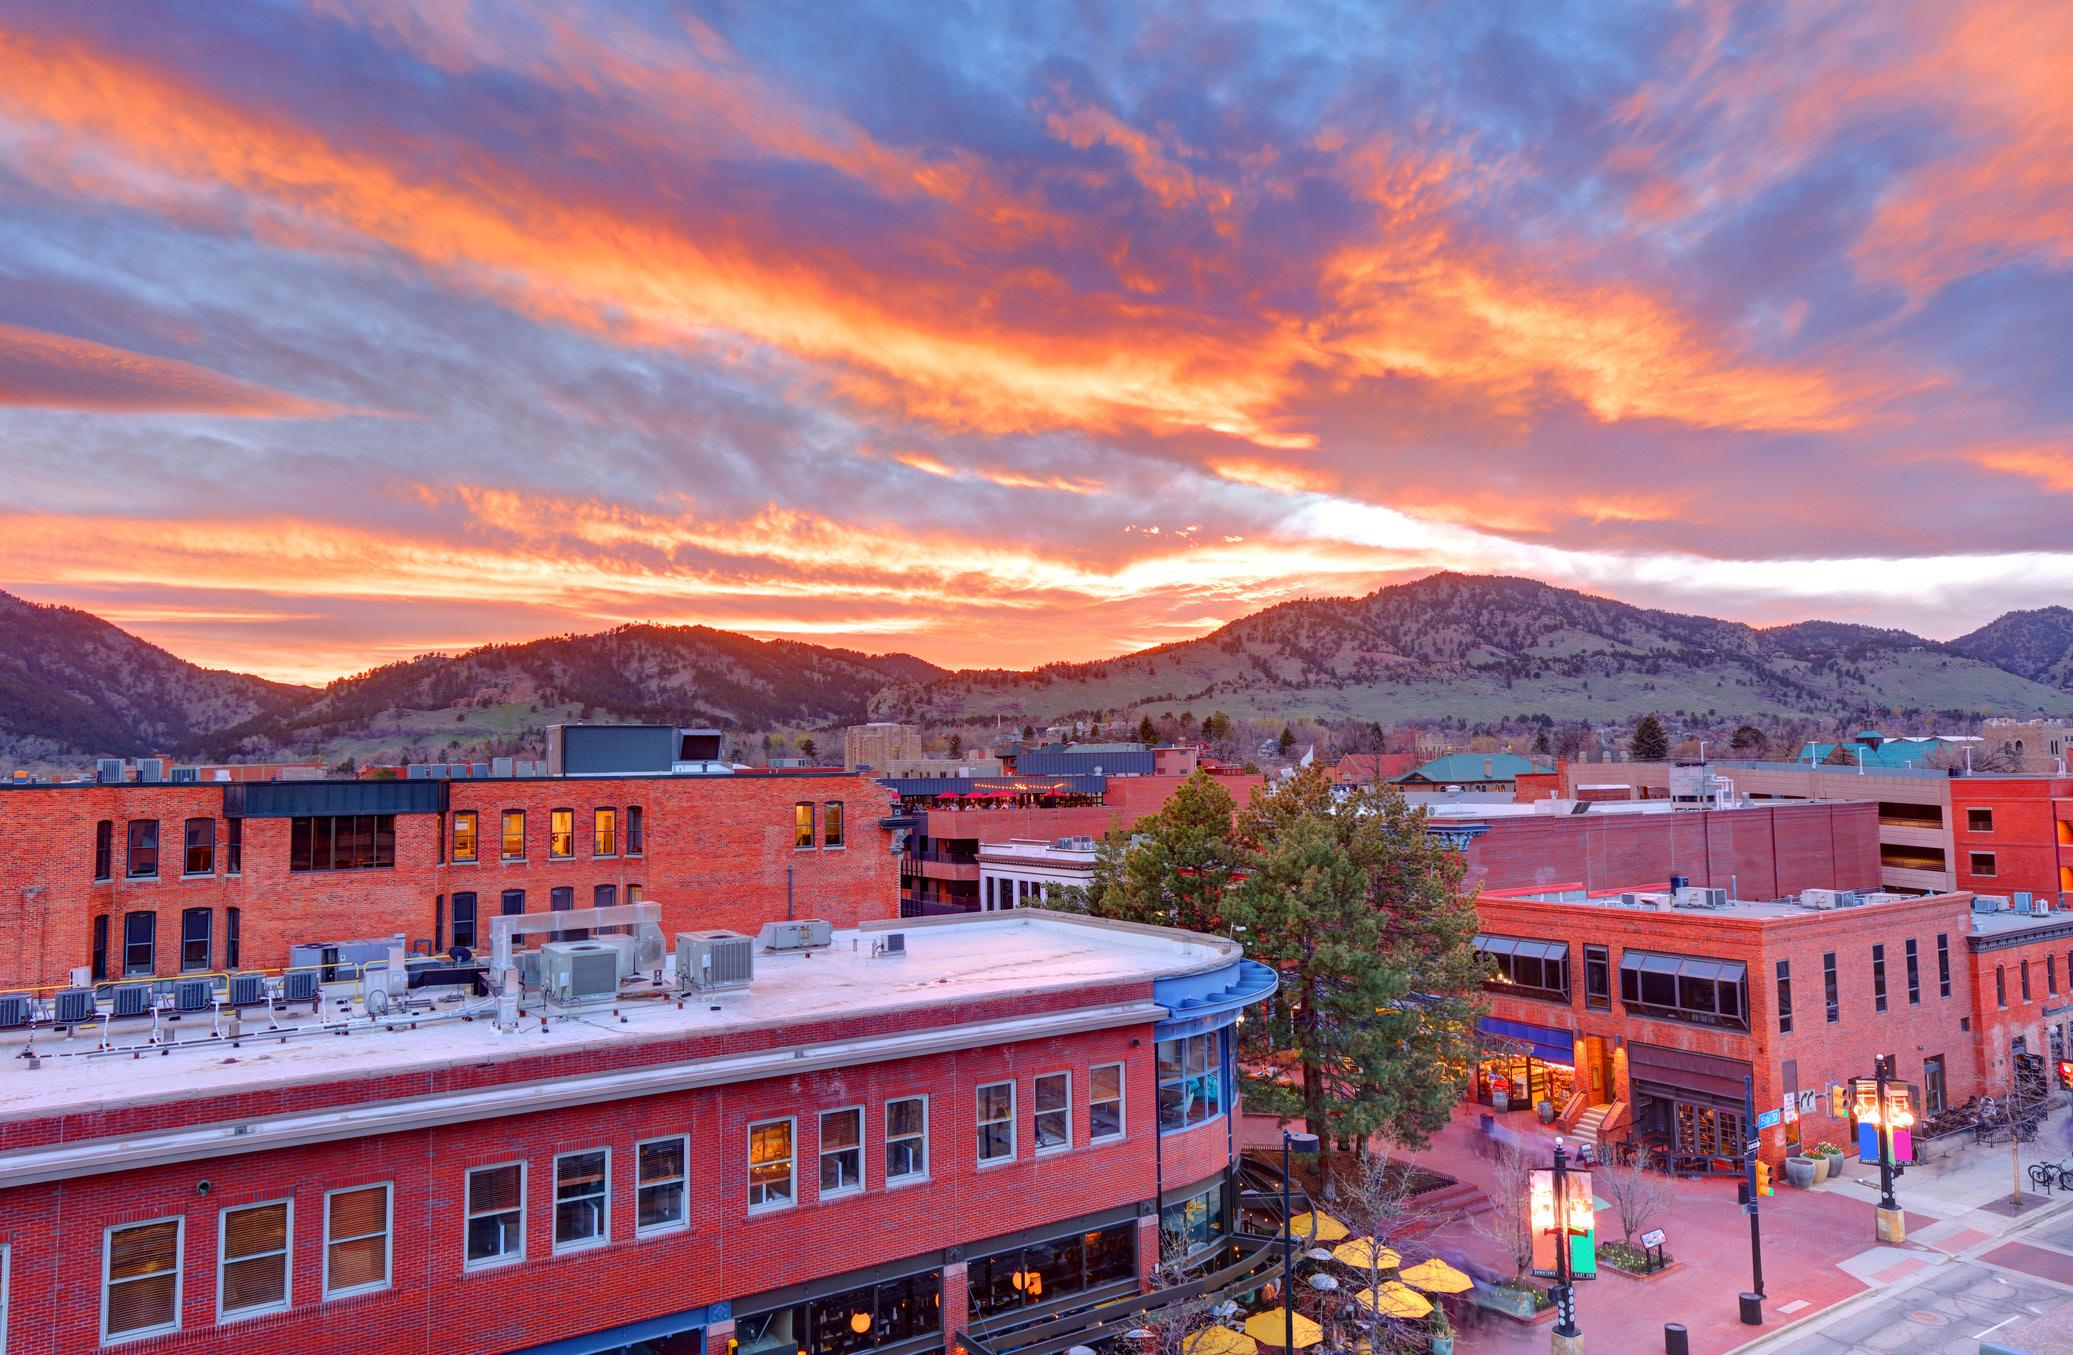
Boulder County is filled with communities that offer a variety of lifestyles and opportunities for home buyers to create their desired environment. As a national leader in sustainability efforts and bountiful recreation options, Boulder County attracts those looking for a combination of exciting city luxuries and proximity to nature that few other areas offer. Over the past few years, Boulder County and the unique communities within it have seen strong real estate activity because of the unique lifestyle the area provides.
Median

GLANCE
Boulder AT A
Sold Price $725,000 -3.4%
2,916 -20.8%
Properties Sold
54 29.6%
Average Days on Market
Sq. Ft. $438 -0.7%
Average Price per
Boulder County.
- Sept 2023
2023
% Sold Price, to List Price 99.0% -4.0%
All residential properties. Jan
% Change YTD 2022 vs
Volume - 24.7% 2022 vs 2023 % Change
$2,751,700,030
$13,000,000 Highest Sold Price
January - September 2023 | 13 Based on Information from IRES, LLC and REColorado for the period January 1st, 2023 - September 30th, 2023 (Powered by LiveBy). This representation is based in whole or in part on data supplied by IRES, LLC and REColorado. IRES, LLC and REColorado does not guarantee nor is in any way responsible for its accuracy. Data maintained by IRES, LLC and REColorado may not reflect all real estate October 2022 - September 2023 AVERAGE DAYS ON MARKET Jun Jul Aug Sep Oct Nov Dec Jan Feb Mar Apr May 47 49 55 62 76 64 58 52 46 October 2022 - September 2023 TOTAL SALES VOLUME Jun Jul Aug Sep Oct Nov Dec Jan Feb Mar Apr May $200M $250M $300M $350M $196M $306M $314M $306M $163M $210M $229M $261M $400M October 2022 - September 2023 MEDIAN SOLD PRICE Jun Jul Aug Sep Oct Nov Dec Jan Feb Mar Apr May $650k $675k $700k $725k $750k
Total Sales
54 52 49 $368M $336M $277M $408M
Boulder
$725,000 Median Sold Price
2,916 Properties Sold
54 Average Days on Market
2022 vs 2023 % Change +29.6%
-20.8% YTD 2022 vs 2023 % Change -0.7% YTD
14 | livsothebysrealty.com
YTD 2022
2023
YTD 2022
$438 Price Per Square Foot 2023
vs
% Change -3.4%
vs
% Change
January - September 2023 | 15 City of Boulder 824 $922,500 52 Longmont 849 $567,500 53 Louisville 175 $850,000 46 Niwot 49 $1,025,000 67 Erie 252 $657,000 39 Lafayette 137 $800,000 65 Superior 136 $800,000 63 Properties Sold Median Sold Price Average Days on Market Click for Live Data Live Data Live Data Live Data Live Data Live Data Live Data Live Data Click for Community Data Live Data
Northern Colorado

Northern Colorado is home to cities such as Fort Collins, Loveland, Greeley, Berthoud, Windsor, Johnston, and Timnath, all which provide the unique Colorado lifestyle while continuing to attract young professionals, families, and outdoor adventure seekers alike. At the base of the Rocky Mountains, there are multiple year-round recreational opportunities including kayaking, rafting, camping, snowshoeing, ice hockey, and cross-country skiing. Downtown Fort Collins offers a wholesome community feel and hints at a bygone era. Craft breweries, historical buildings, live music, and festivals keep the area bustling. For those looking to live a quintessential Colorado lifestyle, nothing beats Northern Colorado.
Jan - Sept 2023 % Change
YTD 2022 vs 2023
Median Sold Price $537,000 0.4%
Properties Sold 5,999 -36.4%
Average Days on Market 38 50.0%
Average Price per Sq. Ft. $282 -19.1%
% Sold Price, to List Price 99.4% -1.4%
AT
GLANCE
A
Cities: Fort Collins, Loveland, Greeley, Berthoud, Windsor, Johnstown, and Timnath. All residential properties.
Sales Volume - 33.7% 2022 vs 2023 % Change
$3,678,263,948
$16,000,000 Highest Sold Price
January - September 2023 | 17 Based on Information from REColorado for the period January 1st, 2023 - September 30th, 2023 (Powered by LiveBy). This representation is based in whole or in part on data supplied by REColorado. REColorado does not guarantee nor is in any way responsible for its accuracy. Data maintained by REColorado may not reflect all real estate activity in the market. October 2022 - September 2023 AVERAGE DAYS ON MARKET Jun Jul Aug Sep Oct Nov Dec Jan Feb Mar Apr May 29 30 35 45 52 52 46 44 31 October 2022 - September 2023 TOTAL SALES VOLUME Jun Jul Aug Sep Oct Nov Dec Jan Feb Mar Apr May $200M $300M $400M $500M $326M $437M $429M $541M $533M $256M $287M $358M $408M $600M October 2022 - September 2023 MEDIAN SOLD PRICE Jun Jul Aug Sep Oct Nov Dec Jan Feb Mar Apr May $475k $500k $525k $550k $575k
Total
28 31 34 $447M $457M $400M
$537,000 Median Sold Price

5,999 Properties Sold
38 Average Days on Market
$282 Price Per Square Foot
18 | livsothebysrealty.com
Northern Colorado
-36.4% YTD 2022 vs 2023
-19.1% YTD 2022 vs 2023
+50.0% YTD 2022 vs 2023 % Change +0.4% YTD 2022 vs 2023 % Change
% Change
% Change
January - September 2023 | 19 Fort Collins 1,262 $560,000 23 Loveland 844 $499,000 30 Greeley 843 $410,000 32 Berthoud 198 $590,000 40 Windsor 624 $560,000 41 Johnstown 373 $505,000 44 Timnath 109 $755,000 45 Properties Sold Median Sold Price Average Days on Market Click for Live Data Click for Community Data Live Data Live Data Live Data Live Data Live Data Live Data Live Data Live Data
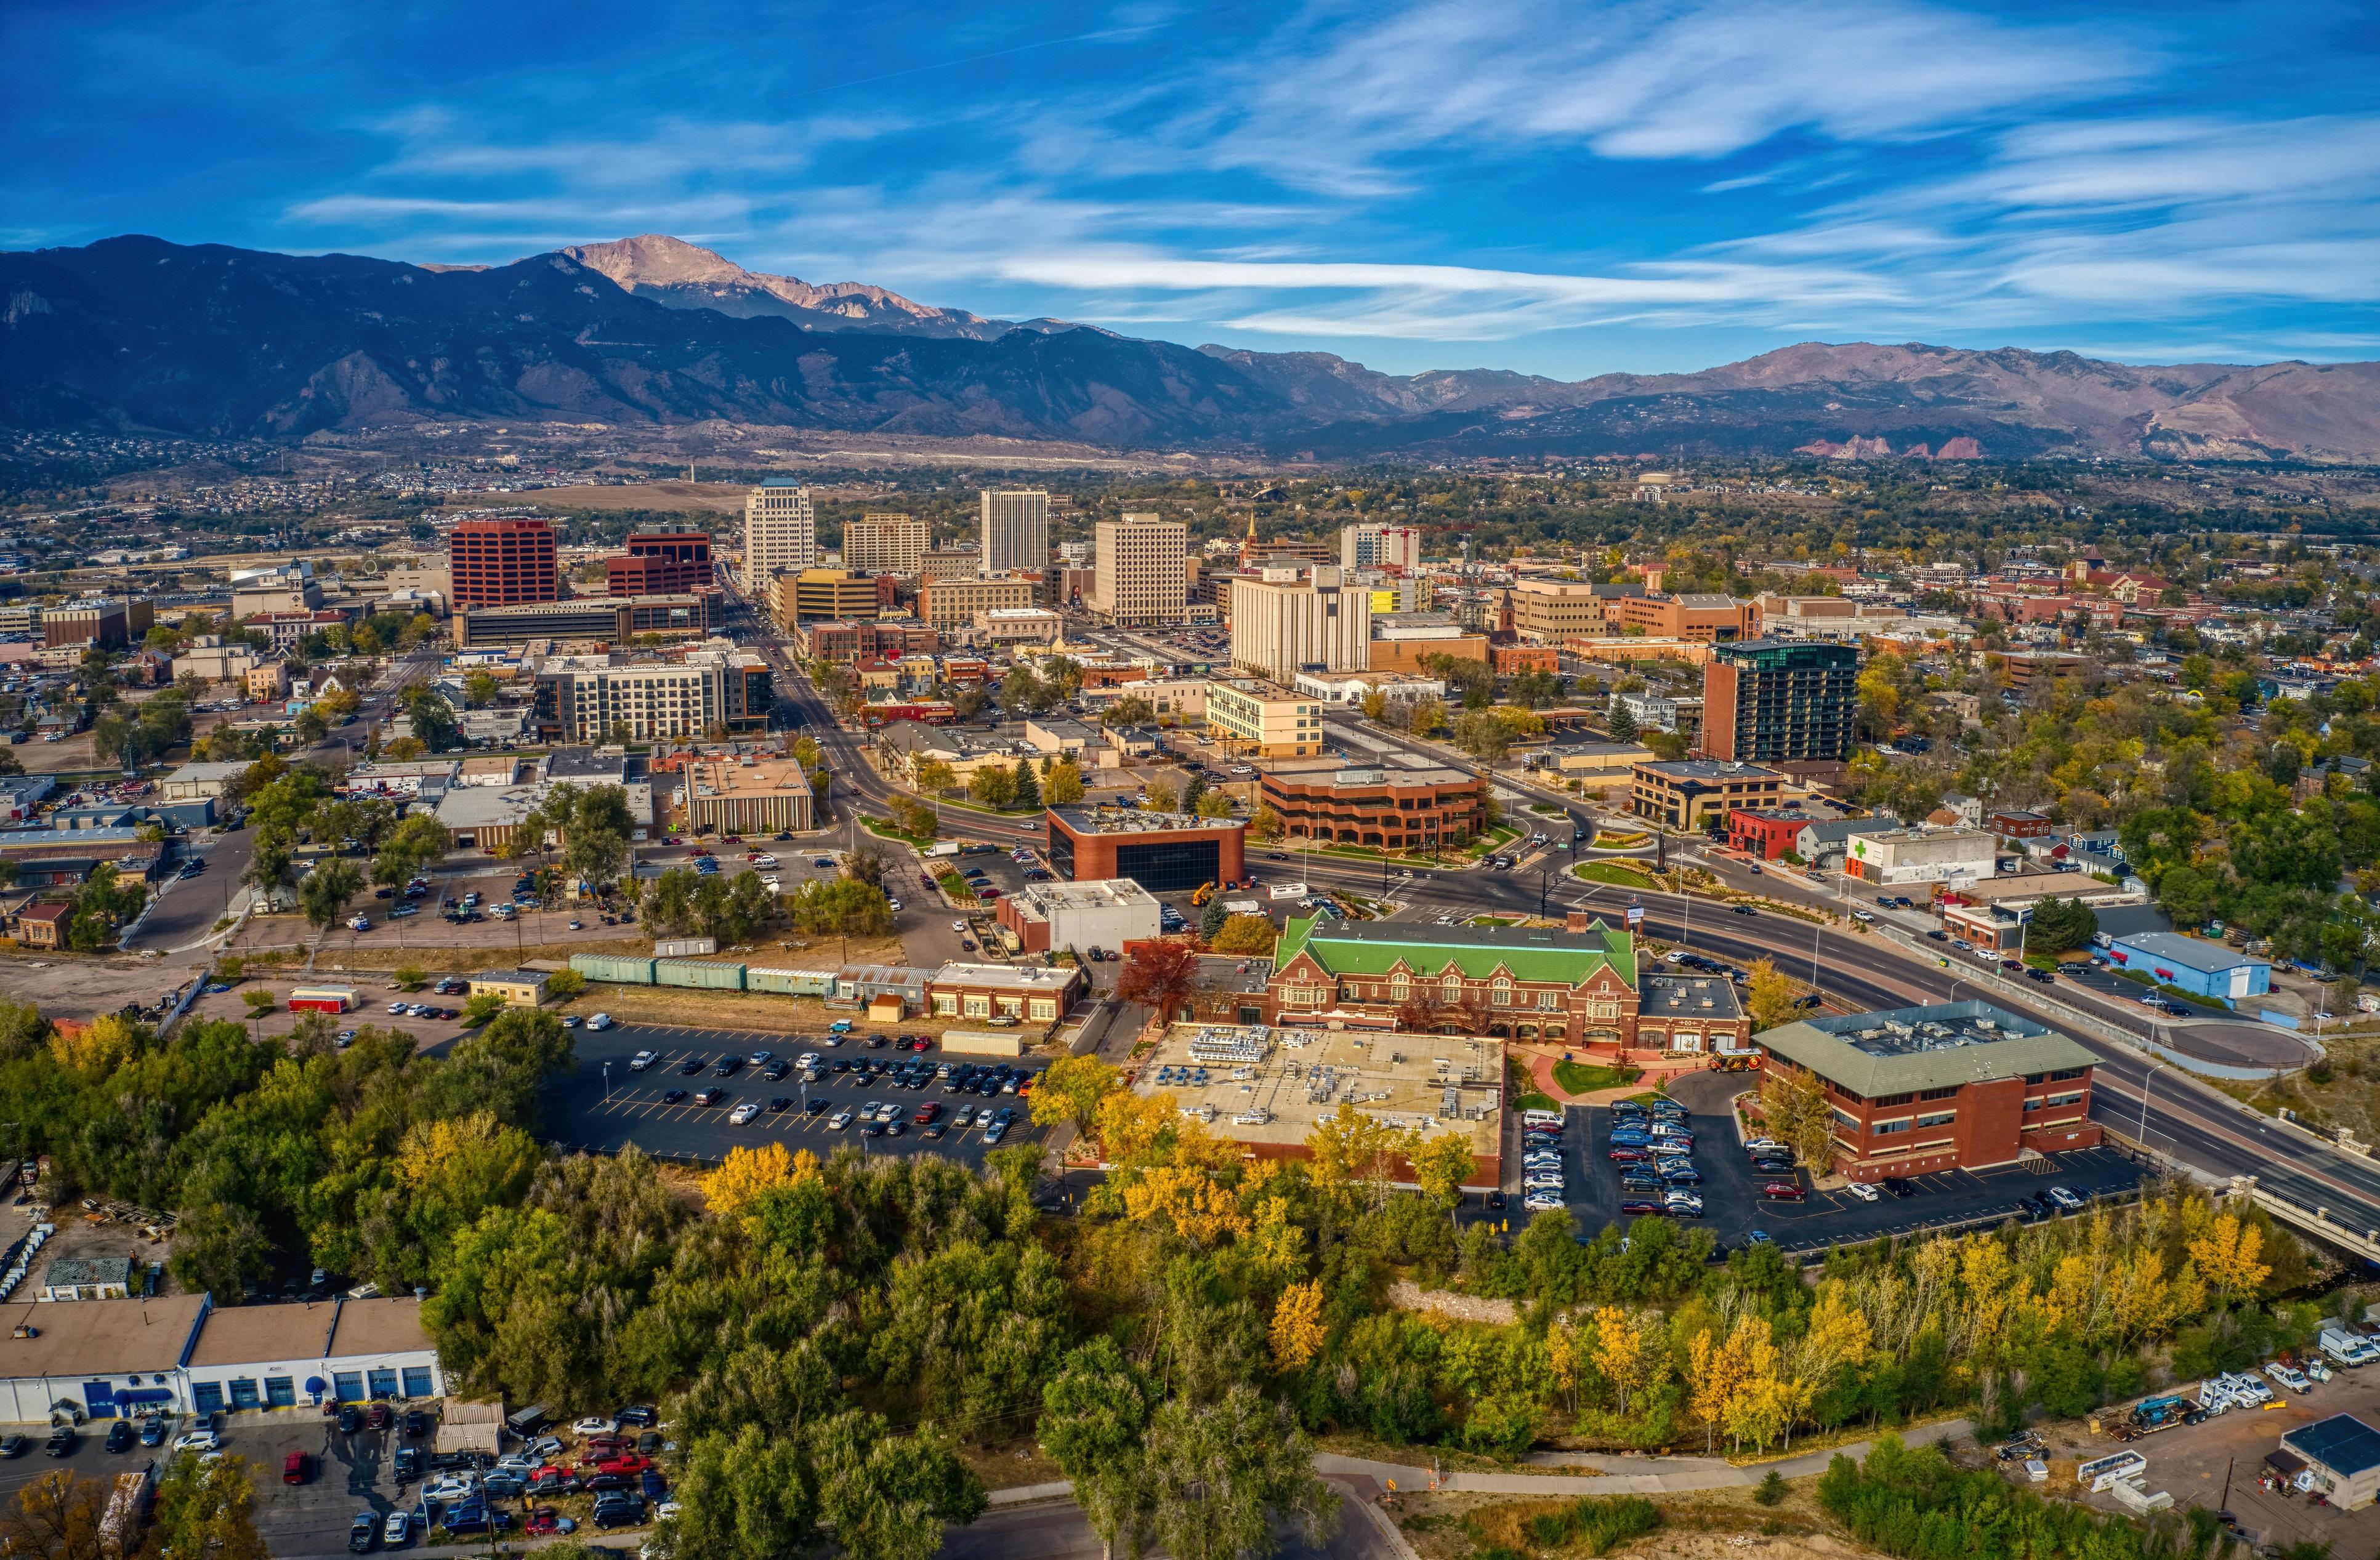
Colorado Springs
Colorado Springs, the state’s second largest city, is currently one of the most sought-after areas to live in the country. This colorful Colorado community offers its residents exciting entertainment options, unique cultural offerings, and enough outdoor activities to keep any adventurer satisfied. Thanks to the amazing array of lifestyles this city can cater to, more consumers are deciding to make this community their home.

AT A GLANCE Median Sold Price $444,852 -2.3% Properties Sold 9,347 -36.3% Average Days on Market 34 61.8% Average Price per Sq. Ft. $229 -2.6% % Sold Price, to List Price 99.2% -1.1% Counties: El Paso and Teller. All residential properties. Jan - Sept 2023 % Change YTD 2022 vs 2023
Sales Volume - 36.7% 2022 vs 2023 % Change
$4,844,153,198
$3,955,000 Highest Sold Price
January - September 2023 | 21 Based on information from the Pikes Peak REALTOR® Services Corp. (“RSC”), for the period January 1st, 2023 - September 30th, 2023. RSC does not guarantee or is in any way responsible for its accuracy. Data maintained by RSC may not reflect all real estate activity in the market. October 2022 - September 2023 AVERAGE DAYS ON MARKET Jun Jul Aug Sep Oct Nov Dec Jan Feb Mar Apr May 17 41 32 38 49 47 46 39 24 October 2022 - September 2023 TOTAL SALES VOLUME Jun Jul Aug Sep Oct Nov Dec Jan Feb Mar Apr May $200M $300M $400M $500M $229M $322M $329M $391M $435M $207M $247M $274M $339M October 2022 - September 2023 MEDIAN SOLD PRICE Jun Jul Aug Sep Oct Nov Dec Jan Feb Mar Apr May $400k $420k $440k $460k $480k
Total
30 18 31 $324M $348M $299M
22 | livsothebysrealty.com
Median Sold Price
Sold
Market
Foot -36.3% YTD 2022 vs 2023 % Change -2.6% YTD 2022 vs 2023 % Change +61.8% YTD 2022 vs 2023 % Change -2.3% YTD 2022 vs 2023 % Change
Colorado Springs $444,852
9,347 Properties
34 Average Days on
$229 Price Per Square
January - September 2023 | 23 Black Forest 43 $850,000 51 Broadmoor 61 $948,000 74 Flying Horse 80 $865,000 32 Monument 167 $655,000 34 Banning Lewis Ranch 283 $500,000 39 Properties Sold Median Sold Price Average Days on Market Click for Live Data Click for Community Data Live Data Live Data Live Data Live Data Live Data Live Data
Inspiring people to LIV the life they love.
© 2023 LIV Sotheby’s International Realty. All Rights Reserved. LIV Sotheby’s International Realty® is a registered trademark and used with permission. Each Sotheby’s International Realty office is independently owned and operated, except those operated by Sotheby’s International Realty, Inc. This material is based upon information which we consider reliable but because it has been supplied by third parties, we cannot represent that it is accurate or complete and it should not be relied upon as such. If your property is listed with a real estate broker, please disregard. It is not our intention to solicit the offerings of other real estate brokers. We are happy to work with them and cooperate fully. Equal Housing Opportunity.