Micro Market Report


CRESTED BUTTE, COLORADO
1 Teocalli Avenue 33 Aperture Lane Q1 2023
Crested Butte MARKET UPDATE
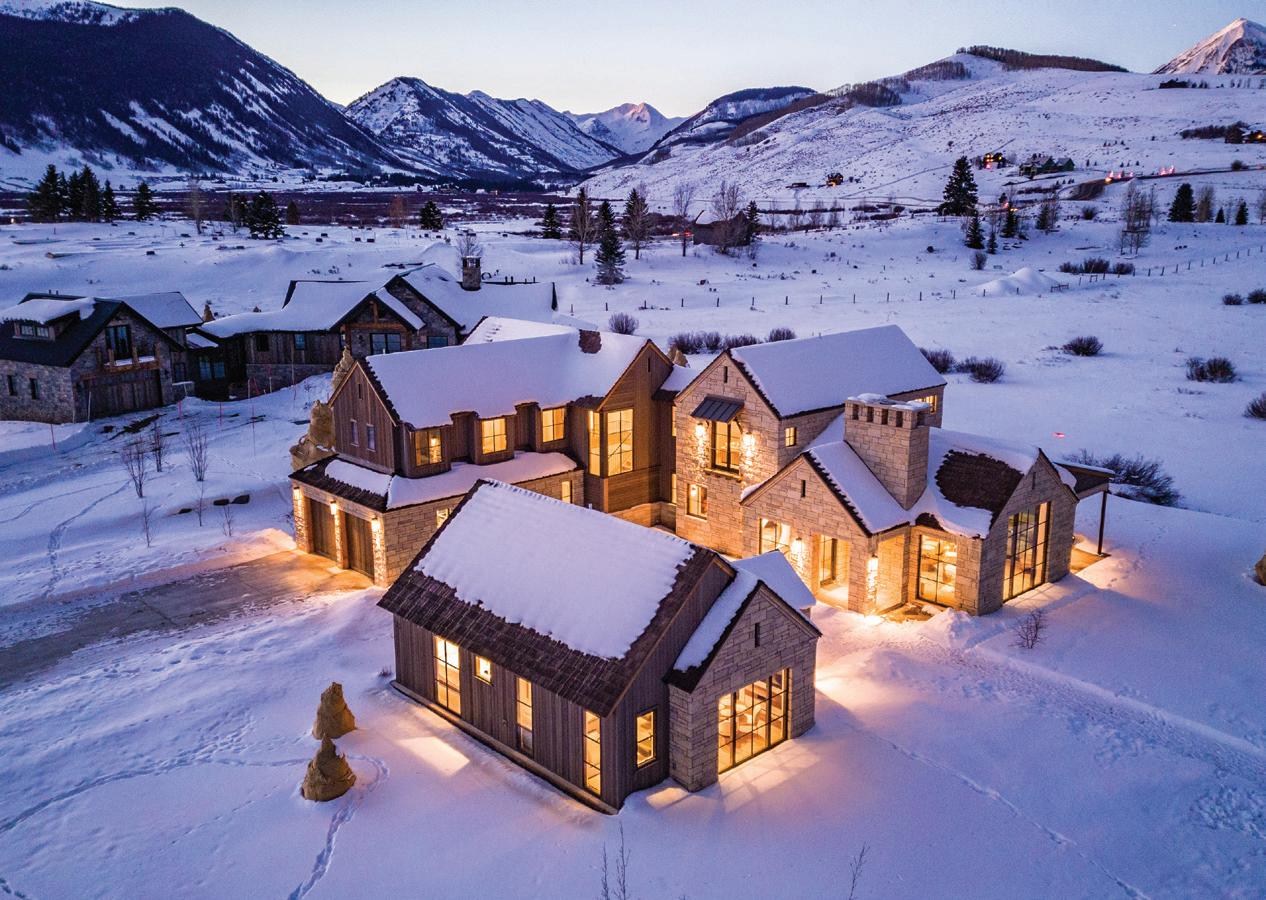
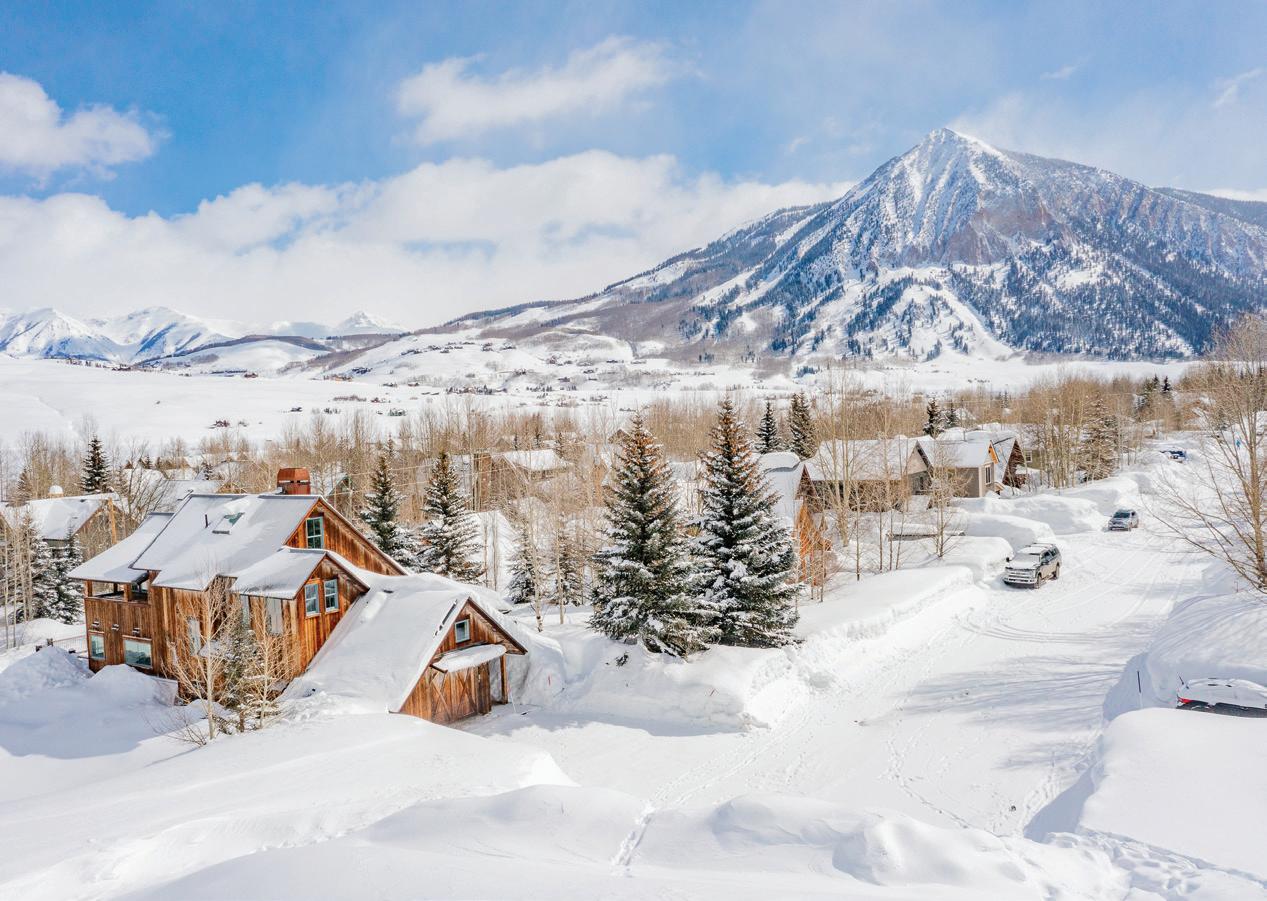
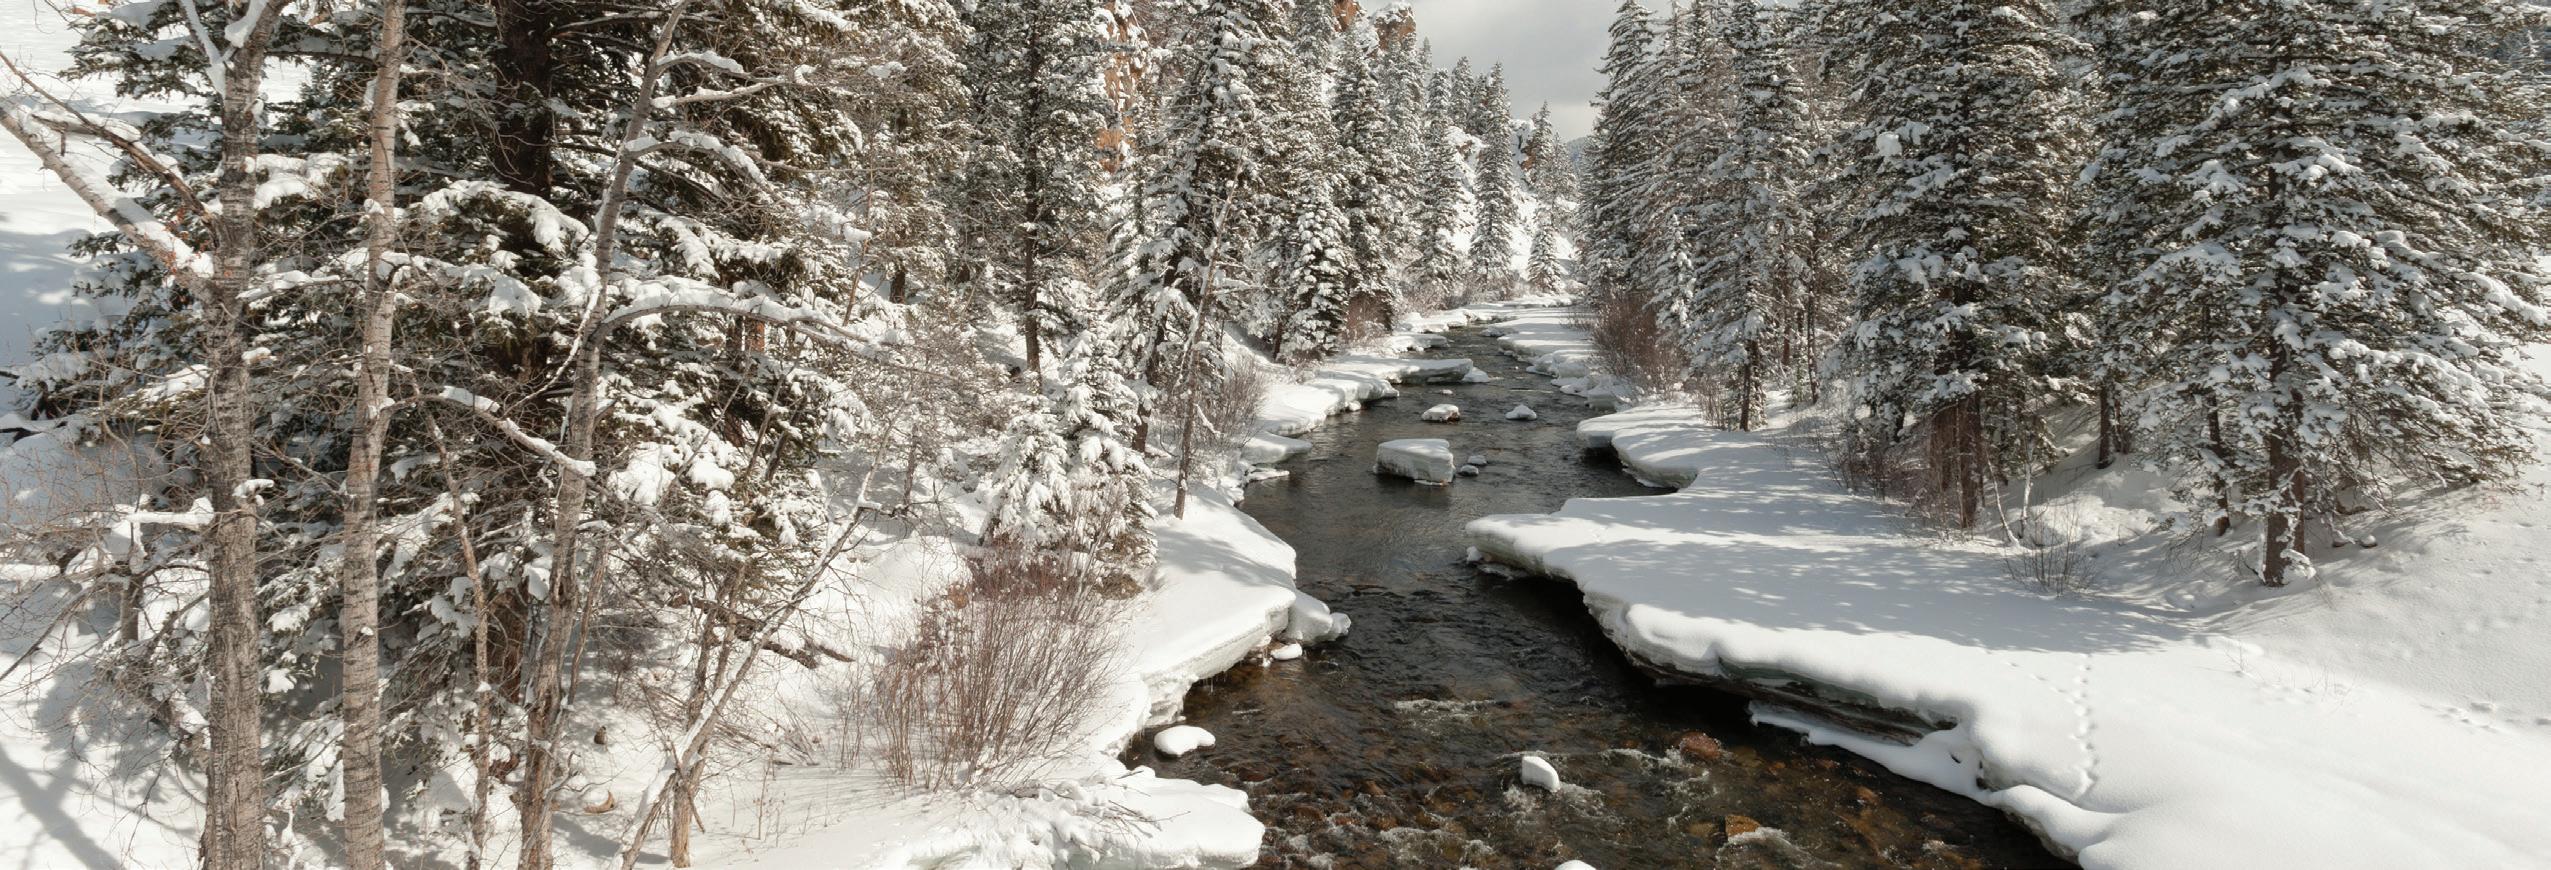
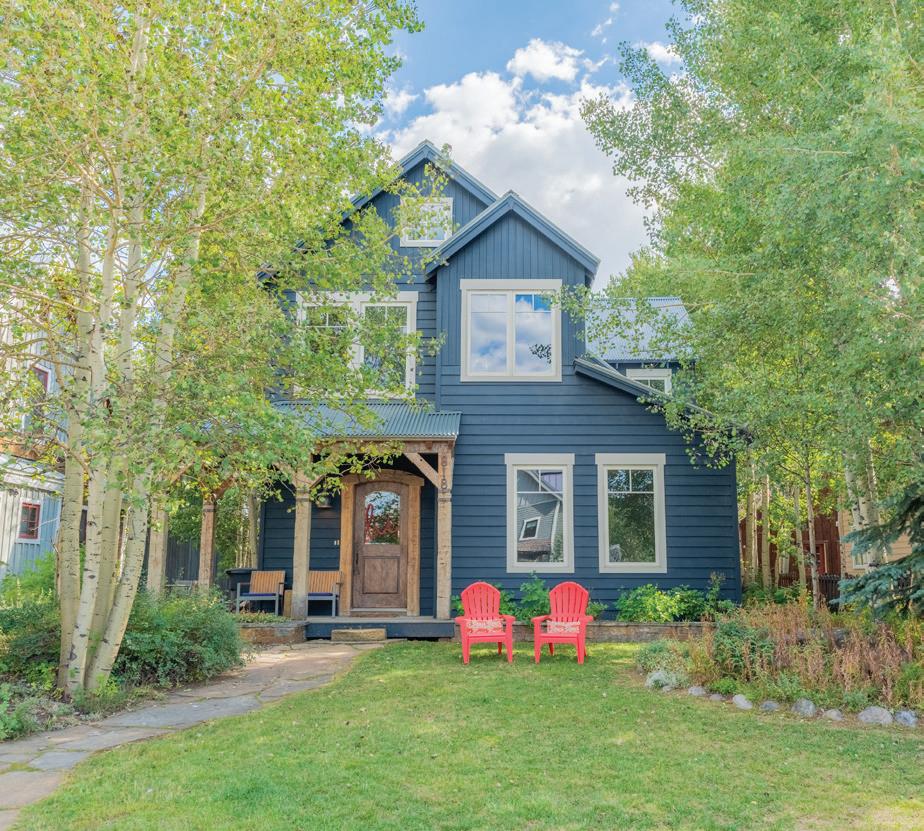
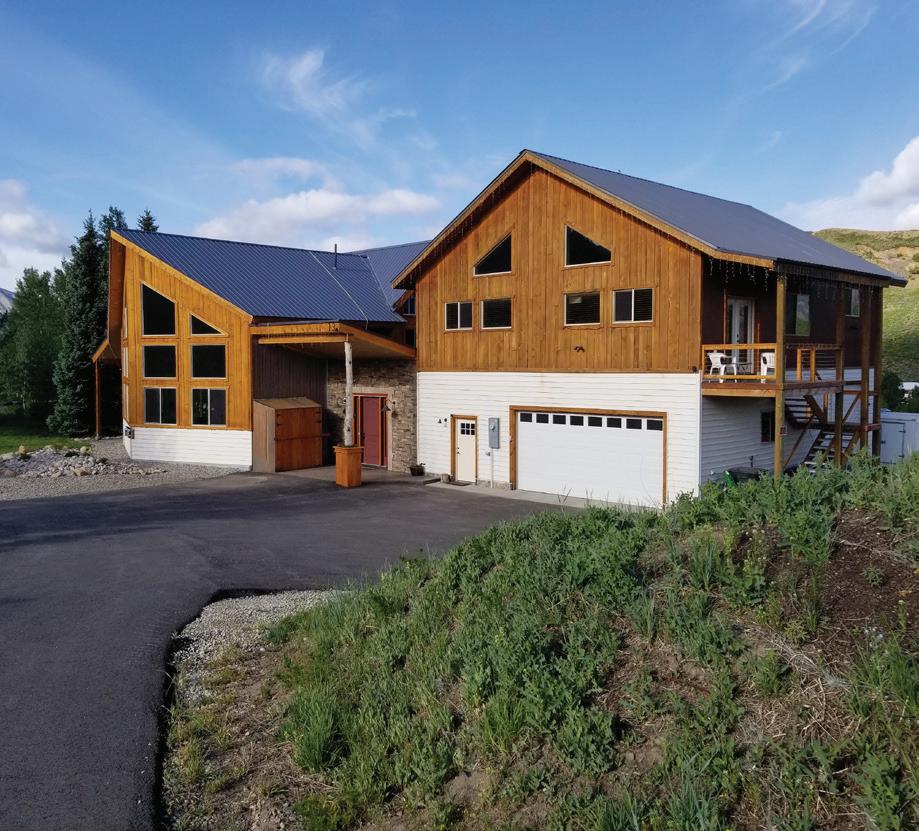
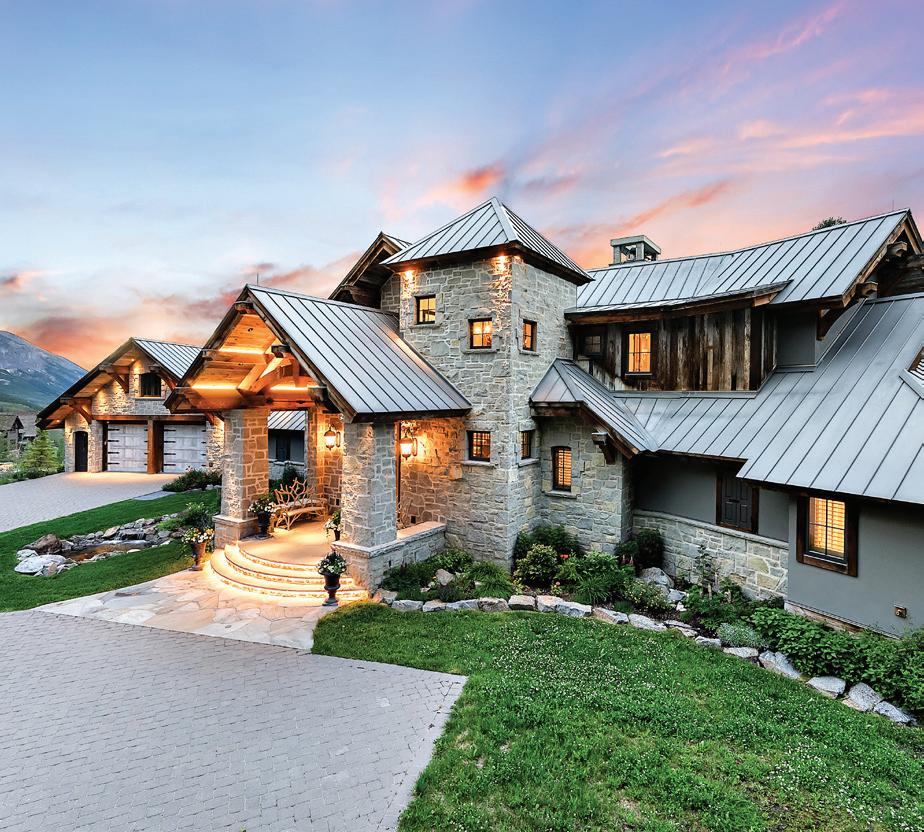
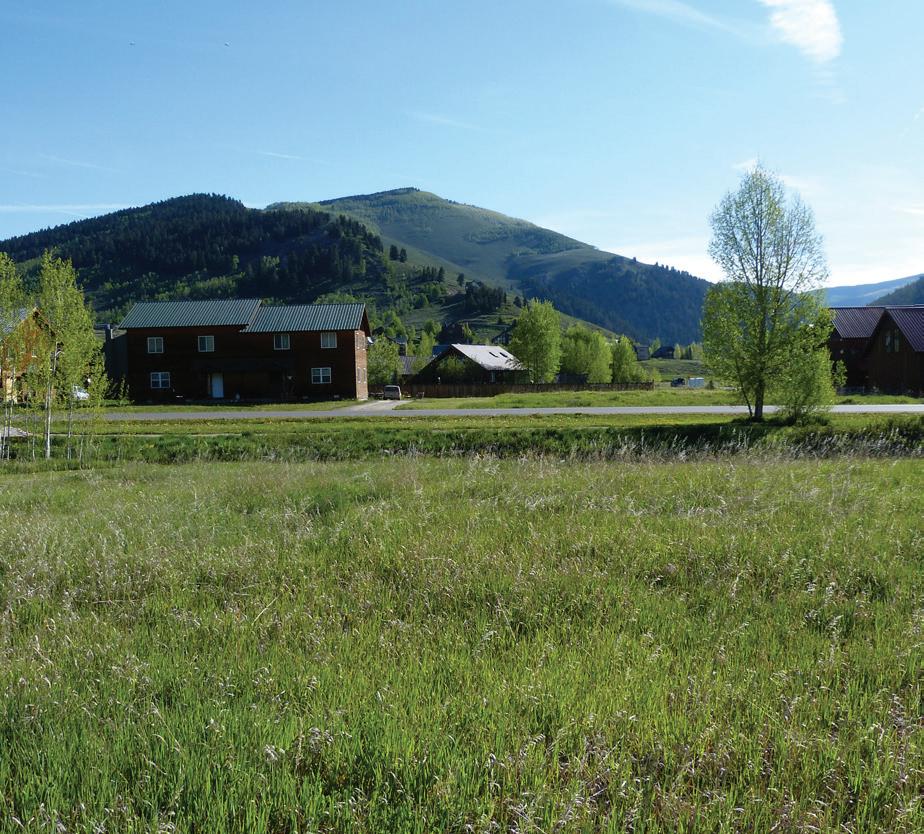
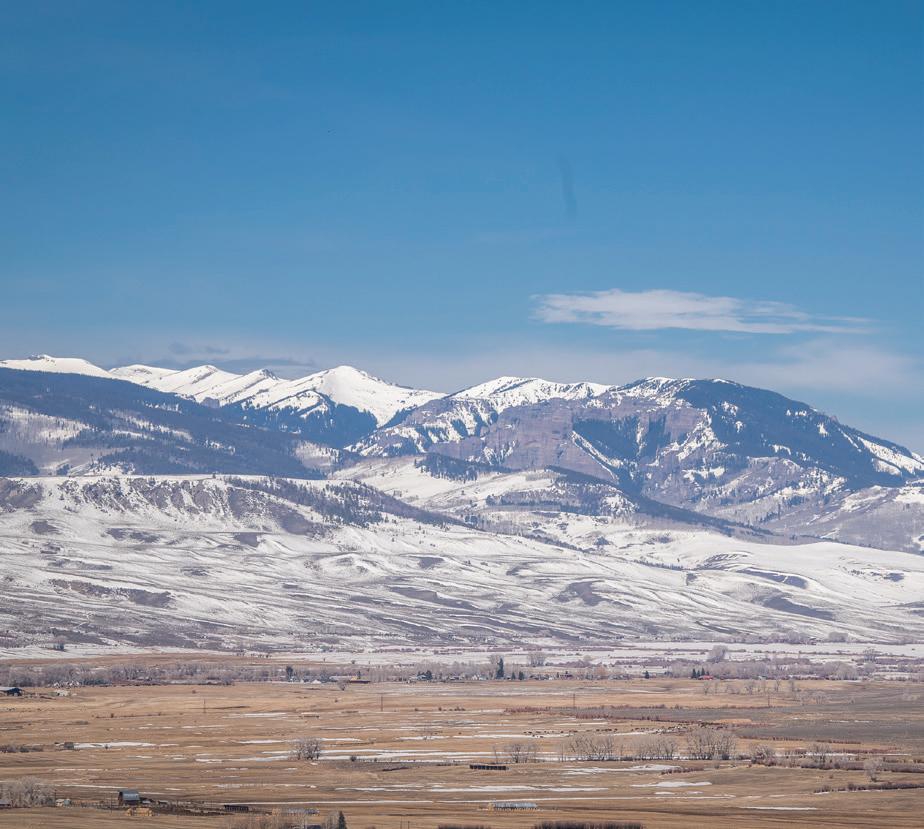
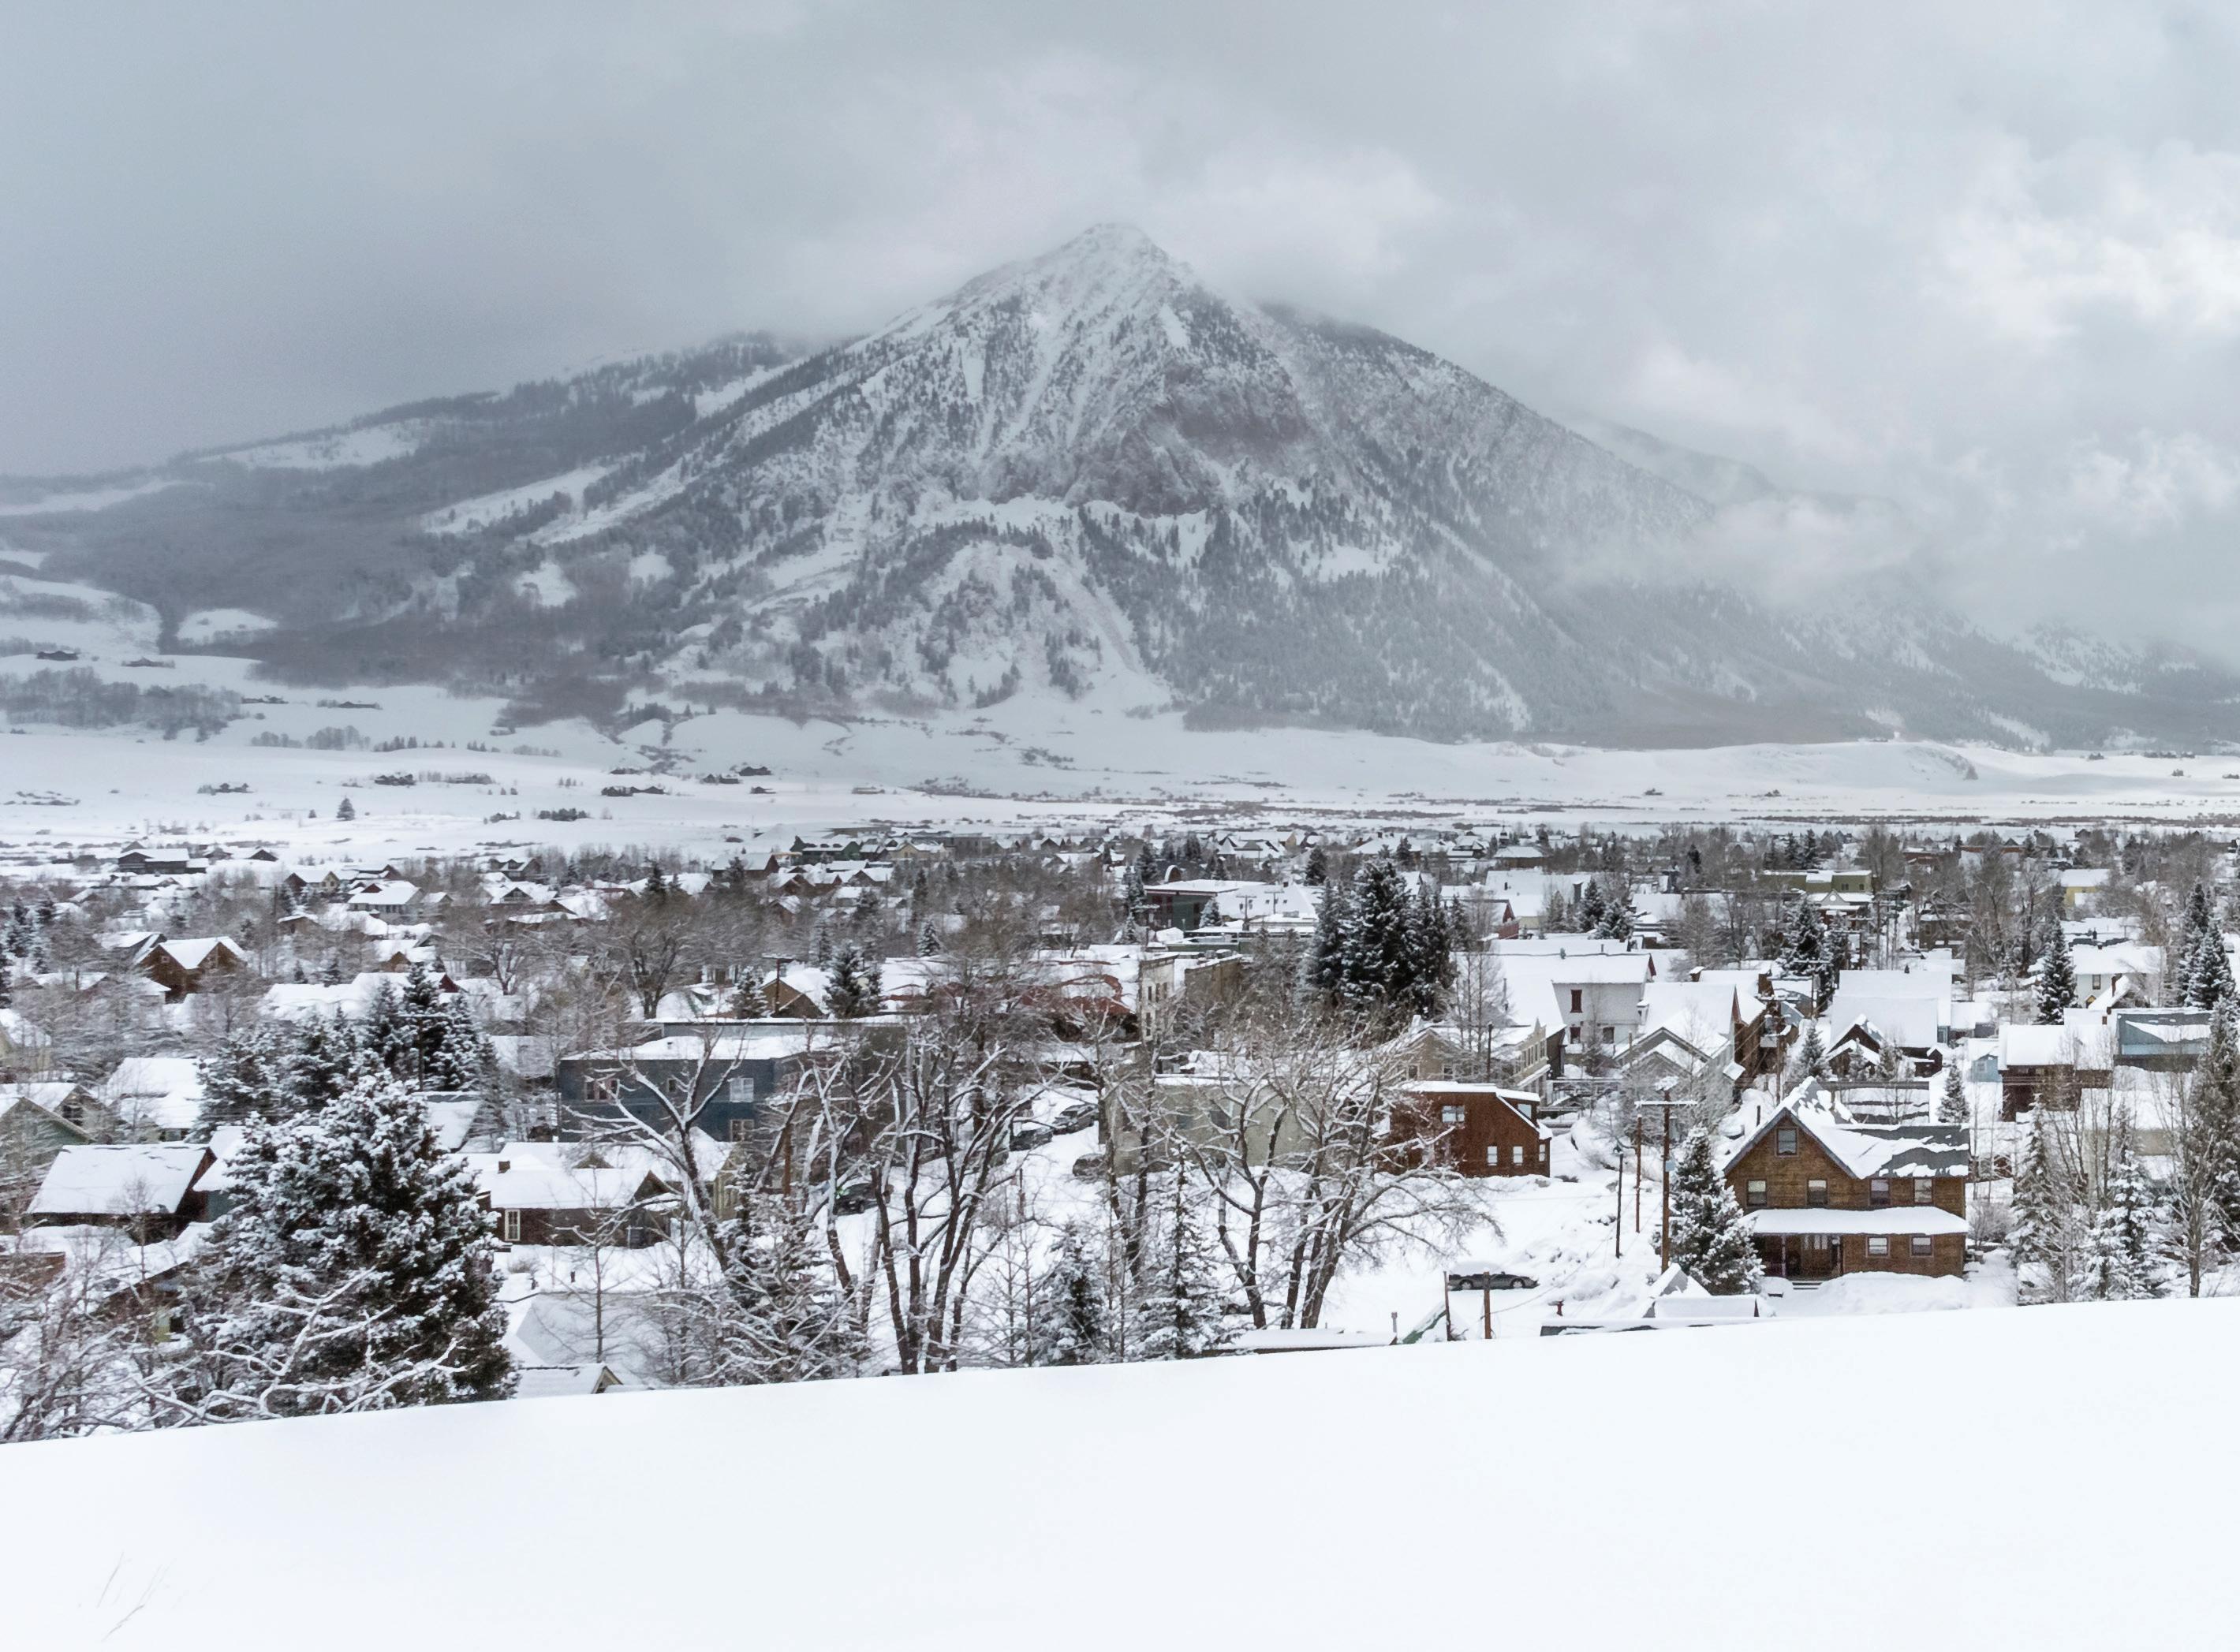
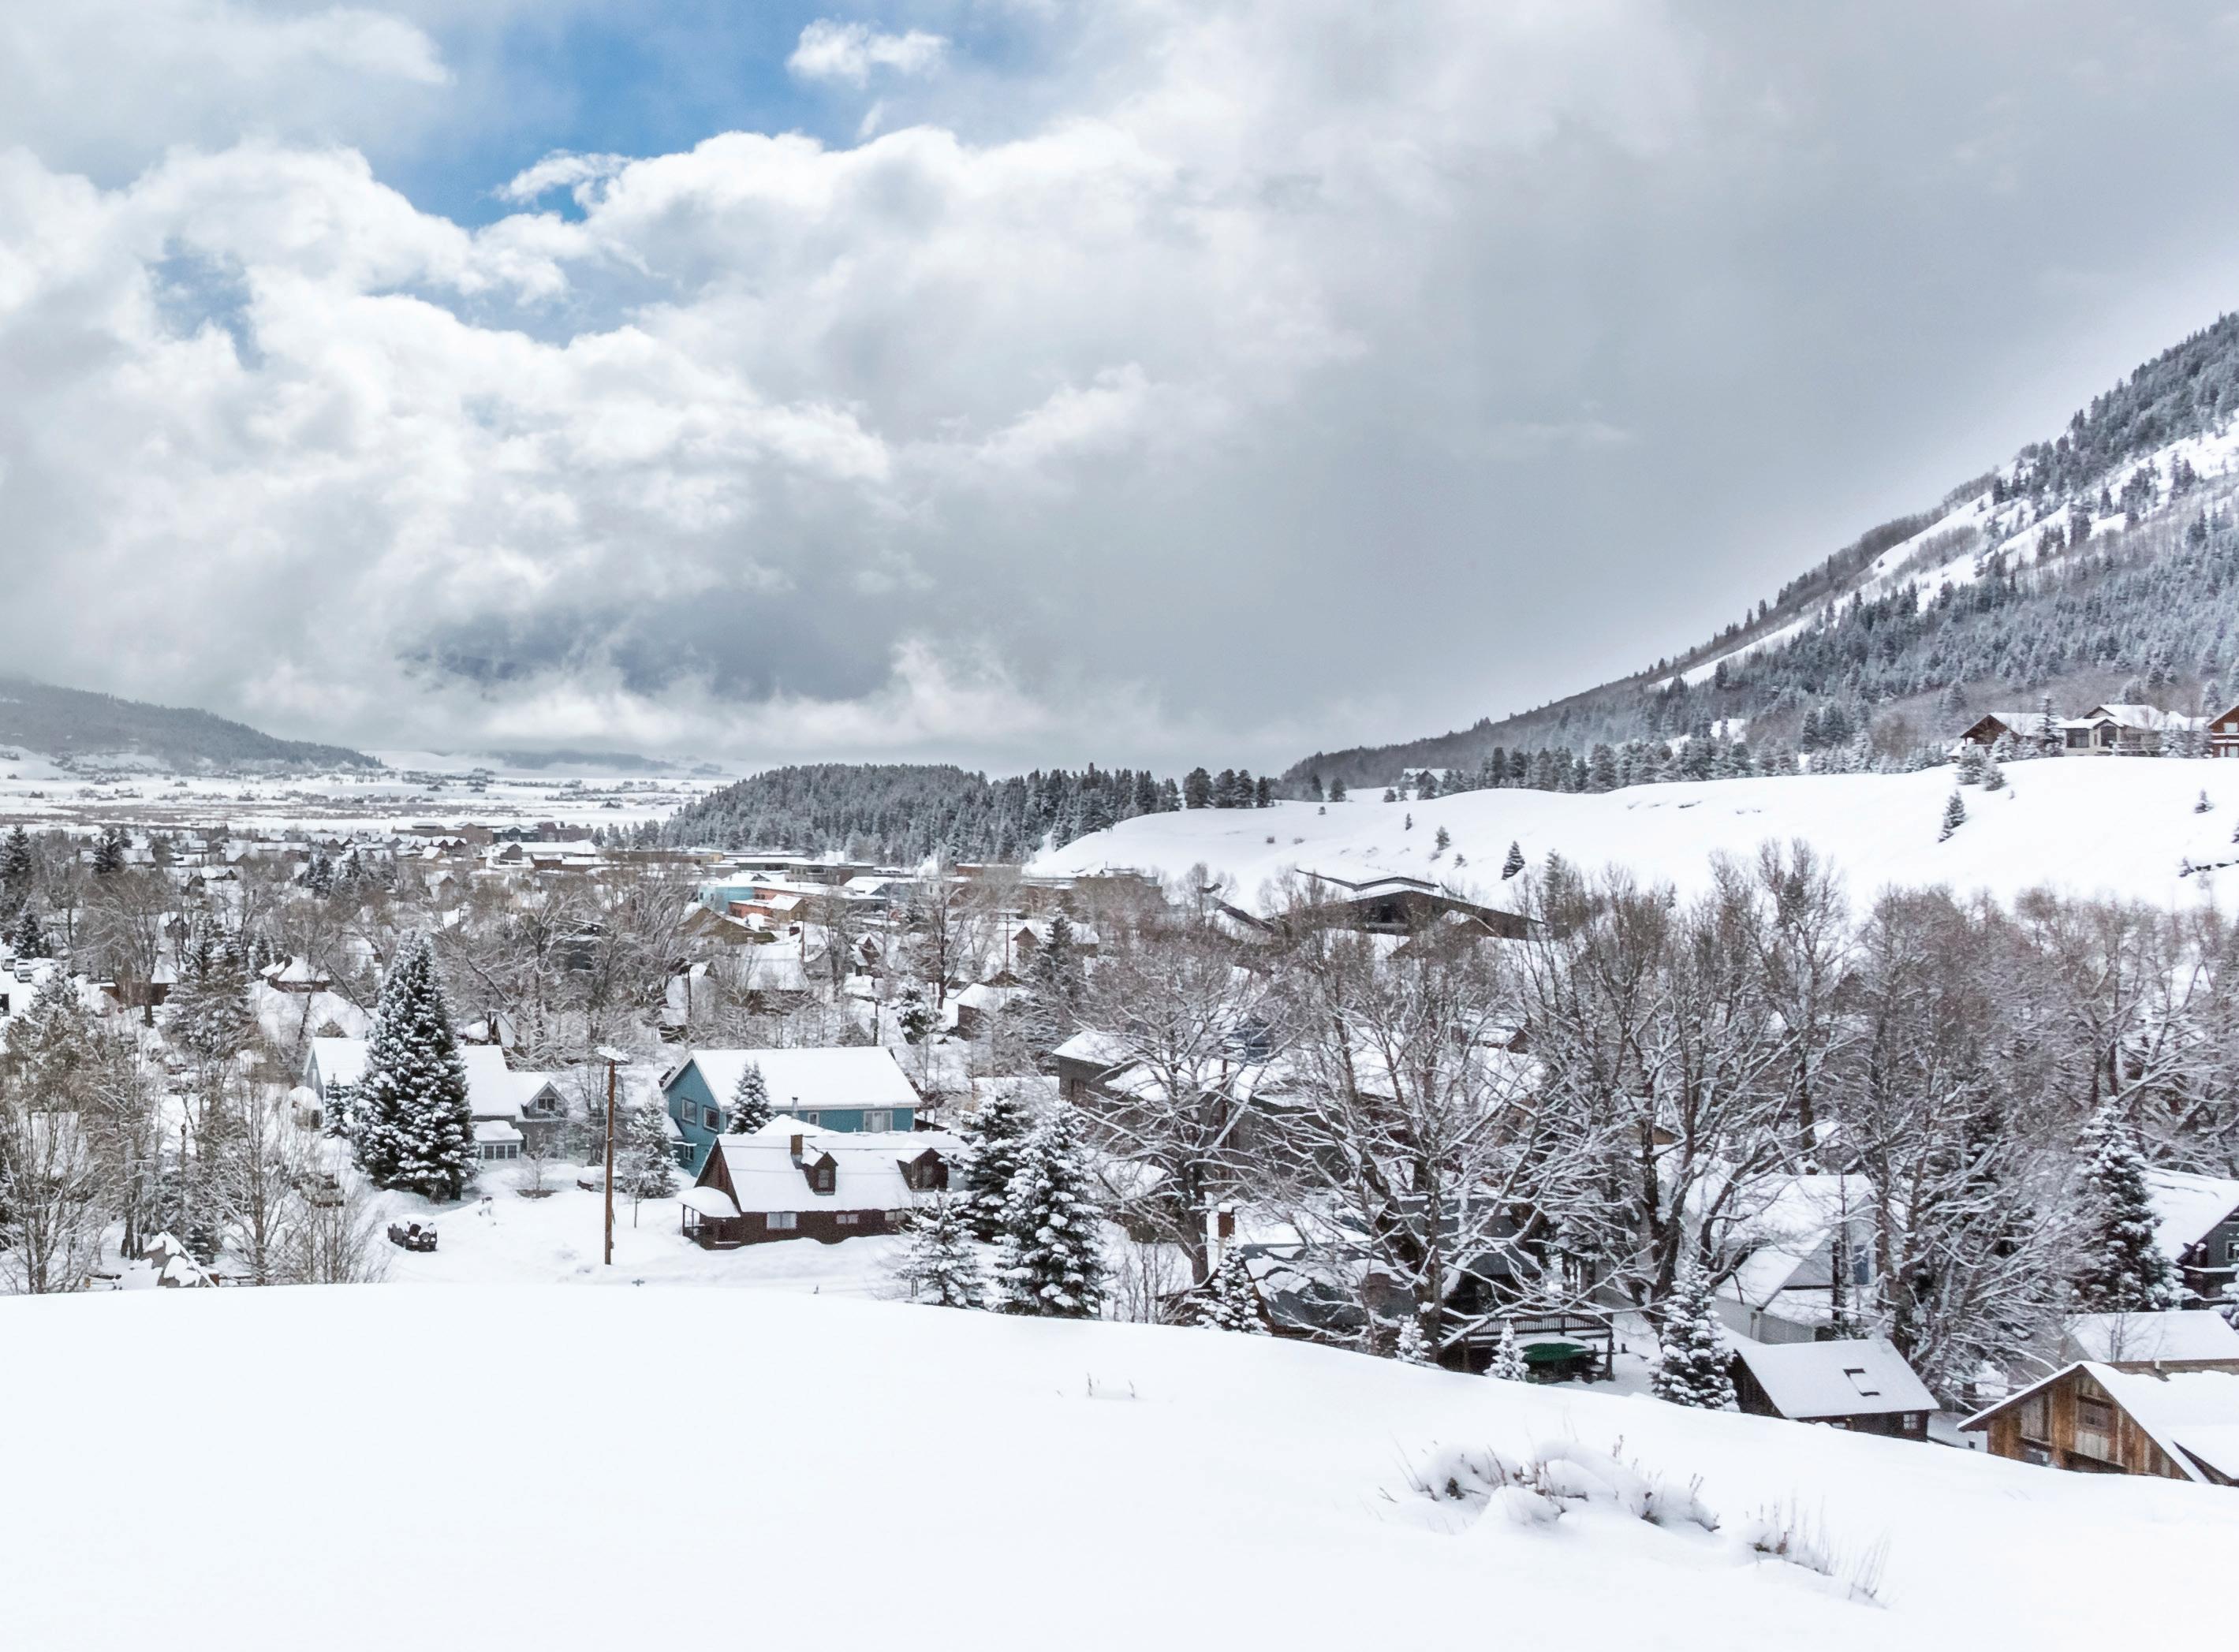
With its charming downtown and rugged small-town aesthetic influenced by its history as a mining town, Crested Butte is a gem in Colorado’s Rocky Mountains. The ski resort is renowned for its steep and challenging terrain and nearby Kebler Pass offers access to untamed wilderness.
Gunnison County’s real estate market varied from one community to the next for the first quarter of 2023. Mt Crested Butte saw a 15.1% increase in the average price per square foot from $622 to $716. The average sold price was down 12.7% from $816,918 to $713,252. The Town of Crested Butte had a 57.4% decline in the average sold price, due in part to the sale of a $11.55 million dollar property in 2022 compared to the highest price sold property of $1.8 million this year
Crested Butte South saw a large jump in average sold price, up 51.4% from $586,208 to $887,230. The average price per square foot was down 1% from $556 to $550. Properties in Rural Crested Butte also enjoyed a sizable increase in average sold price, ticking up 62.5% from $799,863 to $1,299,800.
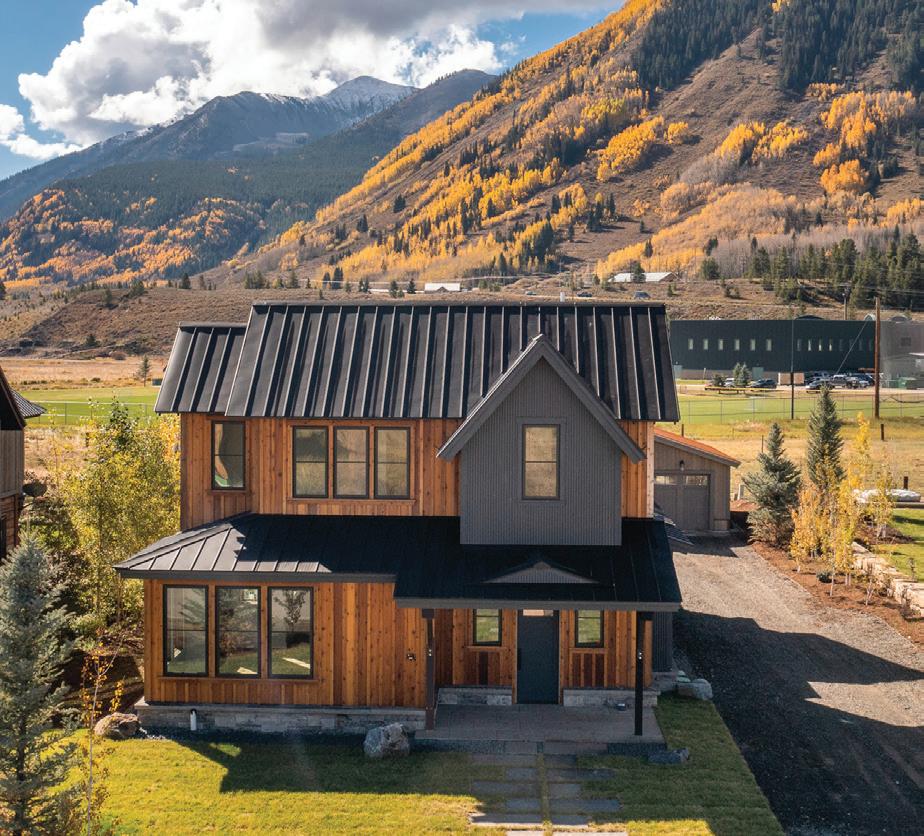
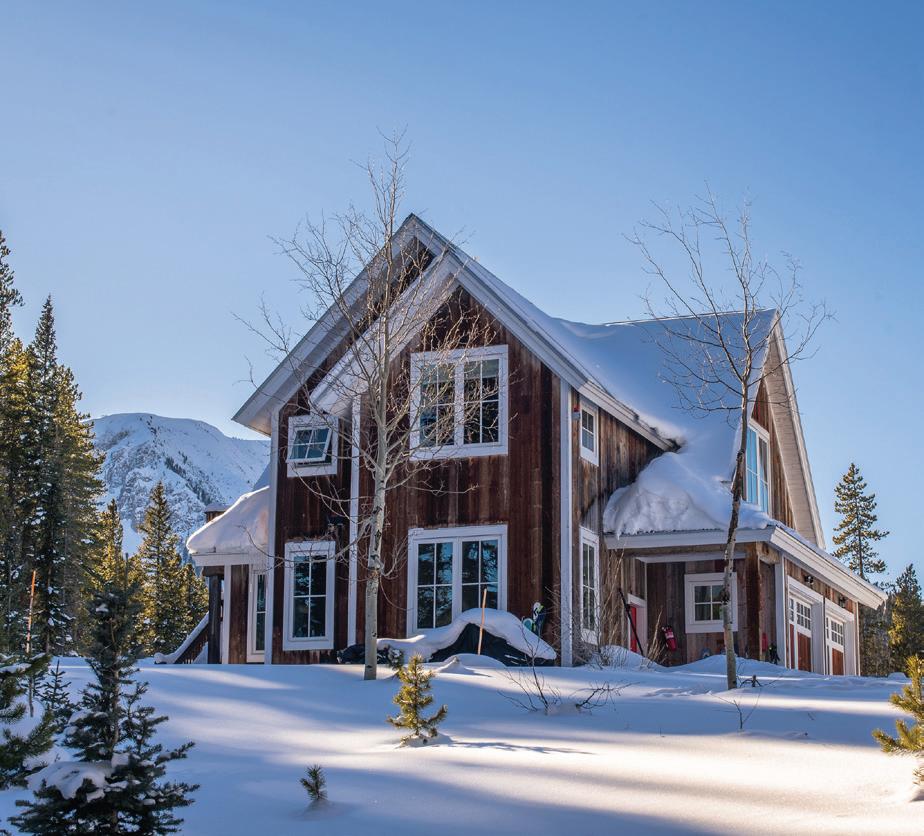
With luxurious slopeside ski homes and historic downtown dwellings, Crested Butte appeals to buyers looking for a small-town lifestyle in a scenic mountain setting.
GUNNISON COUNTY
coloradomicroreports.com
Based on data from the Gunnison – Crested Butte Association of REALTORS® MLS, Colorado Real Estate Network (CREN). Verify with a local REALTOR®. All information is deemed reliable but not guaranteed. Data maintained by CREN MLS may not reflect all real estate activity in the market.
All Parcels Over 10 Acres January through March 2022 2023 % Change Average Sold Price $567,464 $1,056,444 86.2% Average Price per Acre $25,931 $11,108 -57.2% Average Days on Market 414 287 -30.7% Highest Sold Price $1,150,000 $5,175,000 350.0% Properties Sold 14 9 -35.7% % Sold Price to List Price 97.2% 87.7% -9.8% January through March 2022 2023 % Change Sold Listings (All) 139 81 -41.7% Sold Single Family 30 22 -26.7% Sold Condos/TH 52 29 -44.2% Average Days on Market 198 181 -8.6% Average Sold Price $810,456 $754,983 -6.8% % Sold Price to List Price 97.8% 93.9% -4.0% Total Dollar Volume Sold $112,653,515.00 $61,153,631.00 -45.7% All Properties
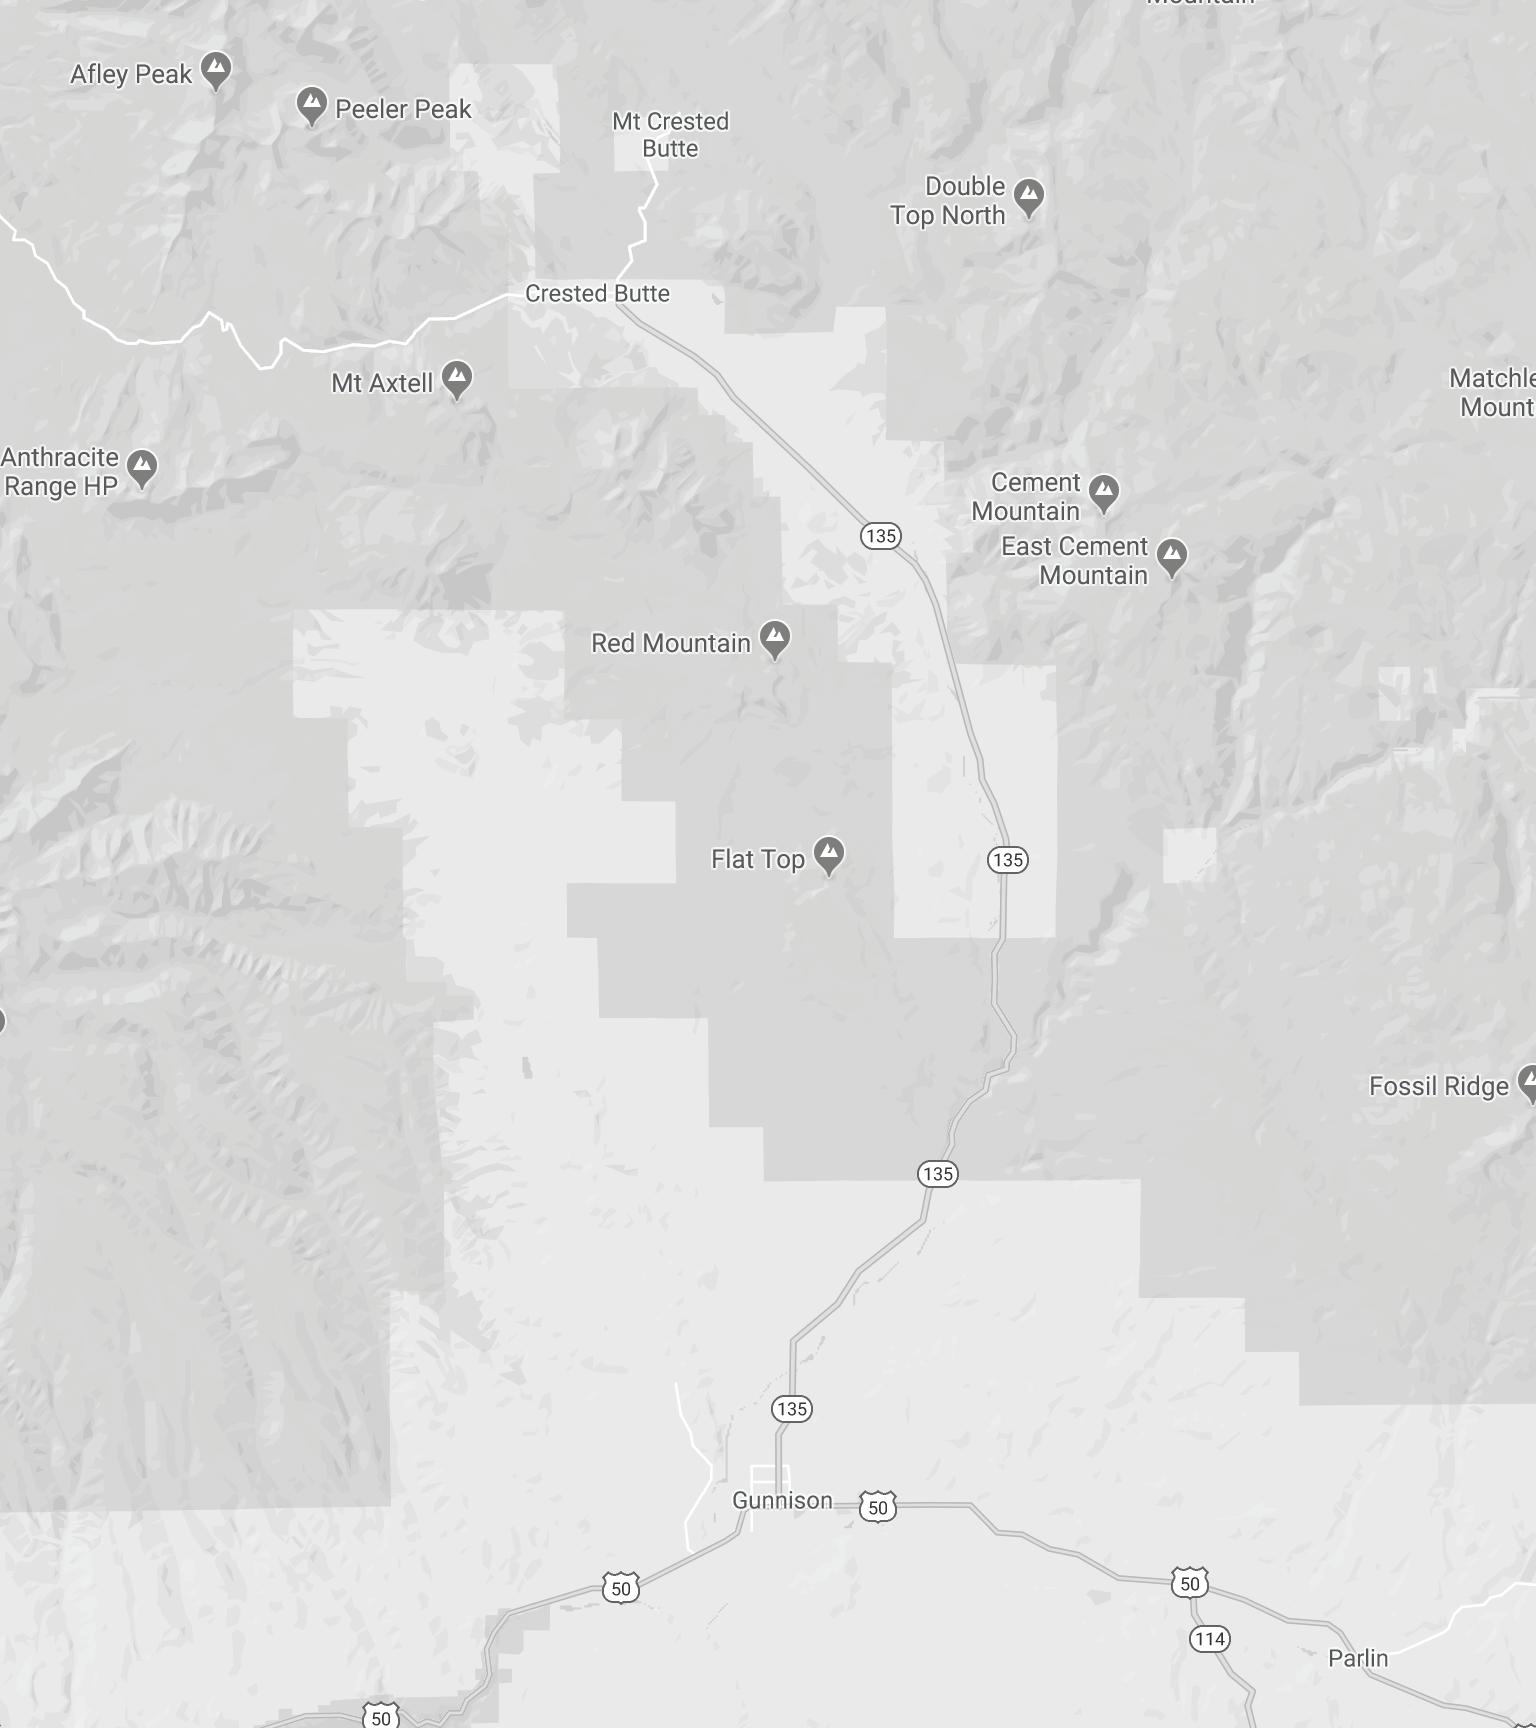
CRESTED BUTTE NEIGHBORHOODS
MICRO MARKET REPORT | Crested Butte JANUARY - MARCH 2023 • COLORADOMICROREPORTS.COM livsothebysrealty.com
3 5 4 2 1
1. Town of Crested Butte 2. Mt. Crested Butte 3. Crested Butte South 4. Almont 5. City of Gunnison
The average price per square foot in the Town of Crested Butte increased by 3.0% January through March 2023 compared to that of 2022.
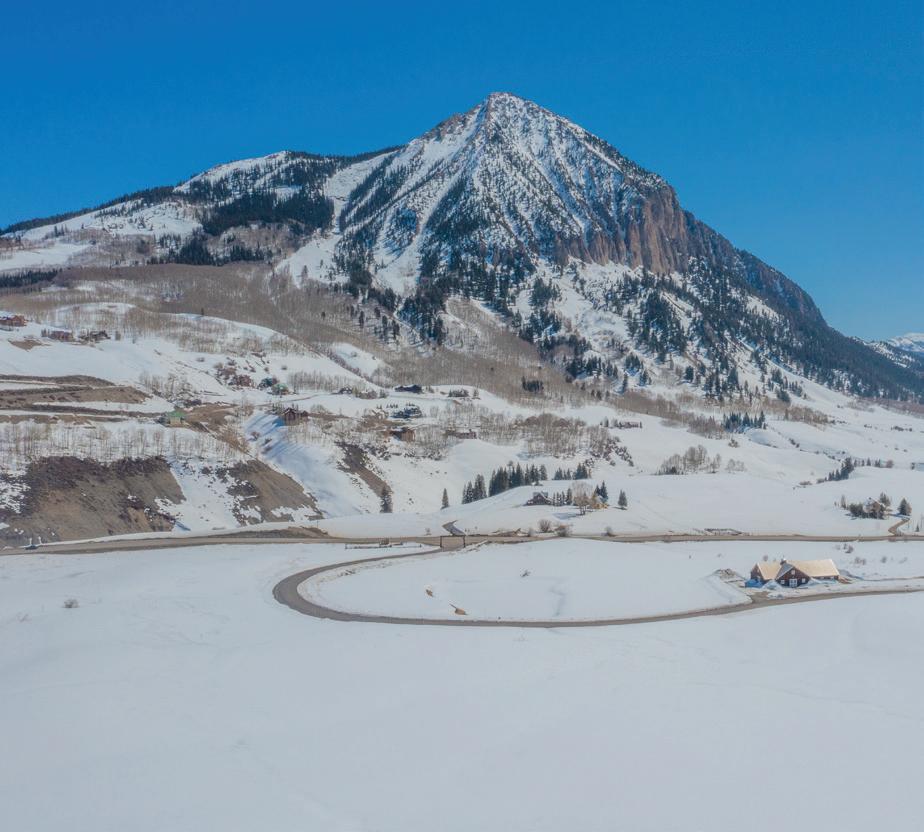
Incorporated in 1880, the Town of Crested Butte rests at an elevation of 8,885 feet and serves as “the Gateway to the Elk Mountains.” Explorer Ferdinand Hayden referred to the dominant peak guarding the residents as a ‘crested butte,’ and the namesake was born.
Residential / Commercial Lots January through March 2022 2023 % Change Average Sold Price $3,659,000 $385,000 -89.5% Average Price per Acre $8,358,942 $1,012,821 -87.9% Average Days on Market 1000 190 -81.0% Highest Sold Price $11,550,000 $385,000 -96.7% Properties Sold 5 1 -80.0% % Sold Price to List Price 99.2% 97.5% -1.8% Condominiums, Townhomes, Duplexes and Triplexes January through March 2022 2023 % Change Average Sold Price - -Average Price per SqFt - -Average Days on Market - -Highest Sold Price - -Properties Sold - -% Sold Price to List Price - -TOWN OF CRESTED
BUTTE 3.0%
All Properties January through March 2022 2023 % Change Average Sold Price $3,271,875 $1,395,000 -57.4% Average Price per SqFt $1,128 $1,162 3.0% Average Days on Market 669 158 -76.4% Highest Sold Price $11,550,000 $1,800,000 -84.4% Properties Sold 8 7 -12.5% % Sold Price to List Price 99.3% 93.1% -6.2% Single Family Homes January through March 2022 2023 % Change Average Sold Price $2,626,666 $1,645,000 -37.4% Average Price per SqFt $1,128 $1,123 -0.5% Average Days on Market 118 121 2.5% Highest Sold Price $5,100,000 $1,800,000 -64.7% Properties Sold 3 3 0.0% % Sold Price to List Price 99.4% 96.9% -2.5%
15.1%
The average price per square foot in Mt. Crested Butte increased by 15.1% January through March 2023 compared to that of 2022.
Smaller in size than the Town of Crested Butte (approximately 800 residents compared to 1,500 residents), Mt. Crested Butte is the actual location of the famous resort. Located inside the Gunnison National Forest, this picture-perfect town covers an area just over two square miles, and those two square miles are a skier or snowboarder’s paradise.
MT. CRESTED BUTTE
Single Family Homes January through March 2022 2023 % Change Average Sold Price $2,647,650 -Average Price per SqFt $723 -Average Days on Market 134 -Highest Sold Price $3,250,000 -Properties Sold 4 -% Sold Price to List Price 96.1% -All Properties January through March 2022 2023 % Change Average Sold Price $816,918 $713,252 -12.7% Average Price per SqFt $622 $716 15.1% Average Days on Market 135 119 -11.9% Highest Sold Price $3,700,000 $1,500,000 -59.5% Properties Sold 45 13 -71.1% % Sold Price to List Price 97.6% 93.7% -4.0% Condominiums, Townhomes, Duplexes and Triplexes January through March 2022 2023 % Change Average Sold Price $626,601 $716,478 14.3% Average Price per SqFt $611 $716 17.2% Average Days on Market 106 85 -19.8% Highest Sold Price $3,700,000 $1,500,000 -59.5% Properties Sold 37 10 -73.0% % Sold Price to List Price 98.7% 97.9% -0.9% Residential / Commercial Lots January through March 2022 2023 % Change Average Sold Price $746,625 $702,500 -5.9% Average Price per Acre $891,409 $1,311,673 47.1% Average Days on Market 406 236 -41.9% Highest Sold Price $937,500 $1,250,000 33.3% Properties Sold 4 3 -25.0% % Sold Price to List Price 94.5% 81.8% -13.4%
51.4%
The average sold price in Crested Butte South increased by 51.4% January through March 2023 compared to that of 2022.
For those who like the area of Crested Butte but perhaps want to shy away from the resort area or the large open rural spaces, Crested Butte South is a subdivision located eight miles south of the town center. This area offers more for those who prefer a suburban setting, yet want to enjoy the clean air and breathtaking vistas of Crested Butte.
CRESTED BUTTE SOUTH
All Properties January through March 2022 2023 % Change Average Sold Price $586,208 $887,230 51.4% Average Price per SqFt $556 $550 -1.0% Average Days on Market 174 233 33.9% Highest Sold Price $1,647,500 $1,200,000 -27.2% Properties Sold 12 5 -58.3% % Sold Price to List Price 99.2% 95.6% -3.6% Single Family Homes January through March 2022 2023 % Change Average Sold Price $1,190,833 $1,058,075 -11.1% Average Price per SqFt $578 $476 -17.7% Average Days on Market 78 156 100.0% Highest Sold Price $1,647,500 $1,183,150 -28.2% Properties Sold 3 2 -33.3% % Sold Price to List Price 98.3% 92.4% -6.0% Condominiums, Townhomes, Duplexes and Triplexes January through March 2022 2023 % Change Average Sold Price $862,500 $962,500 11.6% Average Price per SqFt $523 $625 19.5% Average Days on Market 50 360 620.0% Highest Sold Price $885,000 $1,200,000 35.6% Properties Sold 2 2 0.0% % Sold Price to List Price 101.6% 100.0% -1.6% Residential / Commercial Lots January through March 2022 2023 % Change Average Sold Price $248,142 $395,000 59.2% Average Price per Acre $559,281 $696,721 24.6% Average Days on Market 251 134 -46.6% Highest Sold Price $425,000 $395,000 -7.1% Properties Sold 7 1 -85.7% % Sold Price to List Price 98.7% 92.9% -5.9%
35.7%
The average days on the market in Rural Crested Butte decreased by 35.7% January through March 2023 compared to that of 2022.
29.4%
The average price per square foot for condominiums, townhomes, duplexes and triplexes in Rural Crested Butte increased by 29.4% January through March 2023 compared to that of 2022.
RURAL CRESTED BUTTE Condominiums, Townhomes, Duplexes and Triplexes January through March 2022 2023 % Change Average Sold Price $412,000 $425,000 3.2% Average Price per SqFt $561 $725 29.4% Average Days on Market 30 76 153.3% Highest Sold Price $650,000 $425,000 -34.6% Properties Sold 3 1 -66.7% % Sold Price to List Price 108.5% 100.0% -7.8% All Properties January through March 2022 2023 % Change Average Sold Price $799,863 $1,299,800 62.5% Average Price per SqFt $667 $720 7.9% Average Days on Market 291 187 -35.7% Highest Sold Price $2,550,000 $4,200,000 64.7% Properties Sold 22 10 -54.5% % Sold Price to List Price 99.4% 95.7% -3.7% Single Family Homes January through March 2022 2023 % Change Average Sold Price $1,733,875 $2,303,250 32.8% Average Price per SqFt $747 $718.54 -3.8% Average Days on Market 130 171 31.5% Highest Sold Price $2,550,000 $4,200,000 64.7% Properties Sold 4 4 0.0% % Sold Price to List Price 102.9% 96.0% -6.7% Residential / Commercial Lots January through March 2022 2023 % Change Average Sold Price $628,366 $672,000 6.9% Average Price per Acre $558,556 $407,480 -27.0% Average Days on Market 386 223 -42.2% Highest Sold Price $1,175,000 $955,000 -18.7% Properties Sold 15 5 -66.7% % Sold Price to List Price 95.9% 94.3% -1.7%
The average price per square foot in the City of Gunnison increased by 19.8% January through March 2023 compared to that of 2022.
CITY OF GUNNISON
For those who enjoy all that Gunnison County has to offer in the way of skiing and wide-open spaces but still prefer the idea of being in a proper town, the City of Gunnison is an attractive option. The City of Gunnison prides itself on having an Old West heritage feel while still providing the modern comforts of life.
3.9%
The average days on market for residential/ commercial lots in the City of Gunnison decreased by 3.9% January through March 2023 compared to that of 2022.
All Properties January through March 2022 2023 % Change Average Sold Price $689,125 $427,293 -38.0% Average Price per SqFt $242 $290 19.8% Average Days on Market 117 172 47.0% Highest Sold Price $3,250,000 $850,000 -73.8% Properties Sold 24 31 29.2% % Sold Price to List Price 94.1% 95.3% 1.3% Single Family Homes January through March 2022 2023 % Change Average Sold Price $574,800 $553,309 -3.7% Average Price per SqFt $333 $355 6.6% Average Days on Market 98 177 80.6% Highest Sold Price $699,000 $750,000 7.3% Properties Sold 5 8 60.0% % Sold Price to List Price 96.7% 93.9% -2.9% Condominiums, Townhomes, Duplexes and Triplexes January through March 2022 2023 % Change Average Sold Price $396,150 $357,539 -9.7% Average Price per SqFt $276 $272 -1.3% Average Days on Market 77 134 74.0% Highest Sold Price $565,000 $600,000 6.2% Properties Sold 10 16 60.0% % Sold Price to List Price 99.6% 98.5% -1.1% Residential / Commercial Lots January through March 2022 2023 % Change Average Sold Price $1,699,250 $459,500 -73.0% Average Price per Acre $1,027,022 $910,220 -11.4% Average Days on Market 232 223 -3.9% Highest Sold Price $3,250,000 $799,000 -75.4% Properties Sold 2 2 0.0% % Sold Price to List Price 92.6% 95.8% 3.5%
19.8%
63.7%
The average price per square foot in Almont & Rural Gunnison increased by 63.7% January through March 2023 compared to that of 2022.
The unincorporated community of Almont was originally named Fisher for the founding family but was then changed to honor a famous racehorse of the late 19th century. In its early history, Almont served as a depot for the various nearby mines to store ore that would later be sent to the larger neighboring town of Gunnison. In modern times, the community and the surrounding rural landscape are popular with visitors and nature lovers with vacation homes.
45.0%
The average days on the market for residential and
lots in
decreased by
through
ALMONT & RURAL GUNNISON
All Properties January through March 2022 2023 % Change Average Sold Price $441,877 $797,007 80.4% Average Price per SqFt $299 $489 63.7% Average Days on Market 224 162 -27.7% Highest Sold Price $1,100,000 $5,175,000 370.5% Properties Sold 15 13 -13.3% % Sold Price to List Price 99.3% 94.0% -5.4% Single Family Homes January through March 2022 2023 % Change Average Sold Price $543,018 $687,620 26.6% Average Price per SqFt $320 $360 12.5% Average Days on Market 166 123 -25.9% Highest Sold Price $1,100,000 $920,000 -16.4% Properties Sold 9 5 -44.4% % Sold Price to List Price 99.3% 95.8% -3.6% Condominiums, Townhomes, Duplexes and Triplexes January through March 2022 2023 % Change Average Sold Price - -Average Price per SqFt - -Average Days on Market - -Highest Sold Price - -Properties Sold - -% Sold Price to List Price - -Residential / Commercial Lots January through March 2022 2023 % Change Average Sold Price $239,875 $97,000 -59.6% Average Price per Acre $167,515 $39,692 -76.3% Average Days on Market 409 225 -45.0% Highest Sold Price $428,000 $186,000 -56.5% Properties Sold 4 4 0.0% % Sold Price to List Price 96.6% 91.3% -5.5%
commercial
Almont & Rural Gunnison
45.0% January
March
2023 compared to that of 2022.
04 07 28 NATIONAL PARKS MOUNTAIN RANGES SKI AREAS & RESORTS
WHY COLORADO?
AVG DAYS OF SUNSHINE ANNUALY CRAFT BREWERIES 300 350+
WHY
MICRO MARKET REPORT | Crested Butte JANUARY - MARCH 2023 • COLORADOMICROREPORTS.COM


