by Samantha Cunningham, PhD Geneticist for the North American Limousin Foundation
F
all is a season for keeping score or taking measure: football, harvest and fall cattle work which includes weaning for many, for example. Just as we all cheer for different teams and harvest different crops at different times, as cattlemen and women, we are likely placing emphasis on different traits when making selection decisions on the farm/ranch. And that’s okay, because we need to do what works best for us and our operation; however, there are a few things that can be done to not only help ourselves and our cattle, but also our customers and our breed. There are at least a few times per year when we are seeing our entire herd—calving, branding, breeding and weaning. As you work your way through an annual production calendar, what data columns are you filling in on your operation, and how will you use that data to make informed decisions? As cattle producers, we have a plethora of tools at our fingertips that can (and should) help with decision making—pedigrees, performance data, genomic results and EPDs. EPDs, of course, are
one of the most valuable tools in our toolbox, as they are a combination of those things listed, taking into account the performance of an animal’s relatives, the results of any genomic testing, and that animal’s own performance. Measuring and recording an individual animal’s own performance is one of the most valuable things we can do because these data points are necessary to support the accuracy of the genomic marker effects in the EPDs. Likewise, by increasing the amount of data collected, as it relates to a particular animal, we can also increase our EPD accuracies which, as you know, will help us make selection decisions that will impact future generations and profits. Which brings me back to my original question—what columns are you filling in this year at weaning and how will you use that data in informed decision making? An animal has as many phenotypes as it has traits to measure, and a genetic evaluation is only as good as the data submitted. Genetic predictions have come a long way, but the basics for these predictions remain the same: phenotype (an animal’s performance),
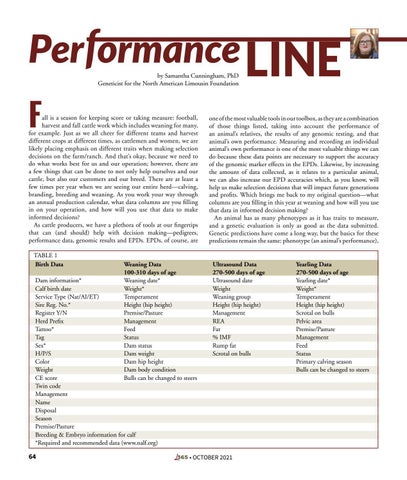
TABLE 1 Birth Data Weaning Data Ultrasound Data Yearling Data 100-310 days of age 270-500 days of age 270-500 days of age Dam information* Weaning date* Ultrasound date Yearling date* Calf birth date Weight* Weight Weight* Service Type (Nat/AI/ET) Temperament Weaning group Temperament Sire Reg. No.* Height (hip height) Height (hip height) Height (hip height) Register Y/N Premise/Pasture Management Scrotal on bulls Herd Prefix Management REA Pelvic area Tattoo* Feed Fat Premise/Pasture Tag Status % IMF Management Sex* Dam status Rump fat Feed H/P/S Dam weight Scrotal on bulls Status Color Dam hip height Primary calving season Weight Dam body condition Bulls can be changed to steers CE score Bulls can be changed to steers Twin code Management Name Disposal Season Premise/Pasture Breeding & Embryo information for calf *Required and recommended data (www.nalf.org)
64
• OCTOBER 2021


