DECEMBER 1992
JOHNS AND DOSWELL
In the early days of sounding analysis, forecasters hand plotted local radiosonde data on a thermodynamic diagram (e.g., a pseudoadiabatic chart), and assessed the potential for deep convection graphically, based on expected diurnal heating and other factors. Estimation of static instability (positive area) and cap (negative area) were an important part of this process. Since technology at that time did not allow for timely quantitative determination of positive and negative areas, several stability indices (e.g., the SELS lifted index; Galway 1956) were developed. Such indices, many of which remain in use today, key primarily on mandatory pressure-level data. This makes them sensitive to the details in the sounding and, hence, they may be unrepresentative of the true character of the data. Further, the sounding used in their calculation can change significantly in the time between the sounding and convective development, so the numerical values can be unrepresentative in this way, as well. As technology and our understanding of storm processes have changed, new techniques and parameters are evolving that make use of more of the information in a sounding than the traditional indices. Currently at SELS, forecasters use the VAS [VISSR (Visible and Infrared Spin Scan Radiometer) Atmospheric Sounder] Data Utilization Center (VDUC) interactive computer system (Browning 1991, 1992) routinely to display thermodynamic profiles and to determine derived parameters. Local analysis computer programs, such as CONVECT (Stone 1988), and interactive programs, such as the Skew T—logp/ Hodograph Analysis and Research Program (SHARP; Hart and Korotky 1991), are being utilized widely by local forecasters to assist in quantitative sounding analysis. These interactive programs incorporate the old indices along with newer ones (e.g., convective available potential energy, or CAPE) and allow the forecaster to modify the sounding data to attempt to account for anticipated spatial and temporal variations in the storm environment. To assist the SELS forecaster in defining (in both area and time) the short-term potential (0–7 h) for thunderstorm development, hourly surface data are used to compute parameter fields, some of which are modified for expected changes aloft.2 By this means, the forecaster can obtain hourly estimates of such parameters as surface parcel lifted index values (positive area), cap strength (negative area), low-level convergence (implying localized lifting, usually along a boundary; see, e.g., Wilson et al. 1988), and many others. Forecasting for the longer term (e.g., the SELS 0700 UTC convective outlook forecasts the potential for general 2 For example, VDUC uses 500-mb static temperatures to compute surface-based lifted index values for the first few hours after receipt of scheduled radiosonde data, with Nested Grid Model (NGM) forecast 500mb temperatures being used when they become available (4 to 9 h after scheduled radiosonde data receipt).
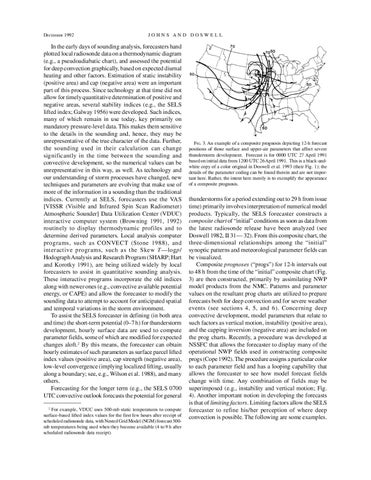
FIG. 3. An example of a composite prognosis depicting 12-h forecast positions of those surface and upper-air parameters that affect severe thunderstorm development. Forecast is for 0000 UTC 27 April 1991 based on initial data from 1200 UTC 26 April 1991. This is a black-andwhite copy of a color original in Doswell et al. 1993 (their Fig. 1); the details of the parameter coding can be found therein and are not important here. Rather, the intent here merely is to exemplify the appearance of a composite prognosis.
thunderstorms for a period extending out to 29 h from issue time) primarily involves interpretation of numerical model products. Typically, the SELS forecaster constructs a composite chart of “initial” conditions as soon as data from the latest radiosonde release have been analyzed (see Doswell 1982, II 31— 32). From this composite chart, the three-dimensional relationships among the “initial” synoptic patterns and meteorological parameter fields can be visualized. Composite prognoses (“progs”) for 12-h intervals out to 48 h from the time of the “initial” composite chart (Fig. 3) are then constructed, primarily by assimilating NWP model products from the NMC. Patterns and parameter values on the resultant prog charts are utilized to prepare forecasts both for deep convection and for severe weather events (see sections 4, 5, and 6). Concerning deep convective development, model parameters that relate to such factors as vertical motion, instability (positive area), and the capping inversion (negative area) are included on the prog charts. Recently, a procedure was developed at NSSFC that allows the forecaster to display many of the operational NWP fields used in constructing composite progs (Cope 1992). The procedure assigns a particular color to each parameter field and has a looping capability that allows the forecaster to see how model forecast fields change with time. Any combination of fields may be superimposed (e.g., instability and vertical motion; Fig. 4). Another important notion in developing the forecasts is that of limiting factors. Limiting factors allow the SELS forecaster to refine his/her perception of where deep convection is possible. The following are some examples.