34 minute read
Employment Challenges and Prospects for Labour Market Integration (Case of Georgia


Marine Tavartkiladze*, Anna Phirtskhalashvili**
DOI: 10.26399/meip.1(71).2021.03/m.tavartkiladze/a.phirtskhalashvili
Advertisement
INTRODUCTION
Poverty is one of the biggest challenges for Georgia, which is directly related to the issues of employment and unemployment.1 The above-said, among other things, is confirmed by various sociological studies. According to the research, the vast majority of citizens name employment as the main problem. Also, based on the results of the study, in which the business was also involved, it can be said that what remains the main challenge for the country by 2021 is the high number of job seekers, unused work resources and the demand-supply imbalance of professions.2 [This work was supported by
* Marine Tavartkiladze, PhD, School of Public Administration and Politics, Grigol Robakidze University, Tbilisi, Georgia, e-mail: tavartkiladze.marine@gmail.com, ORCID: 0000-0002-1528-5649 ** Anna Phirtskhalashvili, PhD, Faculty of Law, Georgian National University SEU,
Tbilisi, Georgia, e-mail: a.phirtskhalashvili@gmail.com, ORCID: 0000-0002-5795322X 1 Structure of unemployment and structural unemployment in Georgia; Friedrich Ebert
Stiftung, 2016, http://www.fes-caucasus.org/news-list/e/structure-of-unemploymentand-structural-unemployment-in-georgia/; 2 Tavartkiladze, M, 2020, ʻEmployment Challenges in Georgia’, Kyiv National University named after Vadim Hetman. V International Scientific and Practical Conference Proceedings: ʻStrategic Imperatives of Modern Management’, 2020, pp. 350–354, ISBN 978-966-926-325-1.
Shota Rustaveli National Science Foundation of Georgia (SRNSFG), Grant Number: FR-19-19619, Project Title: Protection of social and economic rights in Georgia].
The modern European state is an active, effective state in terms of employment promotion. The government of such a state undertakes to take care of the welfare of its citizens, which ultimately creates an economically strong and politically stable society.
Georgia, like most other European countries, cares about employment policy and its consequences due to the fact that the Employment promotion measures developed by the government lead to effective stimulation of the labour market, which in turn has a positive impact on the well-being of citizens and on economic growth rates.
It is necessary for the state to pursue such an active employment promotion policy, which on the one hand, will link job seekers and businesses and, on the other hand, it will bring together the qualifications of job seekers and the requirements of the business in the country, which will significantly increase the number of people employed and will help businesses to increase the quality as well as to create new jobs.
It is important to motivate socially vulnerable people and offer them jobs that allow them to support themselves and their families with dignity3, to develop their professional skills.
The above-mentioned systemic reform of active employment policy in Georgia required a legislative framework in order to define at the level of law the system that should function successfully in terms of employment. The Parliament of Georgia adopted the Law of Georgia on Employment Promotion in the summer of 2020. It will enter into force on 1st September 2021.
Legislative changes in Georgia were based on a study conducted on the basis of German and Austrian experience and Georgian specifics.
Based on the preliminary assessment of the implementation of the legislative reform, it will facilitate, on the one hand, the employment of job seekers and, on the other hand, the business to have qualified staff employed. It will also help ensure a balance between demand and supply for business and education. Its expected outcome is not only to ensure an increase in the
3 Card, D., Kluve, J. and Weber, A., 2017, ʻWhat Works? A Meta Analysis of Recent
Active Labor Market Program Evaluations’, Journal of the European Economic Association (2017), 16(3): 894–931.
number of employed citizens, but also to improve the social background in the community and promote business development.
The essence of the reform in the field of employment:
As a result of the systematic analysis conducted while working on the law, the conceptual innovations of the legislative regulations were formed: • Production of active and systematic employment promotion policy; • Creating such a facilitating system of employment that provides human resources having education appropriate to the requirements of the business; • To increase the motivation of the unemployed people to be employed, taking care of improving and activating their professional qualifications; • Receiving state employment services by single-window principle; • Evaluating the job seeker's opportunities and offering relevant alternatives based on his/her qualification, such as: – Appropriate workplace; – Vocational college and then the appropriate workplace; – Remunerated internship and wage subsidy; – All existing state programmes of business start-ups; – Employment abroad (labour migration).
The law establishes unified principles of employment promotion, such as: individualisation of employment-promoting activities, freedom of choice of activities, prohibition of discrimination, impartiality, job seeker motivation, public-private partnership, free state employment promotion service, singlewindow principle.
Chapter 3 of the Law of Georgia “On Employment Promotion” defines the following main forms of employment promotion: connecting employers and job seekers, employment, employment by wage subsidy, internship, employment abroad (labour migration).
The employment promotion reform creates an effective system of employment promotion measures that serves to help job seekers become employees. Procedural measures to promote employment include registration as job seekers, data processing of persons registered, informing and consulting jobseekers, assessing and profiling their employment opportunities, compiling individual career development plans, training job seekers, hiring job seekers, researching employers’ needs, promoting employers, and increasing motivation and access to finance. In addition, the law provides for the promotion of employers and increase their motivation to employ more citizens.
The law pays special attention to the rights of vulnerable groups. Among them, relevant regulations are proposed for those receiving social assistance. Under the new law, people with disabilities enjoy the right to preferential protection in the labour market; they have the right to professional rehabilitation, which in turn is provided by the agency. The law envisages the creation of protected workplaces for people with disabilities. Protected workplace is the creation of such a work environment by the employer, in agreement with the State Employment Promotion Agency, that is adapted for the disabled person. To adapt or create a protected working environment, the agency is authorised to subsidise the employer, provided that the working environment is operational for at least 3 years.
The reform defines the rights and obligations of the job seeker and the employer, which ensure, on the one hand, revealing the needs of the employers and response to them, and, on the other hand, the motivation of the job seekers and their employment.
According to the law, the Parliament of Georgia, as the main determinant of domestic policy in the country, establishes the main legislative bases for the production, planning and analysis of active labour market policy. In order to effectively implement the active labour market policy, the law envisages the adoption of appropriate measures by the Government of Georgia, for example, the creation of an inter-agency coordination mechanism. By law, the executive government will provide a unified analysis of active labour market policy, exchange of information between agencies, and subsequent planning.
The law establishes the institutions responsible for employment promotion issues and, at the same time, the employment promotion implementing system, according to which employment promotion activities are carried out on the basis of public-private partnership. In order to effectively achieve the objectives of the law, it adopts an opportunity, that the performance of the defined function or job of the employment promotion activities was transferred to a non-profit (non-entrepreneurial) legal entity through the contract.
Legislative reform complies with Articles 227 and 229, subparagraph “h” of the Article 239, subparagraphs “b”, “c”, “d” of Article 349, subparagraphs “a” and “b” of Article 360 of the Association Agreement between Georgia and the European Union, according to which, the government has a commitment to take positive steps to pursue an active employment policy for own citizens.
2. LABOUR MARKET ANALYSIS AND EXPECTED OUTCOMES
The interest in government policy of employment and its results is caused by the launch of several measures supporting employment by the government.4 It should be noted that 467,284 persons in Georgia received social benefits in 20195. In order to receive social benefits from the government labour force often refuse to search for jobs and begin working. Long-term unemployment leads to decreasing qualification of labour force and they are becoming labour market outsiders. Unused labour force generally prevents business and economic development of the country.
In order to identify the current situation, challenges and future opportunities in the employment market in Georgia, we analysed a reliable statistical database.
The objective of the present survey is to evaluate the integration chances on the employment market in Georgia. The survey represents citizens of all age groups, with varied criteria and qualities. The chances of employment were studied with the use of the statistical-econometric methods such as: expert evaluation, descriptive-statistical analysis of variables, logistics models of chances and the so-called “survival” analysis.
The variables indicating the individual characteristics and skills were studied, such as an individual’s age, gender, education, activity type, position and all variables of similar type that are important to the evaluation of the expertise.
An equation of logistical regression used in the analysis is as follows:
Zi ln 1 iP Pi x x= c m 1 1 g a b b= + + + n n
Where the dependent or the left-sited variable shows the balance between the likelihood of the event occurring and the probability of its non-occurrence. In our case, the probability of employment and the probability of unemployment. Dependent variables have positive or negative impacts on the employment variables and therefore the chances of employment increases or decreases under the influence of the change of these variables.
The analysis was carried out on two bases: a large base of respondents across Tbilisi, comprising 6000 households in Georgia and 502 households
4 Tavartkiladze, M, 2020, ‘Georgia’s employment policy in the context of efficiency and fairness.’ International Conference materials, Department of European Integration and Legal Studies, Collegium of World Economy. SGH Warsaw School of Economics. 5 Information retrieved from Ministry of IDPs, Labour, Health and Social Affairs from
Occupied Territories of Georgia.
surveyed in one region of Tbilisi. The Analysis was conducted in the following directions: the modeling was conducted with the similar methods and the similar variables were tested in order to identify the local features that are important for integration into the employment market.
In this case, to create a logistical regression, the random variables such as an individual’s gender, age, education and activity were selected. Gender is a binary variable, age is a continuous numerical variable, education and activity variables belong to the ordinary category, which constitutes multilayer qualitative variables.
As far as the second base is concerned, it is a household one. It contains a survey of results of 502 households and the persons interviewed in private in the households. The selection of persons subject to the inquiry was made based on the unemployment criteria, namely, all the persons who were interviewed within the households at the time of the survey were unemployed.
The goal of the survey is to identify the socio-economic and demographic factors that have a great impact on unemployment, which will give us data to draw relevant recommendations and conclusions to manage this economic phenomenon correctly and reasonably.
An examination of the hypothesis for the survey is formed as follows: as for the targeted variable, there is a job-offering variable taken for the jobless individuals who were interviewed. Within the logistics model of chances, we are exploring the factors that increase the chances of offering employment from the employers.
Out of 502 interviewed persons, 276 did not have a job offer and 213 did but, however, for some reason, they declined such offers.
To examine the chances of employment, the impact of variation of the certain explanatory variables was checked on the variation of the targeted variable and the size of impact of each explanatory variable and direction was tested on the variable that is subject to explanation.
In terms of impact on the employment offer, important explanatory variables were examined such as: gender, age, education, civil status, driving license, number of employed and unemployed in a family, social vulnerability, household size, profession, language: Georgian, English, Russian, German, Turkish, knowledge of MS Office programs, knowledge of accounting programs, various skills, work experience, work experience by profession, number of unemployment years, job search/first search status, to whom the person looking for a job addressed in order to start a job, if he/she had a job offer, the desired wage of an individual, whether he/she wants to serve internship, as well as, retraining within the state programmes, if one made an
attempt to start a business in the past, and whether or not he/she has a desire to start a business now. The analyses below include only those variables, which have shown statistically significant impact on the employment offer variable. The variables that have not been statistically significant indicators in the chances of employment offer have been removed from the analysis.
Logistical regressions have been constructed separately for the important variables and we evaluated variations of their private influence. The age variable is statistically a significant variable (Model 1). The logistics model shows the direction and size of the influence of the age variable on the variation of the employment offer variable. As a model as well as the age variable, it is statistically important. The increase in the age by 1 year reduces the chances of employment offers by 0.035.
Private impact of the age variable
Call: glm(formula = Class ~ age, family = binomial (link = “logit”), data = dat, maxit = 100)
Deviance Residuals: Min 1Q Median 3Q Max -1.3325 -1.0873 -0.7783 1.1625 1.7831
Coefficients: Estimate Std. Error z value Pr(>|z|) (Intercept) 0.930351 0.262747 3.541 0.000399 *** age -0.035811 0.007556 -4.739 2.14e-06 *** --Signif. codes: 0 ‘***’ 0.001 ‘**’ 0.01 ‘*’ 0.05 ‘.’ 0.1 ‘ ’ 1
(Dispersion parameter for binomial family taken to be 1)
Null deviance: 664.66 on 484 degrees of freedom Residual deviance: 640.72 on 483 degrees of freedom (17 observations deleted due to missingness) AIC: 644.72
Number of Fisher Scoring iterations: 4 Model 1
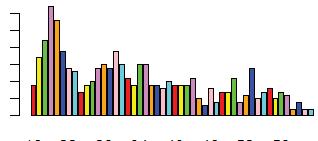
If we look at the age group variable histogram (see Figure 1), most of the respondents belong to the young age categories, so it is logical to think that the increase in age should not be negatively impacted on their chances of employment. But as we can see, the highest frequency is recorded between 16–22 age groups, where there are pupils, students and school-leavers to whom
it is logical that the chances to offer a job is not high. Also, the number of respondents in 45+ age categories is not so little either. Hence, the amount and direction of age variables impact on the chances of offering jobs look natural.
Distribution of selection according to age variables
30
20
10
0
16 22 28 34 40 46 52 58
Source: Own study Figure 1
It is important to note that the previous work experience years have shown a slight negative impact on the chances of job offers.
Private impact of working experience Model 2
Call: glm(formula = Class ~ experience, family = binomial(link = “logit”), data = dat, maxit = 100)
Deviance Residuals: Min 1Q Median 3Q Max -1.1409 -1.1098 -0.9242 1.2260 1.6985
Coefficients: Estimate Std. Error z value Pr(>|z|) (Intercept) -0.08650 0.11323 -0.764 0.4449 experience -0.02715 0.01089 -2.493 0.0127 * --Signif. codes: 0 ‘***’ 0.001 ‘**’ 0.01 ‘*’ 0.05 ‘.’ 0.1 ‘ ’ 1
(Dispersion parameter for binomial family taken to be 1)
Null deviance: 663.00 on 483 degrees of freedom Residual deviance: 656.38 on 482 degrees of freedom (18 observations deleted due to missingness) AIC: 660.38
Number of Fisher Scoring iterations: 4
During the unemployment period, for those who tried to start their own businesses, these events statistically do not have a significant impact on the on-going job offer chances. With the 10% inaccuracy chance, for those who did not attempt to start their own businesses, their job offer chances are higher by 0.3. As for the desire to start a business in the current unemployment period, for those who want to start their own business, their chances of employment are higher by 0.5. A coefficient is statistically important.
Model 3 Impact of the desire to start one’s own business on the employment offers
Call: glm(formula = Class ~ own business, family = binomial(link = “logit”), data = dat, maxit = 100)
Deviance Residuals: Min 1Q Median 3Q Max -1.1855 -0.9751 -0.9751 1.1693 1.3942
Coefficients: Estimate Std. Error z value Pr(>|z|) (Intercept) -0.4964 0.1281 -3.875 0.000107 *** own business 2 0.5155 0.1883 2.737 0.006195 ** --Signif. codes: 0 ‘***’ 0.001 ‘**’ 0.01 ‘*’ 0.05 ‘.’ 0.1 ‘ ’ 1
(Dispersion parameter for binomial family taken to be 1)
Null deviance: 642.22 on 468 degrees of freedom Residual deviance: 634.67 on 467 degrees of freedom (33 observations deleted due to missingness) AIC: 638.67
Number of Fisher Scoring iterations: 4
The next statistically significant variable is the duration of years spent in unemployment. The variable’s statistic summary looks as follows:
Min. 1st Qu. Median Mean 3rd Qu. Max. NA’s
0.000 0.500 2.000 3.231 4.000 32.000 116
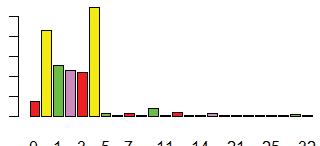
Among the respondents the average duration of unemployment is 3 years, and the medial one – 2 years. The highest unemployment rate was 32 years. Regarding the unemployment years, the distribution of respondents on the histogram looks as follows:
Distribution of respondents with regard to unemployment years Figure 2
80
40
0
Source: Own study
0 1 3 5 7 11 14 21 25 32
Most respondents have fallen into the four-year unemployment category, followed by the half-year unemployment, followed by a 1-, 2-, and 3-year unemployment categories.
According to the private model of unemployment duration, the increase in unemployment to one year reduces the chances of employment offers by 0.1. This means that being unemployed for a long time is not recommended, and timely withdrawal from unemployment should be promoted/supported.
Model 4
Private impact of unemployment on employment offerings
Call: glm(formula = Class ~ unempduration, family = binomial(link = “logit”), data = dat, maxit = 100)
Deviance Residuals: Min 1Q Median 3Q Max -1.189 -1.066 -1.026 1.208 1.822 Coefficients: Estimate Std. Error z value Pr(>|z|) (Intercept) 0.02733 0.14026 0.195 0.84549 unduretaion -0.09841 0.03463 -2.842 0.00448 ** --Signif. codes: 0 ‘***’ 0.001 ‘**’ 0.01 ‘*’ 0.05 ‘.’ 0.1 ‘ ’ 1
(Dispersion parameter for binomial family taken to be 1)
Null deviance: 526.95 on 384 degrees of freedom Residual deviance: 515.73 on 383 degrees of freedom (117 observations deleted due to missingness) AIC: 519.73
Number of Fisher Scoring iterations: 4
Private impact of skills on employment offers
Call: glm(formula = Class ~ skills, family = binomial(link = “logit”), data = dat, maxit = 100)
Deviance Residuals: Min 1Q Median 3Q Max -1.4823 -1.0432 -0.9331 1.1688 1.8930
Coefficients: Estimate Std. Error z value Pr(>|z|) (Intercept) 0.08192 0.15307 0.535 0.5925 skills2 -0.40616 0.24514 -1.657 0.0975 . skills3 -0.48738 0.34062 -1.431 0.1525 skills4 -0.68805 0.33059 -2.081 0.0374 * skills5 -0.51270 0.38776 -1.322 0.1861 skills6 -0.62091 0.36949 -1.680 0.0929 . skills7 -0.08192 0.52291 -0.157 0.8755 skills8 -0.48738 0.92562 -0.527 0.5985 skills9 0.61123 1.23427 0.495 0.6204 skills10 -1.69136 0.78958 -2.142 0.0322 * --Signif. codes: 0 ‘***’ 0.001 ‘**’ 0.01 ‘*’ 0.05 ‘.’ 0.1 ‘ ’ 1
(Dispersion parameter for binomial family taken to be 1)
Null deviance: 666.31 on 485 degrees of freedom Residual deviance: 653.73 on 476 degrees of freedom (16 observations deleted due to missingness) AIC: 673.73
Number of Fisher Scoring iterations: 4 Model 5
As the research revealed, the knowledge of Office programs within the area of the conducted survey helps individuals to increase their chances of employment. Specifically, as the model shows, the knowledge of Office programs increases the chances of employment at 1, 2, and 3 levels, and among them the knowledge of it mostly – at the second level. The knowledge at the first level increases by 0.85, the knowledge at the second level at 1.11, but at the third level the chances increase by 0.63.
Model 6
Influence of knowing MS Office programs on employment offers Call: glm(formula = Class ~ Office, family = binomial(link = “logit”), data = dat, maxit = 100)
Deviance Residuals: Min 1Q Median 3Q Max -1.3332 -1.1243 -0.8756 1.2315 1.5128
Coefficients: Estimate Std. Error z value Pr(>|z|) (Intercept) -0.7610 0.1604 -4.743 2.11e-06 *** Office1 0.8563 0.3481 2.460 0.0139 * Office2 1.1199 0.2537 4.415 1.01e-05 *** Office3 0.6347 0.2488 2.551 0.0108 * Office4 0.2714 0.3326 0.816 0.4145 --Signif. codes: 0 ‘***’ 0.001 ‘**’ 0.01 ‘*’ 0.05 ‘.’ 0.1 ‘ ’ 1
(Dispersion parameter for binomial family taken to be 1)
Null deviance: 669.76 on 488 degrees of freedom Residual deviance: 646.91 on 484 degrees of freedom (13 observations deleted due to missingness) AIC: 656.91
Number of Fisher Scoring iterations: 4
It is significant what the impact of knowledge of languages is on the chances of employment in the area surveyed. It was identified that German, Russian and Turkish are not important variables. Statistically, only knowing the English language is significant. To know English at the first level, the chance to get a job offer is 1.08, at the second level, it is 1.06, and the knowledge of English at the third level, it is 0.94.
Impact of the English language on a job offer
Call: glm(formula = Class ~ English, family = binomial(link = “logit”), data = dat, maxit = 100)
Deviance Residuals: Min 1Q Median 3Q Max -1.3153 -0.8742 -0.8742 1.1022 1.5146
Coefficients: Estimate Std. Error z value Pr(>|z|) (Intercept) -0.7648 0.1407 -5.435 5.48e-08 *** English1 1.0833 0.4855 2.231 0.025662 * English2 1.0611 0.2827 3.753 0.000175 *** English3 0.9444 0.2234 4.228 2.36e-05 *** English4 0.5930 0.3673 1.614 0.106462 --Signif. codes: 0 ‘***’ 0.001 ‘**’ 0.01 ‘*’ 0.05 ‘.’ 0.1 ‘ ’ 1
(Dispersion parameter for binomial family taken to be 1)
Null deviance: 669.76 on 488 degrees of freedom Residual deviance: 642.88 on 484 degrees of freedom (13 observations deleted due to missingness) AIC: 652.88
Number of Fisher Scoring iterations: 4 Model 7
A marital status was a very important variable for the research purposes. The second category increases the chances of job offering almost with 100% statistical accuracy by 0.7. The 3rd and 4th categories are likely to have 10% inaccuracy: 0.4 and 1.7 respectively.
Model 8
The impact of the marital status on the chances of job offers Call: glm(formula = Class ~ civilstatus, family = binomial(link = “logit”), data = dat, maxit = 100)
Deviance Residuals: Min 1Q Median 3Q Max -1.6651 -0.9272 -0.9272 1.1306 1.4502
Coefficients: Estimate Std. Error z value Pr(>|z|) (Intercept) -0.6217 0.1329 -4.677 2.91e-06 *** civilstatus2 0.7329 0.1904 3.850 0.000118 *** civilstatus3 0.4210 0.4687 0.898 0.369052 civilstatus4 1.7203 1.1623 1.480 0.138859 --Signif. codes: 0 ‘***’ 0.001 ‘**’ 0.01 ‘*’ 0.05 ‘.’ 0.1 ‘ ’ 1
(Dispersion parameter for binomial family taken to be 1)
Null deviance: 669.76 on 488 degrees of freedom Residual deviance: 653.04 on 485 degrees of freedom (13 observations deleted due to missingness) AIC: 661.04
Number of Fisher Scoring iterations: 4
As for research on the growth of employment opportunities on a large base, the employment base consists of 33,445 observation points and 15 variables. Employees of the database are divided into two groups: hired employees and self-employed. The purpose of the analysis is to identify which variables affect the employer’s employment variable, and what the value of these variables is in terms of impact. The analysis is done with the use of the logistical regression. A binary variable of analysis is the hiring variable, which, in case it is positive, is marked with 1, and in case of the negative response, it is marked with 0. The variables in the database, such as the individual’s age, gender, education, type of activity and position are important variables to employment chances in the experts’ opinion.
In order to create a logistical regression, random indicators such as an individual’s gender, age, education and field of activity were selected. Gender is a binary variable, age is a continuous numerical variable, education and activity variables belong to the ordinary category, so that they are multilayer qualitative variables.
A hired employee is taken for the purpose of the survey of employment chances. By this admission, 13,054 people in the sampling base are hired employees, and 20,391 are unemployed, out of whom 16,850 are males and 16,595 are females.
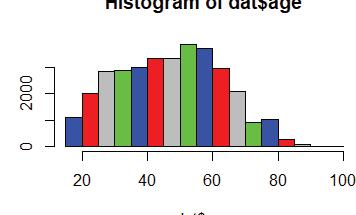
Histogram of the age variable
Histogram of dat$age Figure 3
Frequency 2000
0
Source: Own study
20 40 60 dat$age 80 100
Statistical summary of age variables:
Min. 1st Qu. Median Mean 3rd Qu. Max.
15.0 35.0 48.0 47.4 59.0 97.0
The minimum age for individuals involved in the database is 15 years and the maximum – 97 years. Median and medium values are close to one another. The histogram shows that among the surveyed individuals the age group from 50 to 60 years of age is the most numerous, followed by the age group of 40 to 50 years, followed by the individuals in the age groups of 35–40 and 60–65. In logistical regression, we will examine the age increase by one year for the impact on the employment chances. Understanding the descriptive picture of the age of the respondents in this regard is important. The four-segment indicator of activity has been reduced to double digit and single digit levels. Distribution of one scale variable type of activities looks as follows:
1 2 3 4 5 6 7 8 9
19159 574 129 1823 3270 1632 1896 3760 1200
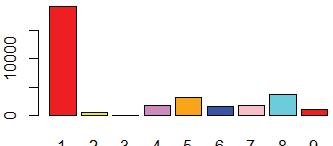
By distribution, most of the people are employed in the agricultural industries, forestry and fish farms. Then, the 8th group comes: education;
state governance and defence; compulsory social protection; and the 5th group: provision of facilities and food delivery activities; information and communication. Fewer people are employed in the field of electricity, water supply, gas supply, and waste management. In the logistics regression we will evaluate how the move from one group to the next group changes the chances of employment compared to the 1st group of the database.
Figure 4 Activities of individuals involved in the database distributed in accordance with the types of aggregated activities
10000
0
Source: Own study
1 2 3 4 5 6 7 8 9
The activities of individuals engaged in the database are distributed in the following nine groups:
The activities of individuals engaged in the database Table 1
1 Country forestry and fish farming 2 Industry 3 Electricity, water supply, gas supply, waste management 4 Construction, transportation and warehousing, wholesale and retail trade; repairs of automobiles and motorcycles 5 Provision of facilities and food delivery activities; information and communication 6 Financial and insurance company activities; real estate related activities 7 Administrative and support services 8 Education; state governance and defence; compulsory social protection 9 Art, entertainment and recreation; households as employers; production of non-differentiated goods and services for household consumption; other types of services
Source: Own study.
See also the distribution of individuals with regard to the activity variables aggregated on two digits.
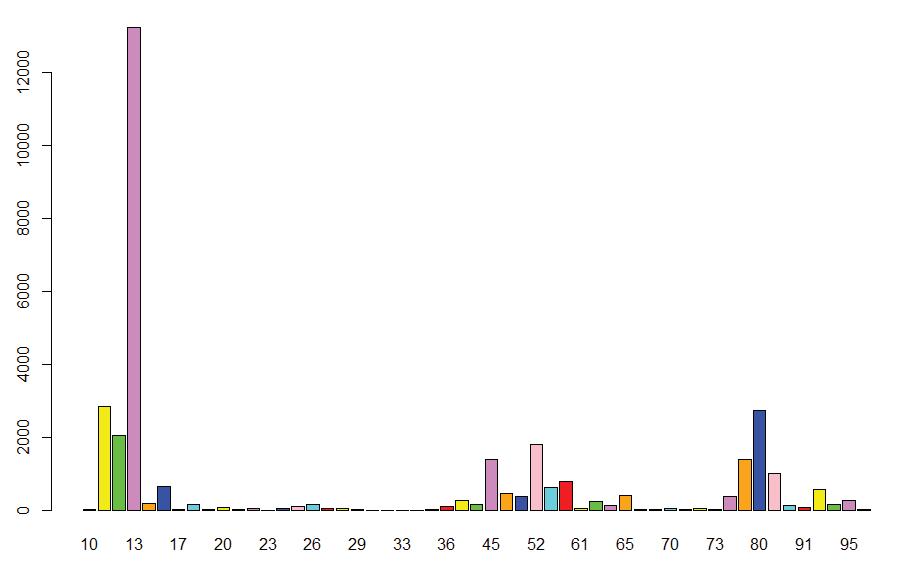
Figure 5 Distribution of individuals according to the type of aggregated activities on 2 digits
12000
10000
800
600
400
200
0
10 13 17 20 23 26 29 33 36 45 52 61 65 70 73 80 91 95
Source: Own study
Most people are involved in the activities indicated by the code “13”. The education variable contains 13 levels.
Levels of education variables Table 2
1 Unable to read and write; 2 Uneducated, but can write and read; 3 Preschool education; 4 Elementary level of general education; 5 Basic level of general education (incomplete secondary education); 6 Full general education (complete secondary education); 7 Vocational education without a full general education certificate; 8 Vocational education on the basis of (complete) general education – with a general education certificate; 9 Vocational education on the basis of (full) general education – except higher vocational education programmes;
Table 2 (cont.) 10 (Higher) vocational education or an equivalent higher education programme diploma; 11 Bachelor’s diploma or equivalent higher educational degree programme diploma; 12 Master’s / Residency Graduate or equivalent higher educational degree programme diploma; 13 PhD, Dr or equivalent degree. Source: Own study
The distribution of individuals involved in the research according to the achieved levels of education is as follows:
1 2 3 4 5 6 7 8 9 10 11 12 13 81 62 6 463 2224 13150 517 1413 6674 18 2061 6673 103
Most of the individuals have only full general education. In fact, there is the same amount of respondents who report the level of vocational education on the basis of full general education, and individuals with Master’s / Residency degrees. In the model of employment chances, we are interested in how the increase in the level of education increases the employment chances in comparison with the base level – reading and writing inability.
According to the model, gender is not a statistically significant variable determining the chances of employment. The age variable is important and it has a small negative coefficient. This means that the chances of employment, along with the increase in age, reduce by 0.03. This has a natural explanation, especially when the older age groups are majorities in the age histogram according to frequency.
The level of diploma and its following stages of the (higher) vocational education or equivalent level of higher educational programmes reach the statistically important impact on the employment chances and defined important impact by the model. The chances of employment by recruiting are rising most at the 11th, 12th and 13th levels by 1.6, 1.4 and 1.7 respectively. Interestingly, the chances of employment for individuals with a Bachelor’s degree are slightly more comparable to individuals with the Master’s degree.
Since the type of activity, with the expertise assessment and statistical assessment is a significant variable in terms of impact on employment chances, which is presented in Table 3. it shows the types of activities that have the highest coefficients for explaining chances.
Explanation of the variables involved in the model
Variable Explanation
sex1 0.91337442
age 23.78830335 education2 0.01541513
education3 0.09152532
education4 0.63241613
education5 0.99882360
education6 1.49482615
education7 1.52999182
education8 1.67529952
education9 1.84040567
education10 1.39760140
education11 2.50085782
education12 2.28492592
education13 2.19260917
NACEe2 34.66940075
NACEe3 16.41622838
NACEe4 55.51984842
NACEe5 60.16039524
NACEe6 51.25977826
NACEe7 48.81977924
NACEe8 58.36455053
NACEe9 43.85676970 Table 3
According to the model, the chances of employment are the highest for people in education, state governance and defence sector and for persons working in compulsory social security; in Table 3, this variable is an important variable to include in the model.
According to the chances of employment, a group of administrative and support services and art, entertainment and recreation; households as employers’ activities; production of non-differentiated goods and services for households’ own consumption; and other types of service groups take second place.
In terms of employment chances, the industry field in in third place.
The logistics model of employment
Call: glm(formula = Class ~ sex + age + education + NACEe, family = binomial(link = “logit”), data = dat, maxit = 50) Deviance Residuals: Min 1Q Median 3Q Max -3.0415 -0.3962 -0.2792 0.3441 2.9000
Coefficients: Estimate Std. Error z value Pr(>|z|) (Intercept) -2.12174 0.63152 -3.360 0.00078 *** sex1 0.03687 0.04036 0.913 0.36105 age -0.03283 0.00138 -23.788 < 2e-16 *** education2 -0.01477 0.95808 -0.015 0.98770 education3 -7.22313 78.91950 -0.092 0.92708 education4 0.42253 0.66812 0.632 0.52711 education5 0.63242 0.63317 0.999 0.31788 education6 0.94063 0.62926 1.495 0.13496 education7 0.98621 0.64459 1.530 0.12602 education8 1.06318 0.63462 1.675 0.09388 . education9 1.15939 0.62996 1.840 0.06571 . education10 1.37864 0.98644 1.398 0.16223 education11 1.58381 0.63331 2.501 0.01239 * education12 1.43986 0.63015 2.285 0.02232 * education13 1.72915 0.78863 2.193 0.02834 * NACEe2 3.90222 0.11256 34.669 < 2e-16 *** NACEe3 3.23494 0.19706 16.416 < 2e-16 *** NACEe4 3.68905 0.06645 55.520 < 2e-16 *** NACEe5 2.87392 0.04777 60.160 < 2e-16 *** NACEe6 3.45158 0.06734 51.260 < 2e-16 *** NACEe7 4.90132 0.10040 48.820 < 2e-16 *** NACEe8 5.80594 0.09948 58.365 < 2e-16 *** NACEe9 4.91917 0.11216 43.857 < 2e-16 *** --Signif. codes: 0 ‘***’ 0.001 ‘**’ 0.01 ‘*’ 0.05 ‘.’ 0.1 ‘ ’ 1 (Dispersion parameter for binomial family taken to be 1) Null deviance: 44739 on 33442 degrees of freedom Residual deviance: 20307 on 33420 degrees of freedom (2 observations deleted due to missingness) AIC: 20353 Table 4
As we see, the results taken from the extended base and from the large base are in sync with each other. In this case, the gender variable has a small positive meaning, which means that men have a few more chances o employment as in the previous case, but we see that on the increased size of the selection the variable has lost the statistical significance. The age variable, on the contrary, became statistically significant, and gained the negative sign unlike the previous case, which is very natural, as in the extended base. While the distribution of the age variables of the young categories prevailed and the age increase for them, of course, increases the employment chances, in this case, the older people prevail among the interviewed persons, and the age increase for them decreases the employment chances naturally, noting that the ratio of the coefficient is reasonably small.
As in the previous case, the education variables are not statistically very important. But good and natural conclusions are developed based on the high levels of education. A Doctoral degree increases the chances of employment by 1.73, a Master’s degree – by 1.44 and a Bachelor’s degree – by 1.58, which is higher than the Master’s. This is an interesting and logical fact, since the undergraduates of the bachelor’s degree have more motivation and are more likely to seek employment in comparison with the master’s programme postgraduates, who have more academic aspirations but less motivation to work in comparison with the Bachelor’s graduates.
Finally, in private, compared to the basic agricultural sector, the chances of employment are the highest in the 8th category of activities (education; state governance and defence; compulsory social protection), with the coefficient of 5.8, followed by 9th category (art, entertainment and recreation; households as employers’ activities, production of non-differentiated goods and services for their own consumption; other types of services) and 7th category (administration and support service activities) with the coefficient size of 4.9, and followed by the 4th category (construction, transportation and warehousing, wholesale and retail trade; repairs of automobiles and motor vehicles) with the coefficient size of 3.6.
CONCLUSIONS
Studies have shown that according to the employment chances model, the age variable is a statistically significant variable. The model as well as the age variable is statistically important. The increase in the age by 1 year reduces the chances of employment offers by 0.035. As for the desire to start
a business in the current unemployment period, for those who want to start their own business, the chances of employment increase by 0.5. A coefficient is statistically important. According to the private model of unemployment durations, increase of unemployment for one year, reduces the chances of employment offers by 0.1. This means that being unemployed for a long time is not recommended to the workforce category, and timely withdrawal from unemployment should be promoted/supported. As the research revealed, the knowledge of Office programs, within the area of the conducted survey, helps individuals to increase their chances of employment. It should be noted what the impact of knowledge of languages is on the chances of employment in the survey area. As it was identified, the German, Russian and Turkish languages are not important variables. Statistically, only the knowledge of the English language is significant. A marital status was a very important variable for the research purposes. The second category (the unmarried) increases the chances of job offering, almost with 100% statistical accuracy, by 0.7. The 3rd (the divorced) and 4th (the widowed) categories, with likely 10% inaccuracy, increase chances by 0.4 and 1.7, respectively. As it turned out, the profession of individuals is the most important variable in terms of impact on employment chances.
In order to increase and popularise employment, it is important to strengthen coordination between government agencies, the state and employers; constantly conduct sociological surveys and develop specific effective employment growth mechanisms based on the analysis of research results.
We think that the employment mechanism should allow the following to be considered: 1. Registration of job seekers; 2. Profiling job seekers; 3. Training of job seekers; 4. Employers’ needs research; 5. Connecting job seekers and employers; 6. Employers promotion and motivation; 7. Increased access to finance;
The employment model created taking into account the structure and peculiarities of unemployment should be adapted to labour market challenges, which will enable the country to overcome the pressure of poverty.
LIST OF REFERENCES
Bodnár, K. Labour supply and employment growth. ECB Economic Bulletin,
Issue 1/2018; https://www.ecb.europa.eu/pub/pdf/other/ebart201801_01. en.pdf. Card, D., Kluve, J. and Weber, A. 2017, ʻWhat works? A meta-analysis of recent active labor market program evaluations’, Journal of the European
Economic Association (2017), 16(3): 894–931. Geoffrey et al. 2016, Geoffrey G. Parker G.G., Van Alstyne W. Marshall,
Choudary P.S. ʻPlatform Revolution, How Networked Markets Are Transforming The Economy – And how to Make Them Work for You’. Norton & Company, 2016. ILO (2018), Job quality in the platform economy, #5, Cluster 3: Technology for social, environmental and economic development. Pritchett, L., Samji S., Hammer J.S. 2013, ʻIt’s all about MeE: Using structured experiential Learning (‘e’) to crawl the design space’, Center for
Global Development working paper 322, (2013). Tavartkiladze, M. 2020, ʻEmployment Challenges in Georgia’, Kyiv National University named after Vadim Hetman. V International Scientific and Practical Conference Proceedings: ʻStrategic Imperatives of Modern
Management’, 2020, pp. 350–354, ISBN 978-966-926-325-1. Yeyati L., Montané E. and Sartorio L. 2019, ʻWhat works for active labor market policies?’, Harvard University Center for International Development faculty, (2019), working paper 358. WEF, Shaping the Future of Digital Economy and New Value Creation https:// www.weforum.org/platforms/shaping-the-future-of-digital-economy-andnew-value-creation, seen 20.02.2020. Werner Eichhorst, W., Marx, P., Wehner, C. 2017, ʻLabor market reforms in Europe: towards more flexicure labor markets?’, Journal for Labour
Market Research volume 51, Article number: 3 (2017). Chronic Poverty and Income Inequality in Georgia: presentation of the final report, Rondeli Foundation https://www.gfsis.org/events/presentations/ view/773 Labour Market Analysis of Georgia. Ministry of Economy and Sustainable
Development of Georgia, 2017. http://www.lmis.gov.ge/Lmis/Lmis.Portal. Structure of unemployment and structural unemployment in Georgia; Friedrich Ebert Stiftung. 2016. http://www.fes-caucasus.org/news-list/e/ structure-of-unemployment-and-structural-unemployment-in-georgia/
Vesperi, W. and Gagnidze, I. 2018 Rethink University system: towards Entrepreneurial University, E-Book of Abstract, Fifth Business Systems Laboratory International Symposium, Cocreating Responsible Futures in the
Digital Age: Exploring new paths towards economic, social and environmental Sustainability, University “Federico II” of Naples, January 22–24, 2018, pp. 210–211. http://bslab-symposium.net/Napoli-2018/BOA-BSLAB-
Symposium-2018.pdf. http://www.geostat.ge http://www.economy.ge https://www.moh.gov.ge https://www.ceicdata.com https://www.ams.at
EMPLOYMENT CHALLENGES AND PROSPECTS FOR LABOR MARKET INTEGRATION (CASE OF GEORGIA)
Abstract
The purpose of the paper is to analyse the labour market, employment challenges and legal framework. The policy of state intervention in the labour market is defined in two directions: active and passive policy. As part of its active policy, the state seeks to implement support measures for those who are unable to find stable employment or transfer to the ranks of employees, to stimulate the labour market in order to increase the level of welfare. And on the part of passive policy, social assistance is mostly provided. The state should pursue an active employment promotion policy that, on the one hand, connects job seekers and businesses, and on the other hand, brings together jobseekers’ qualifications and business requirements in the country, which will significantly increase the number of employees and help businesses improve quality as well as create new jobs.
Assessment of employment opportunities for job seekers was studied with the use of the statistical-econometric methods such as: expert evaluation, descriptive – statistical analysis of variables, logistics models of chances and the so-called “survival” analysis.
Based on the research, conclusions and recommendations are formulated for the implementation of effective employment promotion policies. Among them are the main findings in terms of profiling and training of job seekers.
Keywords: Law of Georgia “On Employment Promotion”, labour market, state employment policy
WYZWANIA ZWIĄZANE Z ZATRUDNIENIEM I MOŻLIWOŚCI INTEGRACJI RYNKU PRACY (PRZYPADEK GRUZJI)
Streszczenie
Celem artykułu jest analiza rynku pracy, wyzwań związanych z zatrudnieniem oraz ram prawnych. Polityka interwencji państwa na rynku pracy definiowana jest w dwóch kierunkach: aktywnej i pasywnej. W ramach aktywnej polityki państwo dąży do wdrażania działań wspierających osoby, które nie są w stanie znaleźć stabilnego zatrudnienia lub awansu w szeregi pracowników, aby stymulować rynek pracy w celu podniesienia poziomu dobrobytu. A w części polityki pasywnej udzielana jest głównie pomoc społeczna. Państwo powinno prowadzić aktywną politykę promocji zatrudnienia, która z jednej strony łączy poszukujących pracy i przedsiębiorców, z drugiej zaś łączy kwalifikacje osób poszukujących pracy i wymagania biznesowe w kraju, co znacząco zwiększy liczbę pracowników i pomoże przedsiębiorcom poprawić jakość jak również tworzyć nowe miejsca pracy.
Ocena możliwości zatrudnienia osób poszukujących pracy była badana metodami statystyczno-ekonometrycznymi takimi jak: ocena ekspercka, analiza opisowo-statystyczna zmiennych, modele logistyczne szans oraz tzw. analiza „przeżycia”.
Na podstawie przeprowadzonych badań formułowane są wnioski i rekomendacje dotyczące wdrażania skutecznych polityk promocji zatrudnienia. Wśród nich znajdują się główne ustalenia dotyczące profilowania i szkolenia osób poszukujących pracy.
Słowa kluczowe: Gruzińskie prawo „O promocji zatrudnienia”, rynek pracy, państwowa polityka zatrudnienia
Cite as:
Tavartkiladze, M., Phirtskhalashvili, A. (2021) ‘Employment Challenges and prospects for Labor Market Integration (Case of Georgia)’. Myśl Ekonomiczna i Polityczna 1(71), 51–76. DOI: 10.26399/meip.1(71).2021.03/m.tavartkiladze/a.phirtskhalashvili
Cytuj jako:
Tavartkiladze M., Phirtskhalashvili A., Wyzwania związane z zatrudnieniem i możliwości integracji rynku pracy (przypadek Gruzji), „Myśl Ekonomiczna i Polityczna” 2021 nr 1(71), s. 51–76. DOI: 10.26399/meip.1(71).2021.03/m.tavartkiladze/a.phirtskhalashvili


