5B
USA TODAY - L awrence J ournal -W orld TUESDAY, AUGUST 2, 2016
AMERICA’S MARKETS What to watch Matt Krantz @mattkrantz USA TODAY
The market’s impressive 19% gain from its February bottom is about to get its ultimate test: The calendar. Stocks are entering the part of the year that infamously proves to be one of the most difficult. August and September have been the two worst months of the year in terms of stock market performance since World War II, says Sam Stovall, U.S. equity strategist at S&P Global Market Intelligence. If that’s not disappointing enough, a third of the monthly declines of 5% or more occurred in August and September. Reasons to worry about these months go even further. The second- and third-worst single-
Facts about America’s investors who use SigFig tracking services:
month drops also happened during these two months. Stocks suffered a 14.6% decline in August 1998, which was the secondworst showing for a month after October, Stovall says. There are many possible explanations for why these months are so poor, ranging from investors going on vacations to scrutiny of secondhalf earnings forecasts, a falloff in capital inflows and portfolio positioning by mutual funds at the end of their fiscal year. Investors should know stocks struggle in August and September, and be mentally prepared for volatility, but that doesn’t mean they should bail. Defensive sectors such as consumer staples, health care and utilities all posted positive stock gains during the third quarter. Stocks, too, eventually bounced back with the S&P 500 rising an average 5% in the fourth quarter.
DOW JONES
Gilead Sciences (GILD) was the most-bought stock among moderate and very active SigFig traders in mid-July.
-27.73
-2.76
INDUSTRIAL AVERAGE
CHANGE: -.2% YTD: +979.48 YTD % CHG: +5.6%
COMP
+22.07 CHANGE: +.4% YTD: +176.78 YTD % CHG: +3.5%
CLOSE: 18,404.51 PREV. CLOSE: 18,432.24 RANGE: 18,355.75-18,467.03
NASDAQ
-.81
CLOSE: 5,184.20 PREV. CLOSE: 5,162.13 RANGE: 5,158.93-5,199.13
CLOSE: 2,170.84 PREV. CLOSE: 2,173.60 RANGE: 2,166.21-2,178.29
RUSSELL 2000 INDEX
CHANGE: -.1% YTD: +83.24 YTD % CHG: +7.3%
CLOSE: 1,219.13 PREV. CLOSE: 1,219.94 RANGE: 1,214.63-1,224.46
S&P 500’S BIGGEST GAINERS/LOSERS GAINERS
Company (ticker symbol)
$ Chg
YTD % Chg % Chg
Biogen (BIIB) Nusinersen hits goal in late-stage trial.
301.83 +11.90
+4.1
-1.5
Alexion Pharmaceuticals (ALXN) Positive note, keeps buy rating.
133.50 +4.90
+3.8
-30.0 -17.5
Netflix (NFLX) Shrugs off rating downgrade and climbs.
+3.12
+3.4
Newell Rubbermaid (NWL) 53.97 Shares jump after after second-quarter earnings beat.
+1.51
+2.9 +22.4
170.65 +4.30
+2.6
-11.1
Garmin (GRMN) Rises as it eyes wearables.
55.75
Michael Kors Holdings (KORS) Positive note, shares climb early.
52.90
+1.18
+2.3
+32.1
Celgene (CELG) Overcomes early dip on whistleblower lawsuit.
114.69 +2.50
+2.2
-4.2
434.00 +8.88
+2.1
-20.1
+2.1
+41.1
Regeneron Pharmaceuticals (REGN) Rises as EMA accepts sarilumab review. Digital Realty Trust (DLR) Makes up on loss on rating downgrade. Company (ticker symbol)
5-day avg.: 6-month avg.: Largest holding: Most bought: Most sold:
-0.28 4.66 GE AAPL AAPL
+1.42
AGGRESSIVE 71% or more in equities
5-day avg.: 6 month avg.: Largest holding: Most bought: Most sold:
5-day avg.: 6-month avg.: Largest holding: Most bought: Most sold:
0.02 10.17 GE AAPL AAPL
+2.22
0.09 11.66 GE AAPL AAPL
POWERED BY SIGFIG
4-WEEK TREND
Shares of the online advertising company that controls the Google $1,000 Price: $800.94 search engine continued their ralChg: $9.60 ly, closing in on a high. Investors % chg: 1.2% Day’s high/low: are still celebrating the company’s $600 July 1 $807.49/$785.04 quarterly profit upside surprise.
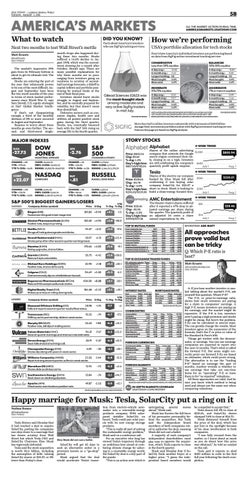
Tesla
Shares of the electric car company backed by Elon Musk fell after confirming it was buying solar company SolarCity for $25.37 a share in stock. Musk is looking to build a clean-energy focused firm.
Price: $230.01 Chg: -$4.78 % chg: -2.0% Day’s high/low: $236.63/$229.38
AMC Entertainment
The theater chain’s shares suffered after it reported a 47% drop in adjusted earnings per share during the quarter. The quarterly profit of an adjusted 24 cents a share missed expectations by 4%.
Price: $28.46 Chg: -$0.96 % chg: -3.3% Day’s high/low: $29.05/$27.36 Fund, ranked by size Vanguard 500Adml Vanguard TotStIAdm Vanguard InstIdxI Vanguard TotStIdx Vanguard InstPlus Vanguard TotIntl Fidelity Contra American Funds IncAmerA m American Funds GrthAmA m American Funds CapIncBuA m
NAV 200.54 54.16 198.59 54.13 198.60 14.85 101.47 21.66 43.20 59.68
YTD % Chg % Chg
Price
$ Chg
Diamond Offshore Drilling (DO) 20.98 Falls as it reports second-quarter results/fleet status.
-1.74
-7.7
-.6
ETF, ranked by volume Ticker SPDR S&P500 ETF Tr SPY Barc iPath Vix ST VXX iShs Emerg Mkts EEM VanE Vect Gld Miners GDX CS VS 2x Vix ShTm TVIX US Oil Fund LP USO SPDR Financial XLF CS VS InvVix STerm XIV SPDR Energy XLE iShares Rus 2000 IWM
Close 216.94 10.02 36.14 30.93 1.09 9.41 23.59 34.24 65.16 121.17
4wk 1 +3.3% +3.6% +3.3% +3.5% +3.3% +3.6% +4.2% +1.8% +3.8% +1.2%
YTD 1 +7.5% +7.6% +7.5% +7.5% +7.5% +4.0% +3.3% +8.8% +4.6% +8.7%
Chg. -0.18 -0.16 -0.07 +0.34 -0.02 -0.35 -0.06 +0.55 -2.22 +0.10
% Chg %YTD -0.1% +6.4% -1.6% -50.1% -0.2% +12.3% +1.1% +125.4% -1.8% -82.6% -3.6% -14.5% -0.3% -1.0% +1.6% +32.7% -3.3% +8.0% +0.1% +7.6%
INTEREST RATES
MORTGAGE RATES
Type Prime lending Federal funds 3 mo. T-bill 5 yr. T-note 10 yr. T-note
Type 30 yr. fixed 15 yr. fixed 1 yr. ARM 5/1 ARM
Close 6 mo ago 3.50% 3.50% 0.40% 0.29% 0.27% 0.34% 1.05% 1.37% 1.52% 1.95%
Close 6 mo ago 3.38% 3.76% 2.66% 2.83% 2.82% 2.72% 2.87% 3.10%
SOURCE: BANKRATE.COM
COMMODITIES
Transocean (RIG) Will buy out its partnership, slides in weak sector.
10.25
-.74
-6.7
-17.2
Murphy Oil (MUR) Positive note, still dips in trailing sector.
25.63
-1.80
-6.6
+14.2
Vulcan Materials (VMC) 116.31 Second-quarter earnings and revenue miss estimates.
-7.67
-6.2 +22.5
Devon Energy (DVN) Stock falls ahead of earnings call.
35.91
-2.37
-6.2
+12.2
Chesapeake Energy (CHK) Shares dip along with peers in weak sector.
5.09
-.33
-6.1
+13.1
Williams Companies (WMB) 22.53 Reports strong second quarter, suffers in weak sector.
-1.44
-6.0
-12.3
Marathon Oil (MRO) Shares slide as oil does same.
12.92
-.72
-5.3
+2.6
Southwestern Energy (SWN) Stock down on declining oil prices.
13.84
-.74
-5.1
+94.7
Apache (APA) Weak sector overshadows positive note.
49.87
-2.63
-5.0
+12.1
SOURCE: BLOOMBERG AND THE ASSOCIATED PRESS
Commodities Close Prev. Cattle (lb.) 1.16 1.13 Corn (bushel) 3.26 3.35 Gold (troy oz.) 1,351.40 1,349.00 Hogs, lean (lb.) .69 .69 Natural Gas (Btu.) 2.77 2.88 Oil, heating (gal.) 1.26 1.28 Oil, lt. swt. crude (bar.) 40.06 41.60 Silver (troy oz.) 20.47 20.31 Soybeans (bushel) 9.96 10.33 Wheat (bushel) 4.06 4.08
Chg. +0.03 -0.09 +2.40 unch. -0.11 -0.02 -1.54 +0.16 -0.37 -0.02
% Chg. +2.5% -2.6% +0.2% unch. -3.7% -3.9% -3.7% +0.8% -3.5% -0.4%
% YTD -14.6% -9.2% +27.5% +14.8% +18.6% +14.3% +8.2% +48.6% +14.3% -13.6%
FOREIGN CURRENCIES Currency per dollar British pound Canadian dollar Chinese yuan Euro Japanese yen Mexican peso
Close .7581 1.3101 6.6428 .8953 102.35 18.8448
Prev. .7553 1.3043 6.6353 .8945 102.03 18.7650
6 mo. ago .6924 1.3935 6.5901 .9179 121.12 18.2447
Yr. ago .6402 1.3085 6.2099 .9115 123.95 16.1344
FOREIGN MARKETS Country Frankfurt Hong Kong Japan (Nikkei) London Mexico City
Close 10,330.52 22,129.14 16,635.77 6,693.95 46,807.24
Aug. 1
$250
$230.01
$200
July 1
Aug. 1
4-WEEK TREND $35
$28.46
$25
July 1
Aug. 1
INVESTING ASK MATT Chg. -0.25 -0.07 -0.25 -0.08 -0.26 -0.06 +0.09 -0.04 -0.01 -0.17
1 – CAPITAL GAINS AND DIVIDENDS REINVESTED
+2.6 +50.0
$800.94
4-WEEK TREND
TOP 10 EXCHANGE TRADED FUNDS
106.68
-0.04 8.88 GE AAPL AAPL
MODERATE 51%-70% equities
TOP 10 MUTUAL FUNDS 94.37
Illumina (ILMN) Rating upgrades, shares follow.
LOSERS
Price
5-day avg.: 6-month avg.: Largest holding: Most bought: Most sold:
STORY STOCKS Alphabet
RUSSELL
RUT
COMPOSITE
BALANCED 30%-50% equities
More than half a million investors nationwide with total assets of $200 billion manage their investment portfolios online with SigFig investment tracking service. Data on this page are based on SigFig analysis.
STANDARD & POOR'S
CHANGE: -.1% YTD: +126.90 YTD % CHG: +6.2%
CONSERVATIVE Less than 30% equities
NOTE: INFORMATION PROVIDED BY SIGFIG IS STATISTICAL IN NATURE AND DOES NOT CONSTITUTE A RECOMMENDATION OF ANY STRATEGY OR SECURITY. VISIT SIGFIG.USATODAY.COM/DISCLOSE FOR ADDITIONAL DISCLOSURES AND INFORMATION.
POWERED BY SIGFIG
S&P 500
SPX
USA’s portfolio allocation for tech stocks Here’s how America’s individual investors are performing based on data from SigFig online investment tracking service:
MAJOR INDEXES DJIA
How we’re performing
DID YOU KNOW?
Next two months to test Wall Street’s mettle
ALL THE MARKET ACTION IN REAL TIME. AMERICASMARKETS.USATODAY.COM
Prev. Change 10,337.50 -6.98 21,891.37 +237.77 16,569.27 +66.50 6,724.43 -30.48 46,660.67 +146.57
%Chg. -0.1% +1.1% +0.4% -0.5% +0.3%
YTD % -3.8% +1.0% -12.6% +7.2% +8.9%
SOURCES: MORNINGSTAR, DOW JONES INDEXES, THE ASSOCIATED PRESS
IN-DEPTH MARKETS COVERAGE USATODAY.COM/MONEY
All approaches prove valid but can be tricky Q: Which P-E ratio is best? Matt Krantz
mkrantz@usatoday.com USA TODAY
A: If you hear another investor or analyst talking about the market’s P-E, ask yourself this question. Which P-E? The P-E, or price-to-earnings ratio, shows how much investors are paying for a claim to companies’ earnings. A high P-E means investors are paying up for earnings, and the market might be expensive. If the P-E is low, investors aren’t paying a high premium and stocks might be cheap. But here’s the problem, P-Es can be calculated in several ways. The can greatly change the results. Most investors agree on the numerator of the formula, that’s the P or price or value of the Standard & Poor’s 500. Things get trickier with the denominator, or earnings. You can use earnings companies are expected to report over the next 12 months. That’s what is called the forward P-E. But some might correctly point out forward P-Es are based on estimates, which could prove wrong. The alternative is to use the “trailing P-E” based on earnings the past 12 months. Another wrinkle is whether to use earnings that take out one-time items for an “operating” P-E or leave them in for “as reported” valuations. All these approaches are valid. Just be sure you know which method is being used and always use the same one when comparing valuations.
Happy marriage for Musk: Tesla, SolarCity put a ring on it Nathan Bomey @NathanBomey USA TODAY
Tesla Motors said Monday that it had reached a deal to acquire SolarCity, putting the companies one step closer to a marriage that has drawn scrutiny from Wall Street but which Tesla CEO and SolarCity Chairman Elon Musk has vigorously defended. Tesla said the stock acquisition is worth $2.6 billion, including the assumption of debt, valuing SolarCity shares at $25.37, or 5% lower than Friday’s close.
TESLA MOTORS
Elon Musk did not cast a ballot.
SolarCity will get 45 days to seek an alternative suitor in a provision known as a “go-shop” period. Musk argued that the deal would accelerate Tesla’s transi-
tion from electric-vehicle automaker into a renewable-energy products company. With solarpanel installer SolarCity on board, Tesla could pair solar panels with its new energy storage products. “This is really all part of solving the sustainable energy problem,” Musk said on a conference call. For an executive who long has viewed Tesla’s trajectory through an ambitious lens aimed at combating climate change by ushering in a renewable energy world, the SolarCity deal is a key part of the puzzle. “This is an action now which is
anticipating several moves ahead,” Musk said. Musk has thrown the full force of his persuasive personality behind the acquisition. But Tesla said the independent board members of both companies voted to authorize the deal, meaning Musk did not cast a ballot. A majority of each company’s independent shareholders must also vote to approve the acquisition, which Tesla expects to close in the fourth quarter. Musk said Monday that if SolarCity finds another buyer at a higher price, “I guess the independent board members would
be compelled to accept that.” Tesla shares fell 2% to close at $231.01, and SolarCity shares slumped 7.4% to close at $24.72. Musk distanced himself from the price of the deal, which has put him in the spotlight because of his close involvement in both companies. “I was fully recused from the matter, so I know about as much as you do about how this price was obtained,” he told an analyst on the call. Tesla said it expects to shed $150 million in costs in the first full year following the deal’s completion.