That's the question you should be asking yourself.
Our market is incredibly diverse and rapidly changing. Values vary not just by neighborhood but by street. Your home isn't necessarily worth what your neighbors' home is. It's the current market that sets the value of your home.
So, do you know what your home is worth in today's market?
Icanhelp...
Contact me for a confidential, no obligation assessment of your home's value.
MoreBuyersAreMakingMoves IsItTimeToSell?
More people are taking steps to buy a home. And, if you’ve been waiting for the right time to move, this may be the sign you’ve been looking for.
For the past few years, a lot of would-be homebuyers hit pause on their plans. With rising mortgage rates and affordability challenges, buying just didn’t seem doable. But now, more of them are getting back out there. That’s because they’re getting used to the fact that this may be the new normal for the market – especially as forecasts show mortgage rates may be starting to stabilize.
Smart Strategies for a Mortgage Application
Avoid paying off debts or collections without professional advice.
Don't have your credit report pulled too many times - this can hurt your credit score. 3 4 5 6 1 2
Always consult your mortgage professional before making large financial moves. Use verified funds for deposits to prevent closing delays.
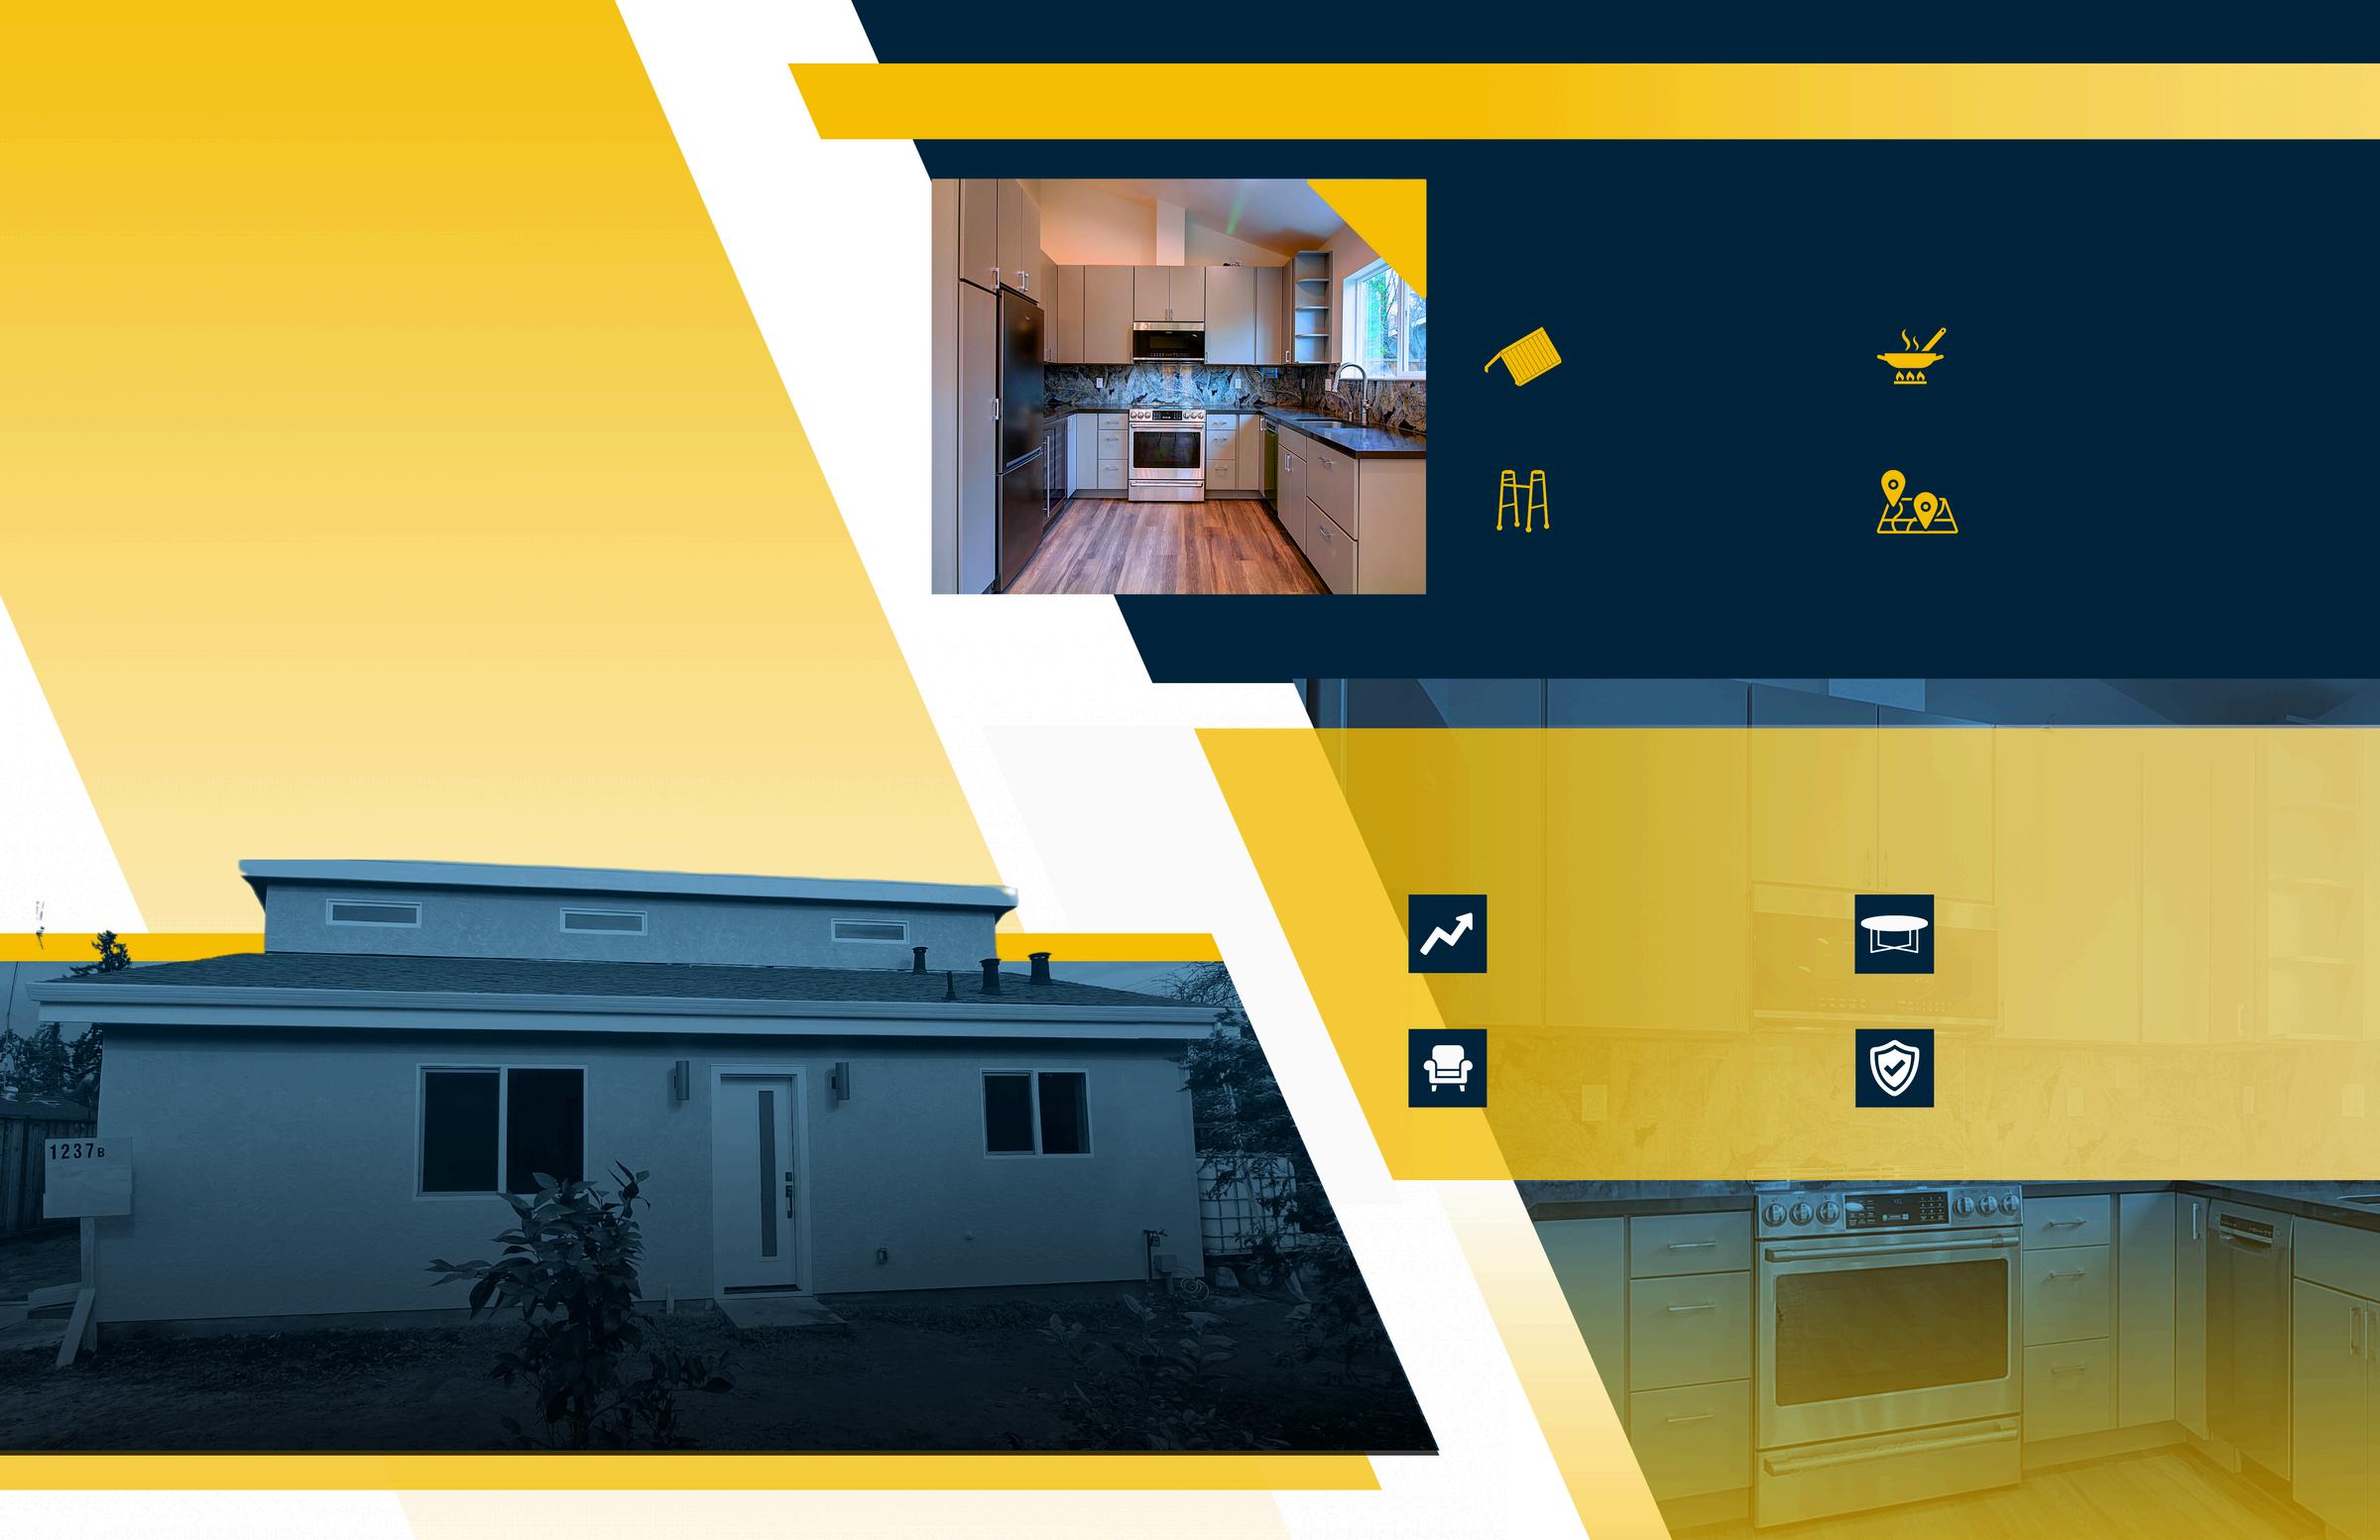
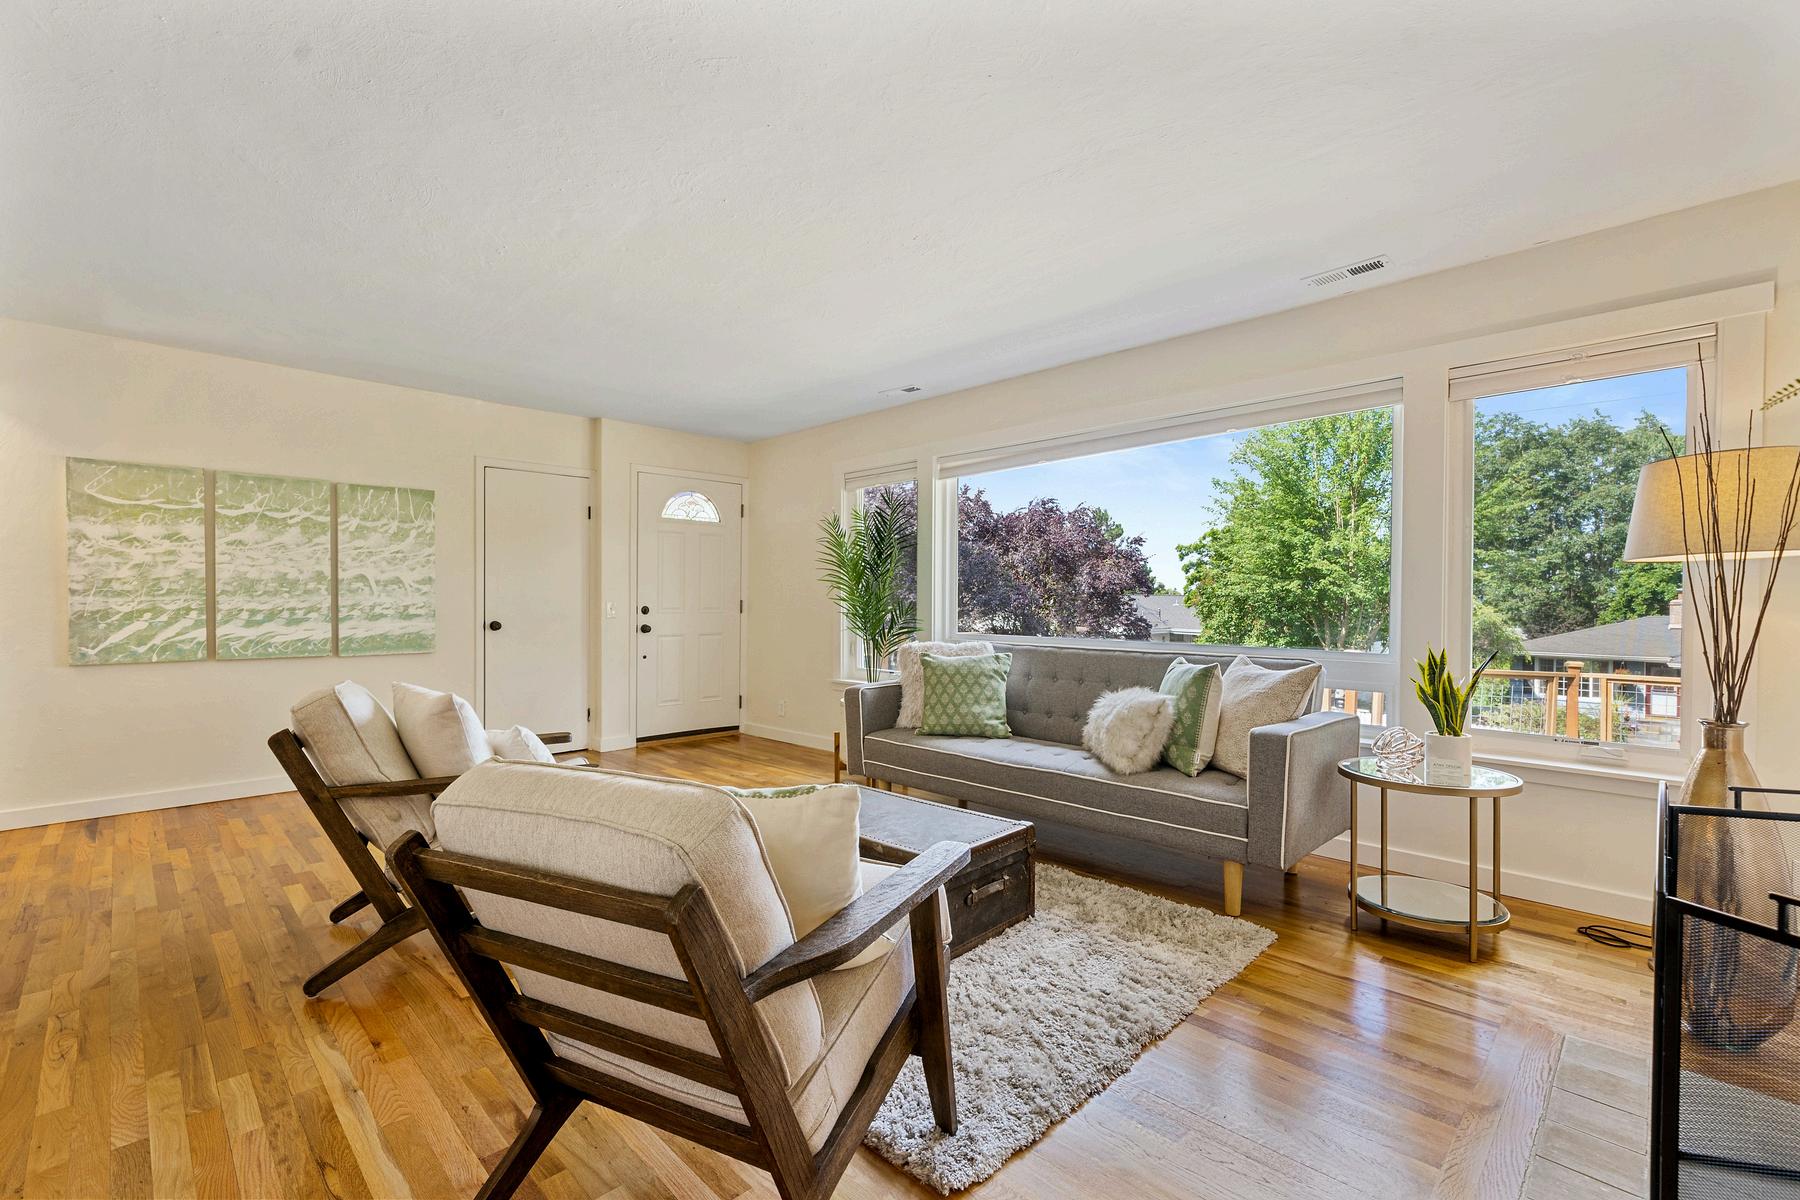
HomeRenovationsThatCanMakea BIG IMPACT AccordingtoExperts
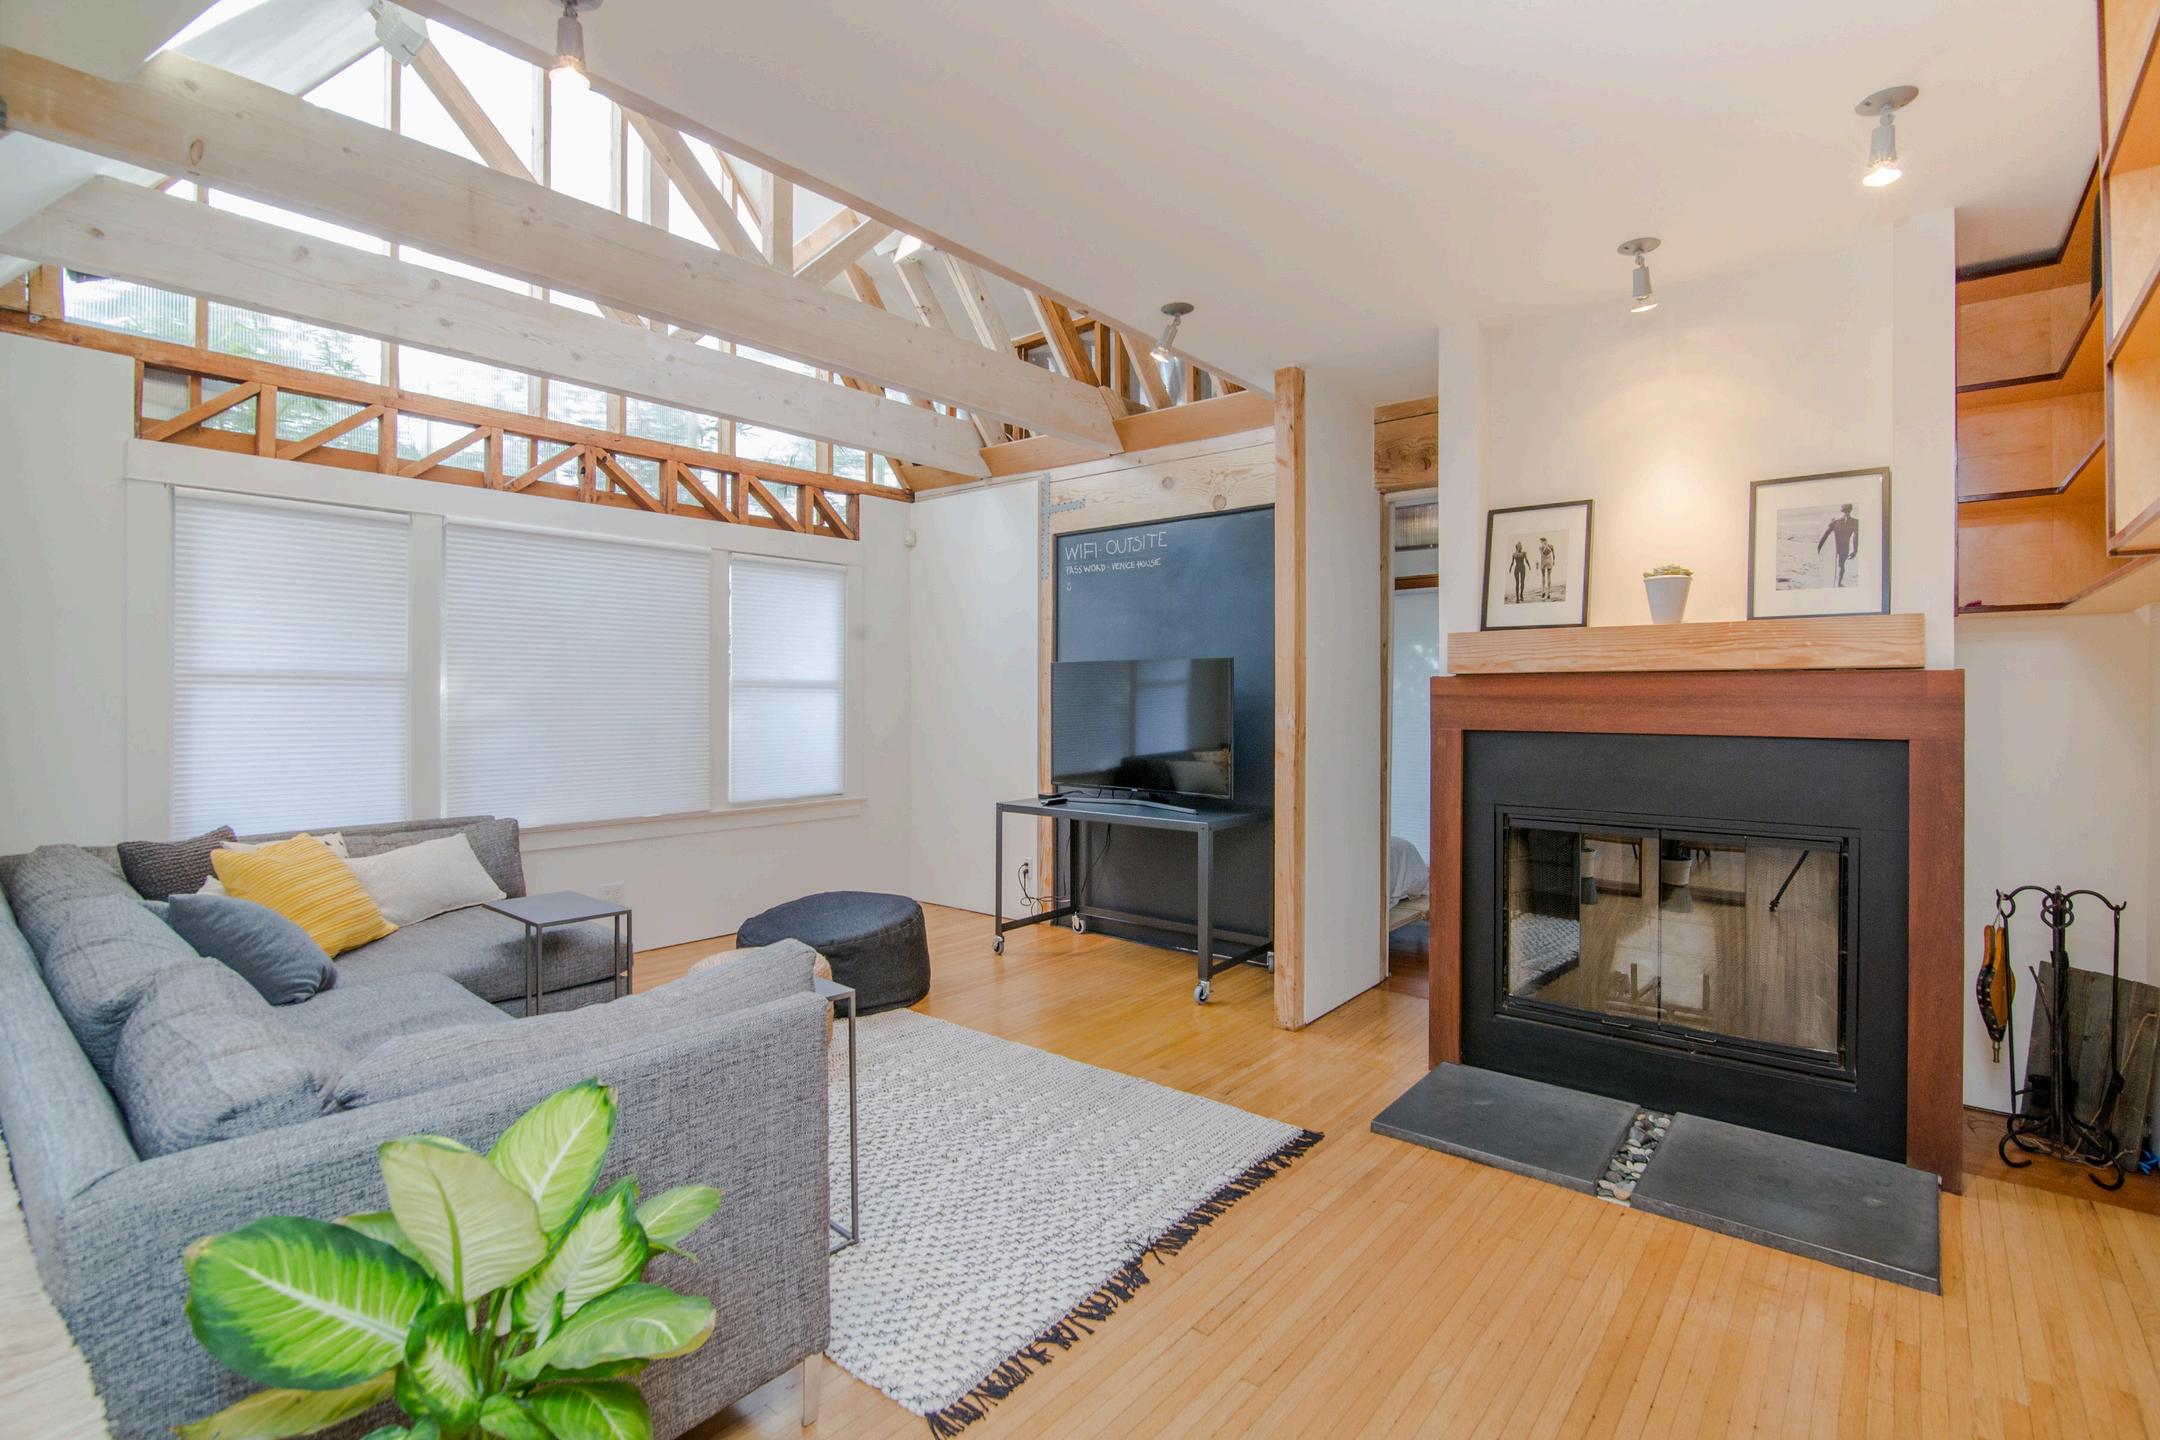
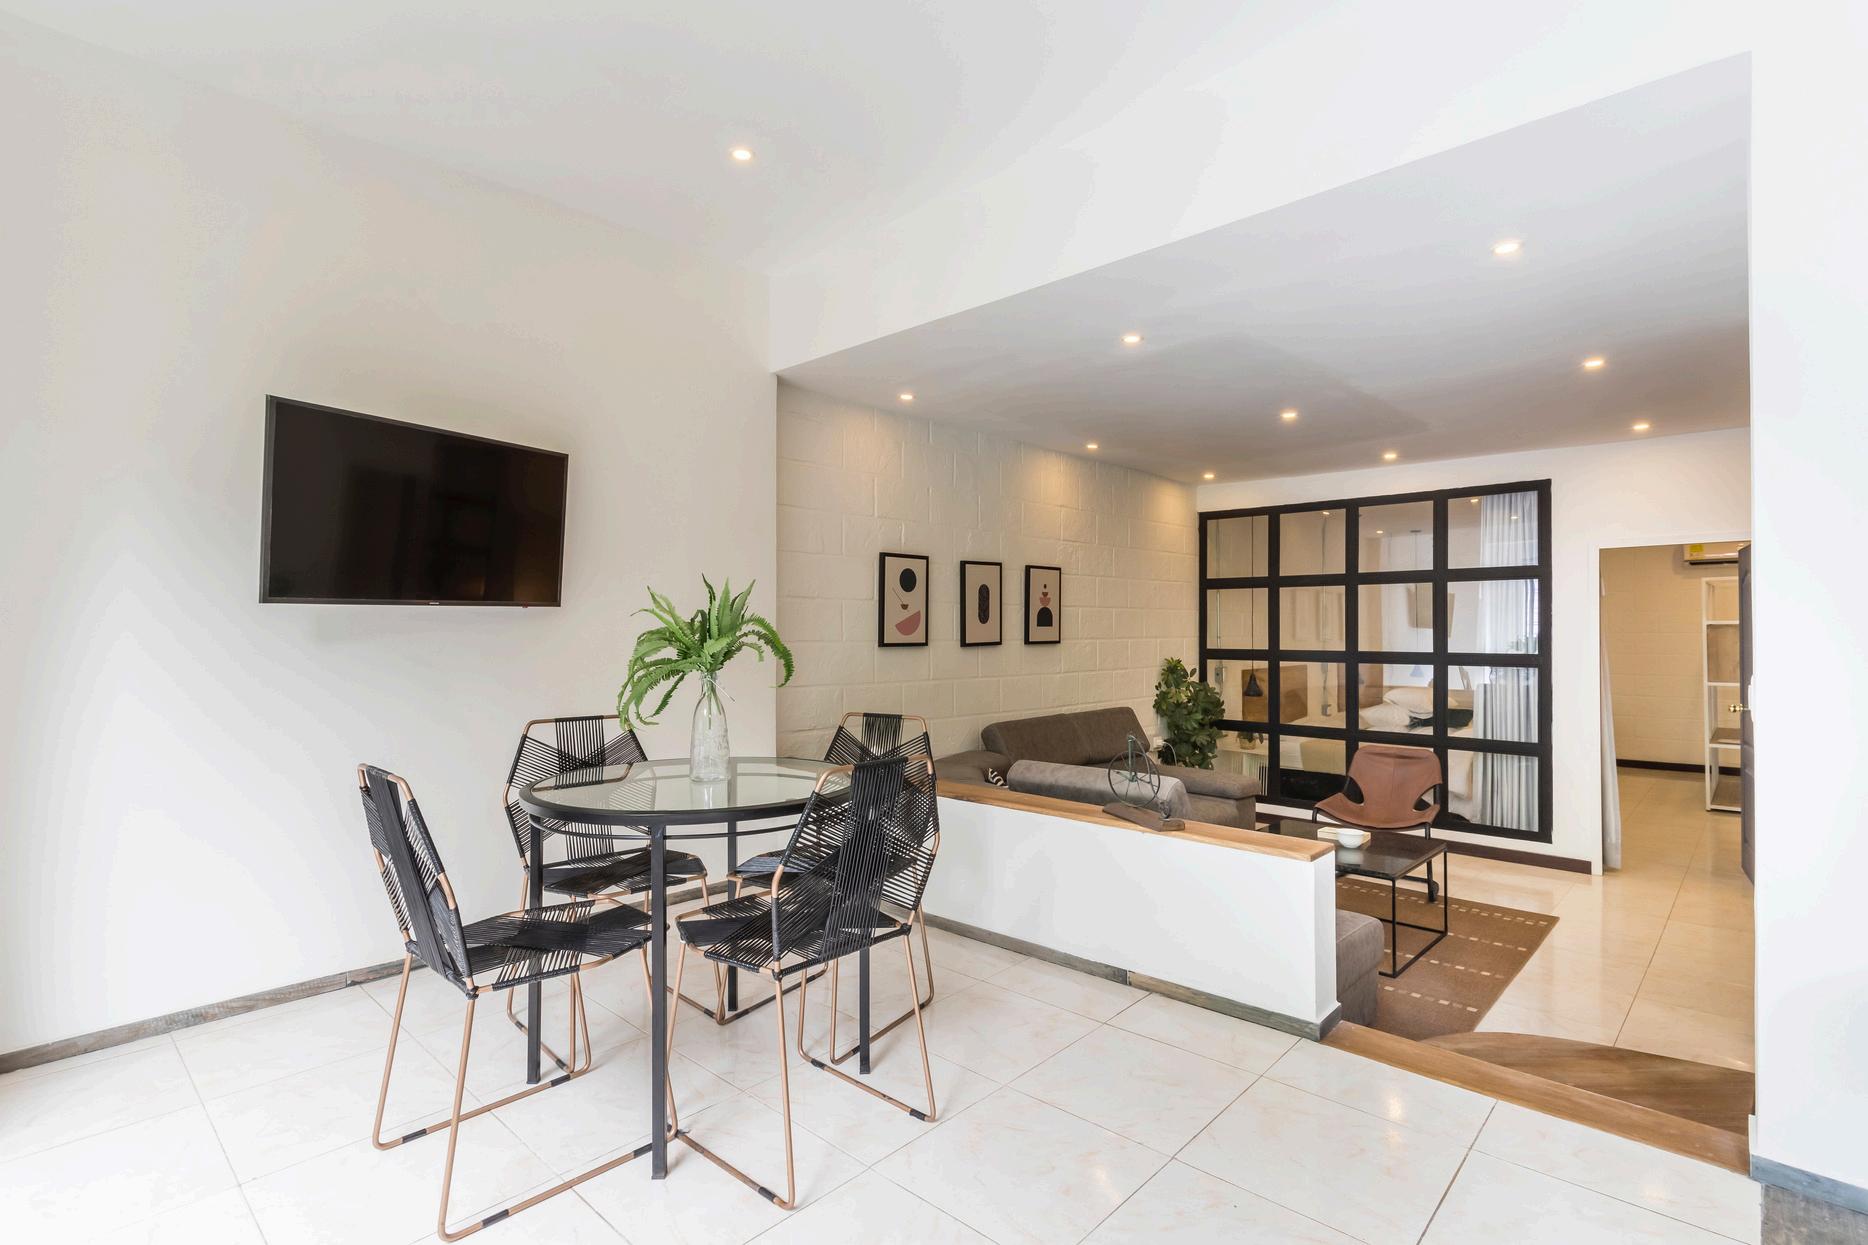
Enhancing Property Value and Family Living Space with an Acton ADU
The Anenberg-Essert family in Campbell collaborated with Acton ADU to create a versatile, comfortable, and valuable addition to their property. This ADU project is a shining example of how a well-designed accessory dwelling unit can increase property value and serve a family’s unique needs.
GoalsandVision
The family envisioned an ADU that would function as an independent living space for family members, enhance their property’s worth, and provide seamless integration with the main home They wanted a space that balanced privacy with connectivity, feeling like a natural extension of their residence
Design and Construction Details
Constructed at 747 square feet, this ADU was designed with modern, high-quality finishes to serve both aesthetic and practical needs. Key features include:
Vaulted Ceilings
Creates a spacious, open atmosphere
Senior-Friendly Living
Safe, independent space for elderly family members
Fully Equipped Kitchen
Modern amenities for everyday convenience
Open Living Area
Multipurpose area for relaxation and entertainment
Results and Impact
The completion of the Anenberg-Essert ADU led to several valuable outcomes:
Increased Property Value
The ADU addition significantly boosted property value
Flexible Living Space
A versatile space for family, guests, or as a rental
Modern Comforts
High-end finishes and amenities enhance both function and style.
Enhanced Family Living
The ADU enriches the AnenbergEssert family’s home with both privacy and connection
VENDOR DIRECTORY
When it comes to home ownership, knowing who you can trust is crucial. That's why we've curated a select list of trusted vendors who are ready to help with your home goals.
Alameda
What's in the Alameda data?
There were 1,675 single-family homes for sale, providing 1.5 months of inventory. There were 893 new listings, and 456 homes sold at a median price of $1.3m. The median overbid percentage was at 107.4%, with an average of 18 days on the market.
There were 894 condo and townhome units for sale, providing 2 8 months of inventory There were 372 new listings and 147 units sold at a median sale price of $700k. The median overbid percentage was at 100.6%, with an average of 34 days on the market.
Single-Family Homes
893 New Listings
456 Sold Listings
1.5 Months of Inventory
$1.3M Median Sale Price
107.4%
Median Sale vs List
18 Avg Days on Market
The data, sourced from InfoSparks, includes all single-family homes, condos and townhomes in the California Area above from February 2024 to February 2025. This may include preliminary data, and may vary from the time the data was gathered. All data is deemed reliable but not guaranteed. DRE# 01995149. Copyright KW Advisors San Francisco | Napa Valley 2025. Each office is independently owned and operated.
AlamedaCounty
FEBRUARY 2024 - FEBRUARY 2025
le-Family Homes
12 months, year-over-year.
dos & Townhomes
12 months, year-over-year
Median SalesPrice
Single-Family Homes
The median sale price has remained the same from $1 3m last February 2024, to $1 3m as of February 2025
Condos & Townhomes
The median sale price has decreased from $743k last February 2024, to $700k as of February 2025
AVGDays OntheMarket
Single-Family Homes
The average time spent on the market went down from 19 days last February 2024, to 18 days as of February 2025
Condos & Townhomes
The average time spent on the market went up from 20 days in February 2024, to 34 days as of February 2025.
Overbids
Single-Family Homes
The overbid percentage has increased from 106 4% last February 2024, to 107 4% a year later
Condos & Townhomes
The overbid percentage has decreased from 101% last February 2024, to 100.6% a year later.
Contra Costa
What's in the Contra Costa data?
There were 1,093 single-family homes for sale, providing 1.7 months of inventory. There were 870 new listings, and 440 homes sold at a median price of $839k. The median overbid percentage was at 100 5%, with an average of 28 days on the market.
There were 426 condo and townhome units for sale, providing 2.4 months of inventory. There were 239 new listings and 112 units sold at a median sale price of $534k. The median overbid percentage was at 100%, with an average of 42 days on the market
Single-Family Homes
870 New Listings
440 Sold Listings
1.7 Months of Inventory
$839K Median Sale Price
100.5%
Median Sale vs List
28 Avg Days on Market
The data, sourced from InfoSparks, includes all single-family homes, condos and townhomes in the California Area above from February 2024 to February 2025. This may include preliminary data, and may vary from the time the data was gathered. All data is deemed reliable but not guaranteed. DRE# 01995149. Copyright KW Advisors San Francisco | Napa Valley 2025. Each office is independently owned and operated.
239 New Listings
112 Sold Listings
2.4
Months of Inventory
$534K
Median Sale Price 100%
Median Sale vs List 42 Avg Days on Market
FEBRUARY 2024 - FEBRUARY 2025
Median SalesPrice
Single-Family Homes
The median sale price has increased from $839k last February 2024, to $839 5k as of February 2025
Condos & Townhomes
The median sale price has decreased from $555k last February 2024, to $534k as of February 2025
AVGDays OntheMarket
Single-Family Homes
The average time spent on the market remained the same from 28 days last February 2024, to 28 days as of February 2025
Condos & Townhomes
The average time spent on the market went up from 37 days in February 2024, to 42 days as of February 2025.
Overbids
Single-Family Homes
The overbid percentage has decreased from 100 7% last February 2024, to 100 5% a year later
Condos & Townhomes
The overbid percentage has remained the same from 100% last February 2024, to 100% a year later.
Napa County
What's in the Napa data?
There were 292 single-family providing 4.1 months of inve new listings, and 48 homes s of $1m. The median overbid 98 1%, with an average of 10
There were 38 condo and tow sale, providing 3.8 months of were 12 new listings and 6 u sale price of $1.4m. The med percentage was at 103.2%, w days on the market.
81 New Listings
4.1 Months of Inventory
98.1%
Median Sale vs List
48 Sold Listings
$1M Median Sale Price
104 Avg Days on Market
homes, condos and February 2025. This may was gathered. All data is Copyright KW Advisors San Francisco | Napa Valley 2025. Each office is independently owned and operated.
Condo
& Townhomes
12
New Listings
6
Sold Listings
3.8
Months of Inventory
$1.4M
Median Sale Price
103.2%
Median Sale vs List
82 Avg Days on Market
apaCounty
FEBRUARY 2024 - FEBRUARY 2025
TINGS FOR SALE SOLD LISTINGS
Family Homes
months, year-over-year. & Townhomes
months, year-over-year
Median SalesPrice
Single-Family Homes
The median sale price has increased from $875k last February 2024, to $1m as of February 2025
Condos & Townhomes
The median sale price has increased from $534k last February 2024, to $1 4m as of February 2025
AVGDays OntheMarket
Single-Family Homes
The average time spent on the market went up from 73 days last February 2024, to 104 days as of February 2025
Condos & Townhomes
The average time spent on the market went up from 49 days in February 2024, to 82 days as of February 2025.
Overbids
Single-Family Homes
The overbid percentage has decreased from 99 1% last February 2024, to 98 1% a year later
Condos & Townhomes
The overbid percentage has increased from 100% last February 2024, to 103.2% a year later.
San Francisco County
What's in the San Francisco County data?
There were 220 single-family homes for sale, providing 1.2 months of inventory. There were 207 new listings, and 131 homes sold at a median price of $1.6m. The median overbid percentage was at 110.3%, with an average of 26 days on the market.
There were 574 condo and townhome units for sale, providing 3.2 months of inventory. There were 314 new listings and 148 units sold at a median sale price of $1m. The median overbid percentage was at 100%, with an average of 55 days on the market.
Single-Family Homes
207 New Listings
131 Sold Listings
1.2 Months of Inventory
$1.6M Median Sale Price
110.3%
Median Sale vs List
26 Avg Days on Market
The data, sourced from InfoSparks, includes all single-family homes, condos and townhomes in the California Area above from February 2024 to February 2025. This may include preliminary data, and may vary from the time the data was gathered. All data is deemed reliable but not guaranteed. DRE# 01995149. Copyright KW Advisors San Francisco | Napa Valley 2025. Each office is independently owned and operated.
314 New Listings
148 Sold Listings
3.2
Months of Inventory $1M Median Sale Price 100%
Median Sale vs List 55 Avg Days on Market
SanFranciscoCounty
FEBRUARY 2024 - FEBRUARY 2025
LISTINGS FOR SALE SOLD LISTINGS
Single-Family Homes
Last 12 months, year-over-year.
Condos & Townhomes
Last 12 months, year-over-year
Median SalesPrice
Single-Family Homes
The median sale price has increased from $1 5m last February 2024, to $1 6m as of February 2025
Condos & Townhomes
The median sale price has decreased from $1 2m last February 2024, to $1m as of February 2025
AVGDays OntheMarket
Single-Family Homes
The average time spent on the market went down from 35 days last February 2024, to 26 days as of February 2025
Condos & Townhomes
The average time spent on the market went up from 49 days in February 2024, to 55 days as of February 2025.
Overbids
Single-Family Homes
The overbid percentage has increased from 103 2% last February 2024, to 110 3% a year later
Condos & Townhomes
The overbid percentage has remained the same from 100% last February 2024, to 100% a year later.
SanMateo County
What's in the San Mateo County data?
There were 356 single-family homes for sale, providing 1.2 months of inventory. There were 373 new listings, and 195 homes sold at a median price of $2.1m. The median overbid percentage was at 104 3%, with an average of 22 days on the market.
There were 237 condo and townhome units for sale, providing 2.5 months of inventory. There were 171 new listings and 60 units sold at a median sale price of $989k. The median overbid percentage was at 99%, with an average of 40 days on the market
Single-Family Homes
373 New Listings
195 Sold Listings
1.2 Months of Inventory
$2.1M Median Sale Price
104.3%
Median Sale vs List
22 Avg Days on Market
The data, sourced from InfoSparks, includes all single-family homes, condos and townhomes in the California Area above from February 2024 to February 2025. This may include preliminary data, and may vary from the time the data was gathered. All data is deemed reliable but not guaranteed. DRE# 01995149. Copyright KW Advisors San Francisco | Napa Valley 2025. Each office is independently owned and operated.
171
New Listings
60
Sold Listings
2.5
Months of Inventory
$989K
Median Sale Price 99%
Median Sale vs List
40 Avg Days on Market
SanMateoCounty
FEBRUARY 2024 - FEBRUARY 2025
LISTINGS FOR SALE SOLD LISTINGS
Single-Family Homes
Last 12 months, year-over-year.
Condos & Townhomes
Last 12 months, year-over-year
Median SalesPrice
Single-Family Homes
The median sale price has increased from $1 8m last February 2024, to $2 1m as of February 2025
Condos & Townhomes
The median sale price has increased from $910k last February 2024, to $989k as of February 2025
AVGDays OntheMarket
Single-Family Homes
The average time spent on the market went down from 28 days last February 2024, to 22 days as of February 2025
Condos & Townhomes
The average time spent on the market went up from 37 days in February 2024, to 40 days as of February 2025.
Overbids
Single-Family Homes
The overbid percentage has increased from 102 4% last February 2024, to 104 3% a year later
Condos & Townhomes
The overbid percentage has increased from 100% last February 2024, to 100.3% a year later.
Santa Coun
What's in the County data?
There were 686 single providing 1 month of new listings, and 439 price of $1.9m. The m was at 107 1%, with a market.
There were 532 condo sale, providing 1.7 mo were 520 new listings median sale price of $ percentage was at 10 days on the market
913
New Listings
439 Sold Listings
1 Month of Inventory
$1.9M Median Sale Price
107.1%
Median Sale vs List
s single-family homes, condos and 2024 to February 2025. This may the data was gathered. All data is 01995149. Copyright KW Advisors San Francisco | Napa Valley 2025. Each office is independently owned and operated.
16 Avg Days on Market
Condo & Townhomes
520
New Listings
233
Sold Listings
1.7
Months of Inventory
102.4%
Median Sale vs List
$1.1M
Median Sale Price
23
Avg Days on Market
antaClaraCounty
FEBRUARY 2024 - FEBRUARY 2025
TINGS FOR SALE SOLD LISTINGS
Family Homes
2 months, year-over-year.
s & Townhomes
2 months, year-over-year
Median SalesPrice
Single-Family Homes
The median sale price has increased from $1 8m last February 2024, to $1 9m as of February 2025
Condos & Townhomes
The median sale price has increased from $920k last February 2024, to $1 1m as of February 2025
AVGDays OntheMarket
Single-Family Homes
The average time spent on the market went down from 21 days last February 2024, to 16 days as of February 2025
Condos & Townhomes
The average time spent on the market remained the same from 23 days in February 2024, to 23 days as of February 2025.
Overbids
Single-Family Homes
The overbid percentage has increased from 105 9% last February 2024, to 107 1% a year later
Condos & Townhomes
The overbid percentage has increased from 102% last February 2024, to 102.4% a year later.
Solano County
What's in the Solano County data?
There were 582 single-family homes for sale providing 2 months of inventory. There were new listings, and 230 homes sold at a media price of $596k. The median overbid percenta was at 100%, with an average of 53 days on market.
There were 83 condo and townhome units fo sale, providing 3.2 months of inventory. Ther were 26 new listings and 22 units sold at a m sale price of $367k. The median overbid percentage was at 100%, with an average of days on the market
He-Family Homes
269 New Listings
230 Sold Listings
2 Months of Inventory
$596K
Median Sale Price
100%
Median Sale vs List
53
Avg Days on Market
sourced from InfoSparks, includes all single-family homes, condos and the California Area above from February 2024 to February 2025. This may minary data, and may vary from the time the data was gathered. All data is reliable but not guaranteed. DRE# 01995149. Copyright KW Advisors San Francisco | Napa Valley 2025. Each office is independently owned and operated.
Condo & Town
26
New Listings 3.2
Months of Inventory
Median Sale vs List
Avg Days on Market 22 Sold Listings
FEBRUARY 2024 - FEBRUARY 2025
NGS FOR SALE SOLD LISTINGS
amily Homes months, year-over-year. & Townhomes months, year-over-year
Median SalesPrice
Single-Family Homes
The median sale price has increased from $580k last February 2024, to $596k as of February 2025
Condos & Townhomes
The median sale price has increased from $366k last February 2024, to $367k as of February 2025
AVGDays OntheMarket
Single-Family Homes
The average time spent on the market went down from 55 days last February 2024, to 53 days as of February 2025
Condos & Townhomes
The average time spent on the market went up from 51 days in February 2024, to 52 days as of February 2025.
Overbids
Single-Family Homes
The overbid percentage has remained the same from 100% last February 2024, to 100% a year later
Condos & Townhomes
The overbid percentage has remained the same from 100% last February 2024, to 100% a year later.
Son Cou
What's in
There were 65 providing 2.1 m new listings, a price of $847k was at 100%, w market. There were 10 sale, providing were 46 new li sale price of $ percentage wa days on the m
216 New Listings
208 Sold Listings
2.1 Months of Inventory
$847K Median Sale Price
100% Median Sale vs List
65 Avg Days on Market
and may data is San
Condo & Town
46
New Listings
2.6
Months of Inventory
Median Sale vs List 69 Avg Days on Market 29 Sold Listings
onomaCounty
FEBRUARY 2024 - FEBRUARY 2025
INGS FOR SALE SOLD LISTINGS
amily Homes months, year-over-year. & Townhomes months, year-over-year
Median SalesPrice
Single-Family Homes
The median sale price has increased from $825k last February 2024, to $847k as of February 2025
Condos & Townhomes
The median sale price has decreased from $490k last February 2024, to $470k as of February 2025
AVGDays OntheMarket
Single-Family Homes
The average time spent on the market went up from 59 days last February 2024, to 65 days as of February 2025
Condos & Townhomes
The average time spent on the market went up from 41 days in February 2024, to 69 days as of February 2025.
Overbids
Single-Family Homes
The overbid percentage has increased from 99 9% last February 2024, to 100% a year later
Condos & Townhomes
The overbid percentage has remained the same from 100% last February 2024, to 100% a year later.
HFamily Homes
88 New Listings
90 Sold Listings
1.4 Months of Inventory
$1.7M
Median Sale Price
100%
Median Sale vs List
48 Avg Days on Market
from InfoSparks, includes all single-family homes, condos and California Area above from February 2024 to February 2025. This may data, and may vary from the time the data was gathered. All data is but not guaranteed. DRE# 01995149. Copyright KW Advisors San Francisco | Napa Valley 2025. Each office is independently owned and operated.
44
New Listings
25
Sold Listings
2.8
Months of Inventory
$840K
Median Sale Price 100%
Median Sale vs List
69 Avg Days on Market
S/CMarin
FEBRUARY 2024 - FEBRUARY 2025
LISTINGS FOR SALE SOLD LISTINGS
Single-Family Homes
Last 12 months, year-over-year.
Condos & Townhomes
Last 12 months, year-over-year
Median SalesPrice
Single-Family Homes
The median sale price has increased from $1 6m last February 2024, to $1 7m as of February 2025
Condos & Townhomes
The median sale price has increased from $645k last February 2024, to $840k as of February 2025
AVGDays OntheMarket
Single-Family Homes
The average time spent on the market went down from 53 days last February 2024, to 48 days as of February 2025
Condos & Townhomes
The average time spent on the market went down from 74 days in February 2024, to 69 days as of February 2025.
Overbids
Single-Family Homes
The overbid percentage has remained the same from 100% last February 2024, to 100% a year later
Condos & Townhomes
The overbid percentage has remained the same from 100% last February 2024, to 100% a year later.