


KW Bay Area Estates
Santa Clara County
Jump to Santa Clara County Report
San Mateo County
Jump to San Mateo County Report
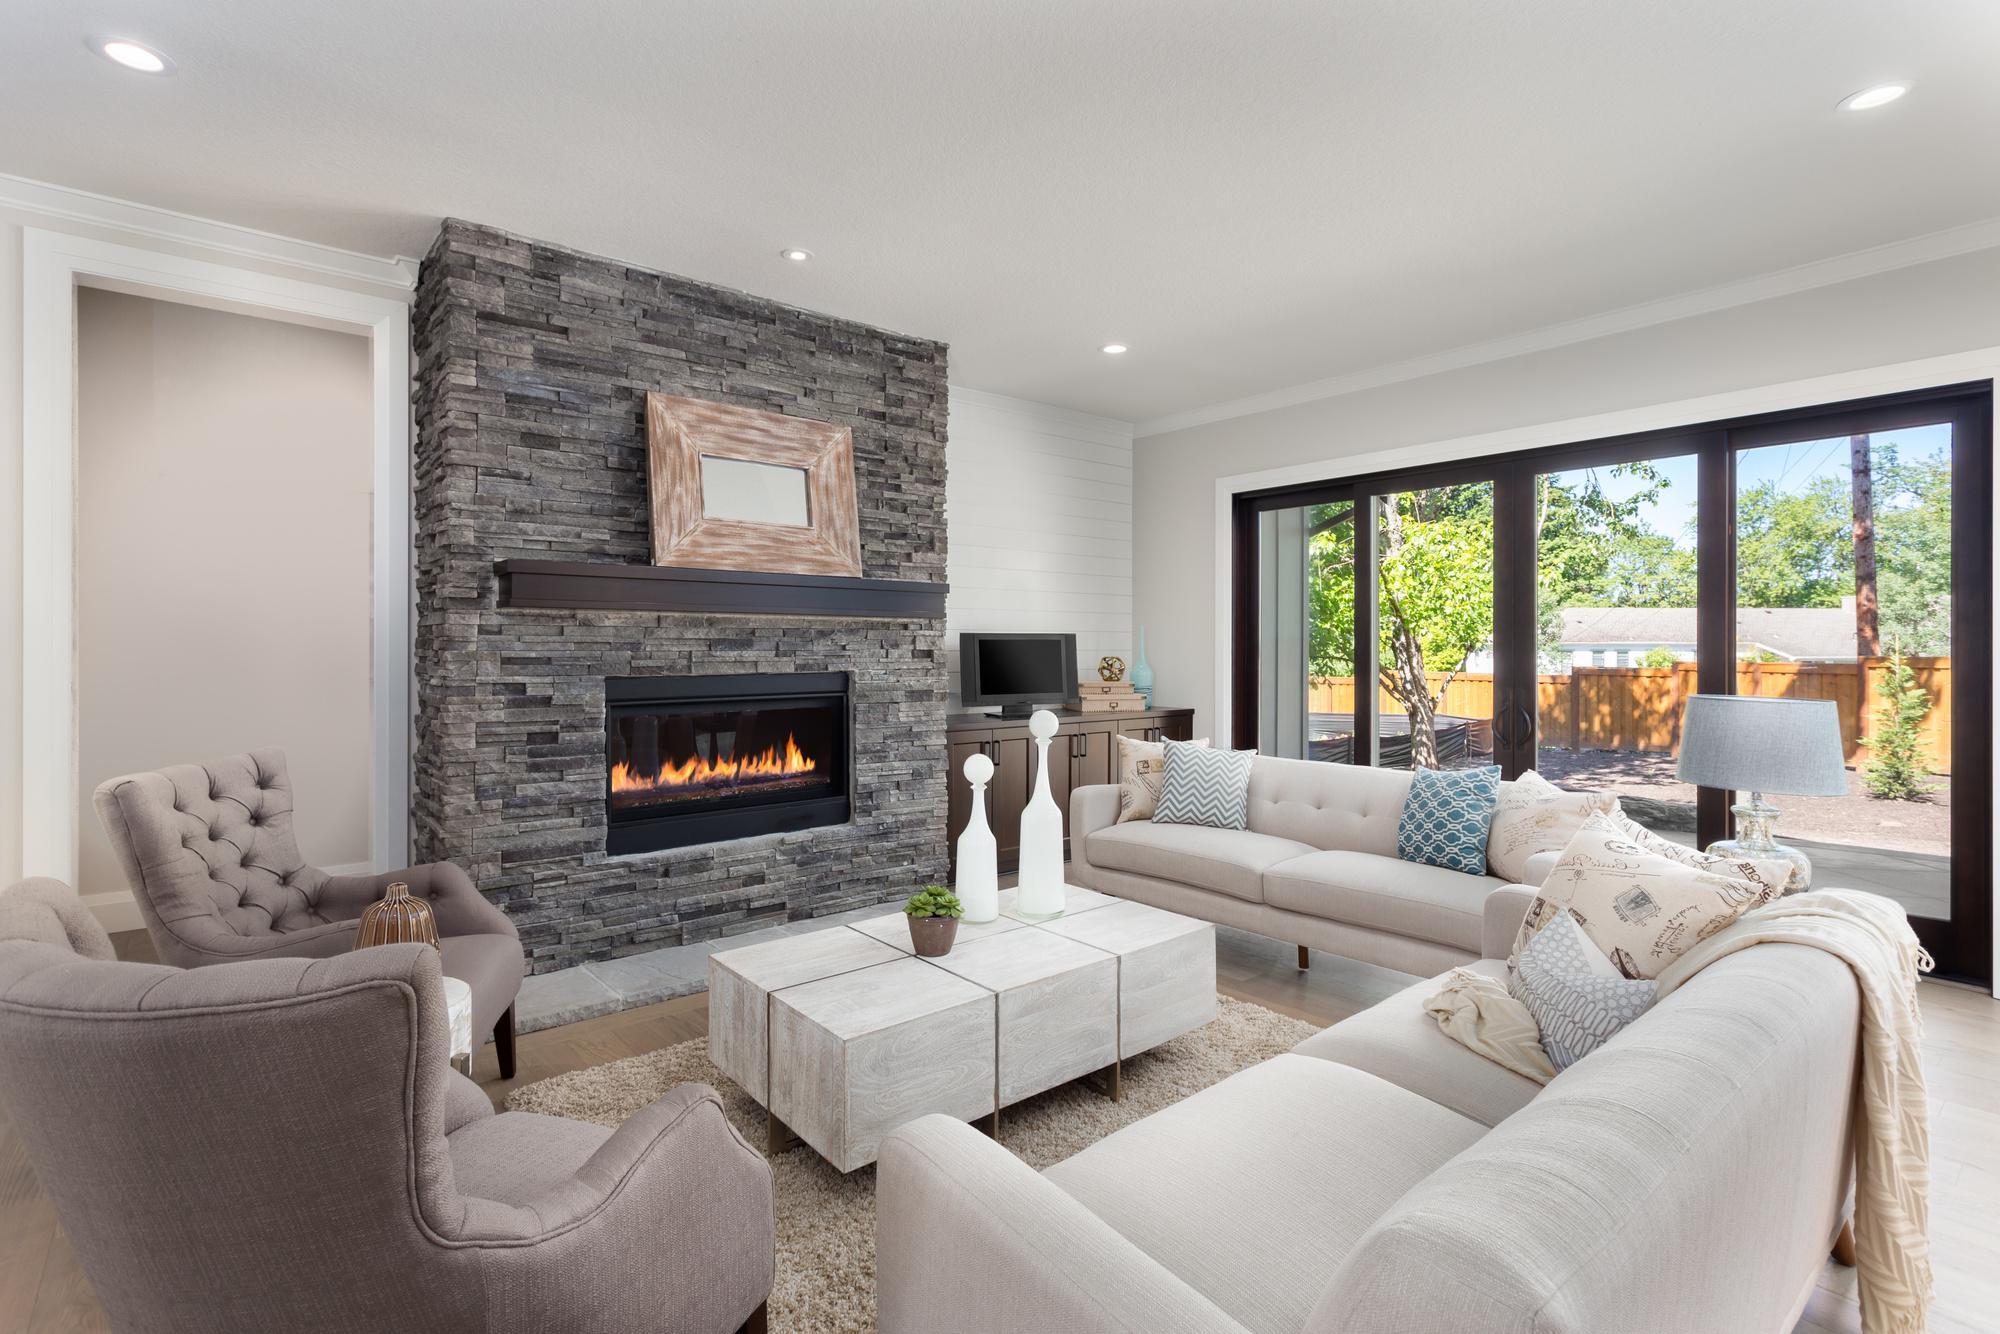
What’s your home really worth in today’s market?
That's really the question you should be asking yourself.
Our market is incredibly diverse, and rapidly changing. Values vary not just by neighborhood, but by street. Your home isn't necessarily worth what your neighbors’ home is. At the end of the day, it’s the current market that sets the value of your home.
So, do you know what your home is worth in today's market?
I can help...
Contact me for a confidential, no obligation assessment of your home's value.
WhyOverpricingYourHouse CanCostYou

If you’re trying to sell your house, you may be looking at this spring season as the sweet spot – and you’re not wrong. We’re still in a seller’s market because there are so few homes for sale right now. And historically, this is the time of year when more buyers move, and competition ticks up. That makes this an exciting time to put up that for sale sign.
But while conditions are great for sellers like you, you’ll still want to be strategic when it comes time to set your asking price. That’s because pricing your house too high may actually cost you in the long run.
The Downside of Overpricing Your House
The asking price for your house sends a message to potential buyers. From the moment they see your listing, the price and the photos are what’s going to make the biggest first impression. And, if it’s priced too high, you may turn people away.


Santa Clara County
The market for Single Family Homes, Condo, and Townhomes units saw 926 closed sales at a median price of $1.6m. There was a total of 1,587 new listings with an average of 17 days on the market without price reduction and with an average price per square foot of $1,086.

 What's in the Santa Clara County data?


1,587 New Listings +33.5% Year-over-Year 926 Closed Sales +0.43% Year-over-Year 17 Average Days-on-Market -32% Year-over-Year
March
Overview
2024

$1.4B
SFH Single Family Homes
New Listings
Average Days-on-Market
Average Price Per SqFt
Median Sale Price
Closed Sales
includes
family,
in Santa Clara
1,078
15
$1,205
$1.9M
652
Data
all single
townhome, and condominium sales
County sourced from MLS Listings. The most recent month’s data is based on available numbers, but may change with late reported activity. Data from sources deemed reliable but may contain errors and are subject to revision.
Total Volume

$802 Average Price Per SqFt 274 Closed Sales 290M Total Volume

Listings for Sale Luxury Contracts Signed Current Year Current Year BY MONTH, YEAR-OVER-YEAR BY MONTH, YEAR-OVER-YEAR Previous Year Previous Year November December January February March 0 50 100 150 200 250 November December January February March 0 20 40 60 80 100 (+$3,000,000 & Above) 202 60 30 38 71 51 207 50 30 36 85 75 144 147 162 205 130 195 132 198 (+$3,000,000 & Above)
Luxury

Median Sales Price
YEAR CURRENT YEAR $0 $500,000 $1,000,000 $1,500,000 $2,000,000 $ 1 , 4 5 0 , 0 0 0 2022 2022 2023 2023 2023 2023 2023 2024 2024 2024 November December January February March $ 1 , 4 1 7 , 5 0 0 $ 1 , 4 3 5 , 0 0 0 $ 1 , 4 6 0 , 0 0 0 $ 1 , 6 3 7 , 5 0 0 $ 1 , 3 5 0 , 0 0 0 $ 1 , 3 0 0 , 0 0 0 $ 1 , 3 2 7 , 4 5 0 $ 1 , 2 6 0 , 0 0 0 $ 1 , 4 1 8 , 5 0 0 Mar2023Apr2023May2023Jun2023Jul2023Aug2023Sep2023Oct2023Nov2023Dec2023Jan2024Feb2024Mar2024 $0 $500,000 $1,000,000 $1,500,000 $2,000,000 $ 1 , 4 1 8 , 5 0 0 $ 1 , 5 0 1 , 0 0 0 $ 1 , 5 0 1 , 4 0 0 $ 1 , 5 5 0 , 0 0 0 $ 1 , 5 0 0 , 0 0 1 $ 1 , 5 2 0 , 5 0 0 $ 1 , 5 2 3 , 0 0 0 $ 1 , 5 4 1 , 0 0 0 $ 1 , 4 5 0 , 0 0 0 $ 1 , 4 1 7 , 5 0 0 $ 1 , 4 3 5 , 0 0 0 $ 1 , 4 6 0 , 0 0 0 $ 1 , 6 3 7 , 5 0 0
BY MONTH, YEAR-OVER-YEAR BY MONTH PREVIOUS
November December January February March 0 500 1,000 1,500 2,000 377 November December January February March 0 200 400 600 800 1000 1200 1400 November December January February March 0 5 10 15 20 25 30 35 November December January February March 0 200 400 600 800 1000 New Listings Contracts Signed Average Days-on-Market Closed Sales BY MONTH, YEAR-OVER-YEAR BY MONTH, YEAR-OVER-YEAR BY MONTH, YEAR-OVER-YEAR BY MONTH, YEAR-OVER-YEAR CURRENT YEAR CURRENT YEAR CURRENT YEAR CURRENT YEAR PREVIOUS YEAR PREVIOUS YEAR PREVIOUS YEAR PREVIOUS YEAR Back to Table of Contents 761 769 639 472 511 818 933 29 673 31 427 35 548 34 922 25 785 735 512 640 883 1,214 20 668 25 513 28 691 21 926 17 414 908 1,185 1,587 710 750 896 1,188


San Mateo County
The market for Single Family Homes, Condo, and Townhomes units saw 357 closed sales at a median price of $1.6m. There was a total of 597 new listings with an average of 25 days on the market without price reduction and with an average price per square foot of $1,129.

Data includes all single family, townhome, and condominium sales in San Mateo County sourced from MLS Listings The most recent month’s data is based on available numbers, but may change with late reported activity Data from sources deemed reliable but may contain errors and are subject to revision
597 New Listings 357 Closed Sales 25 Average Days-on-Market Overview March 2024
SFH Single Family Homes 439 New Listings 19 Average Days-on-Market $1,219 Average Price Per SqFt $1.9M Median Sale Price 274 Closed Sales $673M Total Volume Data includes all single family, townhome, and condominium sales in San Mateo County sourced from MLS Listings. The most recent month’s data is based on available numbers, but may change with late reported activity. Data from sources deemed reliable but may contain errors and are subject to revision.


$834 Average Price Per SqFt 83 Closed Sales $91M Total Volume

Luxury Contracts Signed Current Year Current Year BY MONTH, YEAR-OVER-YEAR Previous Year Previous Year November December January February March 0 50 100 150 200 November December January February March 0 10 20 30 40 50 60 BY MONTH, YEAR-OVER-YEAR (+$3,000,000 & Above) 183 38 31 41 31 29 96 124 137 170 148 39 17 23 48 51 94 112 117 131 (+$3,000,000 & Above)
Luxury Listings for Sale


Median Sales Price
YEAR CURRENT YEAR $0 $500,000 $1,000,000 $1,500,000 $2,000,000 $ 1 , 5 5 0 , 0 0 0 2022 2022 2023 2023 2023 2023 2023 2024 2024 2024 November December January February March $ 1 , 4 0 0 , 0 0 0 $ 1 , 5 0 0 , 0 0 0 $ 1 , 5 5 0 , 0 0 0 $ 1 , 6 3 8 , 0 0 0 $ 1 , 4 5 2 , 5 0 0 $ 1 , 4 0 0 , 0 0 0 $ 1 , 3 3 3 , 0 0 0 $ 1 , 5 5 7 , 5 0 0 $ 1 , 5 0 0 , 0 0 0 Mar2023Apr2023May2023Jun2023Jul2023Aug2023Sep2023Oct2023Nov2023Dec2023Jan2024Feb2024Mar2024 $0 $500,000 $1,000,000 $1,500,000 $2,000,000 $ 1 , 5 0 0 , 0 0 0 $ 1 , 5 5 0 , 0 0 0 $ 1 , 5 7 5 , 0 0 0 $ 1 , 6 9 7 , 5 0 0 $ 1 , 5 5 9 , 0 0 0 $ 1 , 5 5 0 , 0 0 0 $ 1 , 5 3 2 , 5 0 0 $ 1 , 6 5 0 , 0 0 0 $ 1 , 5 5 0 , 0 0 0 $ 1 , 4 0 0 , 0 0 0 $ 1 , 5 0 0 , 0 0 0 $ 1 , 5 5 0 , 0 0 0 $ 1 , 6 3 8 , 0 0 0
BY MONTH, YEAR-OVER-YEAR BY MONTH PREVIOUS
November December January February March 0 100 200 300 400 500 600 163 November December January February March 0 100 200 300 400 500 November December January February March 0 10 20 30 40 50 November December January February March 0 100 200 300 400 New Listings Contracts Signed Average Days-on-Market Closed Sales BY MONTH, YEAR-OVER-YEAR BY MONTH, YEAR-OVER-YEAR BY MONTH, YEAR-OVER-YEAR BY MONTH, YEAR-OVER-YEAR CURRENT YEAR CURRENT YEAR CURRENT YEAR CURRENT YEAR PREVIOUS YEAR PREVIOUS YEAR PREVIOUS YEAR PREVIOUS YEAR Back to Table of Contents 291 346 304 236 220 322 349 32 306 39 211 42 252 35 359 30 356 326 227 265 350 466 29 321 36 206 47 298 30 357 25 146 417 478 597 279 333 378 448
Dedicated to Success
Being an independently owned and operated franchise of Keller Williams, KW Bay Area Estates has the position as the Bay Area’s foremost luxury real estate services firm with the execution of best-in-class customer service. KWBAE’s unparalleled team consists of more than 250 associates and professionals strategically located in Los Gatos and Saratoga. Under the same ownership, we have our division of KW South Bay Commercial.
With uncompromising principles, KW Bay Area Estates has established a new standard of excellence within the industry. The company’s growth has been strategic and exciting. Since its inception, the team has successfully represented more than 9,000 transactions, totaling more than $12 billion in total sales.
Dedicated to upholding unparalleled standards for integrity and client care, they strive to create a culture where agents thrive while developing their own businesses to their maximum potential. KW Bay Area Estates has given their agents over $2.6 million in profit share.





KW Bay Area Estates
Lark Ave, Los Gatos, CA, 95032
(408) 560-9000
Saratoga-Sunnyvale Rd, Saratoga, 95070
(408) 418-3911
16780
Phone:
12820
Phone:


 What's in the Santa Clara County data?


