


Copyright by KW Advisors 2024 April 2024
San Francisco Bay area
Alameda
Jump to Alameda Report
Contra Costa
Jump to Contra Costa Report
Napa
Jump to Napa Report
San Francisco County
Jump to San Francisco County Report

San Mateo
Jump to San Mateo Report
Santa Clara
Jump to Santa Clara Report
Solano
Jump to Solano Report
Sonoma
Jump to Sonoma Report
Jump to Marin Report Southern/Central Marin
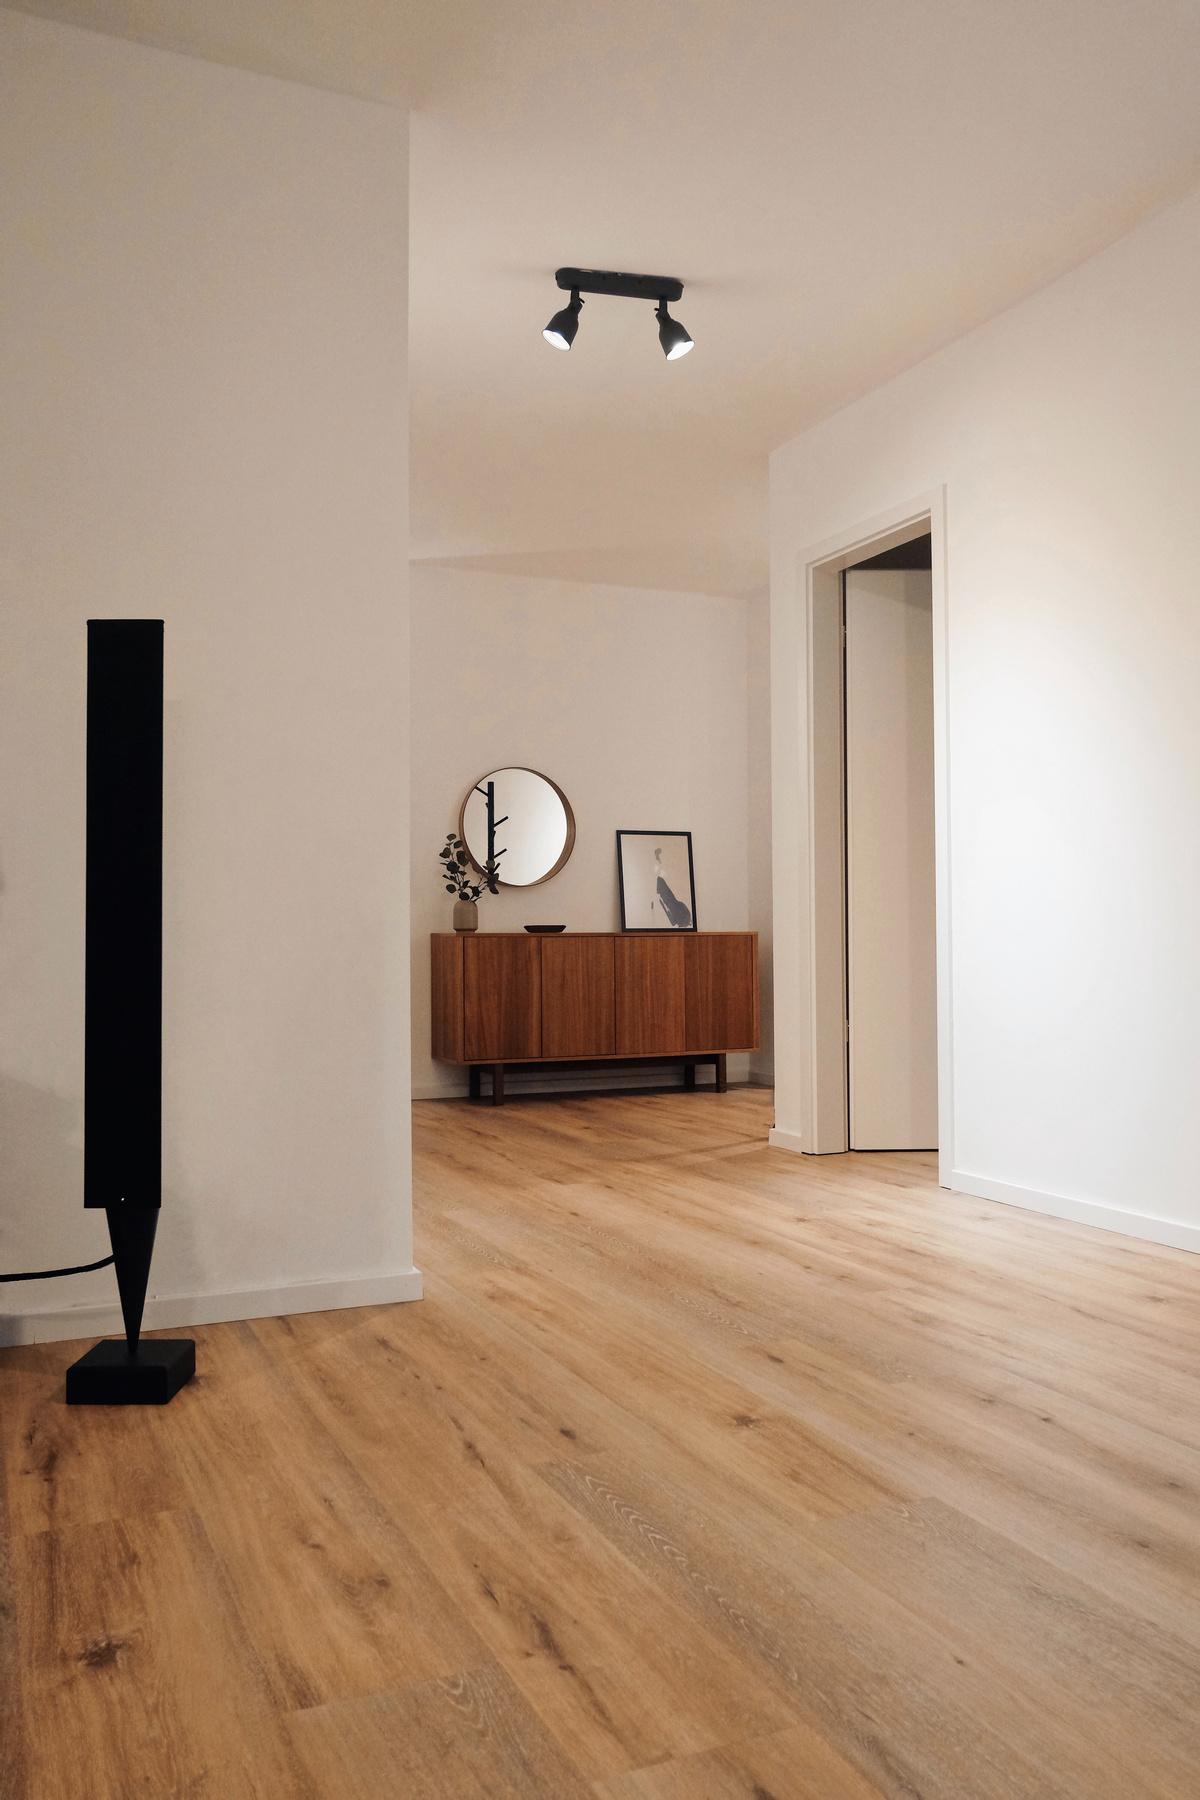
What’syourhome reallyworthin today’smarket?
That's the question you should be asking yourself.
Our market is incredibly diverse and rapidly changing. Values vary not just by neighborhood but by street. Your home isn't necessarily worth what your neighbors' home is. It's the current market that sets the value of your home.
So, do you know what your home is worth in today's market?
Icanhelp...
Contact me for a confidential, no obligation assessment of your home's value.
WhyOverpricingYourHouse CanCostYou

If you’re trying to sell your house, you may be looking at this spring season as the sweet spot – and you’re not wrong. We’re still in a seller’s market because there are so few homes for sale right now. And historically, this is the time of year when more buyers move, and competition ticks up. That makes this an exciting time to put up that for sale sign.
But while conditions are great for sellers like you, you’ll still want to be strategic when it comes time to set your asking price. That’s because pricing your house too high may actually cost you in the long run.
The Downside of Overpricing Your House
The asking price for your house sends a message to potential buyers. From the moment they see your listing, the price and the photos are what’s going to make the biggest first impression. And, if it’s priced too high, you may turn people away.

The Simplest Mortgage Approval Ever

The Customer-Centric Mortgage
Get instant pre-approval and FAST closing -plus a dedicated loan advisor -- for the ultimate mortgage journey.


A Dedicated Loan Advisor...
Your Personal "Easy" button
Enjoy our silky smooth platform, along with passionate, live support from your dedicated Finance Manager. Mortgage expertise at every step!
Our Fast Digital Loan Process...
Get Pre-Approved Online In Minutes without affecting your credit score!
Get Fast Loan Pre-Approval
Get pre-approved online in minutes!
Your personal Finance Manager is there to help!
Your Finance Manager sources a vast array of wholesale & retail lenders for your best rate.
Find A Great Rate Quickly Stop Worrying
Your Finance Manager does the heavy lifting. So you get to funding quickly & easily.
You work hard for your money.
Let our financial tools work hard for you.
We gather the largest array of wholesale & retail lenders to compete for your loan! So you get the lowest rate while we do the work.
Buying a home should be painless. Find your financing right here! Contact me, your Real Estate Expert, for support and to learn more about REMA.

PROTECT
WHAT YOU DON’T EXPECT

You can’t always see a breakdown coming, but you can plan for it with American Home Shield. Our home service plans help fix or replace covered home systems and appliances, and help you stay on budget. Protect what you don’t expect.
HERE TO WATCH THE VIDEO
CLICK
Contact me, your Real Estate Expert, for support and to learn more about AHS. READY TO GET STARTED?

Looking to lighten the mood in your laundry room?
To Look Out For EIGHTEYE-
These refreshing colors make the wash-and-dry chore a little more pleasant.

CATCHING Laundry Room Colors
Tranquil Blue
View it here
Sage Green
View it here
Eight Colrs fo Laundry
White
View it here
Yellow
View it here
Gray
View it here
Dusty Pink
View it here
Navy Blue
View it here
Purple
View it here
Create a tranquil laundry space with Benjamin Moore's Beach Glass Its light blue shade, coupled with a subtle gray undertone, offers a clean and versatile aesthetic that avoids any baby nursery associations.
Transform your space with earthy tones like October Mist and Gloucester Sage from Benjamin Moore. Test out the trendy sage in your laundry room for a lowcommitment update easy to change and customize, ensuring lasting satisfaction with your design choice.
Create an elegant laundry room with Chantilly Lace by Benjamin Moore The classic white choice adds sophistication, opens up the space, and simplifies stain detection.
Elevate your laundry space with the energizing touch of yellow. Behr's Roasted Corn or Upbeat bring warmth and optimism, while Pearly White offers a mellow option a yellow-based white that brings a perfect harmony of vibrancy and calmness
Gray remains a top choice for laundry room walls, providing a timeless and serene backdrop A soft gray for a whisper of sophistication, easily personalized with printed patterned tile flooring or Behr's bold 2024 Color of the Year, Cracked Pepper.
Sherwin-Williams' Rosebud for a touch of romance in laundry rooms. The dusty pink hue, paired with gold accents, adds a luxurious and warm atmosphere
Navy as the key to a striking laundry room. Beyond lighter blues, navy paired with lighter accents or white fixtures, especially Benjamin Moore's Hale Navy, creates a bold choice that makes the laundry room stand out.
Dare to take a style risk in your laundry room with a pop of color Opt for the subtle smoky lavender of Farrow & Ball's Peignoir for a neutral touch or go all-out glam with Backdrop's dark and vampy McQueen, drawing inspiration from the famous fashion designer.
Source : https://www familyhandyman com/list/laundry-room-colors/
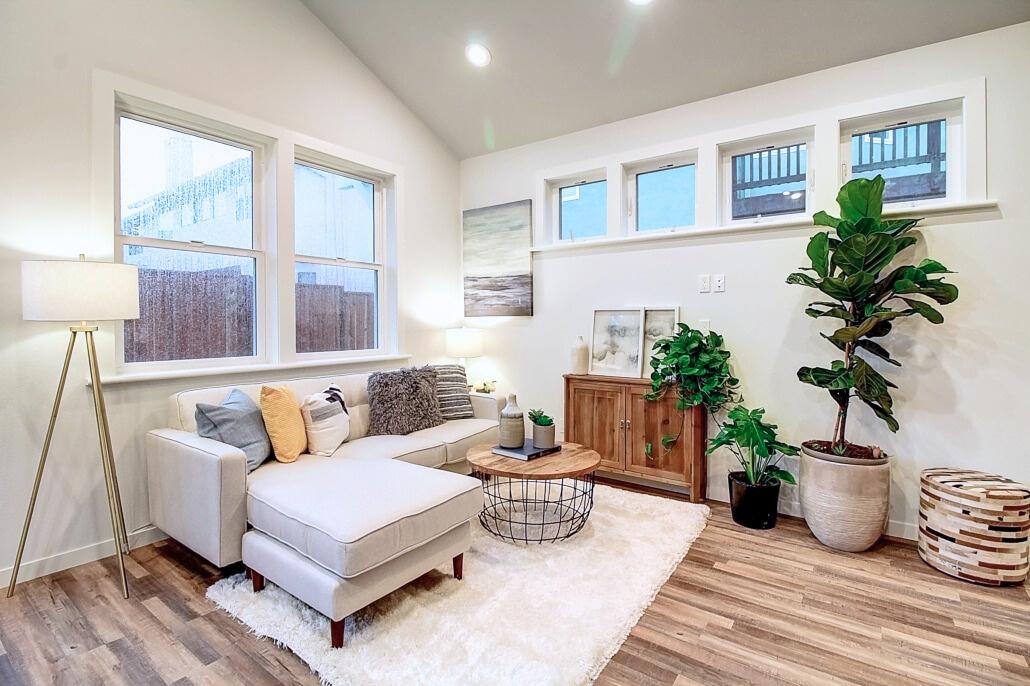
to know how Home
can help with your listing? Contact me today!
Want
Concierge


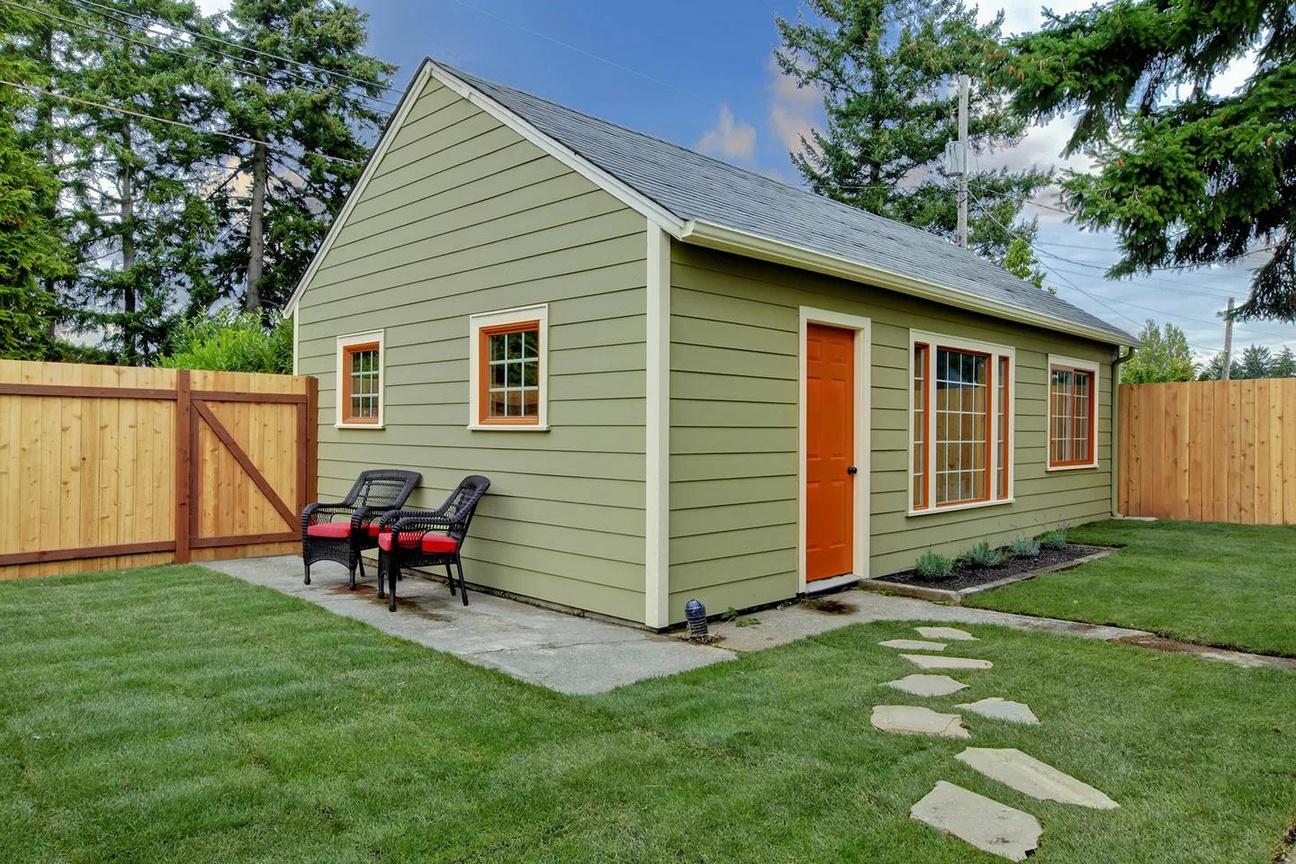
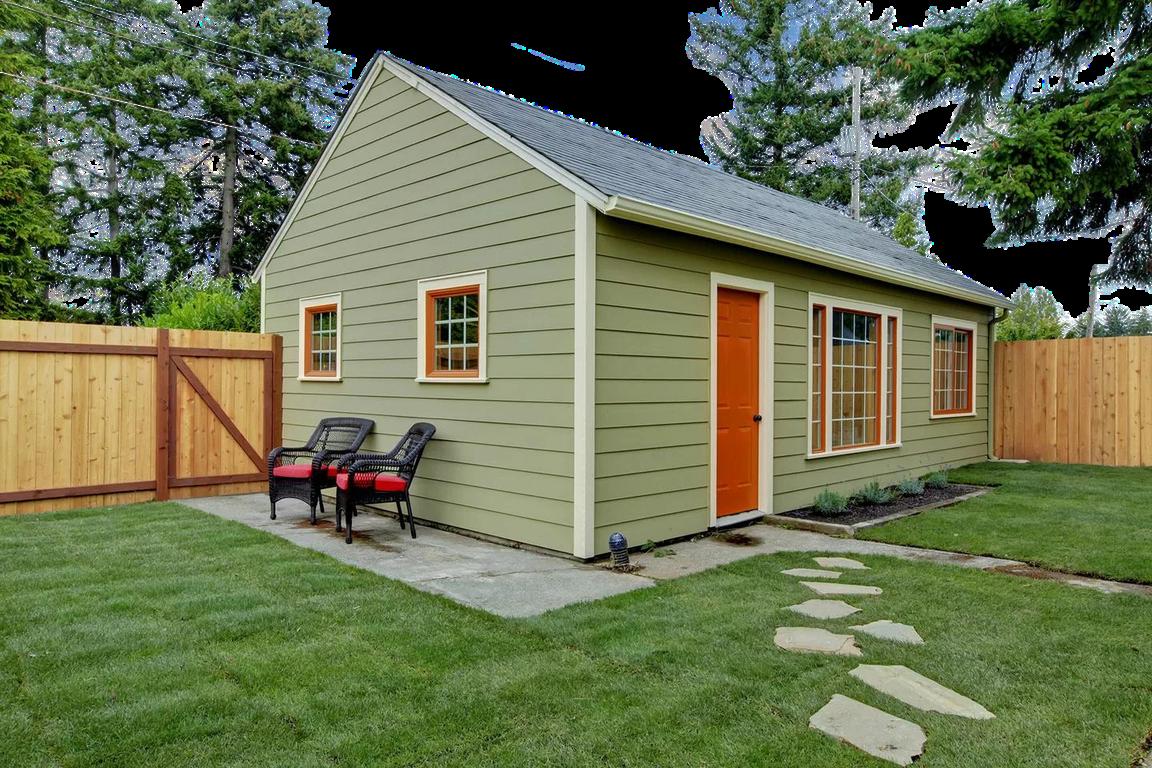
Want to know
ADU
add an
your
to increase its value? Contact me today! YOUR TRUSTED ADU BUILDERS IN CALIFORNIA Bringing Families Closer with Custom Living Spaces for Over 30 Years! See Our 5-Star Reviews!
how Acton
can help
Accessory Dwelling Unit to
property
BEAUTIFUL,PERSONALIZED,AND HIGHQUALITY.
Explore our comprehensive services, from building an ADU in your backyard to anywhere else on your property, and discover why Acton ADU is the name you can rely on for your California accessory dwelling unit project
EFFORTLESS PERMITTING EXPORT CONSTRUCTION
Be amazed at your property’s potential. Our experts use advanced 3D visualization and 3D model building to turn your ideas into tangible ADU plans
Leave the paperwork to us. Acton ADU simplifies the permitting process, allowing you to focus on what matters most while we handle the details
With 30+ years of craftsmanship behind our belts, our skilled team creates your dream ADU – tailored to your family’s needs and designed for modern living
01 02 03 VISION TO REALITY
ACTONADULICENSENUMBER:#638333

When it comes to home ownership, knowing who you can trust is crucial. That's why we've curated a select list of trusted vendors who are ready to help with your home goals.


CLICK
CLICK HERE
HERE
for your mortgage needs for your home warranty needs
VENDOR DIRECTORY


CLICK HERE CLICK HERE for your home renovation needs for your insurance needs CLICK HERE for your all-in-one solution to ADUs (Accessory Dwelling Units)
Alameda
What's in the Alameda data?
There were 1,430 single-family homes for sale, providing 0.9 months of inventory. There were 806 new listings, and 559 homes sold at a median price of $1.4m. The median overbid percentage was at 108.5%, with an average of 18 days on the market.
There were 732 condo and townhome units for sale, providing 1 6 months of inventory There were 345 new listings and 195 units sold at a median sale price of $775k. The median overbid percentage was at 103.6%, with an average of 24 days on the market.

InfoSparks, includes all single-family homes, condos and California Area above from March 2023 to March 2024. This may and may vary from the time the data was gathered. All data is guaranteed. DRE# 01995149. Copyright KW Advisors San Francisco | Napa Valley 2024. Each office is independently owned and operated.
ory
Median Sale Price
ist 559 Sold Listings 18 Avg Days on Market
mily Homes
$1.4M
5%
CONDO Condo & Townhomes 345 New Listings 1.6 Months of Inventory $775K Median Sale Price 103.6% Median Sale vs List 24 Avg Days on Market 195 Sold Listings
MARCH 2023 - MARCH 2024
LISTINGS FOR SALE SOLD LISTINGS
Single-Family Homes
Last 12 months, year-over-year.
Condos & Townhomes
Last 12 months, year-over-year
AlamedaCounty
Mar2023 Apr2023 May2023 Jun2023 Jul2023 Aug2023 Sep2023 Oct2023 Nov2023 Dec2023 Jan2024 Feb2024 Mar2024 0 500 1,000 1,500 2,000 Mar2023 Apr2023 May2023 Jun2023 Jul2023 Aug2023 Sep2023 Oct2023 Nov2023 Dec2023 Jan2024 Feb2024 Mar2024 0 200 400 600 800
Median SalesPrice
Single-Family Homes
The median sale price has increased from $1 2m last March 2023, to $1 4m as of March 2024
Condos & Townhomes
The median sale price has remained the same from $775k last March 2023, to $775k as of March 2024
AVGDays OntheMarket
Single-Family Homes
The average time spent on the market went down from 20 days last March 2023, to 18 days as of March 2024
Condos & Townhomes
The average time spent on the market went down from 27 days in March 2023, to 24 days as of March 2024.
Overbids
Single-Family Homes
The overbid percentage has increased from 104 7% last March 2023, to 108 5% a year later
Condos & Townhomes
The overbid percentage has increased from 100.9% last March 2023, to 103.6% a year later.
Back to Table of Contents Mar2023Apr2023May2023 Jun2023 Jul2023Aug2023Sep2023Oct2023Nov2023Dec2023 Jan2024Feb2024Mar2024 $0 $200,000 $400,000 $600,000 $800,000 $1,000,000 $1,200,000 $1,400,000 Mar2023
Oct2023Nov2023Dec2023 Jan2024 Feb2024Mar2024 0 10 20 30 40 50 60 Mar2023Apr2023May2023 Jun2023 Jul2023Aug2023Sep2023 Oct2023Nov2023Dec2023 Jan2024 Feb2024Mar2024 000% 2000% 4000% 6000% 8000% 10000% 12000%
Apr2023May2023 Jun2023 Jul2023Aug2023Sep2023

Contra Costa
What's in the Contra Costa data?
There were 731 single-family homes for sale, providing 1.2 months of inventory. There were 847 new listings, and 496 homes sold at a median price of $900k. The median overbid percentage was at 102 2%, with an average of 21 days on the market.
There were 345 condo and townhome units for sale, providing 2 months of inventory. There were 262 new listings and 158 units sold at a median sale price of $654k. The median overbid percentage was at 100%, with an average of 32 days on the market

SFH Single-Family Homes
The data, sourced from InfoSparks, includes all single-family homes, condos and townhomes in the California Area above from March 2023 to March 2024. This may include preliminary data, and may vary from the time the data was gathered. All data is deemed reliable but not guaranteed. DRE# 01995149. Copyright KW Advisors San Francisco | Napa Valley 2024. Each office is independently owned and operated. 847 New Listings 1.2 Months of Inventory $900K Median Sale Price 102.2% Median Sale vs List 496 Sold Listings 21 Avg Days on Market

CONDO Condo & Townhome 262 New Listings 2 Months of Inventory $654K Median Sale Price 100% Median Sale vs List 32 Avg Days on Market 158 Sold Listings
MARCH 2023 - MARCH 2024
Single-Family Homes
Last 12 months, year-over-year.
Condos & Townhomes
Last 12 months, year-over-year
raCosta
Mar2023 Apr2023 May2023 Jun2023 Jul2023 Aug2023 Sep2023 Oct2023 Nov2023 Dec2023 Jan2024 Feb2024 Mar2024 0 200 400 600 800 1,000 1,200 Mar2023 Apr2023 May2023 Jun2023 Jul2023 Aug2023 Sep2023 Oct2023 Nov2023 Dec2023 Jan2024 Feb2024 Mar2024 0 100 200 300 400
LISTINGS FOR SALE SOLD LISTINGS
Median SalesPrice
Single-Family Homes
The median sale price has increased from $815k last March 2023, to $900k as of March 2024
Condos & Townhomes
The median sale price has increased from $580k last March 2023, to $654k as of March 2024
AVGDays OntheMarket
Single-Family Homes
The average time spent on the market went down from 32 days last March 2023, to 21 days as of March 2024
Condos & Townhomes
The average time spent on the market went up from 26 days in March 2023, to 32 days as of March 2024.
Overbids
Single-Family Homes
The overbid percentage has increased from 100% last March 2023, to 102 2% a year later
Condos & Townhomes
The overbid percentage has remained the same from 100% last March 2023, to 100% a year later.
Back to Table of Contents Mar2023Apr2023May2023 Jun2023 Jul2023Aug2023Sep2023Oct2023Nov2023Dec2023 Jan2024Feb2024Mar2024 $0 $200,000 $400,000 $600,000 $800,000 $1,000,000 Mar2023 Apr2023May2023 Jun2023 Jul2023Aug2023Sep2023 Oct2023Nov2023Dec2023 Jan2024 Feb2024Mar2024 0 10 20 30 40 Mar2023Apr2023May2023 Jun2023 Jul2023Aug2023Sep2023 Oct2023Nov2023Dec2023 Jan2024 Feb2024Mar2024 000% 2000% 4000% 6000% 8000% 10000% 12000%

Napa County
What's in the Napa County data?
There were 209 single-family homes for sale, providing 3 months of inventory. There were 80 new listings, and 59 homes sold at a median price of $882k. The median overbid percentage was at 97 8%, with an average of 75 days on the market
There were 25 condo and townhome units for sale, providing 2.5 months of inventory. There were 14 new listings and 11 units sold at a median sale price of $699k. The median overbid percentage was at 97.6%, with an average of 68 days on the market.

The data, sourced from InfoSparks, includes all single-family homes, condos and townhomes in the California Area above from March 2023 to March 2024. This may include preliminary data, and may vary from the time the data was gathered. All data is deemed reliable but not guaranteed. DRE# 01995149. Copyright KW Advisors San Francisco | Napa Valley 2024. Each office is independently owned and operated. 80 New Listings 3 Months of Inventory $882K Median Sale Price 97.8% Median Sale vs List 59 Sold Listings 75 Avg Days on Market

CONDO Condo & Townhomes 14 New Listings 2.5 Months of Inventory $699K Median Sale Price 97.6% Median Sale vs List 68 Avg Days on Market 11 Sold Listings
MARCH 2023 - MARCH 2024
LISTINGS FOR SALE SOLD LISTINGS
Single-Family Homes
Last 12 months, year-over-year.
Condos & Townhomes
Last 12 months, year-over-year
Napa
Mar2023 Apr2023 May2023 Jun2023 Jul2023 Aug2023 Sep2023 Oct2023 Nov2023 Dec2023 Jan2024 Feb2024 Mar2024 0 100 200 300 400 Mar2023 Apr2023 May2023 Jun2023 Jul2023 Aug2023 Sep2023 Oct2023 Nov2023 Dec2023 Jan2024 Feb2024 Mar2024 0 10 20 30 40 50
Single-Family Homes
The median sale price has decreased from $900k last March 2023, to $882k as of March 2024
Condos & Townhomes
The median sale price has decreased from $789k last March 2023, to $699k as of March 2024
AVGDays OntheMarket
Single-Family Homes
The average time spent on the market went up from 55 days last March 2023, to 75 days as of March 2024
Condos & Townhomes
The average time spent on the market went up from 21 days in March 2023, to 68 days as of March 2024.
Overbids
Single-Family Homes
The overbid percentage has decreased from 100% last March 2023, to 97 8% a year later
Condos & Townhomes
The overbid percentage has decreased from 101.3% last March 2023, to 97.6% a year later.
Back to Table of Contents Mar2023Apr2023May2023 Jun2023 Jul2023Aug2023Sep2023Oct2023Nov2023Dec2023 Jan2024Feb2024Mar2024 $0 $200,000 $400,000 $600,000 $800,000 $1,000,000 $1,200,000 Mar2023 Apr2023May2023 Jun2023 Jul2023Aug2023Sep2023 Oct2023Nov2023Dec2023 Jan2024 Feb2024Mar2024 0 20 40 60 80 100 120 Mar2023Apr2023May2023 Jun2023 Jul2023Aug2023Sep2023 Oct2023Nov2023Dec2023 Jan2024 Feb2024Mar2024 000% 2000% 4000% 6000% 8000% 10000% 12000%
Median SalesPrice

San Francisco County
What's in the San Francisco County data?
There were 245 single-family homes for sale, providing 1.5 months of inventory. There were 246 new listings, and 160 homes sold at a median price of $1.7m. The median overbid percentage was at 109.7%, with an average of 27 days on the market.
There were 597 condo and townhome units for sale, providing 3.6 months of inventory. There were 306 new listings and 161 units sold at a median sale price of $1.1m. The median overbid percentage was at 100%, with an average of 49 days on the market.

246 New Listings
mily Homes
160 Sold Listings
1.5 Months of Inventory
$1.7M Median Sale Price
109.7% Median Sale vs List
27 Avg Days on Market
The data, sourced from InfoSparks, includes all single-family homes, condos and townhomes in the California Area above from March 2023 to March 2024. This may include preliminary data, and may vary from the time the data was gathered. All data is deemed reliable but not guaranteed. DRE# 01995149. Copyright KW Advisors San Francisco | Napa Valley 2024. Each office is independently owned and operated.

CONDO Condo & Townhomes 306 New Listings 3.6 Months of Inventory $1.1M Median Sale Price 100% Median Sale vs List 49 Avg Days on Market 161 Sold Listings
MARCH 2023 - MARCH 2024
Single-Family Homes
Last 12 months, year-over-year.
Condos & Townhomes
Last 12 months, year-over-year
SanFranciscoCounty
Mar2023 Apr2023 May2023 Jun2023 Jul2023 Aug2023 Sep2023 Oct2023 Nov2023 Dec2023 Jan2024 Feb2024 Mar2024 0 100 200 300 400 500 Mar2023 Apr2023 May2023 Jun2023 Jul2023 Aug2023 Sep2023 Oct2023 Nov2023 Dec2023 Jan2024 Feb2024 Mar2024 0 200 400 600 800 1,000
LISTINGS FOR SALE SOLD LISTINGS
Median SalesPrice
Single-Family Homes
The median sale price has increased from $1 69m last March 2023, to $1 72m as of March 2024
Condos & Townhomes
The median sale price has increased from $1 12m last March 2023, to $1 15m as of March 2024
AVGDays OntheMarket
Single-Family Homes
The average time spent on the market went down from 31 days last March 2023, to 27 days as of March 2024
Condos & Townhomes
The average time spent on the market went down from 55 days in March 2023, to 49 days as of March 2024.
Overbids
Single-Family Homes
The overbid percentage has increased from 105 5% last March 2023, to 109 7% a year later
Condos & Townhomes
The overbid percentage has remained the same from 100% last March 2023, to 100% a year later.
Back to Table of Contents Mar2023Apr2023May2023 Jun2023 Jul2023Aug2023Sep2023Oct2023Nov2023Dec2023 Jan2024Feb2024Mar2024 $0 $500,000 $1,000,000 $1,500,000 $2,000,000 Mar2023 Apr2023May2023 Jun2023 Jul2023Aug2023Sep2023 Oct2023Nov2023Dec2023 Jan2024 Feb2024Mar2024 0 20 40 60 80 Mar2023Apr2023May2023 Jun2023 Jul2023Aug2023Sep2023 Oct2023Nov2023Dec2023 Jan2024 Feb2024Mar2024 000% 2000% 4000% 6000% 8000% 10000% 12000%

He-Family Homes
392 New Listings
268 Sold Listings
1 Month of Inventory
$2M Median Sale Price
103.2% Median Sale vs List
20 Avg Days on Market
The data, sourced from InfoSparks, includes all single-family homes, condos and townhomes in the California Area above from March 2023 to March 2024. This may include preliminary data, and may vary from the time the data was gathered. All data is deemed reliable but not guaranteed. DRE# 01995149. Copyright KW Advisors San Francisco | Napa Valley 2024. Each office is independently owned and operated.
C Condo 148 New Listings 2.1 Months of Inventory $1M Median Sale Price 100.6% Median Sale vs List 45 Avg Days on Market 81 Sold Listings
Single-Family Homes
Last 12 months, year-over-year.
Condos & Townhomes
Last 12 months, year-over-year
ounty
Mar2023 Apr2023 May2023 Jun2023 Jul2023 Aug2023 Sep2023 Oct2023 Nov2023 Dec2023 Jan2024 Feb2024 Mar2024 0 100 200 300 400 500 600 Mar2023 Apr2023 May2023 Jun2023 Jul2023 Aug2023 Sep2023 Oct2023 Nov2023 Dec2023 Jan2024 Feb2024 Mar2024 0 50 100 150 200 250
LISTINGS FOR SALE SOLD LISTINGS
Single-Family Homes
The median sale price has increased from $1 75m last March 2023, to $2 01m as of March 2024
Condos & Townhomes
The median sale price has decreased from $1 06m last March 2023, to $1 05m as of March 2024
AVGDays OntheMarket
Single-Family Homes
The average time spent on the market went down from 28 days last March 2023, to 20 days as of March 2024
Condos & Townhomes
The average time spent on the market went up from 36 days in March 2023, to 45 days as of March 2024.
Overbids
Single-Family Homes
The overbid percentage has increased from 100% last March 2023, to 103 2% a year later
Condos & Townhomes
The overbid percentage has increased from 100% last March 2023, to 100.6% a year later.
Back to Table of Contents Mar2023Apr2023May2023 Jun2023 Jul2023Aug2023Sep2023Oct2023Nov2023Dec2023 Jan2024Feb2024Mar2024 $0 $500,000 $1,000,000 $1,500,000 $2,000,000 $2,500,000 Mar2023 Apr2023May2023 Jun2023 Jul2023Aug2023Sep2023 Oct2023Nov2023Dec2023 Jan2024 Feb2024Mar2024 0 10 20 30 40 50 60 70 Mar2023Apr2023May2023 Jun2023 Jul2023Aug2023Sep2023 Oct2023Nov2023Dec2023 Jan2024 Feb2024Mar2024 000% 2000% 4000% 6000% 8000% 10000% 12000%
Median SalesPrice

SantaC County
What's in the Sant County data?
There were 514 single-family providing 0.8 months of inve new listings, and 640 homes price of $1.8m. The median o was at 107 3%, with an avera market.
There were 308 condo and to sale, providing 1.1 months of were 443 new listings and 26 median sale price of $970k. T percentage was at 102.9%, w days on the market
918 New Listings
0.8 Months of Inventory
107.3% Median Sale vs List
640 Sold Listings
$1.8M Median Sale Price
15 Avg Days on Market
The data, sourced from InfoSparks, includes all single-family homes, condos and townhomes in the California Area above from March 2023 to March 2024. This may include preliminary data, and may vary from the time the data was gathered. All data is deemed reliable but not guaranteed. DRE# 01995149. Copyright KW Advisors San Francisco | Napa Valley 2024. Each office is independently owned and operated.

C Condo 443 New Listings 1.1 Months of Inventory $970K Median Sale Price 102.9% Median Sale vs List 20 Avg Days on Market 269 Sold Listings
LISTINGS FOR SALE SOLD LISTINGS
Single-Family Homes
Last 12 months, year-over-year.
Condos & Townhomes
Last 12 months, year-over-year
County
Mar2023 Apr2023 May2023 Jun2023 Jul2023 Aug2023 Sep2023 Oct2023 Nov2023 Dec2023 Jan2024 Feb2024 Mar2024 0 200 400 600 800 1,000 Mar2023 Apr2023 May2023 Jun2023 Jul2023 Aug2023 Sep2023 Oct2023 Nov2023 Dec2023 Jan2024 Feb2024 Mar2024 0 100 200 300 400 500
Median SalesPrice
Single-Family Homes
The median sale price has increased from $1 68m last March 2023, to $1 89m as of March 2024
Condos & Townhomes
The median sale price has increased from $947k last March 2023, to $970k as of March 2024
AVGDays OntheMarket
Single-Family Homes
The average time spent on the market went down from 25 days last March 2023, to 15 days as of March 2024
Condos & Townhomes
The average time spent on the market went down from 26 days in March 2023, to 20 days as of March 2024.
Overbids
Single-Family Homes
The overbid percentage has increased from 100 9% last March 2023, to 107 3% a year later
Condos & Townhomes
The overbid percentage has increased from 100% last March 2023, to 102.9% a year later.
Back to Table of Contents Mar2023Apr2023May2023 Jun2023 Jul2023Aug2023Sep2023Oct2023Nov2023Dec2023 Jan2024Feb2024Mar2024 $0 $500,000 $1,000,000 $1,500,000 $2,000,000 Mar2023 Apr2023May2023 Jun2023 Jul2023Aug2023Sep2023 Oct2023Nov2023Dec2023 Jan2024 Feb2024Mar2024 0 10 20 30 40 Mar2023Apr2023May2023 Jun2023 Jul2023Aug2023Sep2023 Oct2023Nov2023Dec2023 Jan2024 Feb2024Mar2024 000% 2000% 4000% 6000% 8000% 10000% 12000%

Solano County
What's in the Solano County data?
There were 446 single-family homes for sale, providing 1.6 months of inventory. There were 305 new listings, and 258 homes sold at a median price of $584k. The median overbid percentage was at 100%, with an average of 48 days on the market.
There were 59 condo and townhome units for sale, providing 2.3 months of inventory. There were 31 new listings and 33 units sold at a median sale price of $335k. The median overbid percentage was at 100%, with an average of 38 days on the market

SFH Single-Family Homes
data, sourced from InfoSparks, includes all single-family homes, condos and townhomes in the California Area above from March 2023 to March 2024. This may include preliminary data, and may vary from the time the data was gathered. All data is deemed reliable but not guaranteed. DRE# 01995149. Copyright KW Advisors San Francisco | Napa Valley 2024. Each office is independently owned and operated. 305 New Listings 1.6 Months of Inventory $584K Median Sale Price 100% Median Sale vs List 258 Sold Listings 48 Avg Days on Market
The

C Condo 31 New Listings 2.3 Months of Inventory $335K Median Sale Price 100% Median Sale vs List 38 Avg Days on Market 33 Sold Listings
Single-Family Homes
Last 12 months, year-over-year.
Condos & Townhomes
Last 12 months, year-over-year
Mar2023 Apr2023 May2023 Jun2023 Jul2023 Aug2023 Sep2023 Oct2023 Nov2023 Dec2023 Jan2024 Feb2024 Mar2024 0 100 200 300 400 500 600 700 Mar2023 Apr2023 May2023 Jun2023 Jul2023 Aug2023 Sep2023 Oct2023 Nov2023 Dec2023 Jan2024 Feb2024 Mar2024 0 20 40 60 80
LISTINGS FOR SALE SOLD LISTINGS
Single-Family Homes
The median sale price has decreased from $585k last March 2023, to $584k as of March 2024
Condos & Townhomes
The median sale price has decreased from $382k last March 2023, to $335k as of March 2024
AVGDays OntheMarket
Single-Family Homes
The average time spent on the market went down from 57 days last March 2023, to 48 days as of March 2024
Condos & Townhomes
The average time spent on the market went down from 50 days in March 2023, to 38 days as of March 2024.
Overbids
Single-Family Homes
The overbid percentage has remained the same from 100% last March 2023, to 100% a year later
Condos & Townhomes
The overbid percentage has decreased from 101.1% last March 2023, to 100% a year later.
Back to Table of Contents Mar2023Apr2023May2023 Jun2023 Jul2023Aug2023Sep2023Oct2023Nov2023Dec2023 Jan2024Feb2024Mar2024 $0 $100,000 $200,000 $300,000 $400,000 $500,000 $600,000 $700,000 Mar2023 Apr2023May2023 Jun2023 Jul2023Aug2023Sep2023 Oct2023Nov2023Dec2023 Jan2024 Feb2024Mar2024 0 10 20 30 40 50 60 70 Mar2023Apr2023May2023 Jun2023 Jul2023Aug2023Sep2023 Oct2023Nov2023Dec2023 Jan2024 Feb2024Mar2024 000% 2000% 4000% 6000% 8000% 10000% 12000%
Median SalesPrice
Sonoma County
What's in the Sonoma data?
There were 473 single-family homes for sale, providing 1.7 months of inventory. There were 255 new listings, and 256 homes sold at a median price of $865k. The median overbid percentage was at 100%, with an average of 54 days on the market.
There were 63 condo and townhome units for sale, providing 1.7 months of inventory. There were 42 new listings and 39 units sold at a median sale price of $450k. The median overbid percentage was at 100%, with an average of 51 days on the market.

The data, sourced from InfoSparks, includes all single-family homes, condos and townhomes in the California Area above from March 2023 to March 2024. This may include preliminary data, and may vary from the time the data was gathered. All data is deemed reliable but not guaranteed. DRE# 01995149. Copyright KW Advisors San Francisco | Napa Valley 2024. Each office is independently owned and operated. 255 New Listings 1.7 Months of Inventory $865K Median Sale Price 100% Median Sale vs List 256 Sold Listings 54 Avg Days on Market
C Condo 42 New Listings 1.7 Months of Inventory $450K Median Sale Price 100% Median Sale vs List 51 Avg Days on Market 39 Sold Listings
Single-Family Homes
Last 12 months, year-over-year.
Condos & Townhomes
Last 12 months, year-over-year
Mar2023 Apr2023 May2023 Jun2023 Jul2023 Aug2023 Sep2023 Oct2023 Nov2023 Dec2023 Jan2024 Feb2024 Mar2024 0 200 400 600 800 1,000 1,200 Mar2023 Apr2023 May2023 Jun2023 Jul2023 Aug2023 Sep2023 Oct2023 Nov2023 Dec2023 Jan2024 Feb2024 Mar2024 0 20 40 60 80 100
LISTINGS FOR SALE SOLD LISTINGS
Median SalesPrice
Single-Family Homes
The median sale price has increased from $822k last March 2023, to $865k as of March 2024
Condos & Townhomes
The median sale price has decreased from $500k last March 2023, to $450k as of March 2024
AVGDays OntheMarket
Single-Family Homes
The average time spent on the market remained the same from 54 days last March 2023, to 54 days as of March 2024
Condos & Townhomes
The average time spent on the market went up from 42 days in March 2023, to 51 days as of March 2024.
Overbids
Single-Family Homes
The overbid percentage has remained the same from 100% last March 2023, to 100% a year later
Condos & Townhomes
The overbid percentage has remained the same from 100% last March 2023, to 100% a year later.
Back to Table of Contents Mar2023Apr2023May2023 Jun2023 Jul2023Aug2023Sep2023Oct2023Nov2023Dec2023 Jan2024Feb2024Mar2024 $0 $200,000 $400,000 $600,000 $800,000 $1,000,000 Mar2023 Apr2023May2023 Jun2023 Jul2023Aug2023Sep2023 Oct2023Nov2023Dec2023 Jan2024 Feb2024Mar2024 0 10 20 30 40 50 60 70 Mar2023Apr2023May2023 Jun2023 Jul2023Aug2023Sep2023 Oct2023Nov2023Dec2023 Jan2024 Feb2024Mar2024 000% 2000% 4000% 6000% 8000% 10000% 12000%
Southe Centra Marin
What's in the Mari
There were 188 single-family providing 1 4 months of inve new listings, and 100 homes price of $2m. The median ov at 100.1%, with an average o market. There were 94 condo and tow sale, providing 1.9 months o were 48 new listings and 44 sale price of $760k. The med percentage was at 100%, wit days on the market.
reliable
not guaranteed. DRE# 01995149. Copyright KW Advisors San
| Napa Valley 2024. Each office is independently owned and operated. 108 New Listings 1.4 Months of Inventory $2M Median Sale Price 100.1% Median Sale vs List 100 Sold Listings 28 Avg Days on Market
The data, sourced from InfoSparks, includes all single-family homes, condos and townhomes in the California Area above from March 2023 to March 2024. This may include preliminary data, and may vary from the time the data was gathered. All data is deemed
but
Francisco

C Condo 48 New Listings 1.9 Months of Inventory $760K Median Sale Price 100% Median Sale vs List 52 Avg Days on Market 44 Sold Listings
LISTINGS FOR SALE SOLD LISTINGS
Single-Family Homes
Last 12 months, year-over-year.
Condos & Townhomes
Last 12 months, year-over-year
Mar2023 Apr2023 May2023 Jun2023 Jul2023 Aug2023 Sep2023 Oct2023 Nov2023 Dec2023 Jan2024 Feb2024 Mar2024 0 100 200 300 400 500 Mar2023 Apr2023 May2023 Jun2023 Jul2023 Aug2023 Sep2023 Oct2023 Nov2023 Dec2023 Jan2024 Feb2024 Mar2024 0 50 100 150 200
Median SalesPrice
Single-Family Homes
The median sale price has increased from $1 66m last March 2023, to $2 08m as of March 2024
Condos & Townhomes
The median sale price has decreased from $770k last March 2023, to $760k as of March 2024
AVGDays OntheMarket
Single-Family Homes
The average time spent on the market went down from 40 days last March 2023, to 28 days as of March 2024
Condos & Townhomes
The average time spent on the market went down from 56 days in March 2023, to 52 days as of March 2024.
Overbids
Single-Family Homes
The overbid percentage has decreased from 100 8% last March 2023, to 100 1% a year later
Condos & Townhomes
The overbid percentage has remained the same from 100% last March 2023, to 100% a year later.
Back to Table of Contents Mar2023Apr2023May2023 Jun2023 Jul2023Aug2023Sep2023Oct2023Nov2023Dec2023 Jan2024Feb2024Mar2024 $0 $500,000 $1,000,000 $1,500,000 $2,000,000 $2,500,000 Mar2023 Apr2023May2023 Jun2023 Jul2023Aug2023Sep2023 Oct2023Nov2023Dec2023 Jan2024 Feb2024Mar2024 0 20 40 60 80 Mar2023Apr2023May2023 Jun2023 Jul2023Aug2023Sep2023 Oct2023Nov2023Dec2023 Jan2024 Feb2024Mar2024 000% 2000% 4000% 6000% 8000% 10000% 12000%


1624 California Street, San Francisco, CA 94109 SanFrancisco Click Here to Download PDF