2025 Johnson City Housing Needs Assessment - Bowen Report
HOUSING NEEDS ASSESSMENT
Johnson City, Tennessee
I. Introduction
TABLE OF CONTENTS
A. Purpose …………………………………………...........I-1
B. Geographic Scope……………………………………….I-1
II. Executive Summary
Scope of Work………………………………………....II-1
Geographic Study Areas……………………………….II-1
Demographics………………………………………... II-2
Housing Supply………………………………………. II-3
Housing Gap Estimates………………………………. II-5
III. Community Overview and Study Area
A. Johnson City, Tennessee……………………………….III-1
B. Study Area Delineation.………………………………..III-2
IV. Demographic Analysis
A. Introduction………………………………………....... IV-1
B. Population Characteristics………………………………IV-2
Total Population………………………………………..IV-2
Population Density………………………………….….IV-4
Population Traits (Married, Education, Poverty, etc)….IV-4
Commuting Patterns…………………………………….. IV-6
C. Household Characteristics………………………….….IV-10
Total Households……………………………………....IV-10
Households By Age…………………………………....IV-12
Households By Tenure……………………………........IV-13
Households By Size………………………………........IV-15
Households By Income………………………………...IV-17
D. Demographic Theme Maps…………………………….IV-20
V. Housing Supply Analysis
A. Overall Housing Supply……………………………… V-2
Housing By Tenure…………………………………… V-2
Housing Age and Conditions……………………….… V-3
Housing Costs and Affordability……………………... V-4
Housing by Units in Structure…………………………V-5
B. Rental Housing Supply Analysis……………………....V-7
Multifamily Rental Housing……………………..…….V-7
Non-Conventional Rental Housing……………….…...V-16
C. For-Sale Housing Supply……………………………... V-20
Historical For-Sale Analysis………………………….. V-21
Available For-Sale Analysis…………………………...V-26
D. Planned and Proposed………………………………… V-33
VI. Housing Gap Estimates
A. Housing Gap Demand Components………………….....VI-2
B. Rental Housing Gap Estimates………………………….. VI-5
C. For-Sale Housing Gap Estimates………………………VI-7
Addendum A – Phone Survey of Conventional Rentals
Addendum B – Non-Conventional Rental Survey
Addendum C – Methodology and Limitations
Addendum D – Qualifications
Addendum E – Glossary
Note: For-sale housing data and non-conventional rental data provided upon request.
I. INTRODUCTION
A. PURPOSE
The City of Johnson City, Tennessee retained Bowen National Research in January 2025 for the purpose of conducting an update to the Johnson City Housing Needs Assessment completed in 2023.
With changing demographic characteristics and trends expected over the years ahead, it is important for the local government, economic development representatives, real estate professionals, developers, investors, stakeholders and its citizens to understand the current market conditions andprojected changes that are anticipated to occur that will influence future housing needs. Toward that end, this report intends to:
• Provide an overview of present-day Johnson City.
• Present and evaluate past, current, and projected detailed demographic characteristics
• Determine current characteristics of all major housing components within the market (rental housing alternatives and for-sale/ownership).
• Provide housing gap estimates by tenure (renter or owner) and income segment.
Byaccomplishingthestudy’sobjectives, government officials, areastakeholders, and other interested parties can: (1) better understand the city's evolving housing market, (2) establish housing priorities, (3) modify, expand, or introduce local government housing policies, and (4) enhance and/or expand the city’s housing market to meet current and future housing needs.
B. GEOGRAPHIC SCOPE
Study Area Delineation
Theprimarygeographicscopeofthis study, referredto as thePrimaryStudy Area (PSA), focused on the city limits of Johnson City, Tennessee. State and national data was used, when available, as a base of comparison for selected data sets. Maps of the study areas are provided in Section III of this report.
II. EXECUTIVE SUMMARY
The purpose of this report is to update and evaluate the housing needs of Johnson City, Tennessee since the initial report provided by our firm in 2023. To that end, we conducted a Housing Needs Assessment that considers the following:
• Demographic Characteristics and Trends and Commuting/Migration Patterns
• Existing Housing Stock (Rental and For-Sale) Costs and Availability
• Quantified Housing Gap Estimates
Based on these metrics, we were able to identify housing needs by affordability and tenure (rental vs. ownership). This Executive Summary provides key findings of our analysis.
Geographic Study Area
This report focuses on the Primary Study Area (PSA), which consists of Johnson City, Tennessee. Note that the terms “PSA” and “Johnson City” represent the same area and are used interchangeably throughout this report. Additional information, when available, is provided for the state of Tennessee for comparison purposes. A map illustrating the study area is provided below
Key Findings
This study included the analysis of numerous topics and data sets. The following summarizes some of the key findings from this analysis.
Demographic Characteristics and Trends
The PSA (Johnson City) demographic base is projected to expand between 2024 and 2029, both in terms oftotal population andhouseholds. This is atrendwhichhas been ongoing since 2010. While the household base will continue to be well distributed among owner and renter households (54.8% and 45.2%, respectively) through 2029, household growth is projected to be concentrated among owner households over the next five years. Nonetheless, as more than 14,500 renter households are projected for the market through 2029, rental housing alternatives will continue to be an important component of the PSA housing stock. Although household growth projected to be concentrated among moderate to higher-income households (annual incomes of $50,000 or more) suggests that demand may increase most rapidly for moderate to higher-priced housing product in the near future, the inclusion of affordable housing alternatives within the market will continue to be important. This is particularly true among rental housing alternatives as more than half (58.0%) of renter households in the PSA are projected to earn less than $50,000 through 2029. Comparatively, the majority (51.2%) of owner households within the PSA will earn $100,000 or more.
Other notable findings from our demographic analysis are as follows:
• Higher degree of educational attainment (share of population with high school diploma and/or college degree) among PSA population as compared to the state likely increases earning potential among many area residents/households.
• Despite higher levels of educational attainment, the poverty rate within the PSA (21.7%) remains higher than that reported for the state of Tennessee (14.0%) and is even more pronounced among the population under the age of 18 (26.6%).
• Household growth is projected to occur among various age cohorts over the next five years and the PSA household base is projected to be relatively evenly distributed among households under the age of 55 (53.7%) and those over the age of 55 (46.3%) through 2029. This will contribute to ongoing demand for both general-occupancy and senior-oriented housing alternatives.
• More than 40,700 workers commute to Johnson City from outside of city limits for daytime employment, comprising approximately 77.0% of the Johnson City employmentbase.Notably,morethan7,100oftheseworkerscommutemorethan 50 miles each way. These commuters, particularly the long-distance commuters, demonstrate potential for household growth within Johnson City should housing that meets their needs become available within the city.
Overall, the significant household growth projected for Johnson City will add to the demand for additional housing over the next few years.
Housing Supply Analysis
Availability among rental alternatives within the PSA remains very limited with just 1.0% of all multifamily units surveyed being vacant and non-conventional rentals (i.e., single-family homes, mobile homes, and structures containing fewer than five units) reporting an even lower vacancy rate of 0.8%. These are both well below the 4.0% to 6.0% vacancy rate range which is typically indicative of a healthy and wellbalanced rental market. Although the number of homes available for purchase has doubled since the time of the original analysis in 2023, the 102 homes currently reported as available for purchase are reflective of a vacancy/availability rate of just 0.6% and represent less than two months supply of inventory based on recent sales trends. Typically, a healthy and well-balanced for-sale housing market will have an availability rate of 2.0% to 3.0% and an available housing stock representative of a four to six month supply of inventory. Thus, housing availability (both rental and forsale) remains very limited within the PSA which has likely created some challenges for local residents looking to relocate to a new home while also limiting household growth potential within the area as households looking to relocate to the PSA have limited options from which to choose. The following tables summarize the results of our multifamily rental housing survey, the supply of non-conventional rentals, and homes available for purchase within the PSA as of the time of this analysis.
Source: Redfin.com, American Community Survey (2019-2023); ESRI; Bowen National Research *As of January 16, 2025; **2023 estimated homes by value (includes
Additional notable findings from our housing supply analysis are summarized as follows:
• Within thePSA,30.2%ofrenter-occupiedhousing and46.6%ofowner-occupied housingwasbuiltpriorto1970.Whiletheshareofpre-1970renter-occupiedunits is very similar to the respective state share (29.1%), the share of PSA owneroccupied units built before 1970 is notably higher than the state share (26.0%).
• The PSA housing stock is generally more affordable than the state of Tennessee as a whole as the median home value ($282,185) and median gross rent ($889) levels reported are 10.0% and 15.1% lower than those reported statewide.
• Despite the lower overall housing costs, nearly 42.0% of all renter households and more than 16.0% of owner households within the PSA are housing cost burdened (paying more than 30% of their income toward housing costs). Further, 22.3% of renters and 7.6% of owners are considered severe cost burdened, in that they pay more than 50.0% of their income toward housing costs.
• The median rents among most market-rate rental units surveyed have increased significantly between 2023 and 2025. Specifically, the most common one-, two-, and three-bedroom market-rateunit typessurveyed haveexperiencedmedian rent increases ranging from 24.0% to 35.0% during this time period. These represent annual rent increases of 12.0% to 17.5%. Comparatively, median collected rents for non-subsidized Tax Credit units have increased between 18.9% and 41.2% since 2023, depending upon unit type. Nonetheless, the median rents of the Tax Credit units surveyed are between 14.4% and 66.5% lower than the median rents for similar unrestricted market-rate units surveyed in the PSA, illustrating the value of Tax Credit rents.
• The median list price of $346,250 for the 102 available homes is 8.9% lower than that reported ($380,000) for the 51 homes available for purchase at the time of our original analysis in 2023. However, it is 20.2% higher than the median sales price ($288,000) for homes sold within the PSA over the past two years. While this is a goodindication of a strong housing market, the generally increasing sales prices likely contribute to affordability challenges for many potential buyers within the market, particularly first-time buyers.
• Homes priced between $300,000 and $399,999 comprise the largest share (23.5%) of the available homes, similar to homes sold over the past two years. This suggests that moderately priced for-sale product is common and likely in demand within the PSA.
Overall, the limited availability and increasing rents and home prices demonstrate the significant residential development opportunities that exist in the market.
Overall PSA (Johnson City) Housing Needs
It is projected that the city has a five-year rental housing gap of 2,470 units and a for-sale housing gap of 3,087 units, reflective of a total housing gap of 5,557 units. The rental housing gap is distributed most heavily among product affordable to households at lower income levels (rents of $1,568 or lower) while the for-sale housing gap is distributed most heavily among product affordable to households at moderate income levels (homes priced $209,068 to $313,600). However, it is important to note that Housing Gap Estimates included in this report show a need for rental and for-sale housing product of all affordability levels within Johnson City. Details of this analysis, including our methodology and assumptions, are included in Section VI. The following table summarizes the approximate potential number of new residential units that could be supported in the PSA (Johnson City) over the next five years. PSA (Johnson City)
*Number of units assumes product is marketable, affordable and in a marketable location. Variations of product types will impact the actual number of units that can be supported. Additionally, incentives and/or government policy changes could encourage support for additional units that exceed the preceding projections.
Overall,thereis potentialsupportforavariety ofresidential development alternatives in the PSA (Johnson City). The housing demand estimates shown in this report assumenomajorchanges occurin thelocal economy andthatthedemographictrends and projections provided in this report materialize. As such, our demand estimates should serve as a baseline for development potential. Should new product be developed, it is reasonable to believe that people will consider moving to Johnson City, assuming the housing product is aggressively marketed throughout the market and surrounding region.
The estimates provided in this report (both rental and for-sale) represent potential units of demand by targeted income level. The actual number of units that can be supported will ultimately be contingent upon a variety of factors including the location of a project, proposed features (i.e., pricing, amenities/features, bedroom type, unit mix, square footage, etc.), product quality, design (i.e., townhouse, singlefamily homes, or traditional rental units), management and marketing efforts. As such, each targeted segment outlined in the preceding table may be able to support more or less than the number of units shown in the table. The potential number of supportable units should be considered a general guideline to residential development planning.
III. COMMUNITY OVERVIEWAND STUDYAREA
A. JOHNSON CITY OVERVIEW
This report focuses on the housing needs of Johnson City, Tennessee. Recognizedasacityin1856,JohnsonCityislocatedinportionsofWashington, Carter, and Sullivan counties in the upper northeast portion of Tennessee near the North Carolina border Johnson City is surrounded by portions of the Appalachian, Blue Ridge, and Great Smoky Mountain ranges. The main thoroughfares that serve Johnson City include Interstate 26, U.S. Highway 19W, U.S. Highway 321, and State Routes 36 and 381. Notably, Interstate 26 connects the Johnson City area with nearby Kingsport, Tennessee to the north, as well as the Asheville, North Carolina area approximately 60.0 miles south of Johnson City.
Johnson City contains approximately 43 square miles and is home to 73,938 people based on 2024 estimates, an increase of 3.8% from the time of the 2020 Census. Population density within Johnson City is approximately 1,715 people per square mile in comparison to the Tennessee state average of approximately 174.0 people per square mile. The household base within Johnson City is relatively evenly distributed among renters and homeowners, which comprise 47.4% and 52.6% of households in the area, respectively. Households are also well distributed by age. The majority of households (both renters and owners) are comprised of two or fewer persons and nearly 44.0% of all households earn less than $50,000 annually, though the majority (71.1%) of these lower-income households are renters.
Existingowner-occupiedhomesinthePSA(JohnsonCity)haveamedianhome value of $282,185, lower than the state of Tennessee ($313,669), while the median gross rent for the PSA is $889, also lower than the state of Tennessee ($1,047). Approximately 42.0% of renters and 16.0% of owners in the PSA are considered cost burdened in that they pay more than 30% of their income toward housing costs. A variety of existing rental housing product is offered within the PSA, in terms of affordability levels, all of which are performing well with vacancy rates not exceeding 1.2% for any individual rental housing segmentsurveyed.Similarly,for-saleproduct has limitedavailabilitywithinthe PSA as only 102 homes were identified as being available for purchase at the time of this analysis. This is reflective of an availability rate of just 0.6%. The 102 available homes are representative of less than two months (1.5 months) of supply.
Additional information regarding the city’s demographic characteristics and trends, housing supply, and other factors that impact housing are included throughout this report.
B. STUDY AREA – MARKET AREA DELINEATION
Thisreportaddressesthe residentialhousingneeds ofJohnsonCity.Tothis end, we focused our evaluation on the demographic characteristics, as well as the existing housing stock, of the Johnson City area. In order to provide an additional base of comparison, we provided data on the overall state of Tennessee and/or the United States, when applicable
The following summarizes the study area used in this analysis.
Primary Study Area – The Primary Study Area (PSA) includes the entirety of the established limits of Johnson City, Tennessee No secondary markets or submarkets were included in this analysis.
Maps delineating the boundaries of the study area are shown on the following pages.
IV. DEMOGRAPHICANALYSIS
A. INTRODUCTION
This section of the report evaluates key demographic characteristics for the Primary Study Area (PSA, Johnson City). Through this analysis, unfolding trends and unique conditions are often revealed regarding populations and households residing in the selected geographic area. Demographic comparisons between this geography and the state of Tennessee provide insights into the human composition of housing markets Critical questions, such as the following, can be answered with this information:
• Who lives in Johnson City and what are these people like?
• In what kinds of household groupings do Johnson City residents live?
• What share of people rent or own their Johnson City residence?
• Are the number of people and households living in Johnson City increasing or decreasing over time?
• How do Johnson City residents and those of the state compare with each other?
This section is comprised of population characteristics, household characteristics, and demographic theme maps. Population characteristics describe the qualities of individual people, while household characteristics describe the qualities of people living together in one residence. Demographic theme maps graphically show varying levels (low to high concentrations) of a demographic characteristic across a geographic region.
It is important to note that 2010 and 2020 demographics are based on U.S. Census data (actual count), while 2024 and 2029 data are based on calculated estimates provided by ESRI, a nationally recognized demographic firm. The accuracy of these estimates depends on the realization of certain assumptions:
• Economic projections made by secondary sources materialize.
• Governmental policies with respect to residential development remain consistent.
• Sufficient housing and infrastructure are provided to support projected population and household growth.
Significant unforeseen changes or fluctuations among any of the preceding assumptions could have an impact on demographic estimates/projections.
B. POPULATION CHARACTERISTICS
Population by numbers and percent change (growth or decline) for selected yearsis shownin thefollowingtable.It should benotedthat sometotal numbers and percentages may not match the totals within or between tables in this section dueto rounding. Positivechanges between timeperiodsin thefollowing table are illustrated in green, while negative changes are illustrated in red
Source: 2010, 2020 Census; ESRI; Bowen National Research
Between 2010 and 2020, the population within the PSA (Johnson City) increased by 10.2%, which is larger than the 8.9% growth experienced throughout the state of Tennessee during this same time period. In 2024, the total population of the PSA is 73,938, which represents a 3.8% increase in population from 2020. Between 2024 and 2029, the population within the PSA is projected to increase by an additional 2.5%, which is lower than the projected increase of 3.6% for the state over the next five years. Regardless, the trend of population growth within Johnson City is expected to continue for the foreseeable future.
It is critical to point out that household changes, as opposed to population, are more material in assessing housing needs and opportunities. Historical and projected household changes for the PSA are covered later in this section starting on page IV-10.
The following graphs illustrate population growth between 2010 and 2029.
Johnson City Population Growth Trends (2010-2029)
Population Growth Trends (2010-2029)
Johnson City Tennessee
Population densities for selected years are shown in the following table:
Source: 2010, 2020 Census; ESRI; Bowen National Research
With a population density of 1,715.5 persons per square mile in 2024, the PSA (Johnson City) is substantially more densely populated than the state (174.7 persons per square mile), overall. With a projected increase in population between 2024 and 2029, the population density within the PSA is expected to increase proportionally over the next five years.
Noteworthy population characteristics for the PSA (Johnson City) and the state of Tennessee are illustrated in the following table. Note that data included within this table is derived from multiple sources (2020 Census, ESRI, American Community Survey) and is provided for the most recent time period available for the given source.
Characteristics (Year)
Source: U.S. Census Bureau; 2020 Census; 2018-2022 American Community Survey; ESRI; Bowen National Research
As the preceding table illustrates, minorities in the PSA (Johnson City) comprise 19.4% of the overall population as compared to 27.7% within the state Within the PSA, 57.7% of the adult population is unmarried, which is a notably larger share as compared to the state (49.5%). Approximately 9.3% of the PSA population lacks a high school diploma and 45.4% has obtained a college degree. This represents a higher educational attainment level when compared to the state, where 10.7% of the population lacks a high school diploma and 37.4% has obtained a college degree. Overall, 21.7% of the population within the PSA lives in poverty, and 26.6% of the population less than 18 years of age lives in poverty. Both represent higher poverty rates than the state. The movership rate (the share of the population moving within or to a given area year over year) of the PSA is 24.1%, which is substantially higher than the 13.8% movership rate for the state. Many of these factors, particularly marital status and educational attainment, can significantly affect household income potential, which can influence overall housing affordability of an area.
The following graph compares the overall poverty rate for Johnson City and Tennessee and the shares of each population that is unmarried and that lacks a high school diploma.
Johnson City Tennessee
Commuting Inflow/Outflow
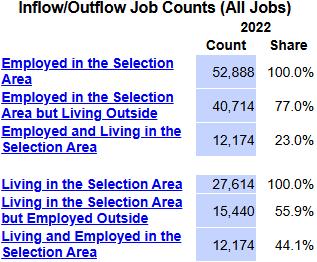
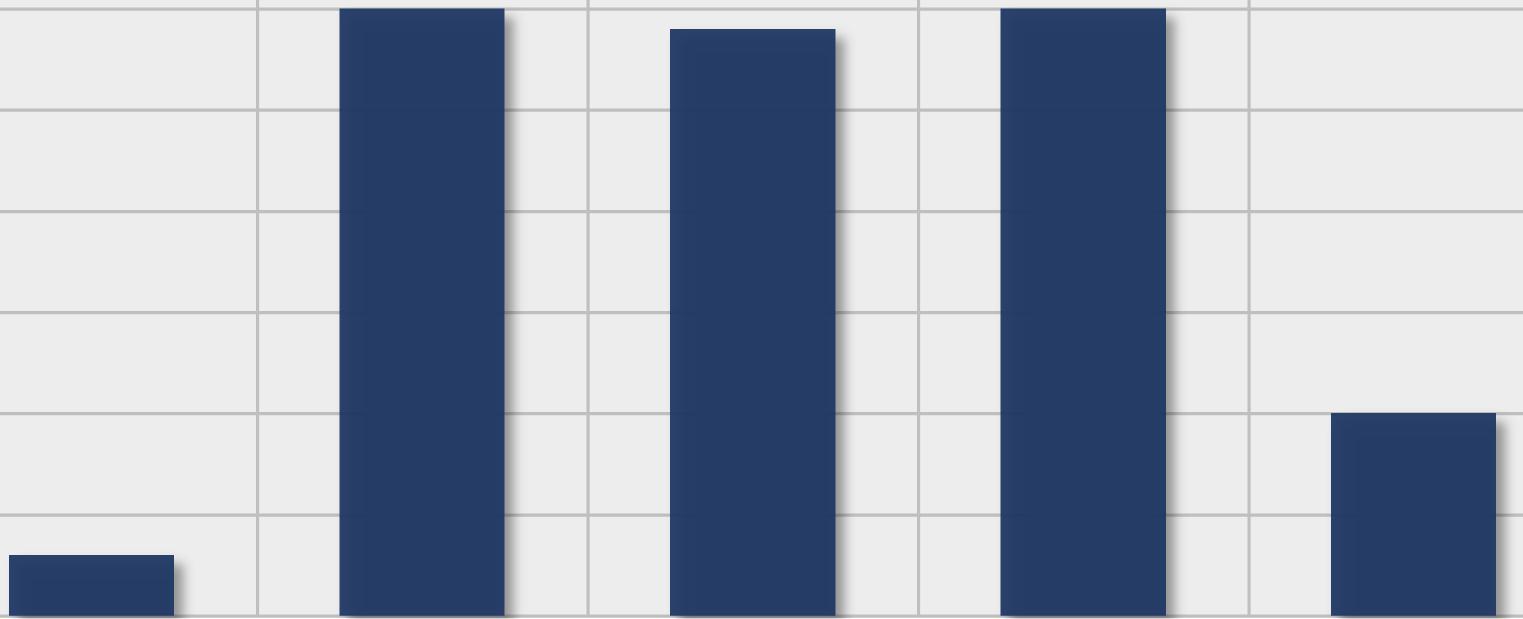
According to 2022 U.S. Census Longitudinal Origin-Destination Employment Statistics (LODES), of the 27,614 employed residents of the PSA (Johnson City), 15,440 (55.9%) are employed outside the PSA, while the remaining 12,174 (44.1%) are employed within Johnson City. In addition, 40,714 people commute into the PSA from surrounding areas for employment. These 40,714 nonresidents account for 77.0% of the people employed in the PSA and represent a significant base of potential support for future residential development. The following illustrates the number of jobs filled by in-commuters and residents, as well as the number of resident out-commuters.
Source: U.S. Census, Longitudinal Origin-Destination Employment Statistics (LODES)
Johnson City, TN – Inflow/Outflow Job Counts in 2022
Characteristics of the Johnson City commuting flow in 2022 are illustrated in the following table.
Johnson City, TN: Commuting Flow Analysis by Earnings, Age and Industry Group (2022, All Jobs)
Source: U.S. Census, Longitudinal Origin-Destination Employment Statistics (LODES) Note: Figures do not include contract employees and self-employed workers
Of the city’s 40,714 in-commuters, over one-quarter (26.8%) are 29 years of age or younger, 51.6% are between the ages of 30 and 54 years, and 21.7% are aged 55 or older. In regard to income, the largest share (46.7%) of inflow workers earn $3,333 or more per month ($40,000 or more annually). With 23.2% of outflow workers being 55 years of age or older and 49.8% earning $3,333 or more per month, outflow workers are, on average, older and earn higher wages when compared to the inflow workers in Johnson City. Given the diversity of incomes and ages of the approximately 40,700 people commuting into the area for work each day, a variety of housing products could be developed to potentially attract these inflow commuters to relocate to the PSA. A detailed analysis of the area housing market, which includes availability, costs, and product mixture is includedinSectionVofthisreport.Theoverallhealthofthelocalhousing market can greatly influence the probability of in-commuters relocating to the area.
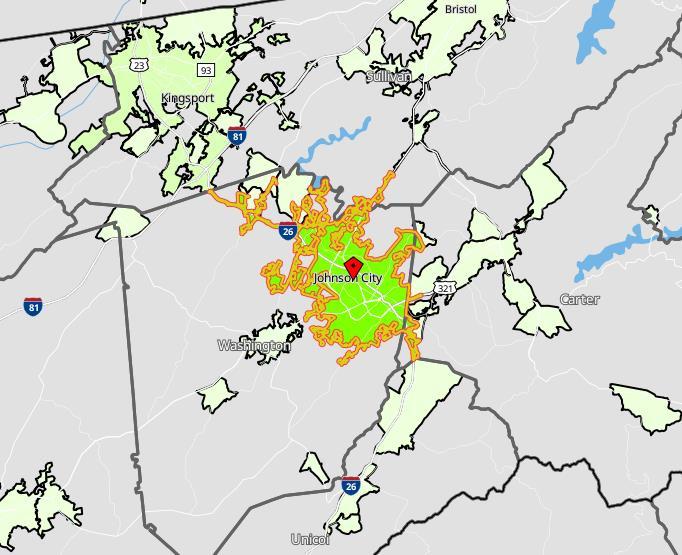
The following map and corresponding tables illustrate the physical home location of people working in Johnson City, as well as the concentration of jobs within Johnson City and the surrounding region.
Source: U.S. Census, Longitudinal Origin-Destination Employment Statistics (LODES)
Statistics provided by LODES indicate that 23.0% of the PSA (Johnson City) workforce are residents of the city. The communities of Kingsport (6.4%), Elizabethton (3.1%), and Bristol (2.5%) contribute the next largest shares of PSA workers. This is not surprising given the proximity of these areas from Johnson City. It is of note, however, that 57.9% of all Johnson City workers commute from areas not listed in the preceding table/figure. This illustrates the extentto which thePSAserves as anemployment centerfortheregion. Interms of commute distances, the largest share (46.8%) of the PSA workforce has commute distances of less than 10 miles, while 78.9% have commutes of less than 25 miles. Thus, the majority of Johnson City workers have a relatively short commute to their place of employment. Despite this, roughly 7,100 workers commute into the city from distances of more than 50 miles. These inflow workers with lengthy commutes, in particular, represent a base of potential support for future residential development
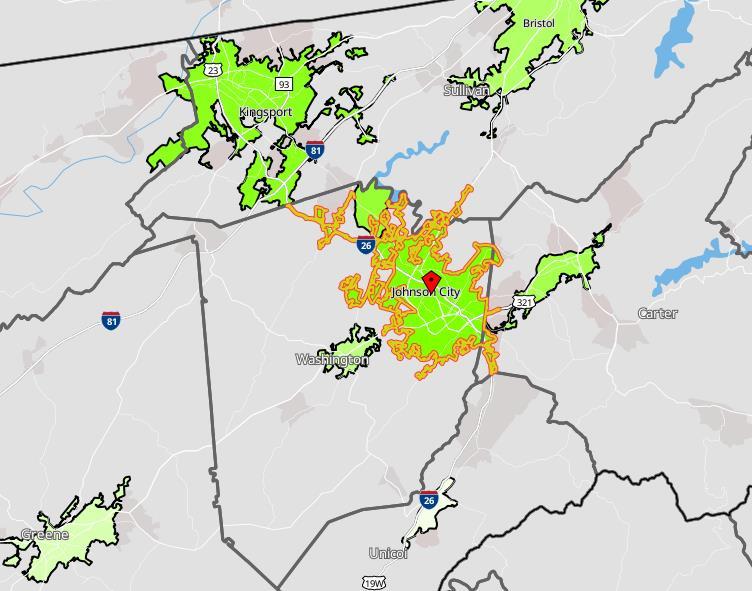
The following map and corresponding tables illustrate the physical work location of Johnson City residents, as well as the commute distances for these workers.
Source: U.S. Census, Longitudinal Origin-Destination Employment Statistics (LODES)
Of the 27,614 employed residents of the PSA (Johnson City), 44.1% are employed within Johnson City. The communities of Kingsport (9.2%), Oak Grove (4.6%), and Elizabethton (3.6%) employ the next largest shares of PSA residents. As the data illustrates, 78.3% of Johnson City residents commute less than 25 miles to work, with 59.0% of all employed residents commuting less than10milestotheirplaceofemployment.Approximately4,900PSAresidents commute more than 50 miles to work, which is a notably smaller number of such commutes when compared to inflow workers with this commute distance.
C. HOUSEHOLD CHARACTERISTICS
Households by numbers and percent change (growth or decline) for selected years are shown in the following table. Note that decreases are illustrated in red text, while increases are illustrated in green text:
Source: 2010, 2020 Census; ESRI; Bowen National Research
Between 2010 and 2020, the number of households in the PSA (Johnson City) increased 2,414 households, or 8.7%, which is a slightly smaller percentage increase than the state increase of 10.0% during this time period. In 2024, there are an estimated 31,254 households within the PSA, reflecting an increase of 3.8% between 2020 and 2024. Between 2024 and 2029, the number of households is projected to increase by 3.0%. Although this is lower than the 4.7% increase projected for the state over the next five years, the projected growth of nearly 1,000 households between 2024 and 2029 is likely to increase demand for housing within the Johnson City area for the foreseeable future.
While the number of households is projected to increase between 2024 and 2029, which will contribute to housing demand in the area, household growth or decline alone does not dictate the total housing needs of a market. Other factors that influence housing needs, which are addressed throughout this report, include households living in substandard or cost-burdened housing, pent-up demand, availability of existing housing, and product in the development pipeline.
The following graphs compare household growth between 2010 and 2029:
Johnson City Household Growth Trends (2010-2029)
Household Growth Trends (2010-2029)
Johnson City Tennessee
Household heads by age cohorts for selected years are shown in the following table.Notethatfive-yearprojecteddeclines areinred,whileprojectedincreases are in green:
Source: 2020 Census; ESRI; Bowen National Research
In 2024, households under the age of 35 comprise 26.4% of all PSA (Johnson City)households. Householdsbetweentheagesof35and54accountfor28.8% of all PSA households, and 44.8% of all PSA households are aged 55 or older. Overall, the distribution of households by age in the PSA is more heavily concentratedamonghouseholdsundertheageof35whencomparedtothestate, which has a 19.3% share of such households. This may be partially attributed to the presence of various colleges/universities in the area. Household growth between 2024 and 2029 is projected to occur among households between the ages of 35 and 44 and ages 65 and older. The most significant growth is projected to occur among households aged 75 or older, which is projected to increase by 20.9% over the next five years. This is generally consistent with statewide trends during the same time period, though moderate growth is projected for a slightly wider variety of age cohorts at the state level. Although the overall increase in the number households in the PSA will contribute to an increaseddemandforavarietyofhousingtypes,thegrowth amongseniors aged 75 and older will likely have a significant influence on demand for seniororiented housing such as independent living and senior care (assisted living and nursing care) facilities.
The following graph illustrates the projected change in households by age for the PSA (Johnson City) between 2024 and 2029
Johnson City Change in Household Heads by Age (2024-2029)
Households by tenure (renters and owners) for selected years are shown in the following table. Note that 2029 numbers which represent a decrease from 2024 are illustrated in red text, while increases are illustrated in green text.
Source: 2020 Census; ESRI; Bowen National Research
In 2024, slightly over one-half (52.6%) of households in the PSA (Johnson City) are owner households, while the remaining 47.4% are renter households. The distribution of households by tenure within the PSA is more evenly distributed when compared to the distribution for the state of Tennessee, which has a 67.0% share of owner-occupied housing units. Between 2024 and 2029, the number of owner households is projected to increase by 7.2% (1,190 households), while the number of renter households is projected to decrease by 1.6% (238 households). Although the state of Tennessee is projected to experience increases in both owner and renter households over the next five years, the moderate projected decrease in renter households in the PSA is reflective of the larger national trends projected for the time period. Nonetheless, a relatively large share (45.2%) of households will remain renters
within the PSA through 2029. It is also important to consider renter household growth could potentially outpace projections included in this analysis given the higher interest rates currently experienced in the for-sale market. Should this trendcontinue,itcouldresultinsomepotentialhomebuyersoptingtorentrather than incurring higher interest rates/home costs.
The following graphs illustrate households by tenure for the PSA (Johnson City) and the state of Tennessee for 2024 and households by tenure for the PSA for various years:
Households by Tenure (2024)
Owner-Occupied Renter-Occupied
Owner-Occupied Renter-Occupied
Johnson City Tennessee
Johnson City Households by Tenure (2020-2029)
Renter households by size for selected years are shown in the following table for the PSA (Johnson City) and the state of Tennessee Note that 2029 numbers which represent a decrease from 2024 are illustrated in red text, while increases are illustrated in green text.
Source: 2020 Census; ESRI; Bowen National Research
In 2024, nearly three-quarters (73.6%) of renter households in the PSA are either one- or two-person households, which is a notably larger share of such households compared to the statewide share (66.8%). Over the next five years, the number of renter households is projected to decrease in three out of the five sizecohorts,with themajority of thedeclineoccurring among theone-andtwopersonrenterhouseholdsizecohorts.Thiscontrastswiththeincreasesprojected in the state for one- and two-person household size cohorts between 2024 and 2029. Regardless, 73.0% of all renter households are projected to be one- and two-person households through 2029.
The following graph shows the projected change in persons per renter household for Johnson City between 2024 and 2029:
1-Person
Johnson City Change in Persons per Renter Household (2024-2029)
2-Persons
3-Persons
4-Persons
5-Persons
Owner households by size for the PSA (Johnson City) and the state for selected yearsareshowninthefollowingtable. Notethat2029numberswhichrepresent a decrease from 2024 are illustrated in red text, while increases are illustrated in green text.
Source: 2020 Census; ESRI; Bowen National Research
In 2024, slightly over two-thirds (67.6%) of owner households in the PSA are either one- or two-person households, which is a larger share compared to the statewide share of 62.7% for the two size cohorts. The larger share of one- and two-person households coincides with the larger share of younger (under age 35) households in the PSA, as compared to the state. This is true for both owner and renter households. Between 2024 and 2029, owner households are projected to increase among all size cohorts in the PSA. While the increase in five-person or larger owner households is relatively marginal, notable increases
are projected for all size cohorts from one- to four-person households in the PSA. This is consistent with statewide projections for the time period and will likely result in a substantive increase in for-sale housing demand in the PSA and state.
The following graph illustrates the projected change in persons per owner household for Johnson City between 2024 and 2029:
1-Person
Johnson City Change in Persons per Owner Household (2024-2029)
2-Persons
3-Persons
4-Persons
5-Persons
The median household income for selected years is shown in the following table:
Source: 2020 Census; ESRI; Bowen National Research
The 2024 median household income in the PSA (Johnson City) of $57,788 is 16.3% lower than the statewide median household income of $69,013 Over the next five years, the median household income in the PSA is projected to increase by 22.6%. While this is a larger projected increase than the increase projected for the state, the median household income in the PSA is projected to remain 13.2% lower than statewide median household income through 2029. This will likely contribute to ongoing demand for various affordable housing alternatives within the PSA for the foreseeable future.
The distribution of renter households by income is illustrated in the following table. Note that declines between 2024 and 2029 are in red, while increases are in green:
Source: 2020 Census; ESRI; Bowen National Research
In 2024, the largest individual share (22.4%) of renter households by income within the PSA (Johnson City) earn less than $15,000 annually. Overall, nearly two-thirds (65.9%) of renter households within the PSA earn less than $50,000 annually. This is a higher share of such households compared to that of the state (54.2%). Although the number of renter households earning less than $50,000 annually is projected to decrease within the PSA between 2024 and 2029, the majority (58.1%)ofrenterhouseholds in the PSA will continueto earnless than $50,000, and 19.5% will earn less than $15,000 annually. Conversely, all income cohorts in both the PSA and state earning more than $50,000 are projected to increase over the next five years. The continued majority share of lower-income renter households and the increase of higher-earning renter households within the PSA between 2024 and 2029 illustrates the continuing need for affordable rental options as well as the need to accommodate increasing income levels among renter households.
The following table illustrates the distribution of owner households by income. Note that declines between 2024 and 2029 are in red, while increases are in green:
Source: 2020 Census; ESRI; Bowen National Research
In 2024, nearly 45% of owner households in the PSA (Johnson City) earn $100,000 or more annually This is a slightly larger share of such households when compared to the share (42.2%) for the state. However, nearly one-quarter (24.0%)ofownerhouseholds in thePSAearnlessthan$50,000. Between 2024 and 2029, owner household growth is projected to be concentrated among households earning $50,000 or more. The most noteworthy growth (29.3%) in the PSA is projected to occur among owner households earning $150,000 or more. Although owner household growth in the PSA and state is projected to be confined to owner households earning over $50,000, a notable share (18.0%) of owner households will continue to earn less than $50,000 through 2029. While for-sale housing demand is expected to remain for affordably priced product in the PSA, demand will likely increase most rapidly for workforce and higher-priced product in the area during the projection period.
The following graph illustrates household income growth by tenure between 2024 and 2029 for the PSA (Johnson City)
Johnson City Change in Households by Tenure & Income (2024-2029)
Renter Owner
<$25,000
$25k-$34,999
$35k-$49,999
$50k-$74,999
$75k-$99,999
$100k-$149,999
$150,000+
D. DEMOGRAPHIC THEME MAPS
The following demographic theme maps for the study area are presented after this page:
• Median Household Income
• Renter Household Share
• Owner Household Share
• Older Adult Population Share (55 + years)
• Younger Adult Population Share (20 to 34 years)
• Population Density
The demographic data used in these maps is based on U S Census, American Community Survey (ACS) and ESRI data sets.
V. HOUSING SUPPLYANALYSIS
This housing supply analysis considers both rental and for-sale housing. Understanding the historical trends, market performance, characteristics, composition, and current housing choices provide critical information as to current market conditions and future housing potential. The housing data presented and analyzed in this section includes primary data collected directly by Bowen National Research and secondary data sources including American Community Survey (ACS),U.S.Censushousinginformation,anddata providedbyvariousgovernment entities and real estate professionals.
While there are a variety of housing options offered in the Primary Study Area (PSA, Johnson City), we focused our analysis on the most common housing alternatives. The housing segments included in this analysis are:
• Rental Housing – Rental properties consisting of multifamily apartments (generally with five or more units within a structure) were identified and surveyed. An analysis of non-conventional rentals (typically with four or less units within a structure) was also conducted.
• For-Sale Housing – For-sale housing alternatives, both recent sales activity and currently available supply, were inventoried. This data includes singlefamily homes, condominiums, mobile homes, and other traditional housing alternatives. It includes stand-alone product as well as homes within planned developments or projects.
For the purposes of this analysis, the housing supply information is presented for the PSA (Johnson City) and the state of Tennessee, when available.
Maps illustrating the location of various housing types are included throughout this section.
A. OVERALL HOUSING SUPPLY (SECONDARY DATA)
This section of analysis on the area housing supply is based on secondary data sourcessuch astheU.S.Census,AmericanCommunitySurvey,andESRI.Note that some small variation of total numbers and percentages within tables may exist due to rounding.
Housing Characteristics
The estimated distribution of the area housing stock by tenure (renter and owner) within the PSA and the state of Tennessee for 2024 is summarized in the following table:
Occupied and Vacant Housing Units by Tenure (2024)
Source: ESRI; Bowen National Research
In total, there are an estimated 34,226 housing units within the PSA (Johnson City) in 2024. Based on estimates, of the 31,254 total occupied housing units in the PSA, 52.6% are owner occupied, and 47.4% are renter occupied. This is a relatively balanced distribution of product by tenure within the PSA as compared to that state, where 67.0% of occupied housing units are owner occupied. Overall, 8.7% of the total housing units within the PSA are classified as vacant. As such, the PSA has a lower share of vacant housing units when comparedtothe9.5%shareforthestate. Vacantunitsarecomprisedofavariety of units including abandoned properties, rentals, for-sale, and recreational/ seasonal housing units.
In an effort to better understand the composition of the vacant housing units in Johnson City, the following table illustrates the shares of vacancies by type for the PSA based on 2023 American Community Survey (ACS) estimates:
Source: American Community Survey (2019-2023); Bowen National Research
As the preceding table illustrates, over one-half (54.6%) of all vacant housing units in the city are classified as Other Vacant. While the circumstance of these units is unknown, it is likely that some of these units consist of abandoned, blightedanduninhabitableunitsthatcouldserveas adaptivereuseorrenovation projects, or be razed (cleared) for new development. The next largest share (24.1%) of vacant units is classified as For Rent. When considering this share of vacant for-rent units along with the 4.0% share of vacant for-sale units, approximately 28.1% of all vacant units in the city are considered available for permanent residency. This relatively small share of the vacant units being availableforoccupancyis furthersupportedbythe lowvacancy and availability rates illustrated in the various sections of this analysis that follow.
The following table compares key housing age and conditions of Johnson City and the state based on 2018-2022 American Community Survey (ACS) data. Housing units built over 50 years ago (pre-1970), overcrowded housing (1.01+ persons per room), or housing that lacks complete indoor kitchens or bathroom plumbing are illustrated for the PSA and state by tenure. It is important to note that some occupied housing units may have more than one housing issue.
Housing Age and Conditions (2022)
Source: 2018-2022 American Community Survey; Census; ESRI; Bowen National Research
Within the PSA (Johnson City), 30.2% of renter-occupied housing and 46.6% of owner-occupied housing was built prior to 1970. While the share of pre-1970 renter-occupied units is very similar to the respective state share (29.1%), the share of PSA owner-occupied units built before 1970 is notably higher than the
state share (26.0%). The shares of overcrowded renters and owners within the PSA (2.5% and 0.4%, respectively) are less than the statewide shares (3.6% and 1.1%), while the shares of renters and owners with incomplete plumbing or kitchensareverycomparabletostatewideshares. Onaverage,thehousingstock in the PSA is older than housing at the state level, yet housing condition issues occur less frequently in the PSA. Despite this, there are approximately 577 renter households and nearly 100 owner households living in substandard housing, which should be a consideration of future housing priorities and efforts.
Thefollowingtablecompareskeyhouseholdincome,housingcost,andhousing affordability metrics of the PSA (Johnson City) and the state. Cost burdened households are defined as those paying over 30% of their income toward housing costs, while severe cost burdened households pay over 50% of their income toward housing.
Household Income, Housing Costs and Affordability
Source: ACS 2018-2022; ESRI; Bowen National Research *Paying more than 30% of income toward housing costs; **Paying more than 50% of income toward housing costs
The PSA’s (Johnson City) median home value of $282,185 is approximately 10.0% lower than the state’s estimated value of $313,669, and the median gross rent of$889 forthePSAis 15.1%belowthestate’s mediangrossrent of$1,047
While the PSA has slightly lower shares of cost burdened renter and owner households (41.9% and 16.1%, respectively) compared to the state, there are larger shares of severe cost burdened renter and owner households (22.3% and 7.6%) in Johnson City. This is likely due, in large part, to the lower median household income within the PSA. Regardless, there are approximately 6,201 renter households and 2,649 owner households that are housing cost burdened in the PSA. Of these, approximately 4,551 (51.4%) total households (3,300 renter and 1,251 owner) are severe cost burdened. This illustrates the importance of affordable housing, especially within the rental market, for many residents of Johnson City.
The following graph illustrates substandard housing and cost burdened households in the PSA (Johnson City):
Johnson City Substandard & Cost Burdened Households by Tenure
Renter Owner
Burdened
Based on the 2018-2022 American Community Survey (ACS) data, the following is adistributionofall occupiedhousingbyunits instructure bytenure (renter or owner) for the PSA and the state. Renter-Occupied Housing by Units in Structure
Source: American Community Survey (2018-2022); ESRI; Bowen National Research
Over one-half (54.2%) of the rental units in the PSA (Johnson City) are within structures of four units or less and mobile homes (non-conventional), while 45.8% of PSA rental units are within structures of five or more units (multifamily). Overall, the PSA has a slightly larger share of multifamily rental product compared to thestateand anotably lower shareofrental mobilehomes. While the vast majority (98.1%) of owner-occupied units are within structures of four units or less and mobile homes, the PSA has a slightly higher share (1.9%) of owner units within structures of five or more units (condominiums/townhomes) compared to the state.
The following graphs illustrate housing by units in structure by tenure for both the PSA and state.
Renter-Occupied Housing by Units in Structure (2018-2022)
4 or Less 5 or More Mobile/Other
City Tennessee
Owner-Occupied Housing by Units in Structure (2018-2022)
4 or Less 5 or More Mobile/Other
Johnson City Tennessee
Johnson
B. RENTAL HOUSING SUPPLY ANALYSIS (BOWEN NATIONAL SURVEY)
Bowen National Research conducted research and analysis of various rental housing alternatives within the PSA (Johnson City). This analysis includes multifamily and non-conventional rental housing.
1. Multifamily Rental Housing
BetweenJanuaryandFebruaryof2025,BowenNationalResearchsurveyed (by telephone) a total of 58 multifamily rental housing projects within the PSA (Johnson City). While this survey does not include all properties in the market, it does include most of the larger properties. The overall survey is considered representative of the performance, conditions and trends of multifamily rental housing in the market. Projects identified, inventoried, and surveyed operate as market-rate (non-government assisted or restricted properties) and under a number of affordable housing programs including the Low-Income Housing Tax Credit (LIHTC) program (generally serving households earning between 51% and 80% of Area Median Household Income) and various government-subsidized or HUD programs (generally serving households earning 50% or less of Area Median Household Income). Definitions of each housing program are included in Addendum E: Glossary.
This survey was conducted to establish the overall strength of the rental marketandtohelpidentifypotentialhousingneeds inthemarket. Typically, in healthy and well-balanced markets, multifamily rentals operate at an overall occupancy rate of between 94% and 96%. Overall, a total of 58 rental properties containing 4,487 units were identified and surveyed at the time of this analysis. These properties report a total of 43 vacant units, resulting in an overall occupancy rate of 99.0% (1.0% vacancy rate). This is considered an extremely high occupancy rate and demonstrates limited availability among existing rental properties within Johnson City.
The following table summarizes the surveyed multifamily rental supply within the PSA. Note, some properties operate as mixed-income (e.g., market-rate/Tax Credit) projects that concurrently serve households at various income levels. The occupancy rate for each rental housing segment at the time of our original 2023 Johnson City Housing Needs Assessment has been provided in the following table for comparability purposes.
Source: Bowen National Research
As the preceding illustrates, a variety of rental product is offered within the PSA (Johnson City) in terms of product type. All rental housing segments surveyed within the PSA are performing with strong occupancy rates of 98.8% or higher. Further, all 43 vacant units in the market are market-rate units and all affordable (i.e., Tax Credit and/or government-subsidized) units surveyed are currently 100.0% occupied (0.0% vacancy rate). The limited number of vacant units and high occupancy rates are good indications that rental product within the PSA is in strong demand across numerous affordability levels and that significant residential rental development opportunities exist in the market. This is a trend which has been consistent within the PSA since the time of the original Johnson City Housing Needs Assessment in 2023, as indicated by the high occupancy rates detailed in the preceding table.
The following table illustrates the total number of households on wait lists bypropertytypewithinthePSA,in comparison to thosereported at thetime of our 2023 survey.
Source: Bowen National Research
There are 1,155 total households on wait lists for multifamily rentals in the city. The largest numbers of households are on wait lists for the most affordable rental housing alternatives, either Tax Credit or governmentsubsidizedrentals. These wait lists demonstratethe level of pent-up demand for a variety of rental housing by affordability level. It is also of note that the total number of households on wait lists has nearly doubled since the time of our 2023 survey. However, it should be pointed out that nine more properties were surveyed at the time of our current study, as compared to 2023. Nonetheless, the substantially larger number of households on wait lists at the time of our current survey further demonstrates the level of pentup demand for multifamily product in the PSA.
Total Households on Wait Lists by Property Type (PSA)
Source: Bowen National Research
The following graph illustrates the total number of households on the multifamily rental wait lists by project type in 2023 and 2025 for the PSA (Johnson City).
Multifamily Rental Wait Lists (Households) by Project Type
2023 2025
Market-Rate Apartments
Of the 58 properties surveyed in the PSA, 44 offer (either exclusively or partially) market-rate units, with 3,529 market-rate units comprised among these properties. The following table summarizes the surveyed market-rate units by bedroom/bathroom type
The market-rate units in the PSA are 98.8% occupied (1.2% vacancy rate), reflectiveofatotal ofjust43vacant units amongthe44properties surveyed. With the exception of the three-bedroom/three-bathroom units, of which only eight areoffered, vacancyratesbyunit typedonot exceed 3.3%among the market-rate properties surveyed. When considering the variety of market-rate unit types offered, the low vacancy rates, and nominal number of vacant units, it is clear that market-rate product is in strong demand among various household sizes within the PSA.
While a variety of unit types are offered among the market-rate properties surveyed, two-bedroom units comprise nearly 60.0% of all market-rate units surveyed. One-bedroom units represent the next largest share at 28.5%. The remaining unit types surveyed (studio, three-, and fourbedroom) comprise between 0.9% and 10.3% of all market-rate units surveyed, with three-bedroom units comprising the largest share among these aforementioned bedroom/unit types. The large share of one- and twobedroom units indicates a good base of market-rate supply for smaller household sizes within the Johnson City area. This coincides with the relatively large share (73.6%) of one- and two-person renter households in the PSA. Conversely, the small share (11.2%) of three-bedroom and larger units illustrates a limited supply of market-rate product for larger households/families within the PSA.
The median rents among most market-rate unit types surveyed have increased significantly between 2023 and 2025, as detailed in the preceding table. Specifically, the most common one-, two-, and three-bedroom market-rate unit types surveyed have experienced median rent increases ranging from 24.0% to 35.0% during this time period. These represent annual rent increases of 12.0% to 17.5%, which outpace household income growth over the past few years and likely create some affordability challenges for area renters.
The following graph illustrates median market-rate rents among common bedroom types surveyed in the PSA, comparing 2023 rents with 2025 rents.
Market-Rate Median Collected Rents
Tax Credit Apartments
Projects developed under the Low-Income Housing Tax Credit (LIHTC) program, hereinafter referred to as Tax Credit, are generally restricted to households earning up to 80% of Area Median Household Income (AMHI). Such product typically serves households with greater incomes than those that reside in government-subsidized housing, though there can be some household income overlap between Tax Credit and government-subsidized housing. A listing of all surveyed properties, including mixed-income projects, is provided in Addendum A of this report.
A total of five surveyed multifamily projects in the PSA (Johnson City) offer Tax Credit units. One of these projects operates as a mixed-income property with government-subsidized units. This section focuses only on the non-subsidized Tax Credit units (units that do not have a concurrent subsidy), while the Tax Credit units operating with concurrent subsidies are discussed in the government-subsidized section of this report (starting on page V-13).
Source: Bowen National Research
The following table illustrates the distribution of non-subsidized Tax Credit units surveyed within the PSA.
Non-Subsidized Tax Credit – Johnson City, TN
The non-subsidized Tax Credit units are 100.0% occupied and all nonsubsidized Tax Credit properties surveyed maintain wait lists for their next available units (227 combined households on wait lists). A variety of unit types are offered among the non-subsidized Tax Credit properties surveyed, though two-bedroom units are the most common, comprising nearly 62.0% of the non-subsidized Tax Credit units surveyed. Conversely, one-bedroom units represent the lowest share (1.7%) of the non-subsidized Tax Credit units surveyed in the PSA. Considering the unit types offered and that all non-subsidized Tax Credit units are currently 100.0% occupied (0.0% vacancyrate),itisclearsuchproductisinstrongdemandamonghouseholds of various sizes. The lack of availability and wait lists currently maintained among these properties are evidence of an ongoing need for affordable nonsubsidized rental product within Johnson City.
Also note the median collected rents for non-subsidized Tax Credit units have increased by between 18.9% and 41.2% since 2023, depending upon unit type. As such, it appears that non-subsidized Tax Credit rents have increased at ratessimilar to thoseexperiencedamongmarket-rateproperties in the PSA over the past two years. However, it is also important to point out that the median rents of the Tax Credit units surveyed are between 14.4% and 66.5% lower than the median rents for similar unrestricted market-rate units surveyed in the PSA. This demonstrates the value nonsubsidized Tax Credit product represents within this market. The value of these units has likely contributed to the high 100.0% occupancy (0.0% vacancy) rate reported.
The following graph illustrates median non-subsidized Tax Credit rents among common bedroom types surveyed in the PSA, comparing 2023 rents with 2025 rents.
Tax Credit Median Collected Rents 2023 2025
Government-Subsidized Housing
Government-subsidized units typically serve households earning no more than 50% of Area Median Household Income (AMHI) and require tenants to pay 30% of their income toward housing costs. Generally, these properties have few amenities, are older and offer small unit sizes (square feet).
The following table summarizes the distribution of surveyed governmentsubsidized rental units (both with and without Tax Credits) in the PSA.
A total of 12 government-subsidized projects were identified and surveyed within the PSA (Johnson City) that operate under the HUD Section 8, HUD Section 202, HUD Section 811, and various other project-based subsidized programs. The subsidized units, both with and without Tax Credits, are 100.0% occupied overall. It is also of note that the subsidized properties surveyed serve various demographic segments including generaloccupancy (family), senior, and special needs households. A variety of unit types are offered among these properties, as illustrated in the preceding table. Thus, a wide variety of subsidized rental product is offered within the PSA.
All of the subsidized properties surveyed maintain wait lists for their next available units (approximately 791 combined households on wait lists), demonstrating pent-up demand for rental product that is affordable to very low-income households within Johnson City.
A map illustrating the location of all multifamily apartments surveyed within the PSA is included on the following page.
2. Non-Conventional Rental Housing
Non-conventional rentals are generally considered rental units consisting of single-family homes, duplexes, units over store fronts, mobile homes, etc. Typically, these rentals are older, offer few amenities, and lack on-site management and maintenance. For the purposes of this analysis, we have assumed that rental properties consisting of four or less units within a structure and mobile homes are non-conventional rentals. The following table illustrates the distribution of renter-occupied housing by the number of units in the structure for the PSA and the state of Tennessee.
Renter-Occupied Housing
Source: American Community Survey (2018-2022); ESRI; Bowen National Research
As the preceding table illustrates, non-conventional rentals with four or fewer units per structure and mobile homes comprise 54.2% of the local rental housing market. While this is a smaller share of non-conventional rentals as compared to the share for the state (63.3%), this type of rental unit still comprises the majority of rentals in the market. As a result, it is apparent that non-conventional rentals are a critical component of the overall rental supply in Johnson City.
The following table summarizes monthly gross rents (per unit) for area rentalalternativeswithinthePSA(JohnsonCity)andthestateofTennessee, based on American Community Survey data. While this data encompasses all rental units, which includes multifamily apartments, the majority (54.2%) of the PSA’s rental supply consists of non-conventional rentals. Therefore, it is reasonable to conclude that the following provides insight into the overall distribution of rents among the non-conventional rental housing units. It should be noted, gross rents include tenant-paid rents and tenant-paid utilities.
Estimated Monthly Gross Rents by Market
Source: American Community Survey (2018-2022); ESRI; Bowen National Research
Astheprecedingtableillustrates,thelargestshare(32.7%)ofPSA(Johnson City) rental units have rents between $750 and $999, followed by units with rents between $1,000 and $1,499 (26.1%). Collectively, units with gross rents below $1,000 account for 62.2% of all PSA rentals, which is a notably largershareofsuchunits whencomparedto thestate(43.0%). Withslightly over one-quarter of rentals having rents between $1,000 and $1,499, this demonstrates the dominance of the lower and moderately priced product among the non-conventional rental units in the market. However, there is a small share (6.3%) of rental units in the PSA with gross rents of $1,500 or higher, illustrating that some opportunities exist to achieve premium rents in the market. In addition, these units provide alternatives to home ownership for higher income residents in the PSA.
During February and March 2025, Bowen National Research identified 65 non-conventional rentals that were listed as available for rent in the PSA (Johnson City). These properties were identified through a variety of online sources and exclude short-term and vacation rentals. Through this extensive research, we believe that we have identified most vacant non-conventional rentals in thePSA.Whiletheserentals donot represent all non-conventional rentals, they are representative of common characteristics of the various non-conventional rental alternatives available in the area. As a result, these available rentals provide a good baseline to compare the rental rates, number of bedrooms, number of bathrooms, and other features of nonconventional rentals. When compared to the overall non-conventional inventory of the PSA (8,085 units), these 65 units represent an overall vacancy rate of 0.8%, which is considered low and indicates a limited supply of available non-conventional rentals.
The available non-conventional rentals identified in the PSA (Johnson City) are illustrated and summarized in the following table.
Four-Bedroom+
Total 65
Source: Homes.com; ForRent.com; Zillow; Trulia; Bowen National Research
Theavailable non-conventional rentals identified inthePSA(Johnson City) have individual rents ranging from $750 to $4,000 Three-bedroom units, which comprise the largest individual share (40.0%) of the available units in the PSA, have a median rent of $1,800. When typical tenant utility costs (at least $200) are also considered, the inventoried non-conventional threebedroom units have a median gross rent of approximately $2,000. Twobedroom units, which comprise the second largest share (30.8%) of the available non-conventional rentals have a median rent of $1,500 ($1,700 grossrent).Bycomparison,themostcommonmarket-ratemultifamilyunits in the PSA have median collected rents of $1,439 (two-bedroom/twobathroom) and $1,565 (three-bedroom/two-bathroom). As such, the typical non-conventional rentals in the PSA have moderately higher median rents than the typical multifamily market-rate units surveyed in the area. This can create housing cost burden situations for lower income residents
Based on this analysis, it is clear that non-conventional rentals are a critical component in the PSA rental market, though they typically capture a higher rent than the comparable multifamily market-rate units. Regardless, the availableinventoryof non-conventional rentals is verylimited. This further limits the number of available options for area households and can contribute to both overcrowding and cost burden issues.
A map illustrating the location of identified non-conventional rentals currently available to rent in the PSA (Johnson City) is included on the following page.
C. FOR-SALE HOUSING SUPPLY
1. Introduction
Bowen National Research obtained for-sale housing data from a Multiple Listing Service (MLS) provider for the PSA (Johnson City). This included historical for-sale residential data and currently available for-sale housing stock. While this sales data does not include all for-sale residential transactions or supply in Johnson City, it does consist of the majority of such product and therefore, is representative of market norms for for-sale housing product in the city. The available supply does not include foreclosures, auctions, or for-sale by owner housing.
The following table summarizes the available and recently sold homes for Johnson City: Available/Sold For-Sale Housing Supply - Johnson City, TN
Source: Redfin.com & Bowen National Research
*As of January 16, 2025
**Sales from January 1, 2023 to December 31, 2024
***Sales from July 25, 2022 to January 19, 2023
Within the PSA (Johnson City), 1,586 homes were sold between January 1, 2023 and December 31, 2024 at a median sales price of $288,000. This equatesto an averageofapproximately 66homessold permonth duringthis time. The available for-sale housing stock within the PSA consists of 102 homes with a median list price of $346,250.
2. Historical For-Sale Analysis
Through the Multiple Listing Service, 1,586 housing units were identified within the PSA (Johnson City) that were sold between January 1, 2023 and December 31, 2024. The recently sold for-sale product within the city primarily consists of single-family homes (79.0%) while the remaining homes sold during this time period were a combination of condominiums, townhomes and mobile/manufactured homes. While there were likely other for-sale residential units sold during this time period, the product identified in this analysis provides a good baseline for evaluating the for-sale housing alternatives offered in the city
Thefollowingtableillustratestheannualsalesactivityfrom January1,2023 to December 31, 2024 for the PSA (Johnson City).
Sales History by Year - Johnson City, TN (January 1, 2023 to December 31, 2024)
Source: Redfin.com & Bowen National Research
The number of homes sold within the PSA (Johnson City) increased by 6.8% between 2023 and 2024. During this time period, the median sales price also increased by 7.3%. These are good indications of the strength of the for-sale housing market within the PSA over the past two-year period.
The following graph illustrates the annual sales activity for the PSA (Johnson City) from January 1, 2023 to December 31, 2024.
The distribution of homes recently sold by price point for the PSA (Johnson City) is summarized in the following table
Sales History by Price – Johnson City, TN (January 1, 2023 to December 31, 2024)
Source: Redfin.com & Bowen National Research
As the preceding illustrates, homes priced between $300,000 and $399,999 representedthelargestshare(21.6%)ofhomessoldwithinthePSAbetween January2023andDecember2024.Whilethenotableshare(25.9%)ofhome sales at $400,000 or higher indicates that some higher-priced product is offered and pricing premiums are achievable within the area, it is important to point out that nearly three-quarters (74.1%) of the homes sold since January2023werepricedbelow$400,000.Thisdemonstratesthatmoderate to lower-priced for-sale product is prominent and likely in demand within the PSA.
The distribution of recent (January 2023 to December 2024) home sales by price point within the PSA (Johnson City) is illustrated in the following graph.
Johnson City Sales History by Price
Recent home sales by year built for Johnson City are summarized below.
Source: Redfin.com & Bowen National Research
The largest share (16.6%) of homes sold during this time period were built prior to 1950. As expected, these older homes also had the lowest median sales price ($198,000) of any year built segment illustrated in the preceding table. Further, nearly half (47.0%) of the recently sold homes in Johnson City were built prior to 1980, demonstrating that older homes represent a large share of for-sale product within this market. However, nearly 12.0% of the recently sold homes were built within the past four years and nearly 18.0% were built since 2010. Thus, modern for-sale product also exists within the PSA.
Note that the median sales price and median price per square-foot for the newest homes sold over the past two years are lower than those for many older homes which have sold during this time period. However, this is at least partially attributed to many smaller (under 1,500 square feet) homes recently built/sold within the PSA, as such homes comprise nearly half (44.9%) of all homes built since 2020 that have sold over the past two years. Notably, nearly half (41.0%) of these smaller homes were condominium or townhome-style units.
The distribution of recent (January 2023 to December 2024) home sales by year built within the PSA (Johnson City) is shown in the following graph:
Johnson City Sales History by Year Built
A map illustrating the location of all homes sold between January 2023 and December 2024 within Johnson City is included on the following page.
3. Available For-Sale Housing Supply
Based on information provided by a Multiple Listing Service provider for the PSA (Johnson City), 102 housing units were identified within Johnson City that were listed as available for purchase as of January 16, 2025. Of the102 activelistings, 79(77.5%)werelistedas single-family homes,while the remaining were classified as condominiums or townhomes. While it is likely that additional for-sale residential units are available for purchase in the city, such homes were not identified during our research due to the method of advertisement or simply because the product was not actively marketed. Regardless, the available inventory of for-sale product identified in this analysis provides a good baseline for evaluating the for-sale housing alternatives offered in Johnson City
There are two inventory metrics most often used to evaluate the health of a for-sale housing market. This includes Months Supply of Inventory (MSI) and availability rate. Overall, based on the monthly sales rate of 66 homes, the 102 homes listed as available for purchase represent less than two months (1.5 months) of supply. Typically, healthy and well-balanced markets have an available supply that should take about four to six months to absorb (if no other units are added to the market). The PSA’s inventory is considered low and indicates limited available supply. When comparing the 102 available units with the overall inventory of 16,454 owner-occupied units, the PSA has a vacancy/availability rate of 0.6%, which is considerably lower than the healthy range of 2.0% to 3.0% for a wellbalanced for-sale/owner-occupied market. This further demonstrates limited available for-sale supply within the PSA. To gain a better understandingofhousingavailabilityinthePSA,wehaveconductedamore refined analysis of available supply by price point, bedroom type, and year built.
The following table compares the total available for-sale inventory and median list price for the city currently (2025) and from the time of our original analysis (2023).
Source: Redfin.com & Bowen National Research
As the preceding table illustrates, the current (2025) inventory of for-sale housing consists of 102 units. The number of homes available for purchase is double that reported (51) as available at the time of our last analysis in 2023. Although the median list price declined by nearly 9.0% since 2023, it is of note that nearly one-quarter (22.5%) of the currently available homes are townhomes/condominiums and nearly 30.0% of all currently available homes (regardless of design/type) are less than 1,500 square feet in size.
Available For-Sale Housing Overview – Johnson City, TN
Further, more than half (52.0%) of all available homes were built prior to 1980. These metrics are all higher than those reported during our initial analysis in 2023 andlikelycontributeto thelower medianlist price reported in 2025. In addition to the preceding factors, rising interest rates also likely contribute to the lower median list price. Regardless, the median list price of$346,250foravailable homesis 20.2%higherthanthemedian sales price ($288,000) for homes sold within the PSA over the past two years. While this is agoodindication ofastronghousingmarket,thegenerallyincreasing sales prices likely contribute to affordability challenges for many potential buyers within the market, particularly first-time buyers.
The following table summarizes the distribution of currently available forsale residential units by price point within Johnson City, in comparison to the number of available homes at the time of our original analysis in 2023:
Available For-Sale Housing by Price - Johnson City, TN (As of January 16, 2025)
Source: Redfin.com & Bowen National Research
With the exception of homes priced between $500,000 and $749,999, the available inventory has increased among all price ranges since the time of our original analysis in 2023. Nonetheless, no more than 24 homes are available within any given price point, demonstrating a limited base of available supply among all affordability levels. As of January 2025, homes priced between $300,000 and $399,999 comprise the largest share (23.5%) of the available homes, similar to homes sold over the past two years. This suggests that moderately priced for-sale product is common and likely in demand within the PSA. Typically, a $300,000 home is considered affordable to households that earn at least $80,000 annually. Although more than half (55.6%) of all owner households in the PSA are estimated to earn an income of this level, the relatively small total number/share of available homes priced below $300,000 demonstrates a very limited supply of available homes that would be affordable to the majority of owner households in this market.
The following table details the availability rate of the for-sale housing inventory by price point based on the number of owner-occupied housing units by estimated value for the PSA.
Housing Availability Rate by Price – Johnson City, TN
Source: Redfin.com, American Community Survey (2019-2023); ESRI; Bowen National Research
*As of January 16, 2025
**2023 estimated homes by value (includes homes for which values could be determined)
The overall availability rates by price point in 2025 range from 0.1% to 3.3% for the various list price/home value cohorts in the PSA (Johnson City). Homes with a list price/value less than $250,000 and those priced between $500,000 and $749,999 have the availability rates of less than 1.0%, while homes with list prices/values between $250,000 and $499,999 have availability rates ranging from 1.0% to 1.2%. The highest availability rate(3.3%)is among homespriced $750,000orhigher. Regardless, all other availability rates by price range are below the optimal range of between 2% and 3%. While the availability rate in six of the eight price/value cohorts has increased since 2023, the availability of for-sale product remains limited The very limited available supply of lower-priced homes in the city indicates lower-income households in the area have the greatest challenge in terms of locating affordable for-sale homes in the PSA.
The inventory of available for-sale residential housing units by price point in the city is shown in the following graph, comparing 2023 numbers with 2025 numbers:
Johnson City Available For-Sale Housing by Price 2023 2025
The available for-sale housing by bedroom type within Johnson City is summarized in the following table:
Available For-Sale Housing by Bedrooms - Johnson City, TN (As of January 16, 2025)
Within the PSA (Johnson City), two-, three-, and four-bedroom homes comprise between 28.4% and 29.4%, each. Collectively, these bedroom types comprise 87.2% of all available for-sale units in the PSA. Among these bedroom types, the median list price ranges from $235,750 (twobedroom) to $434,950 (four-bedroom). While the average square footage of these homes increases with the number of bedrooms, the average year built for all three bedroom types is very similar (1974 to 1976). The average number of days on market in the PSA for the various bedroom configurations is 100 days or less, which indicates demand is strong for a variety of bedroom types. When compared to the available inventory in 2023, there are currently more available for-sale homes within each bedroomtypein thePSA,andwhilethemedianpricehas increased forthree
Redfin.com &
bedroom types, the median prices have decreased for the three- and fourbedroom homes. Note the larger number/share of smaller two-bedroom homes is reflective of numerous condominium and townhome listings in the PSA, as such homes comprise approximately 60% of the two-bedroom homes currently available in the PSA.
The distribution of available (as of January 2025) homes by bedroom type within the PSA (Johnson City) is shown in the following graph:
Johnson City Available For-Sale Housing by Bedrooms
Homesbuiltpriorto1950andhomesbuiltbetween2000and2009represent the largest shares (24.5%, each) of the available homes within the PSA (Johnson City). Newer built product (homes built since 2010) represents just 8.8% of all available homes, a decline from the 15.7% share of such available homes in 2023. Considering the prices per square foot ranging from $226.02 to $235.90, it is clear that modern for-sale product does command a pricing premium within the PSA. However, when considering that only nine of the available homes were built since 2010, a very limited supply of such product is available in the area, much of which is higher priced product as only one of the nine newer properties currently available is priced below $400,000.
Although the data illustrates that the median list price for some year-built cohorts has increased since 2023 while others have decreased, there are more homes available in nearly every year built cohort. This is a positive trend for the PSA and indicates that while availability remains limited, forsale options available to homebuyers in the area have increased over the last two years.
The distribution of available (as of January 2025) homes within the PSA (Johnson City) by year built is shown in the following graph:
A map illustrating the location of available for-sale homes within Johnson City is included on the following page.
Johnson City Available For-Sale Housing by Year Built
D. PLANNED & PROPOSED
In order to assess housing development potential, we evaluated recent residential building permit activity and identified residential projects in the development pipeline within Johnson City. Understanding the number of residential units and the type of housing being considered for development in the market can assist in determining how these projects are expected to meet the housing needs of the area.
The following tables illustrate single-family and multifamily building permits issued within Johnson City and Washington County for the most recent 10-year period available:
Source: SOCDS Building Permits Database at https://socds.huduser.gov/permits/
Source: SOCDS Building Permits Database at https://socds.huduser.gov/permits/
Of the 3,141 housing permits issued in the PSA (Johnson City) between 2014 and 2023, 1,910 (60.8%) were single-family permits and 1,231 (39.2%) were multifamily permits. This equates to an annual average of 314 total residential permits during the time period. While only six multifamily permits were issued in the PSA in 2021 and 2022, there were 161 issued in 2023. Among singlefamily permits, there was a relatively consistent number of permits issued between 2021 and 2023, ranging from 210 to 241 each year. While not specific to the PSA, it is noteworthy that four of the top five years in terms of total residential permits issued in Washington County occurred between 2020 and 2023. This indicates there has been notable residential construction activity in the general area over the past few years.
Residential Housing Development
Despite multiple attempts, we were unable to receive a response from local planning representatives regarding currently planned/proposed residential projects within the PSA (Johnson City). However, through extensive online research multiple residential projects were identified as either being planned or proposed for development within the PSA. These projects are summarized as follows. Note that additional projects may have been introduced into the pipeline or the status of existing projects may have changed since the time research was completed.
Multifamily Rental Housing
The following summarizes the known details for the multifamily rental housing projects that are planned, proposed, or under construction within the PSA.
Multifamily Rental Housing Development – Johnson City, TN Project
Universal at Mountainview
1193 West Mountainview Road Market-rate 324
Universal Development and Construction
Reserve at Johnson City II 1048 West Oakland Avenue
Tapestry at Roan Hill 2162 South Roan Street
Suncrest Townhouses
Gray Station Road & Gray Commons Circle Market-rate 108 Joe Wilson
Burlington Park 2203 McKinley Road Market-rate 800 Sound Management
Under Construction: One-bedroom apartments; Two- and three-bedroom townhomes; Three-bedroom homes; Preleasing units that are estimated to open in June 2025 through 2026
Under Construction: Phase II will consist of one- to three-bedroom units; Current rents for Phase I range from $1,509 to $2,094 and at time of this study was 100% occupied; ECD for Phase II is 2025
Under Construction: Allocated 2023; Redevelopment of John Sevier Center apartments; Studio and one-bedroom units; Senior (age 62+) and/or disabled population; ECD late 2025
Planned: Two- and three-bedroom townhomes; Rent for two-bedroom unit estimated at $1,600 and three-bedroom unit at $1,900; ECD fall 2025
Proposed: Mixed-use with up to 800 multifamily units; Rezoning request approved but must be approved for a third time before taking effect N/A Nave Drive N/A N/A Vinh Mai
ECD – Estimated completion date
N/A – Not available
Proposed: Concept plan and rezoning submitted 2024; No other information available at the time of this study
As indicated by the preceding table, there are three multifamily rental projects currently under construction, one in the planning phase, and two more which are proposed. The projects currently under construction will comprise a total of 757 units, of which 612 are market-rate units and 145 are subsidized Tax Credit units. The subsidized Tax Credit project, which entails the redevelopment of existing apartments, will serve seniors aged 62 and older and/or individuals with disabilities. It should be noted that all three of these projects under construction have at least partial completion dates during 2025. In addition, there are 108 market-rate units currently in the planning phase. Given that multifamily rental occupancy rates in the PSA are very high, these developments will likely be well received in the market.
For-Sale Housing
The following summarizes the known details for the for-sale housing projects that are planned, proposed, or under construction within the PSA.
For-Sale Housing Development – Johnson City, TN Project Name & Address
Cottages at Boone Falls 105 Klm Drive Condominium N/A
Clearwater Springs 1035 Clearwater Lane Single-family 77
Rogers Development, LLC
Conservus Homes
Horton
Under Construction: Four-bedroom homes from $800,000 to$1.3 million;Most lots sold; Lots from $93,000
Under Construction: Two to three bedrooms; Homes from $400,000 to $425,000; Square feet from 1,473 to 1,630; Two homes available at the time of this study
Under Construction: Three to five bedrooms; Homes from $250,000 to $325,000; Square feet from 1,183 to 2,361 N/A
Planned: Rezoning approved in late 2024; To include 96 single-family homes and 88 duplexes/townhomes; Eight apartments are also planned along with 10 single-family rental cabins
Proposed: Keeblerpropertywasannexedinto Johnson City limits in spring 2023; Could include up to 361 single family homes and 133 townhomes; No further updates available at the time of this study
Proposed: Concept plan submitted 2024
Proposed: Originally rezoned for 30 singlefamily homes then amended to 44; In early 2025 new owner requested to be zoned for nine single-family homes
Landstar Development Proposed: Concept plan submitted 2024
Single-family 25 N/A
Single-family 118
Proposed: Additional lots in existing subdivision; Submitted plat in 2024
Proposed: Johnson City Regional Planning Commission approved in spring 2024 N/A – Not available
N/A
A total of 10 for-sale housing projects are currently in various stages of the development pipeline within the PSA (Johnson City). Three projects are currently under construction, and one is currently in the planning phase. The projects currently under construction or in planning consist of at least 298 units and include a mixture of single-family, duplex, and townhomes/condominiums. There are six additional projects currently proposed within the PSA, some of which are located in areas that have been recently rezoned for residential use or in areas that have been annexed into the PSA. These projects are expected to help meet a portion of the PSA’s housing needs in the near future.
VI. HOUSING GAP ESTIMATES
INTRODUCTION
This section of our report provides five-year housing gap estimates for both rental and for-sale housing within the PSA (Johnson City). The assessment includes demand from a variety of sources and focuses on the housing demand potential of Johnson City, though consideration is given to potential support that may originate from outside the PSA.
Housing to meet the needs of both current and future households in the market will most likely involve multifamily, duplex, and single-family housing alternatives. There are a variety of financing mechanisms that can support the development of housing alternatives such as federal and state government programs, as well as conventional financing through private lending institutions. These different financing alternatives often have specific income and rent/price restrictions, which affect the market they target.
We evaluated the market’s ability to support rental and for-sale housing based on four levels of income/affordability. While there may be overlap among these levels due to program targeting and rent/price levels charged, we have established specific income stratifications that are exclusive of each other in order to eliminate double counting demand. We used HUD’s published income limits for the Johnson City, Tennessee MSA.
The following table summarizes the income and housing affordability segments used in this analysis to estimate potential housing demand.
* Based on HUD limits for the Johnson City, Tennessee MSA (4-person limit)
*** Based on assumption tenants pay up to 30% of income toward rent
^Based on assumption homebuyer can afford to purchase home priced three times annual income after 10% down payment
While different state and federal housing programs establish income and rent restrictions for their respective programs, in reality, there is potential overlap between windows of affordability between the programs. Those who respond to a certain product or program type vary. This is because housing markets are highly dynamic, with households entering and exiting by tenure and economic profile. Further, qualifying policies of property owners and management impact the households that may respond to specific project types. As such, while a household may prefer a certain product, ownership/management qualifying
procedures (i.e., review of credit history, current income verification, criminal background checks, etc.) may affect housing choices that are available to households.
Regardless, we have used the preceding income segmentations as the ranges that a typical project or lending institution would use to qualify residents, based on their household income. Ultimately, any new product added to the market will be influenced by many decisions made by the developer and management. This includes eligibility requirements, design type, location, rents/prices, amenities, and other features. As such, our estimates assume that the rents/prices, quality, location, design, and features of new housing product are marketable and will appeal to most renters and homebuyers.
A. HOUSING GAP DEMAND COMPONENTS
The primary sources of demand for new housing (rental and for-sale) include the following:
Household Growth
Units Required for a Balanced Market
Replacement of Substandard Housing
External (Outside Johnson City) Commuter Support
Severe Cost Burdened Households
Step-Down Support
Since the focus of this report is on the specific housing needs of the PSA (Johnson City), we have focused the housing demand estimates on the metrics that only impact this area. Note that severe cost burdened households were not included as a demand component in our original analysis. Thus, the housing gap estimates included in this update analysis differ slightly from those initially provided.
New Renter Household Growth
In this report, household growth projections from 2024 to 2029 are based on ESRI estimates. This projected growth was evaluated for each of the targeted income segments. It should be noted that changes in the number of households within a specific income segment do not necessarily mean that households are coming to or leaving the market, but instead, many of these households are likely to experience income growth or loss that would move them into a higher or lower income segment. Furthermore, should additional housing become available, either through new construction or conversion of existing units, demand for new housing could increase.
Units Required for a Balanced Market
The second demand component considers the number of units a market requires to offer balanced market conditions, including some level of vacancies. A healthy rental market requires approximately 4% to 6% of the rental market to be vacant, while a healthy for-sale housing market should have approximately 2% to 3% of its inventory available. Such vacancies allow for inner-market mobility, such as households upsizing or downsizing due to changes in family composition or income, and for people to move into the market. When markets have too few vacancies, rental rates and housing prices often escalate at an abnormal rate, homes can get neglected, and potential renters and/or homebuyers can leave the market. Conversely, an excess of rental units and/or for-sale homes can lead to stagnant or declining rental rates and home prices, property neglect, or existing properties being converted to rentals or for-sale housing. Generally, markets with low vacancy rates often require additional units, while markets with high vacancy rates often indicate a surplus of housing. For the purposes of this analysis, we have utilized a vacancy rate of 5% for rental product and 3% for for-sale product to establish balanced market conditions.
Replacement of Substandard Housing
Demand for new units as replacement housing takes into consideration that while some properties are adequately maintained and periodically updated, a portion of the existing stock reaches a point of functional obsolescence over time and needs to be replaced. This comes in the form of either units that are substandard (lacking complete plumbing and/or are overcrowded) or units expected to be removed from the housing stock through demolitions. Based on demographic data included in this report, approximately 2.5% of renter households and 0.4% of owner households in the PSA (Johnson City) are living in substandard housing (e.g., lacking complete plumbing or are overcrowded). Lower income households live in substandard housing conditions more often than higher income households, which we have accounted for in our gap estimates. While we recognize that households living in substandard housing units are housed, such households have been considered in our demand estimates as our estimates are reflective of the PSA’s needs to address all housing needs/deficiencies within the city.
External Commuter Support
Market support can originate from households not currently living in the market. This is particularly true for people who work in Johnson City but commute from outside of the city and would consider moving to Johnson City, if adequate and affordable housing that met residents’ specific needs was offered. Currently, there is a limited supply of available housing options in the market. As such, external market support will likely be created if new housing product is developed in Johnson City.
Based on our experience in evaluating housing markets throughout the country, it is not uncommon for new product to attract as much as 50% of its support from outside of city limits. As a result, we have assumed that a portion of the demand for new housing will originate from the 40,714 commuters traveling into the PSA (Johnson City) from areas outside of city limits. For the purposes of this analysis, we have used a conservative demand ratio of up to 10% for the PSA to estimate the demand that could originate from outside of Johnson City.
Severe Cost Burdened Households
HUD defines severe cost burdened households as those paying 50% or more of their household income toward housing costs. While such households are housed, the disproportionately high share of their income being utilized for housing costs is considered excessive and often leaves little money for impacted households to pay for other essentials such as healthy foods, transportation, healthcare, and education. Therefore, households meeting these criteria were included in our estimates.
Step-down Support
It is not uncommon for households of a certain income level (typically higher income households) to rent or purchase a unit at a lower price point despite the fact they can afford a higher priced unit/home. Using housing cost and income data reported by American Community Survey (ACS), we have applied a portion of this step-down support to lower income demand estimates. In some instances, step-down support constitutes a large portion of total demand, as upwards of 80% or 90% of households with moderate and higher incomes within a given area pay less than 30% of their income toward housing costs.
Development Pipeline
Residential housing within the development pipeline is another important factor to consider in determining the housing needs of Johnson City. Based on our research, it was determined that there are multiple rental housing projects planned for the PSA. Those which are known to have been approved and moving forward with development have been considered within this analysis. Note that while multiple for-sale housing developments are planned for the area, only those that are known to have been approved and moving forward with development have been considered in our demand calculations. Properties/projects for which detailed pricing/unit count information was not available were excluded from our demand estimates. Further, lots/parcels planned for single-family home development were not considered in our demand estimates as these lots/parcels do not currently have confirmed buyers and may not ultimately be developed. However, it will be important for local government officials, developers, lenders, and other end users of this report to continue to monitor development progression of the planned
and proposed for-sale single-family home developments following the issuance of this Housing Needs Assessment.
It is also important to understand that the housing gap estimates contained within this report are representative of the needs to cure all housing deficiencies within the city. Specifically, these estimates demonstrate the total number of new and rehabilitated housing units required over the fiveyear projection period (2024 to 2029) to meet the demands of the market based on the demand components detailed on the preceding pages. These estimates also assume that a wide variety of product (both rental and for-sale) is developed within each income segment, in terms of unit designs, bedroom type, amenities offered, etc. throughout all portions of the city. We recognize it is unlikely the number of units needed as calculated by our demand estimates will be developed during the projection period due to infrastructure limitations, governmental policies, funding availability, etc. As such, the following housing gap estimates should be utilized as a guide for future development to determine the greatest need by affordability level within the rental and for-sale segments within the city’s housing market.
B. RENTAL HOUSING GAP ESTIMATES
The following table summarizes the rental housing gaps for Johnson City by affordability level.
*Based on Bowen National Research’s survey of area rentals and ACS estimates
**Based on ESRI/ACS estimates of units lacking complete indoor plumbing or are overcrowded
^Based on Bowen National Research proprietary research and LODES commuting patterns for Johnson City
^^Based on ESRI/ACS estimates of households paying 50% or more of income toward housing
Based on the preceding demand estimates, there is some level of rental housing demand among all household income levels within Johnson City over the five-year projection period. Overall, there is a housing need for 2,470 additional rental units over the next five years. The housing gaps range from a low of 190 units needed to serve households earning 121% of AMHI or higher (rents of $2,353 or higher) to a high of 1,014 units needed for households earning up to 50% of AMHI (rents of $980 or lower). Without the
addition of new rental product similar to the numbers cited in the preceding table, the area will not meet the growing and changing housing needs of the market.
Based on the demographics of the market, including projected household growth estimates and changes in household compositions (e.g., household size, ages, etc.), it appears that approximately 25% to 35% of demand for new rental housing could be specifically targeted to meet the needs of area seniors, though a project could be built to meet the housing needs of both seniors and families concurrently. For general-occupancy projects, a unit mix of around 35% to 45% one-bedroom units, 40% to 50% two-bedroom units, and 15% to 20% three-bedroom units should be the general goal for future rental housing. While rental units of various bedroom configurations could be supported within the market it is important to point out that larger (threebedroom or larger) units are relatively limited in supply within the PSA as such units comprise just over 13.0% of multifamily rental units currently offered in the PSA. Senior-oriented projects should consider unit mixes closer to 50% for both one- and two-bedroom units each.
While available land, along with topographical challenges and access to infrastructure (e.g., water and sewer) may limit where and how much housing product can be added to the market, we believe high-density multifamily product would do well in this market, particularly on sites closer to some of the more walkable and densely populated areas of the city. However, multifamily product would also likely do well outside of these areas, provided the site(s) have convenient access to primary thoroughfares and area services. Currently, multifamily rentals within the PSA are primarily comprised of traditional garden/flat style apartments as such units comprise more than three-quarters (76.6%) of all rental units surveyed. The remaining units are primarily townhome style units. When considering that these two product types report overall occupancy rates of 98.9% and 99.4%, respectively, both have clearly been well-received and should be considered in future rental housing development plans within the PSA. Some lower density, single-story duplexes, four-plexes, etc., could also be well received, particularly among seniors seeking to downsize from larger units, as well as homeowners seeking a more maintenance-free residence. Additional details of the area’s rental housing supply are included in Section V and may serve as a guide for future rental housing development design decisions.
C. FOR-SALE HOUSING GAP ESTIMATES
The following table summarizes the for-sale housing gaps for Johnson City by affordability level.
*Based on MLS inventory of available homes
**Based on ESRI/ACS estimates of units lacking complete indoor plumbing or are overcrowded
^Based on Bowen National Research proprietary research and LODES commuting patterns for Johnson City
^^Based on ESRI/ACS estimates of households paying 50% or more of income toward housing
The overall for-sale housing gap in the PSA (Johnson City) is approximately 3,087 units over the five-year projection period. While all home price segments and affordability levels have some level of need, the greatest gap appears to be for product serving households earning between 81% and 120% of AMHI (homes priced between $209,068 and $313,600). The second greatest gap is for product serving households earning 121% of AMHI or higher (homes priced $313,601 or higher), though a similar gap exists for product serving households earning between 51% and 80% of AMHI (homes priced between $130,668 and $209,067). Thus, for-sale product is in need among households of various income levels within the city. It is also of note that as some buyers will “step down” to a lower price point, the inventory of for-sale product which may be affordable to lower and moderate-income households will diminish. This may place greater pressure on the market’s lower priced product and create greater challenges for lower income households and first-time homebuyers who already have limited housing alternatives that are affordable to them.
In most markets, if there is support for new housing at a particular price point or concept and such product is not offered in a specific area, households may leave the area to seek this housing alternative elsewhere, defer their purchase decision, or seek another housing alternative. Additionally, households considering relocation to the PSA (Johnson City) may not move to the PSA if the housing product offered does not meet their needs in terms of pricing, quality, product design, and/or location. As such, the PSA housing stock may not be able to meet current or future demand, which may limit the market’s
ability to serve many of the households seeking to purchase a home in the PSA, particularly lower-income households. Regardless, we believe opportunities exist to develop a variety of product types at various price points. The addition of a variety of for-sale housing will better enable the PSA to attract and retain residents (including local employees), as well as seniors, families, and younger adults.
In terms of product design, we believe a variety of for-sale product could be successful in Johnson City. Based on current and projected demographics, as well as the available inventory of for-sale housing, we believe a combination of condominium/townhome and single-family units could be successful as each of these product types have recently sold or are currently available for purchase within the PSA. However, it is notable that single-family home product represents 77.5% of all available homes and 79.0% of homes sold within the PSA since January of 2023. Based on our review of currently available for-sale product in the state of Tennessee, townhome/condominium product typically represents approximately 13% of all for-sale residential properties. Thus, the for-sale housing supply within the PSA (Johnson City) appears to comprise a slightly higher share of townhome/condominium product as compared to the state of Tennessee as a whole. Based on historic and available home sales data, such product is comprised primarily of twoand three-bedroom homes, which is typical of this type of housing. Generally, attached multifamily for-sale product (i.e., condominium/townhomes) located in or near more walkable areas is desirable to potential buyers as many are younger households desiring to be near services, entertainment, and/or employment opportunities. Additionally, detached or attached single-story cottage-style condominium product, primarily consisting of two-bedroom units, could be successful in serving area seniors, particularly those seeking to downsize from a single-family home. Smaller detached units or duplexes may be a product to develop in some of the smaller infill lots within the city.
Larger, traditional detached single-family homes catering to families could be successful in this market, particularly product serving moderate- and higherincome households. Affordable for-sale housing product for lower-income households and first-time homebuyers would also do well in this market, given the limited supply (13 homes currently available for less than $200,000) of such product. This product should primarily consist of three-bedroom units, with a smaller share of four-bedroom or larger units. While some smaller twobedroom single-family homes may also be marketable/successful in this area and potentially provide a more affordable purchase option to area residents, such product has historically been limited within the PSA. Specifically, twobedroom single-family homes have comprised just 24.1% of all single-family home sales within the market since January of 2023. Condominium or townhome units could serve a segment of the market seeking two-bedroom or smaller for-sale housing product. The for-sale housing supply of Johnson City is summarized in Section V and can provide additional details of project concept considerations for future for-sale product in the PSA.
Overall, there is potential support for a variety of residential development alternatives in the PSA (Johnson City). It is important to understand that the housing demand estimates shown in this report assume no major changes occur in the local economy and that the demographic trends and projections provided in this report materialize. As such, our demand estimates should be considered conservative and serve as a baseline for development potential. Should new product be developed, it is reasonable to believe that people will consider moving to Johnson City, assuming the housing product is aggressively marketed throughout the region.
The estimates provided in this report (both rental and for-sale) represent potential units of demand by targeted income level. The actual number of units that can be supported will ultimately be contingent upon a variety of factors including the location of a project, proposed features (i.e., pricing, amenities, bedroom type, unit mix, square footage, etc.), product quality, design (i.e., townhome/condominium, single-family homes, or traditional rental units), management and marketing efforts. As such, each targeted segment outlined in the tables included in this section may be able to support more or less than the number of units shown. The potential number of supportable units should be considered a general guideline to residential development planning.
ADDENDUM A: PHONE SURVEY OF CONVENTIONAL RENTALS
Contact:
Apts.
Contact:
Contact:
Contact:
Contact:
Contact:
Contact:
Contact:
Contact:
Contact:
City
Contact:
ADDENDUM B: NON-CONVENTIONAL RENTAL SURVEY
Non-Conventional Rentals
Non-Conventional Rentals (Continued)
Non-Conventional Rentals (Continued)
ADDENDUM C: METHODOLOGY & LIMITATIONS
A. METHODOLOGIES AND SOURCES
The following methods and sources were used by Bowen National Research:
Demographic Information
Demographic data for population, households, and housing was secured from ESRI, the 2010 and 2020 U.S. Census, the U.S. Department of Commerce, and the American Community Survey. This data has been used in its primary form and by Bowen National Research for secondary calculations. All sources are referenced throughout the report. Estimates and projections of key demographic data for 2024 and 2029 were also provided.
Housing Component Definitions
This study focuses on rental and for-sale housing components. Rentals include multifamily apartments (generally five+ units per building) and non-conventional rentals such as single-family homes, duplexes, units over storefronts, etc. For-sale housing includes individual homes, mobile homes, and projects within subdivisions.
Housing Supply Documentation
Between January and February of 2025, Bowen National Research conducted telephone research, as well as online research, of the area’s housing supply. The following data was collected on each multifamily rental property:
1. Property Information: Name, address, total units, and number of floors
2. Owner/Developer and/or Property Manager: Name and telephone number
3. Population Served (i.e., seniors vs. family, low-income vs. market-rate, etc.)
4. Available Amenities/Features: Both in-unit and within the overall project
5. Years Built and Renovated (if applicable)
6. Vacancy Rates
7. Distribution of Units by Bedroom Type
8. Square Feet and Number of Bathrooms by Bedroom Type
9. Gross Rents or Price Points by Bedroom Type
10. Property Type
11. Quality Ratings
12. GPS Locations
Non-conventional (e.g., single-family homes, duplexes, mobile homes, etc.) rental information includes such things as collected and gross rent, bedroom types, square footage, price per square foot, and total available inventory.
For-sale housing data included details on home price, year built, location, number of bedrooms/bathrooms, price per-square-foot, and other property attributes. Data was analyzed for both historical transactions and currently available residential units.
Housing Gap Estimates
Based on the demographic estimates and projections for both 2024 and 2029 and taking into consideration the housing data from our phone survey of area housing alternatives, we are able to project the potential number of housing units that are needed (housing gaps) in Johnson City. The following summarizes the metrics used in our demand estimates.
We included renter and owner household growth, the number of units required for a balanced market, the need for replacement of substandard housing, commuter/ external market support, severe cost-burdened households, and step-down support as the demand components in our estimates for new rental and for-sale housing units.
As part of this analysis, we accounted for vacancies reported among both renter- and owner-occupied housing alternatives, considered applicable units in the development pipeline,andconcludedthis analysis byprovidingthenumberofunits thatareneeded (housing gap) by different income segments, rent levels, and purchase price points.
B. REPORT LIMITATIONS
The intent of this report is to collect and analyze significant levels of data for Johnson City in Tennessee. Bowen National Research relied on a variety of data sources to generate this report (cited throughout report). These data sources are not always verifiable; however, Bowen National Research makes a concerted effort to assure accuracy. While this is not always possible, we believe that our efforts provide an acceptable standard margin of error. Bowen National Research is not responsible for errors or omissions in the data provided by other sources.
We have no present or prospective interest in any of the properties included in this report, and we have no personal interest or bias with respect to the parties involved. Our compensation is not contingent on an action or event resulting from the analyses, opinions, or use of this study. Any reproduction or duplication of this study without the expressed approval of Johnson City or Bowen National Research is strictly prohibited.
ADDENDUM D: QUALIFICATIONS
The Company
Bowen National Research employs an expert staff to ensure that each market study includes the highest standards. Each staff member has hands-on experience evaluating sites and comparable properties, analyzing market characteristics and trends, and providingrealisticrecommendations andconclusions. TheBowen National Researchstaff has national experience and knowledge to assist in evaluating a variety of product types and markets.
Primary Contact and Report Author
Patrick Bowen, President of Bowen National Research, has conducted numerous housing needs assessments and provided consulting services to city, county and state development entitiesasitrelatestoresidentialdevelopment, including affordable and market-rate housing, for both rental and for-sale housing, and retail development opportunities. He has also prepared and supervised thousands of market feasibility studies for all types of real estate products, including housing, retail, office, industrial and mixed-use developments, since 1996. Mr. Bowen has worked closely with many state and federal housing agencies to assist them with their market study guidelines. Mr. Bowen has his bachelor’s degree in legal administration (with emphasis on business and law) from the University of West Florida and currently serves as Chairman of the National Council of Housing Market Analysts (NCHMA).
IN
Richlands, VA
Elkin, NC
Grand Rapids, MI Grand
Morgantown, WV
Erwin, TN Unicoi
Ferrum, VA
Charleston, WV
Wilkes County, NC
Oxford, OH
New Hanover County, NC New
Ann Arbor, MI
Inc.
Housing Needs Assessment Experience (CONTINUED)
Independence County, AR
Housing Needs Assessment Experience (CONTINUED)
Area Chamber of Commerce
Statewide North Carolina NC Chamber
Northeast, MI (11 Counties) Target Alpena Development Corporation 2024
Tampa Region, FL (3 Counties)
Hopkinsville, KY
Greater Tampa REALTORS and Pinellas REALTOR Organization/ Central Pasco REALTOR Organization 2024
City of Hopkinsville 2024
New River Gorge Region, WV New River Gorge Regional Development District 2025 Evansville, IN
City of Evansville, Department of Metropolitan Development 2025
The following individuals provided research and analysis assistance:
Craig Rupert, Market Analyst, has conducted more than 1,000 market feasibility studies throughout the United States since 2010, within both urban and rural markets as well as on various tribal reservations. Mr. Rupert has prepared market studies for numerous types of housing including market-rate, Tax Credit, and various government-subsidized rental product, for-sale product, senior living (assisted living, nursing care, etc.), as well as market studies for retail/commercial space. Market studies prepared by Mr. Rupert have been used for submittal as part of state finance agency Tax Credit and HUD 221 (d)(4) applications, as well as various other financing applications submitted to local, regional, and national-level lenders/financial institutions. Mr. Rupert has a bachelor’s degree in Hospitality Management from Youngstown State University.
Christopher Bunch, Market Analyst, has more than two decades of experience in conducting both site-specific market feasibility studies and broader housing needs assessments. He has conducted on-site market research of a variety of housing product, conducted stakeholder interviews and completed specialized research on housing market attributes including the impact of military personnel, heirs and estates and other unique factors that impact housing needs. He holds a bachelor’s degree in geography from Ohio University.
DesireéJohnsonistheDirectorofOperationsforBowen NationalResearch.Ms.Johnson is responsible for all client relations, the procurement of work contracts, and the overall supervision and day-to-day operations of the company. Ms. Johnson also coordinates and oversees research staff and activities. She has been involved in the real estate market research industry since 2006. Ms. Johnson has an Associate of Applied Science in Office Administration from Columbus State Community College.
Pat McDavid, Market Analyst, has conducted housing research for housing needs assessments completed throughout the country. Additionally, he is experienced in analyzing demographic and economic data in rural, suburban and metropolitan communities. Mr. McDavid has been a part of the development of market strategies, operational and fiscal performance analysis, and commercial, industrial and government (local, state, and federal) client consultation within the construction and manufacturing industries. He holds a bachelor’s degree in educational studies from Western Governors University.
Jody LaCava, Research Specialist, has more than a decade of real estate research experience. She has extensive experience in surveying a variety of housing alternatives, including rental, for-sale, and senior housing. She has experience in conducting on-site research of real estate, evaluating existing housing properties, conducting interviews, and evaluating community services. She has been involved in industry leading case studies, door-to-door resident surveys and special needs housing research.
In-House Researchers – Bowen National Research employs a staff of in-house researchers who are experienced in the surveying and evaluation of all rental and for-sale housing types, as well as in conducting interviews and surveys with city officials, economic development offices and chambers of commerce, housing authorities and residents.
No subconsultants were used as part of this assessment.
ADDENDUM E: GLOSSARY
Various key terms associated with issues and topics evaluated in this report are used throughout this document. The following provides a summary of the definitions for these key terms. It is important to note that the definitions cited below include the source of the definition, when applicable. Those definitions that were not cited originated from the National Council of Housing Market Analysts (NCHMA).
Area Median Household Income (AMHI) is the median income for families in metropolitan and non-metropolitan areas, used to calculate income limits for eligibility in a variety of housing programs. HUD estimates the median family income for an area in the current year and adjusts that amount for different family sizes so that family incomes may be expressed as a percentage of the area median income. For example, a family's income may equal 80% of the area median income, a common maximum income level for participation in HUD programs. (Bowen National Research, Various Sources)
Available rental housing is any rental product that is currently available for rent. This includes any units identified through Bowen National Research survey of affordable rental properties identified in the study areas, published listings of available rentals, and rentals disclosed by local realtors or management companies.
Basic Rent is the minimum monthly rent that tenants who do not have rental assistance pay to lease units developed through the USDA-RD Section 515 Program, the HUD Section 236 Program and the HUD Section 223 (d) (3) Below Market Interest Rate Program. The Basic Rent is calculated as the amount of rent required to operate the property, maintain debt service on a subsidized mortgage with a below-market interest rate, and provide a return on equity to the developer in accordance with the regulatory documents governing the property.
Contract Rent is (1) the actual monthly rent payable by the tenant, including any rent subsidy paid on behalf of the tenant, to the owner, inclusive of all terms of the lease (HUD & RD) or (2) the monthly rent agreed to between a tenant and a landlord (Census).
Cost overburdened households arehouseholds that pay morethan30%or35%(depending upon source) of their annual household income toward housing costs. Typically, such households will choose a comparable property (including new affordable housing product) if it is less of a cost burden.
Elderly Person is a person who is at least 62 years of age as defined by HUD.
Elderly or Senior Housing is housing where (1) all the units in the property are restricted for occupancy by persons 62 years of age or older or (2) at least 80% of the units in each building are restricted for occupancy by households where at least one household member is55yearsofageorolderandthehousingisdesignedwithamenitiesandfacilitiesdesigned to meet the needs of senior citizens.
Extremely low-income is a person or household with income below 30% of Area Median Income adjusted for household size.
Fair Market Rent (FMR) are the estimates established by HUD of the gross rents (contract rent plus tenant paid utilities) needed to obtain modest rental units in acceptable condition in a specific county or metropolitan statistical area. HUD generally sets FMR so that 40% of the rental units have rents below the FMR. In rental markets with a shortage of lower priced rental units HUD may approve the use of Fair Market Rents that are as high as the 50th percentile of rents.
Frail Elderly is a person who is at least 62 years of age and is unable to perform at least three “activities of daily living” comprising of eating, bathing, grooming, dressing or home management activities as defined by HUD.
Garden apartments are apartments in low-rise buildings (typically two to four stories) that feature low density, ample open space around buildings, and on-site parking.
Gross Rent isthemonthlyhousingcosttoatenant whichequalstheContractRentprovided for in the lease plus the estimated cost of all tenant paid utilities.
Household is one or more people who occupy a housing unit as their usual place of residence.
Housing Choice Voucher (Section 8 Program) is a federal rent subsidy program under Section 8 of the U.S. Housing Act, which issues rent vouchers to eligible households to use in the housing of their choice. The voucher payment subsidizes the difference between the Gross Rent andthetenant’scontribution of30%ofadjustedgrossincome,(or10%ofgross income, whichever is greater). In cases where 30% of the tenant’s income is less than the utility allowance, the tenant will receive an assistance payment. In other cases, the tenant is responsible for paying his share of the rent each month.
Housing unit is a house, apartment, mobile home, or group of rooms used as a separate living quarters by a single household.
HUD Section 8 Program is a federal program that provides project based rental assistance. UndertheprogramHUDcontractsdirectlywiththeownerforthepaymentofthedifference between the Contract Rent and a specified percentage of tenants’ adjusted income.
HUD Section 202 Program is a federal program, which provides direct capital assistance (i.e., grant) and operating or rental assistance to finance housing designed for occupancy by elderly households who have income not exceeding 50% of the Area Median Income. The program is limited to housing owned by 501(c)(3) nonprofit organizations or by limited partnerships where the sole general partner is a 501(c)(3) nonprofit organization. Units receive HUD project based rental assistance that enables tenants to occupy units at rents based on 30% of tenant income.
HUD Section 236 Program is a federal program which provides interest reduction payments for loans which finance housing targeted to households with income not exceeding 80% of Area Median Income who pay rent equal to the greater of Basic Rent or 30% of their adjusted income. All rents are capped at a HUD approved market rent.
HUD Section 811 Program is a federal program, which provides direct capital assistance and operating or rental assistance to finance housing designed for occupancy by persons with disabilities who have income not exceeding 50% of Area Median Income. The program is limited to housing owned by 501(c)(3) nonprofit organizations or by limited partnerships where the sole general partner is a 501(c)(3) nonprofit organization.
Income Limits are the Maximum Household Income by county or Metropolitan Statistical Area, adjusted for household size and expressed as a percentage of the Area Median Income (AMI) for the purpose of establishing an upper limit for eligibility for a specific housing program. Income Limits for federal, state and local rental housing programs typically are established at 30%, 50%, 60% or 80% of AMI.
Low-Income Household is a person or household with gross household income between 50% and 80% of Area Median Income adjusted for household size.
Low-Income Housing Tax Credit is a program to generate equity for investment in affordable rental housing authorized pursuant to Section 42 of the Internal Revenue Code, as amended. The program requires that a certain percentage of units built be restricted for occupancy to households earning 80% or less of Area Median Income, and that the rents on these units be restricted accordingly.
Market vacancy rate (physical) is the average number of apartment units in any market which are unoccupied divided by the total number of apartment units in the same market, excluding units in properties which are in the lease-up stage. Bowen National Research considers only these vacant units in its rental housing survey.
Mixed income property is an apartment property containing (1) both income restricted and unrestricted units or (2) units restricted at two or more income limits (i.e., low-income Tax Credit property with income limits of 30%, 50% and 60%).
Moderate Income is a person or household with gross household income between 40% and 60% of Area Median Income adjusted for household size.
Multifamily are structures that contain more than two housing units.
New owner-occupied household growth within a market is a primary demand component for new for-sale housing. For the purposes of this analysis, we have evaluated growth between2024and2029.The2024householdsbyincomelevelarebasedonESRIestimates that account for 2020 Census counts of total households for each study area. The 2024 and 2029 estimates are also based on growth projections by income level by ESRI. The difference between the two household estimates represents the new owner-occupied households that are projected to be added to a study area between 2024 and 2029. These estimates of growth are provided by each income level and corresponding price point that can be afforded.
Non-Conventional Rentals are structures with four or fewer rental units.
Overcrowded housing is often considered housing units with 1.01 or more persons per room. These units are often occupied by multi-generational families or large families that are in need of more appropriately sized and affordable housing units. For the purposes of this analysis, we have used the share of overcrowded housing from the American Community Survey.
Pipeline housing is housing that is currently under construction or is planned or proposed for development. We identified pipeline housing during our telephone interviews with local and county planning departments and through a review of published listings from housing finance entities such as NCHFA, HUD and USDA.
Population trends are changes in population levels for a particular area over a specific period of time which is a function of the level of births, deaths, and net migration.
Potential support is the equivalent to the housing gap referenced in this report. The housing gap is the total demand from eligible households that live in certain housing conditions (described in Section VI of this report) less the available or planned housing stock that was inventoried within each study area.
Project-based rent assistance is rental assistance from any source that is allocated to the property or a specific number of units in the property and is available to each income eligible tenant of the property or an assisted unit.
Public Housing or Low-Income Conventional Public Housing is a HUD program administered by local (or regional) Housing Authorities which serves Low- and Very LowIncome households with rent based on the same formula used for HUD Section 8 assistance.
Rent burden is gross rent divided by adjusted monthly household income.
Rent burdened households are households with rent burden above the level determined by the lender, investor, or public program to be an acceptable rent-to-income ratio.
Replacement of functionally obsolete housing is a demand consideration in most established markets. Given the limited development of new housing units in the study area, homebuyers are often limited to choosing from the established housing stock, much of which is considered old and/or often in disrepair and/or functionally obsolete. There are a variety of ways to measure functionally obsolete housing and to determine the number of units that should be replaced. For the purposes of this analysis, we have applied the highest share of any of the following three metrics: cost burdened households, units lacking complete plumbing facilities, and overcrowded units. This resulting housing replacement ratio is then applied to the existing (2024) owner-occupied housing stock to estimate the number of for-sale units that should be replaced in the study areas.
Restricted rent is the rent charged under the restrictions of a specific housing program or subsidy.
Single-Family Housing is a dwelling unit, either attached or detached, designed for use by one household and with direct access to a street. It does not share heating facilities or other essential building facilities with any other dwelling.
Standard Condition: A housing unit that meets HUD’s Section 8 Housing Quality Standards.
Subsidized Housing is housing that operates with a government subsidy often requiring tenants to pay up to 30% of their adjusted gross income toward rent and often limiting eligibility to households with incomes of up to 50% or 80% of the Area Median Household Income. (Bowen National Research)
Subsidy is monthly income received by a tenant or by an owner on behalf of a tenant to pay the difference between the apartment’s contract rent and the amount paid by the tenant toward rent.
Substandard housing is typically considered product that lacks complete indoor plumbing facilities. Such housing is often considered to be of such poor quality and in disrepair that it should be replaced. For the purposes of this analysis, we have used the share of households living in substandard housing from the American Community Survey.
Substandard conditions are housing conditions that are conventionally considered unacceptable which may be defined in terms of lacking plumbing facilities, one or more major systems not functioning properly, or overcrowded conditions.
Tenant is one who rents real property from another.
Tenant paid utilities are the cost of utilities (not including cable, telephone, or internet) necessary for the habitation of a dwelling unit, which are paid by the tenant.
Tenure is the distinction between owner-occupied and renter-occupied housing units.
Townhouse (or Row House) is a single-family attached residence separated from another by party walls, usually on a narrow lot offering small front and back-yards; also called a row house.
Vacancy Rate – Economic Vacancy Rate (physical) is the maximum potential revenue less actual rent revenue divided by maximum potential rent revenue. The number of total habitable units that are vacant divided by the total number of units in the property.
Very Low-Income Household is a person or household with gross household income between 30% and 50% of Area Median Income adjusted for household size.
Windshield Survey references an on-site observation of a physical property or area that considers only the perspective viewed from the “windshield” of a vehicle. Such a survey does not include interior inspections or evaluations of physical structures.