We Invest, Collaborate & Create


Introduction
Established in 2007, Kirk Kapital’s heritage stretches back much further to 1932, when Ole Kirk Christiansen started making wooden toys in his workshop. In 1934, Ole began selling them under the now world-famous name, LEGO.
Today, almost 90 years later, our heritage of imagination and ingenuity is what forms the foundation of Kirk Kapital’s unique business.
Kirk Kapital’s shareholders, the Kirk Johansen families, are Ole Kirk Christiansen’s descendants.
As well as managing the family office services for our shareholders, we specialise in financial investments and strategic minority investments in tomorrow’s best companies, under the motto:
We invest, collaborate and create.
Annual Report | Introduction 5 4
Group Results
Our purpose is to create longterm prosperity for the families of our shareholders, partners and employees.
While we are patient and longer-term focused, we are very pleased and proud to state that our Investment Result in 2021 was DKK 1,541 million. The result is the best Investment Result ever realised in Kirk Kapital, and significantly above the expectations for 2021. This Investment Result was driven by both our Strategic Investments and our Financial Investments, while our Vejle Investments contributed negatively.
Continuing the trend from 2020, and in line with our longterm strategy, we have in 2021 decreased our relative capital allocation to Vejle Investments, while we have increased our activity within Strategic Investments substantially.
During 2021, we have also increased our external wealth management business. We have
partnered up with several new like-minded clients, acting as their outsourced CIO. This has ensured further quality and cost effectiveness into our operations.
In total, Kirk Kapital manages DKK 12.9 billion, of which 5.7 billion is external capital.
COVID-19 was also a central theme again in 2021. The wellbeing of our employees and their families was high on our agenda, and we introduced flexible work schedules and home working stations where needed. We were pleased to register a continued high level of employee satisfaction in our yearly employee survey.
An increased focus on sustainability goes hand in hand with Kirk Kapital’s purpose. Sustainability is now an integral part of our strategy, and is embedded throughout our internal operations and investment activities.
Kirk Kapital is now a signatory to the UN Global Compact Principles and we have identified four SDGs that we prioritize.
Finally, sustainability assessment is an integral part of all investment decisions. Kirk Kapital publishes its first sustainability report simultaneously with this Annual Report.
In summary, 2021 has been a fantastic year from a purely financial perspective. For 2022, we expect a positive Investment Result at, or above DKK 260 million. However, considering the recent turmoil on financial markets following the war in Ukraine, the expectation is associated with significant risk. The financial markets have been negatively impacted and market volatility is high. In the event of a prolonged war, the general longer-term business climate may also be negatively effected. No events have occurred after the balance sheet date which is considered to have a material impact on the assessment of the Annual Report.
2021 2020 2019 2018 DKKm DKKm DKKm DKKm Strategic Investments Financial Investments Vejle Investments 1,268 358 (85) 405 123 (42) 647 211 (61) 329 (61) (68) Net investment result 1,541 486 797 200 31. Dec. 2021 31. Dec. 2020 31. Dec. 2019 31. Dec. 2018 DKKm DKKm DKKm DKKm Strategic Investments Financial Investments Vejle Investments 4,408 2,511 415 3,443 2,152 550 3,060 2,108 565 2,188 1,742 885 Assets 7,334 6,145 5,733 4,815 Annual Report | Management review Annual Report | Management review 6 7
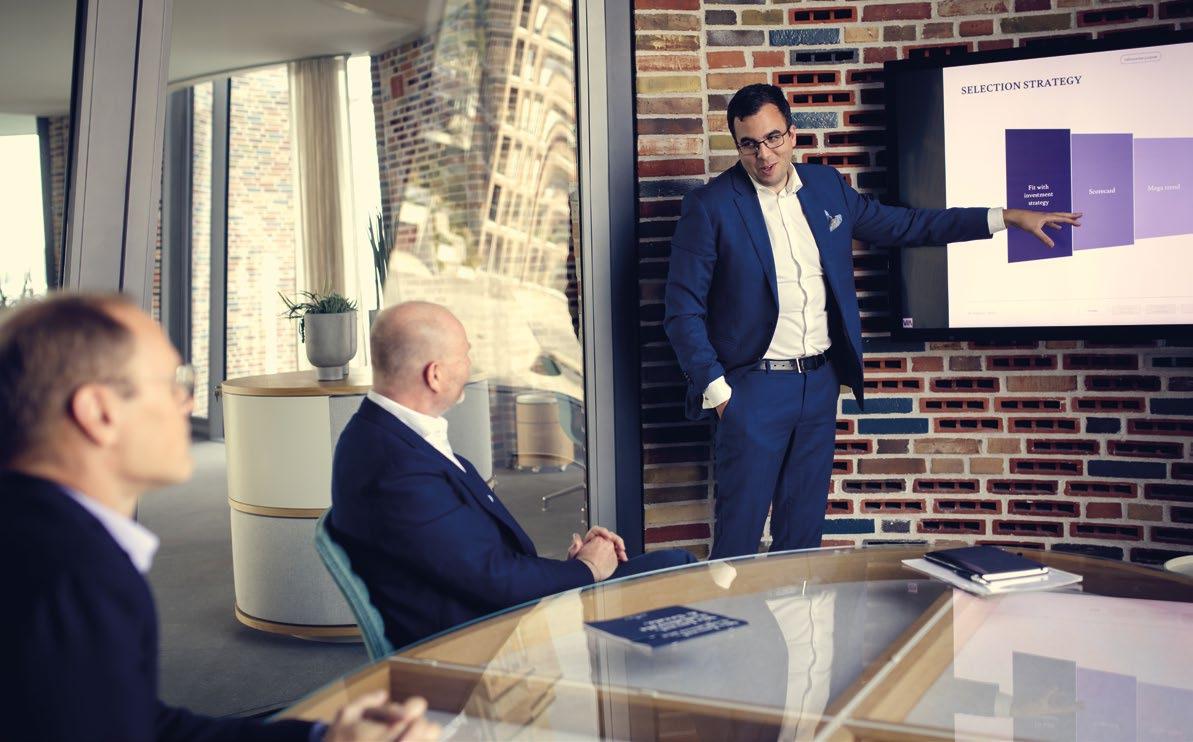
Strategic Investments
Kirk Kapital is a trusted leader within larger minority investments with an active ownership agenda. Our scope is medium- and largersized companies which have market-leading positions in longerterm growth industries, primarily with headquarter in Scandinavia.
Today, our larger minority equity portfolio currently includes a range of 13 business-to-business companies within services and light manufacturing. In 2021, we added 2 companies to our portfolio, namely, VivoMega and Ellepot, while we divested our shareholding in Alliance+, Exit59 and a part of our shareholding in Globeteam. Further, in January we added our second Norwegian company, Promon to our portfolio and in March, we added the Danish company Cookie Information, to our portfolio.
Our Investment Result in 2021 is DKK 1,268 million, or 40% return, and the asset value by year-end is DKK 4,408 million.
It is a very strong result which is well above our longer-term expectations. The positive development is derived from a broad positive contribution from the portfolio companies.
Strategic Investments Portfolio


2020 40% 2021 32% 2020 45%
Share of Assets Dec. 2021
Year Invested, % ownership New Investments in 2021 Exited Investments in 2021 2019 40% 2019 26% 2019 30% 2018 25% 2018 46% 2014 50% 2016 30% 2014 27% 2017 33% 2018 35% 2018 40% 2007 25% 60% 4,500 4,000 3,500 3,000 2,500 2,000 1,500 1,000 500 0 45% 40% 30% 20% 10% 0% Assets ROA Development in assets and return DKKm 2020 2021 3,443 4,408 2018 2017 2019 2,188 3,060 2,153 2021 48% Annual Report | Management review Annual Report | Management review 8 9
Financial Investments
Kirk Kapital Fondsmæglerselskab manages multiple individual portfolios tailored to our partners’ precise needs. All portfolios managed, consist of a wide range of investments including both listed equities, fixed income, and alternatives. The portfolios represent, in total, a value above 8.2 billion. The largest portfolio is Kirk Kapital’s own Financial Investments portfolio, and it represents 34% of Kirk Kapital’s own asset base.
Kirk Kapital’s own Financial Investments portfolio generated a result in 2021 of DKK 358 million, or 17% return, and the asset base by year-end is DKK 2,511 million. We have benefitted from the development in the general markets, especially the private markets contributed well in 2021, which provided us with a return above the general stock market. In summary, we have delivered a result better than our expectations.
During 2021, we have partnered up with several new like-minded clients, acting as their outsourced CIO. This has ensured further quality and cost effectiveness into our operations.
Vejle Investments and Other
Kirk Kapital has a number of investments in the Vejle area. This is due to our continued support and veneration to the community in Vejle.
Our Investment Result in 2021 is DKK -85 million, and our net asset base is DKK 415 million. The result is significantly lower than our expectations and stems mainly from price inflation on building materials in connection with the construction activities which takes place on Havneøen, Vejle.
We continue to be very pleased with how the local community has embraced our new headquarter, Fjordenhus, and its surroundings on Havneøen.
Kirk Kapital is pleased to support Vejle Kommune by making the forecourt of Fjordenhus available for Vejle Kommune to host the start of the 3rd and final stage of Tour-De-France in Denmark on the 3rd July 2022. We are looking forward to putting Vejle on the global map and the celebrations in this context.
34% 6% Share of Assets Dec. 2021 Share of Assets Dec. 2021 3,000 2,500 2,000 1,500 1,000 500 0 30% 20% 10% 0% -10% 2,152 2,511 Assets ROA Development in assets and return DKKm 1,742 2,108 2018 2017 2019 1000 750 500 250 0 5% 0% -5% -10% -15% -20% Assets ROA Development in assets and return DKKm 2020 2021 550 415 2018 2017 2019 885 565 2020 2021 2,059 756 Annual Report | Management review Annual Report | Management review 10 11

Annual Report | Management review Annual Report | Management review 12 13
Strategy
Kirk Kapital’s purpose is to create long-term prosperity for the families of our shareholders, partners and employees. We manage and grow family-owned capital, based on strong family values.
Business and Financial Risk
Within Strategic Investments, our investment scope is Scandinavian medium- and larger-sized companies having market-leading positions in long-term growth industries. Our minority equity portfolio currently includes a range of business-to-business companies within services and light manufacturing. We aim to expand this portfolio in the years to come. Our unique model for active minority investment ensures the independence of our partners, while creating the best possible conditions for their lasting success. We achieve this by providing active board representation, the benefits of our toolbox and shared best practice across our portfolio. Common to all cases is a tailored approach, closely calibrated with our partners’ requirements and wishes. Altogether, this creates the best conditions for each company’s long-term growth.
needs. The portfolios consist of a wide range of investments including both listed equities, fixed income, and alternatives.
Within Vejle Investments, we seek to support our long-term commitment to Fjordenhus and the finalisation of the development of Havneøen. This is due to our veneration and continued support to the community in Vejle.
As a family-owned business and investment company we are widely exposed to financial risks, especially relating market risk, with an exposure to publicly traded securities.
Our three investment divisions are managing financial risks
with the objective to create long-term prosperity for the families of our shareholders and business partners. In this light, we have not taken any risks that could be referred as special considering the extent of our activities as a business and investment company.
For further information about financial risk management, we refer to note 19 in the Group’s financial statements.
Within Financial Investments, we manage multiple individual portfolios which we seek to tailor to our clients precise
Our Values Competence
We aspire to be amongst the best, brightest, and most experienced within our field Dedication
We have a relentless focus on realizing our purpose Integrity
We conduct our business in accordance with the highest standards of professional behavior and ethics
Other statutory statements
In accordance with Danish legislation, Kirk Kapital has prepared statutory statements in relations to the Underrepresented gender in management, on Data ethics and Corporate Social Responsibility which forms part of Kirk Kapital’s sustainability report. The report can be found at the Kirk Kapital website.
Annual Report | Management review Annual Report | Management review 14 15

Parent Company Financials 18 Statement of comprehensive income 19 Balance sheet 20 Statement of changes in equity 21 Cash flow statement 22 Notes Annual Report | Parent Company Annual Report | Parent Company 17 16
Statement of comprehensive income
Balance sheet
Note 31 December 2021 31 December 2020 DKKm DKKm Strategic Investments Financial Investments Vejle Investments Lease assets – right-of-use assets Deferred tax asset 9 10 11 17 18 4,408 621 415 68 0 3,443 203 550 63 8 Total non-current assets 5,512 4,267 Financial Investments Receivables from group enterprises Other receivables Cash and cash equivalents 10 1,890 0 7 1 1,949 1 18 1 Total current assets 1,898 1,969 Total assets 7,410 6,236 Share capital Retained earnings Proposed dividend for the year 19 100 6,581 68 100 5,295 55 Total equity 6,749 5,450 Credit institutions Other payables Lease liabilities Deferred tax liabilities 22 22 23 18 40 100 66 12 40 0 60 0 Total non-current liabilities 218 100 Credit institutions Lease liabilities Trade payables Payables to group enterprises Tax payables Other payables 22 23 22 22 22 146 3 0 95 28 171 539 3 7 2 26 109 Total current liabilities 443 686 Total liabilities 661 786 Total equity and liabilities 7,410 6,236
Note 31 December 2021 31 December 2020 DKKm DKKm Strategic Investments Financial Investments Vejle Investments 3 4 5 1,268 358 (85) 405 123 (42) Net investment result 1,541 486 Other operating income Expenses Other financial income 6 38 (147) (1) 10 (75) (1) Profit/loss before tax 1,431 420 Income tax 8 (77) (27) Total comprehensive income for the year 1,354 393 Annual Report | Parent Company Annual Report | Parent Company 18 19
Statement of changes in equity
Cash flow statement 2021 2020 DKKm DKKm Profit/loss for the year Adjustments Changes in net working capital 1,339 (1,541) 297 416 (486) 18 Net cash flow from other activities 95 (52) Cash flow from Strategic Investments Cash flow from Financial Investments Cash flow from Vejle Investments 303 (13) 51 22 102 (27) Cash flow from investing activities 341 97 Proceeds from credit institutions Repayment of credit institutions Dividend paid 0 (393) (55) 125 (98) (51) Cash flow from financing activities (448) (24) Net cash flow for the year Cash and cash equivalents, beginning of the year (12) 72 21 51 Cash and cash equivalents at end of the year 60 72
Share capital Retained earnings Proposed dividend Total DKKm DKKm DKKm DKKm Equity at 01.01.2020 100 4,957 51 5,108 Profit for the period Other comprehensive income 0 0 416 (23) 0 0 416 (23) Total comprehensive income for the period 0 393 0 393 Transactions with owners in their capacity as owners Ordinary dividend paid Dividend 0 0 0 (55) (51) 55 (51) 0 Total dividend for the period 0 (55) 4 (51) Equity at 31.12.2020 100 5,295 55 5,450 Profit for the period Other comprehensive income 0 0 1,339 15 0 0 1,339 15 Total comprehensive income for the period 0 1,354 0 1,354 Transactions with owners in their capacity as owners Ordinary dividend paid Dividend 0 0 0 (68) (55) 68 (55) 0 Total dividend for the period 0 (68) 13 (55) Equity at 31.12.2021 100 6,581 68 6,749 Annual Report | Parent Company Annual Report | Parent Company 20 21
Accounting policies
Critical accounting estimates and judgements Strategic Investments
Financial Investments
Vejle Investments Expenses
Staff expenses
Income tax
Strategic Investments
Financial Investments
Vejle Investments
Property, plant, equipment and leasehold improvements
Investment properties
Investments in subsidiaries
Investment in associates and joint ventures at fair value
Other equity investments
Lease assets – right-of-use assets
Deferred tax
Share capital
Related parties
Commitments and contingent liabilities
Financial risk management
Lease liabilities
Events after the balance sheet date
1 Accounting policies
The financial statements are presented in Danish Kroner (DKK), as this is the Company's functional currency.
The financial statements have been rounded to the nearest million.
The financial statements of the Parent Company have been prepared in accordance with International Financial Reporting Standards (IFRS) as adopted by the EU and additional Danish disclosure requirements.
The accounting policies are the same as for the Consolidated Financial Statements, refer to note 1 for the Group.
2 Critical accounting estimates and judgements
Critical accounting estimates and judgements is specified in the Consolidated Financial Statements, refer to note 2 for the Group.
3 Strategic Investments
Value adjustments of investments
Income from subsidiaries
Income from investmens in associates and joint ventures at fair value Expenses
Other financial income
1 2 3 4 5 6 7 8 9 10 11 12 13 14 15 16 17 18 19 20 21 22 23 24
Notes Notes
Note 2021 2020 DKKm DKKm
Exchange rate
of foreign entities Fair value adjustment of hedging instruments 13 14 15 6 20 1,215 35 (5) 0 17 (14) 0 36 385 (7) 5 (35) 21 1,268 405 4 Financial Investments Fixed Income Equities Alternatives Currency forwards Other financial income (8) 205 175 (13) (1) 4 126 (11) 6 (2) 358 123 Annual Report | Parent Company Annual Report | Parent Company 22 23
adjustments
Note 2021 2020 DKKm DKKm 5 Vejle Investments Revenue Expenses for raw materials and consumables Income from subsidiaries Other operating income Expenses Fair value adjustment of hedging instruments 14 6 0 (1) (92) 0 (1) 9 2 (3) (36) 1 (1) (5) (85) (42) 6 Expenses Staff expenses Other external expenses and other operating expenses 7 125 28 54 36 153 90 Classifed in statement of profit and loss as: Strategic Investments Financial Investments Vejle Investments Expenses 5 0 1 147 7 7 1 75 153 90 7 Staff expenses Wages and salaries Pensions Other staff expenses 122 2 1 51 2 1 125 54 Average number of employees 20 24 Key Management Compensation Key Management Compensation is specified in the Consolidated Financial Statements, refer to note 4 for the Group. 2021 2020 DKKm DKKm 8 Income tax Current tax on profits for the year Current tax on profits for previous years Deferred tax for the year and previous years 89 (7) (5) 26 5 (4) 77 27 Which breaks down as follows: Tax on profit/loss for the year Tax on changes in equity 80 (3) 23 4 77 27 Calculated 22.0% tax on profit for the year before tax and comprehensive income 312 97 Tax effects of: Income from subsidiaries and associates Adjustment from previous years Income from other investments Other (255) (7) 0 30 (85) 5 5 1 80 23 Effective tax rate 6% 5% Annual Report | Parent Company Annual Report | Parent Company 24 25
Notes Notes
Investment properties consists of rental properties together with forest and agriculture land. Geographical the properties are located either in Vejle or in the vicinity of Vejle.
Investment properties are on initial recongnition measured at cost and subsequnetly at fair value using generally accepted valuation methods. The fair value of rental properties is determined by using either an income capitalization model or basis valuation carried out by independent valuers.
Buildings valued using a capitalizations model is measured at an average rate of return of 6.5% to 7.0%. The average rate of return used, is based on an assessment of locations and condition. A change of the rate of return of 0.5% will impact the value of rental property of approx. DKK 3 million before tax.
The fair value of the forest and agriculture land is estimated at DKK 115,000 per hectare (2020: 115,000 per hectare). A change of the price per hectare of 1% will impact the value of the forest and agriculture land of approx DKK 0.6 million before tax.
Note 2021 2020 DKKm DKKm 9 Strategic Investments Investment properties Investments in subsidiaries Investment in associates and joint ventures at fair value Non current receivables 13 14 15 20 4,386 2 0 0 333 3,020 90 4,408 3,443 10 Financial Investments Current Asset Investments Other equity investments Non current receivables Cash and cash equivalents 16 1,831 621 0 59 1,878 165 38 71 2,511 2,152 Classifed in statement of balance sheet: Financial Investments, non-current assets Financial Investments, current assets 621 1,890 203 1,949 2,511 2,152 11 Vejle Investments Property, plant, equipment and leasehold improvements Investment properties Investments in subsidiaries Non current receivables 12 13 14 3 61 338 13 4 66 467 13 415 550 2021 2020 DKKm DKKm 12 Property, plant, equipment and leasehold improvements Other fixtures and fittings, tools and equipment Cost at 1 January Additions during the year 7 0 3 4 Cost at 31 December 7 7 Depreciation and impairment at 1 January Depreciation for the year 3 1 2 1 Depreciation and impairment at 31 December 4 3 Carrying amount at 31 December 3 4 13 Investment properties Cost at 1 January Disposals during the year 73 (5) 124 (51) Cost at 31 December 68 73 Value adjustments at 1 January Fair value adjustments during the year Reversals regarding disposals (7) 20 0 (23) 0 16 Value adjustments at 31 December 13 (7) Carrying amount 31 December 81 66
Notes Notes
Annual Report | Parent Company Annual Report | Parent Company 26 27
Critical accounting estimates and judgements is specified in the Consolidated Financial Statements, refer to note 2 for the Group.
Note 2020 2019 DKKm DKKm 14
Cost at 1 January Additions for the year Disposals for the year 2,854 3,019 (141) 2,808 46 0 5,732 2,854 Value adjustments at 1 January Exchange adjustment Disposals for the year Net profit/loss for the year Dividend to the Parent Company Fair Value adjustment of hedging instruments for the year (2,054) 17 0 1,123 (101) 7 (1,983) (35) 0 0 (31) (5) (1,008) (2,054) Carrying amount at 31 December 4,724 800 Including goodwill 0 0 Investments
Name of entity Place of registered office Nature of relationship Share capital Votes Ownership Equity at last reporting date Net profit/loss for the last reported year Denmark Currency-m Currency-m Currency-m K/S Høje-Taastrup ApS Høje-Taastrup ApS Bredsten Bredsten Associate Associate 18 DKK 0 DKK 19% 19% 19% 19% 424 DKK 0 DKK 85 DKK 0 DKK
Notes
Investments in subsidiaries
in subsidiaries are specified in the Consolidated Financial Statements, refer to note 23 for the Group. 15 Investment in associates and joint ventures at fair value
Annual Report | Parent Company Annual Report | Parent Company 28 29
Notes 2021 2020 DKKm DKKm 16 Other equity investments Industry of investment Multisector Multisector Multisector Multisector Multisector Real Estate Geography Global Europe US Nordic Pan Asia Global 420 29 124 15 15 18 125 0 0 5 14 21 Total portfolio 621 165 17 Lease assets – right-of-use assets Cost af 1 January Additions during the year Disposals during the year 66 11 (3) 59 8 (1) Cost af 31 December 74 66 Depreciation and impairment at 1 January Depreciation for the year Reversals regarding disposals 3 4 (1) 1 3 (1) Depreciation and impairment at 31 December 6 3 Carrying amount at 31 December 68 63 2021 2020 DKKm DKKm 18 Deferred tax Deferred tax at 01.01 Other adjustments Deferred tax reccognised in the income statement (8) 25 (5) (20) 16 (4) Deferred tax at 31.12 12 (8) Deferred tax relates to: Property, plant, equipment and investment properties Other liabilities 12 0 7 (15) 12 (8) Of which presented as deferred tax assets Of which presented as deferred tax liabilities 0 12 8 0 The Parent Company does not have any unrecognized tax loss carryforwards. 19 Share capital Number of shares Nominal value (DKKm) The share capital comprise: A shares B shares 57,709,000 42,291,000 58 42 Share capital 100,000,000 100 All shares have nominal value of DKK 1. There have been no changes in the share capital during the last 5 years. Each A share has 10 votes at the annual general meeting. Each B share has 1 vote at the annual general meeting. Annual Report | Parent Company Annual Report | Parent Company 30 31
Notes
20 Related parties
Related parties are specified in the Consolidated Financial Statements, refer to note 17 for the Group.
Transactions with related parties:
Year-end balances arising from transactions with related parties:
related parties
No other year-end balances or transactions have taken place during the year with the Board of Directors, the Executive Management, major shareholders or other related parties.
21 Commitments and contingent liabilities
Contingent liabilities
Remaining commitment regarding participation in investment projects amount to a maximum of DKK 880m.
Sercurity has been given in investments properties at a net carrying amount of DKK 61m for the mortgage loans.
The Parent Company has provided a guarantee of a maximum of DKK 226m to financial institutions in which the Company's subsidiaries and associates have loans and other engagements.
The Parent Company has entered into a cash pool agreement. As per. 31 December 2021 the net withdrawl on the cashpool aregreement was DKK 96m.
Joint taxation scheme
The Danish group companies are jointly and severally liable for tax on the jointly taxed incomes etc. of the Group. The total amount of corporation tax payable by the Group is disclosed in the Financial Statements for KIRK KAPITAL A/S, which is the management company of the joint taxation. The Danish companies are joint and several liable for the joint taxation liability. The joint taxation liability covers income taxes and withholding taxes on dividends, royalties and interest.
22 Financial risk management
Financial risk factors
Financial risk factors, market risk, credit risks and liquidity risk are specified in the Consolidated Financial Statements, refer to note 19 for the Group.
Maturity analysis
The table below analyses the Parent Company’s financial liabilities into relevant maturity groupings based on the remaining period at the balance sheet date to the contractual maturity date. The amounts disclosed in the table are the contractual undiscounted cash flows.
Non-derivatives
As at 31.12.2021
Notes 2021 2020 DKKm DKKm
Notes
Subsidiaries Administration and management fee income Rental expenses Intercompany interest income Intercompany interest expenses 35 4 1 2 2 4 0 0 Other related parties Administration and management Fee Income Salaries 3 70 8 21
Subsidiaries Receivables Payables 0 95 1 2 Other
Receivables Payables 3 81 4 23
Less than 1 year Between 1 and 5 year More than 5 years Total DKKm DKKm DKKm DKKm
Credit institutions Trade payables Payables to group enterprises Other payables 146 0 95 171 0 0 0 50 40 0 0 50 186 0 95 271 412 50 90 552 As at 31.12.2020 Credit institutions Trade payables Payables to group enterprises Other payables 539 7 2 109 0 0 0 0 40 0 0 0 579 7 2 109 657 0 40 697 Fair value of debt correspond approximately to amortised cost of debt. Annual Report | Parent Company Annual Report | Parent Company 32 33
Notes Notes
hierarchy Measurement and
hierarchy is specified in the Consolidated Financial Statements, refer to note 19 for the Group.
23 Lease liabilities Lease liabilities expiring within the following periods from the balance sheet date:
In 2021 the Parent has paid DKK 4,4m regarding lease agreements where of interest expenses related to lease liabilities amount to DKK 0,7m and repayment of lease liability amount to DKK 3,7m.
24 Events after the balance sheet date
No events materially affecting the assessment of the Annual Report have occurred after the balance sheet date.
Financial assets and liabilities per measurement category 2021 2020 DKKm DKKm Financial assets Financial assets at amortised costs: Non current receivables Other loans and receivables Cash and cash equivalents 13 7 1 51 18 1 Financial assets at fair value through profit or loss (FVPL): Investments in associates and joint venture Current Asset Investments Other investments 2 1,831 621 3,020 1,878 165 Financial liabilities Liabilities at amortised cost: Trade and other payables Credit institutions Other payables 0 186 271 7 579 109 Measurement
fair value
2021 2020 DKKm DKKm
and
fair value
Less than 1 year Between 1 and 5 year More than 5 years 3 12 54 3 11 49 69 63 Classifed in statement of balance sheet: Non-current liabilities Current liabilities 66 3 60 3 69 63 Recognized in
profit and loss statement Interest expenses related to lease liabilites 1 1 1 1
the
Annual Report | Parent Company Annual Report | Parent Company 34 35

38 Financial highlights of the Group 39 Consolidated statement of profit and loss and comprehensive income 40 Consolidated balance sheet 42 Consolidated statement of changes in equity 43 Consolidated cash flow statement 44 Notes
Annual Report | Group Annual Report | Group 37 36
Group Financials
Financial highlights of the Group
Consolidated statement of comprehensive income
Note 2021 2020 DKKm DKKm Revenue Value adjustments of investments Other operating income Expenses for raw materials and consumables Other external expenses 3 67 20 11 (25) (46) 113 0 9 (84) (41) Gross profit/loss 27 (3) Staff expenses Amortisation, depreciation and impairment losses Other operating expenses 4 5 (137) (188) 2 (56) (36) 0 Operating profit/loss (296) (95) Income from investments in associates and joint ventures Financial income Financial expenses 6 7 1,363 374 (48) 387 146 (6) Profit/loss before tax 1,393 432 Income tax 8 (51) (16) Profit/loss for the year 1,342 416 Other comprehensive income Items that will be subsequently reclassified to profit or loss Exchange rate adjustments of foreign entities Fair value adjustment of hedging instruments Income tax relating to hedging instruments 17 (3) 1 (35) 15 (3) Other comprehensive income for the period, net of tax 15 (23) Total comprehensive income for the period 1,357 393 Total comprehensive income for the period is attributable to: Owners of KIRK KAPITAL A/S Non-controlling interests 1,354 3 393 0 1,357 393
2021 2020 2019 2018 2017 DKKm DKKm DKKm DKKm DKKm Financial highlights Profit and loss accounts Revenue Gross profit/loss Operating profit/loss Net financials Profit/loss from continuing activities Profit/loss from discontinuing activities Profit/loss for the year Comprehensive income 67 27 (296) 326 1,342 0 1,342 1,357 113 (3) (95) 140 416 0 416 393 120 7 (142) 221 696 (1) 695 680 217 110 (35) (66) 149 15 164 169 121 119 (43) 372 (41) (224) (265) (315)
sheet Total assets Investments in intangible and tangible fixed assets Total equity attributable to owners of the parent company 7,766 105 6,749 6,471 37 5,450 6,144 31 5,108 5,160 111 4,474 6,216 142 4,387 Key Ratios Return on equity (%) Solvency ratio (%) 22.0% 86.9% 7.9% 84.2% 14.5% 83.1% 3.8% 86.7% -5.9% 70.6% Annual Report | Group Annual Report | Group 38 39
Balance
Consolidated balance sheet
Consolidated balance sheet
Note 31 December 2021 31 December 2020 DKKm DKKm Property, plant, equipment, leasehold improvements and lease assets Investment properties Investment in associates and joint ventures at fair value Investment in associates and joint ventures at equity method Other equity investments Non current receivables Deferred tax asset 9 10 11 12 13 14 669 91 4,241 20 621 67 12 699 76 3,020 46 165 262 8 Total non-current assets 5,721 4,276 Inventories Tax receivables Other receivables Current Asset Investments Cash and cash equivalents 15 92 8 23 1,831 91 137 9 24 1,878 147 Total current assets 2,045 2,195 Total assets 7,766 6,471
Note 31 December 2021 31 December 2020 DKKm DKKm Share capital Retained earnings Proposed dividend for the year 16 100 6,581 68 100 5,295 55 Total equity attributable to owners of the parent company 6,749 5,450 Non-controlling interests 147 0 Total equity 6,896 5,450 Credit institutions Other payables Lease liabilities Deferred tax liabilities 19 19 21 14 263 100 16 12 264 0 9 13 Total non-current liabilities 391 286 Credit institutions Lease liabilities Prepayments from customers Trade payables Tax payables Deposits Other payables 19 21 19 19 19 242 2 5 2 36 1 191 539 1 0 12 37 1 145 Total current liabilities 479 735 Total liabilities 870 1,021 Total equity and liabilities 7,766 6,471 Annual Report | Group Annual Report | Group 40 41
Consolidated statement of changes in equity
Consolidated cash flow statement
Share capital Retained earnings Proposed dividend Total equity attributable to owners of KIRK KAPITAL A/S Noncontrolling interests Total DKKm DKKm DKKm DKKm DKKm DKKm Equity at 01.01.2020 Profit for the period Other comprehensive income 100 0 0 4,957 416 (23) 51 0 0 5,108 416 (23) 0 0 0 5,108 416 (23) Total comprehensive income for the period 0 393 0 393 0 393 Transactions with owners in their capacity as owners Ordinary dividend paid Dividend 0 0 0 (55) (51) 55 (51) 0 0 0 (51) 0 Total dividend for the period 0 (55) 4 (51) 0 (51) Equity at 31.12.2020 100 5,295 55 5,450 0 5,450 Profit for the period Other comprehensive income 0 0 1,339 15 0 0 1,339 15 3 0 1,342 15 Total comprehensive income for the period 0 1,354 0 1,354 3 1,357 Transactions with owners Ordinary dividend paid Dividend Transactions with non-controlling interests 0 0 0 0 (68) 0 (55) 68 0 (55) 0 0 0 0 144 (55) 0 144 Total transactions with owners 0 (68) 13 (55) 144 89 Equity at 31.12.2021 100 6,581 68 6,749 147 6,896
2021 2020 DKKm DKKm Profit/loss for the year Adjustments Changes in net working capital Income taxes paid 1,342 (1,259) 154 (58) 416 (327) 180 (21) Net cash flow from operating activities 179 248 Purchase of property, plant and equipment Proceeds from sale of property, plant and equipment Purchase of non-current financial assets Proceeds from non-current financial asstes (105) 0 (833) 914 (37) 64 (466) 352 Net cash flow from investing activities (24) (87) Proceeds from Borrowings Repayment of credit institutions Transactions with non controlling interests Dividend paid 96 (393) 141 (55) 27 (56) 0 (51) Cash flow from financing activities (211) (80) Net cash flow for the year Cash and cash equivalents, beginning of the year (56) 147 81 66 Cash and cash equivalents at end of the year 91 147 Annual Report | Group Annual Report | Group 42 43
Notes
Accounting policies
Critical accounting estimates and judgements
Revenue
Staff expenses
Amortisation, depreciation and impairment losses
Financial income
Financial expenses
Income tax
Property, plant, equipment, leasehold improvements and lease assets
Investment properties
Investment in associates and joint ventures at fair value
Investment in associates and joint ventures at equity method
Other equity investments
Deferred tax
Inventories
Share capital
Related parties
Commitments and contingent liabilities
Financial risk management
Fee to auditors appointed at the general meeting
Lease liabilities
Events after the balance sheet date
List of group companies
1 Accounting policies
The Consolidated Financial Statements are presented in Danish Kroner (DKK), as this is the Group's functional currency. The Consolidated Financial Statements have been rounded to the nearest million.
The consolidated and separate financial statements for KIRK KAPITAL A/S have been prepared in accordance with International Financial Reporting Standards (IFRS) as issued by the International Accounting Standards Board (IASB) and as adopted by the European Union as well as additional Danish disclosure requirements applying to entities of reporting class C for large enterprises.
Basis of consolidation
The Consolidated Financial Statements comprise the Parent Company, KIRK KAPITAL A/S, and subsidiaries in which the Parent Company directly or indirectly holds more than 50 % of the votes or in which the Parent Company, through share ownership or otherwise, exercises control. Subsidiaries are fully consolidated from the date on which control is transferred to the group. They are deconsolidated from the date that control ceases.
On consolidation, elimination is made of intra-group income and costs, shareholdings, intra-group balances and dividend and realized and unrealized profits or losses on transactions between the consolidated companies.
Elimination is made of intercompany income and expenses, shareholdings, dividends and accounts as well as of realised and unrealised profits and losses on transactions between the consolidated enterprises.
Foreign currency translation
Transactions and balances
Transactions in currencies other than the entity's functional currency are translated into the functional currency using the exchange rates at the dates of the transactions. Foreign exchange gains and losses resulting from the settlement of such transactions and from the translation of monetary assets and liabilities denominated in foreign currencies at year end exchange rates are generally recognised in profit or loss.
Revenue
Rental income under operating leases is recognised straight line over the term of the contract. Revenue from sale of apartments are recognised at a point in time when control of the apartment is transferred.
Revenue is measured as the fair value of the consideration received or receivable. Revenue is measured exclusive of VAT, taxes etc.
Value adjustments of investments
The value adjustment of investments in associates and portfolio companies comprises value adjustment realized from sale and unrealised value adjustments from any revaluation or impairment of investments in portfolio companies at fair value. Dividend received from investments are included in value adjustments.
1 2 3 4 5 6 7 8 9 10 11 12 13 14 15 16 17 18 19 20 21 22 23
Notes
Annual Report | Group Annual Report | Group 44 45
Expenses for raw materials and consumables
Expenses for raw materials and consumables comprise the raw materials and consumables consumed to achieve revenue for the year.
Other external expenses
Other external expenses comprise expenses for premises, office expenses, etc.
Staff expenses
Staff expenses comprise wages, salaries, social security contributions, leave and sick leave, bonuses and non-monetary employee benefits and are recognised in the year in which the services are rendered. Whenever the Kirk Kapital Group provides long-term employee benefits, the costs are accrued to match the rendering of the services by the employees.
Other operating income and expenses
Other operating income and other expenses comprise items of a secondary nature to the main activities of the Company, including gains and losses on the sale of intangible assets and property, plant and equipment.
Financial income and expenses
Financial income and expenses include interest, debt, realised and unrealised exchange adjustments, price adjustment of securities, amortisation of mortgage loans as well as additional payments and repayment under the tax prepayment scheme.
Income tax and deferred tax
The company is jointly taxed with Danish Group enterprises. The Danish income tax payable is allocated between the jointly taxed Danish companies based on their proportion of taxable income (full absorption including reimbursement of tax deficits). The jointly taxed companies are taxed under the Danish Tax Payment Scheme. Additions, deductions and allowances are recognised under financial income or financial costs.
The income tax expense or credit for the period is the tax payable on the current period’s taxable income based on the applicable income tax rate for each jurisdiction adjusted by changes in deferred tax assets and liabilities attributable to temporary differences and to unused tax losses.
The current income tax charge is calculated on the basis of the tax laws enacted or substantively enacted at the balance sheet date in the countries where the Company operate and generate taxable income. Management periodically evaluates positions taken in tax returns with respect to situations in which applicable tax regulation is subject to interpretation. It establishes provisions, where appropriate, on the basis of amounts expected to be paid to the tax authorities.
Deferred income tax is recognised on temporary differences arising between the tax bases of assets and liabilities and their carrying amounts in the Financial Statements. Deferred income tax is determined using tax rates (and laws) that have been enacted or substantively enacted by the balance sheet date and are expected to apply when the related deferred income tax asset is realised or the deferred income tax liability is settled.
Deferred income tax assets are recognised only to the extent that it is probable that future taxable profit will be available, against which the temporary differences can be utilised.
Deferred income tax liabilities are provided on taxable temporary differences arising from investments in subsidiaries, except for deferred income tax liability where the timing of the reversal of the temporary difference is controlled by the Company and it is probable that the temporary difference will not reverse in the foreseeable future.
Deferred income tax assets and liabilities are offset when there is a legally enforceable right to offset current tax assets against current tax liabilities and when the deferred income tax assets and liabilities relate to income taxes levied by the same taxation authority on either the same taxable entity or different taxable entities where there is an intention to settle the balances on a net basis.
Intangibles
Goodwill
On initial recognition, goodwill is measured and recognised as the excess of the cost of the acquired company over the fair value of the acquired assets, liabilities and contingent liabilities, as described under Business Combinations.
On recognition of goodwill, the goodwill amount is allocated to those of the Group’s activities that generate separate cash flows (cash-generating units). The determination of cash-generating units is based on the Group’s management structure and internal financial management and reporting.
Goodwill is not amortised, but is tested for impairment at least once a year.
Property, plant and equipment
Property, plant and equipment are measured at cost less accumulated depreciation and impairment losses.
Cost comprises the purchase price and any costs directly attributable to the acquisition until the time when the asset is available for use.
Borrowing costs that are attributable to the construction of property, plant and equipment are added to the costs of the assets during the period that is required to complete and prepare the asset for its intended use.
Expenditures for repairs and maintenance of property, plant and equipment is charged to the profit and loss of the year in which they were incurred. The cost of major renovations and other subsequent expenditure are included in the carrying amount of the asset or recognised as a separate asset, as appropirate, only when it is probable that future economic benefits associated with the item will flow to the Company and the cost of the item can be measured reliably.
Land is not depreciated. Depreciation on other assets is calculated using the straight-line method to allocate their cost or revalued amounts, net of their residual values over their estimated useful lives, as follows:
Buildings
10-50 years
Aircraft 10-20 years
Other fixtures and fittings, tools and equipment 3-6 years
Notes Notes
Annual Report | Group Annual Report | Group 46 47
The assets’ residual values and useful lives are reviewed, and adjusted if appropriate, at the end of each reporting period.
Items of property, plant and equipment are derecognised on disposal or when no future economic benefits are expected from their use or disposal. Gains and losses arising from disposal of property, plant and equipment are calculated as the difference between the sales price less sales costs and the carrying amount at the time of sale.
Gains and losses are recognised in the profit and loss as other income or operating expenses.
Investment properties
Investment properties are measured at cost comprising the acquisition price and costs of acquisition. The cost of own constructed investment proporties comprises the acquisition price and expenses directly related to the acquisition, including costs of acquisition and indirect expenses for labour, materials, components and subsuppliers up until the time when the asset is ready for use.
After the initial recognition the investment proporties are measured at fair value.
Investments in subsidiaries
Investments in subsidiaries are recognised and measured under the equity method, which is at the proportionale share of the net asset values in the subsidiaries.
The total net revaluation of investments in subsidiaries is transferred upon distribution of profit to "Reserve for net revaluation under the equity method" under equity. The reserve is reduced by dividend distributed to the Parent Company and adjusted for other equity movements in the subsidiaries.
The carrying amount of equity-accounted investments is tested for impairment if indications of impairment exists.
Investments in portfolio companies etc.
Investments in associates and joint venture at fair value and other equity investments comprise investments in portfolio companies and are measured at fair value on the balance sheet date. Value adjustments are recognised in the income statement.
Investments in associates and joint ventures at equity method
Investments in associates and joint ventures at equity are recognised and measured under the equity method, which is at the proportionale share of the net asset values in the associates and joint ventures.
The total net revaluation of the investments is transferred upon distribution of profit to "Reserve for net revaluation under the equity method" under equity. The reserve is reduced by dividend distributed to the Parent Company and adjusted for other equity movements in the investments.
The carrying amount of equity-accounted investments is tested for impairment if indications of impairment exists.
Fair value estimation
Fair value is the price that would be received to sell an asset or paid to transfer a liability in an orderly transaction between market participants at the measurement date. The fair value of financial assets traded in active markets (such as publicity traded derivatives and equity securities publicly traded on a stock exchange) are based on quoted market prices at the close of trading on the reporting date.
Investments in portfolio companies traded in an active market are measured on the basis of the last market price. Unlisted portfolio companies are valued either by way of a capital increase round or part sale based on the value of comparable companies as well as by applying traditional measurement methods.
Fair value for unlisted equity securities are determined by management using valuation techniques. Such valuation techniques may include earnings multiples and discounted cash flows. The valuation models are adjusted as deemed necessary for factors such as non-maintainable earnings, tax risk, growth stage and cash traps.
Fair value of certain financial investments are measured at values as communicated by fund management. In determining fair value for other financial investments, the management relies on the financial data of investee portfolio companies or on estimates by the management of the investee portfolio companies as to the effect of future developments. Although management uses its best judgement, and cross-references results of primary valuation models against secondary models in estimating the fair value of investments, there are inherent limitations in any estimation techniques.
The fair value estimates presented herein are not necessarily indicative of an amount the Group could realise in a current transaction. Future confirming events will also affect the estimates of fair value. The effect of such events on the estimates of fair value, including the ultimate liquidation of investments, could be material to the financial statements.
Leases
The right-of-use asset and corresponding lease liability will be recognised at the commencement date, the date the underlying asset is ready for use. The lease terms may include options to extend or terminate the lease when it is reasonbly certain that KIRK KAPITAL will exercise that option. Right-of-use assets are measured at cost corresponding to the lease liability recognised, adjusted for any lease incentives received. The lease liabilities are measured at the present value of lease payments to be made over the lease term. The lease payments are discounted.
Depreciations is done following the straight-line method over the lease term or the useful life of the assets.
The KIRK KAPITAL Group applies the short-term lease recognition exemption for lease contracts that, at the commencement date, have a lease term of 12 month or less for all classes of underlying assets, and the exeption for lease contracts for which the underlying asset is of low value. Lease payments on short-term leases and leases of low-value assets are recognised as expenses on a straight-line basis over the lease term.
Right-of-use assets normally have the following lease terms:
Rental of premises 1-30 years
Other assets 1-5 years
Notes Notes
Annual Report | Group Annual Report | Group 48 49
Impairment of non-current assets
The carrying aomunts of intangible assets and property, plant and equipment are written down immediately to the recoverable amount if the asset’s carrying amount is greater than its estimated recoverable amount. An impairment loss is recognised in the income statement when the impairment is identified. The recoverable amount is the higher of an asset’s fair value less cost of disposal and value in use. For the purpose of assessing impairment, assets are grouped at the lowest level at which cash flows are separately identifiable (cash-generating units).
Inventories
Inventories comprise property held for sale in the ordinary course of business. They are measured at the lower of cost under the FIFO method and net realisable value. The net realisable value of inventories is calculated at the amount expected to be generated by sale in the process of normal operations with deduction of selling expenses and costs of completion. The net realisable value is determined allowing for marketability, ob-solescence and development in expected sales sum. The cost of goods for resale, raw materials and consumables equals landed cost.
Receivables
On initial recognition, receivables are measured at fair value, and subsequently they are measured at amortised cost. Receivables are written down for expected credit losses.
Prepayments
Prepayments comprise prepaid expenses relating to rent, insurance premiums, subscriptions and interests.
Current Asset Investments
Current Asset Investments, which consists of listed bonds and other investments, are measured at fair value.
Cash and cash equivalents
Cash and cash equivalents comprise cash at bank and in hand.
Equity
Share capital
Ordinary shares are classified as equity. Incremental costs directly attributable to the issue of new shares are shown in equity as a deductions, net of tax, from the proceeds.
Dividend distribution
Proposed dividends are disclosed as a separate item under equity and recognised as a liability when declared.
Financial liabilities
Financial liabilities, including bank and financial loans, trade and other payables, are on initial recognition measured at fair value. The liabilities are subsequently measured at amortised cost.
2
Cash flow statement
The cash flow statement shows the Group's cash flows for the year broken down by operating, investing and financing activities, changes for the year in cash and cash equivalents as well as the Company’s cash and cash equivalents at the beginning and end of the year.
Cash flows from operating activities are calculated as the net profit/loss for the year adjusted for changes in working capital and non-cash operating items such as depreciation, amortisation and impairment losses, and provisions. Working capital comprises current assets less short-term debt excluding items included in cash and cash equivalents.
Cash flows from investing activities comprise cash flows from acquisitions and disposals of intangible assets, property, plant and equipment as well as fixed asset investments.
Cash flows from financing activities comprise cash flows from the raising and repayment of long term debt as well as payments to and from shareholders.
Financial Highlights
Explanation of financial ratios:
Solvency ratio =
Return on equity =
Equity at year-end x 100
Total assets at year-end
Net profit for the year x 100
Average equity
The financial ratios have been computed in accordance with the latest Guidelines issued by the Danish Finance Society.
Critical accounting estimates and judgements
In the preparation of the consolidated financial statements according to IFRS, Management is required to make certain estimates as some financial statement items cannot be reliably measured, but must be estimated as the value of assets and liabilities often depends on future events that are somewhat uncertain.
The judgments, estimates and assumptions made are based on historical experience and other factors that Management considers to be reliable, but which by their very nature are associated with uncertainty and unpredictability. These assumptions may prove incomplete or incorrect, and unexpected events or circumstances may arise. The most critical judgments, estimates and assumptions for the individual items are described below.
Critical accounting estimates
Most of the investments in associates and other investments are measured at fair value on the balance sheet date. When management does not have access to fair values from a liquid market or from portfolio managers the values are primarily estimated by using multiple factors from similar investments thus using level 3 in the fair value hierarchy.
Notes Notes
Annual Report | Group Annual Report | Group 50 51
Valuation of investments in associates and joint ventures at fair value is based on estimates and assumptions as regards the fair value of each individual company. These investments amount to DKK 4,241 million in 2021 (DKK 3,020 million in 2020).
For the majority of the investments (DKK 3,700 million in 2021) the fair value is estimated primarily using a valuation model using multiples that are estimated to be a reasonable proxy of markets multiples of comparable companies. The most subjective parameter in the valuation model is the multiples while other parameters are pro-forma adjusted operating income and adjusted net interest bearing debt. If the used multiples changes by 10%, then it would have a P&L impact of around DKKm 486 million.
It is management’s assessment that the assumptions and estimates used are reasonable.
Other substantial accounting judgment has been made in the scope of whether the management incentive program is in scope of IFRS 2 or IAS 19. It is the management assessment that as the settlement price for the call option held by the Majoity Shareholder is based on increase in equity and are linked to the participants share options, the program is not within the scope of IFRS 2, hence the requirements of IAS 19 has been used.
Executive Management only consists of one member whereas the remuneration of the Executive Management and the Board of Directors is disclosed collectively with reference to §98b (3) of the Danish Financial Statements.
Remunerations of Key Management comprise of salary, shot-term incentives based on yearly performance and long-term incentives based long-term value creation. Remunerations of Key Management amounts to DKKm 70 in 2021 and DKKm 21 in 2020. 5
Notes
2021 2020 DKKm DKKm 3 Revenue Revenue recognized over time Revenue recognized at a point in time 46 21 49 64 67 113 Revenue – 2021 Rental property Aircraft leasing Sale of property 2021 DKKm DKKm DKKm DKKm Revenue 3 43 21 67 Total 3 43 21 67 Revenue – 2020 Rental property Aircraft leasing Sale of property 2020 Revenue 4 45 64 113 Total 4 45 64 113 The entire revenue in 2020 and 2021 is earned in Denmark. 2021 2020 DKKm DKKm 4 Staff expenses Wages and salaries Pensions Other staff costs 133 2 2 53 2 1 137 56 Average number of employees 25 24 Key Management Compensation Key Management consists of Executive
and
Board
Board of Directors.
Amortisation, depreciation and impairment losses Depreciation Impairment loss 31 157 36 0 188 36 Annual Report | Group Annual Report | Group 52 53
which breaks down as follows:
Notes 2021 2020 DKKm DKKm 6 Financial income Fair value adjustments of finansial investments Interest income from financial assets Foreign exchange rate gains 363 6 5 137 9 0 374 146 7 Financial expenses Impairment losses on financial assets Interest and finance charges paid/payable for financial liabilities Exchange loss 38 7 3 0 6 0 48 6 8 Income tax Current tax: Current tax on profits for the year Current tax on profits for previous years Deferred tax for the year and previous years 87 (7) (30) 29 5 (15) 50 19
Tax on profit/loss for the year Tax on changes in equity 51 (1) 16 3 50 19 Calculated 22.0% tax on profit for the year before income tax 306 95 Tax effects of: Income from associates and joint venture Adjustment of tax relating to previous years Income from other investments Other (300) (7) 0 51 (85) 5 5 (4) 51 16 Effective tax rate 4% 4% Land and buildings Other fixtures and fittings, tools and equipment Aircrafts Property, plant and equipment in progess Leasehold improvements Lease assets –right-ofuse assets Total DKKm DKKm DKKm DKKm DKKm DKKm DKKm 9 Property, plant, equipment, leasehold improvements and lease assets Cost: At 01.01.2021 Exchange adjustment Additions during the year Disposals during the year Transfers 477 0 0 0 45 3 0 0 0 0 521 43 0 0 0 42 0 105 0 17 4 0 0 0 0 11 0 11 (3) 0 1,058 43 116 (3) 62 At 31.12.2021 522 3 564 164 4 19 1,276 Depreciation and impairment: At 01.01.2021 Exchange adjustment Depreciation for the year Impairment for the year Reversals regarding disposals Transfers 29 0 12 0 0 0 2 0 0 0 0 0 326 27 19 81 0 0 0 0 0 76 0 31 1 0 1 0 0 0 1 0 2 0 (1) 0 359 27 34 157 (1) 31 At 31.12.2021 41 2 453 107 2 2 607 Carrying amount 31.12.2021 481 1 111 57 2 17 669 Cost: At 01.01.2020 Exchange adjustment Additions during the year Disposals during the year 504 0 0 (27) 3 0 0 0 574 (53) 0 0 10 32 0 0 0 0 4 0 4 0 8 (1) 1,095 (21) 12 (28) At 31.12.2020 477 3 521 42 4 11 1,058 Depreciation and impairment: At 01.01.2020 Exchange adjustment Depreciation for the year Impairment for the year Reversals regarding disposals 18 0 11 0 0 2 0 0 0 0 337 (31) 20 0 0 0 0 0 0 0 0 0 1 0 0 0 0 2 0 (1) 357 (31) 34 0 (1) At 31.12.2020 29 2 326 0 1 1 359 Carrying amount 31.12.2020 448 1 195 42 3 10 699 Annual Report | Group Annual Report | Group 54 55
Notes
11 Investment in associates and joint ventures at fair value
10 Investment properties
Investment properties consists of rental properties together with forest and agriculture land. Geographical the properties are located either in Vejle or in the vicinity of Vejle.
Investment properties are on initial recongnition measured at cost and subsequnetly at fair value using generally accepted valuation methods. The fair value of rental properties is determined by using either an income capitalization model or basis valuation carried out by independent valuers.
Buildings valued using a capitalizations model is measured at an average rate of return of 6.5% to 7.0%. The average rate of return used, is based on an assessment of locations and condition. A change of the rate of return of 0.5% will impact the value of rental property of approx. DKK 3 million before tax.
The fair value of the forest and agriculture land is estimated at DKK 115,000 per hectare (2020: 115,000 per hectare). A change of the price per hectare of 1% will impact the value of the forest and agriculture land of approx DKK 0.6 million before tax.
Kompan Holding A/S
ApS FMD 1
Act Holding ApS
Globeteam HoldCo ApS
Globeteam Holding ApS
Virumgårdsvej 17
TPS Holding II A/S
Beck Pack
Notes Notes 2021 2020 DKKm DKKm
Cost: At 1
Disposals during the year 88 (5) 139 (51) At 31 December 83 88 Value adjustments: At 1 January Fair value adjustments during the year Reversals regarding disposals (12) 20 0 (28) 0 16 Value adjustments at 31 December 8 (12) Carrying amount 31 December 91 76
January
of entity
of registered office Nature of relationship Share capital Votes Ownership Equity at last reporting date
the last
Name
Place
Net profit/loss for
reported year Denmark Currency-m Currency-m Currency-m
A/S
Holdning ApS Scanmetals
II A/S Titan Storage Solutions A/S Dansk Træemballage A/S Danske Stenhuggerier A/S GC Rieber VivoMega Danish Horticulture Group A/S K/S Høje-Taastrup ApS Høje-Taastrup ApS Odense
TPA Holding
Søbrog
Virum
Gentofte Rønne Slagelse Hvidovre Høje Taastrup Håstrup Nørre Snede Kristiansund Esbjerg Bredsten Bredsten Associate Associate Associate Associate Associate Associate Associate Associate Associate Associate Associate Associate Associate Associate Associate Associate Associate 52 DKK 5 DKK 0 DKK 1 DKK 0 DKK 1 DKK 0 EUR 0 DKK 1 DKK 7 DKK 1 DKK 20 DKK 1 DKK 2 NOK 2 DKK 18 DKK 0 DKK 19% 30% 50% 12% 46% 50% 35% 40% 35% 3% 30% 40% 45% 32% 48% 19% 19% 27% 30% 50% 25% 46% 50% 35% 40% 35% 26% 30% 40% 45% 32% 48% 19% 19% 1,028 DKK 373 DKK 382 DKK 0 DKK 0 DKK 7 DKK 5 EUR 456 DKK 97 DKK 88 USD 493 DKK 220 DKK 62 DKK 193 NOK 0 DKK 424 DKK 0 DKK 224 DKK 33 DKK -1 DKK 0 DKK 0 DKK 1 DKK 2 EUR 32 DKK 30 DKK -0 USD 49 DKK 74 DKK 9 DKK 40 NOK 0 DKK 85 DKK 0 DKK 12 Investment in associates and joint ventures at equity method Name of entity Place of registered office Nature of relationship Share capital Votes Ownership Equity at last reporting date Net profit/loss for the last reported year Currency-m Currency-m Currency-m JointCo ApS Hafnia Management A/S Havneøen E+G A/S K/S Joinflight IV JF IV ApS KN Operating Ltd Vejle, DK Hellerup, DK Vejle, DK Billund, DK Billund, DK Limerick, IRL Associate Associate Joint Venture Joint Venture Joint Venture Joint Venture 0 DKK 1 DKK 2 DKK 40 DKK 1 DKK 0 USD 49% 20% 50% 49% 50% 50% 49% 20% 50% 49% 50% 50% 0 DKK 27 DKK 11 DKK 30 DKK 1 DKK 23 USD 0 DKK 8 DKK -9 DKK -4 DKK -0 DKK 3 USD Annual Report | Group Annual Report | Group 56 57
Copenhagen Hellerup
Virum
The Group does not have any unrecognized tax loss carryforwards.
There have been no changes in the share capital during the last 5 years.
Each A share has 10 votes at the annual general meeting. Each B share has 1 vote at the annual general meeting.
2021 2020 DKKm DKKm 13 Other equity investments Industry of investment Multisector Multisector Multisector Multisector Multisector Real Estate Geography Global Europe US Nordic Pan Asia Global 420 29 124 15 15 18 125 0 0 5 14 21 Total portfolio 621 165 14 Deferred tax Deferred tax at 01.01 Deferred tax reccognised in the income statement Other adjustments 5 (30) 25 1 (15) 19 Deferred tax at 31.12 0 5 Deferred tax relates to: Property, plant, equipment and investment properties Other liabilities Financial contracts (12) 0 12 (5) (15) 25 0 5 Of which
deferred tax
Of which
deferred tax
12 12 8 13
Notes Notes
presented as
assets
presented as
liabilities
2021 2020 DKKm DKKm 15 Inventories Work in progress Finished goods and goods for resale 10 82 44 93 Total inventories 92 137 16 Share capital Number of shares Nominal value (TDKK) The share capital comprise: A shares B shares 57,709,000 42,291,000 58 42 Share capital 100,000,000 100
All shares have nominal value of DKK 1.
Annual Report | Group Annual Report | Group 58 59
17 Related parties
KIRK KAPITAL A/S’ related parties comprise Casper Kirk Johansen, Marianne Fyhring Johansen, Anders Kirk Johansen and close famlily members and the Board of Directors and the Executive Management of KIRK KAPITAL. Related parties also comprise subsidiaries and associates. Related parties further comprise companies where the mentioned shareholders have significant influence: Selmont A/S, M. KIRK A/S, A. KIRK A/S, C2 A/S, CKKJ Cosmo ApS, JKJ Cosmo ApS, Edith & Godtfred Kirk Christiansens Fond and subsidiaries.
Casper Kirk Johansen, Marianne Fyhring Johansen, Anders Kirk Johansen have as shareholders and/or voting rights significant influence in KIRK KAPITAL A/S.
In the financial year, a limited number of transactions related to services took place between the owners of KIRK KAPITAL A/S and the KIRK KAPITAL Group. These services were paid on normal market terms.
There were no transactions with the Board of Directors or the Executive Management besides transactions related to the employment.
For information about remuneration to the Board of Directors and the Executive Management, see note 4.
Transactions with related parties:
Year-end balances arising from transactions with related parties:
related parties
No other year-end balances or transactions have taken place during the year with the Board of Directors, the Executive Management, major shareholders or other related parties.
18 Commitments and contingent liabilities
Contingent liabilities
Remaining commitment regarding participation in investment projects amount to a maximum of DKK 880m.
The Group has provided a guarantee of a maximum of DKK 226m to financial institutions regarding loans and other engagements.
Sercurity has been given in Land and buildings and investments properties at a net carrying amount of DKK 508m for the mortgage loans.
The Parent Company has entered into a cash pool agreement. As per. 31 December 2021 the net withdrawl on the cashpool aregreement was DKK 96m.
Notes Notes
2021 2020 DKKm DKKm
Other
Administration and management Fee Income Rental income Salaries 3 1 72 8 1 22
related parties
Other
Receivables Payables 3 81 4 23
Annual Report | Group Annual Report | Group 60 61
Notes Notes
Financial risk management
Financial risk factors
The Group’s financial risk management is mainly managed by its two investment departments since financial risk exposure is centered around the Group’s strategic and financial investments. Overall risk analysis is performed in connection with setting the Group’s investment strategy which is discussed with and approved by the Board.
The Group’s financial risk profile is mainly dominated by market risk where the Group has high exposure to security prices and moderate exposure to interest rates and currency rates. To a lesser extend the Group is also exposed to Credit risk and Liquidity risk.
Derivatives financial instruments is mainly used to reduce financial risk exposure. Where all relevant criteria are met, hedge accounting is applied to remove the accounting mismatch between the hedging instrument and the hedged item. This will effectively result in recognizing interest expense at a fixed interest rate for the hedged floating rate loans or contracts and investment in foreign currency at the fixed foreign currency rate for the hedged investments. They are presented as current assets or liabilities to the extent they are expected to be settled within 12 months after the end of the reporting period.
For hedges of net investments in foreign currencies and of hedges of financial assset denominated in foreign currencies, the group enters into hedge relationships where the critical terms of the hedging instrument match exactly with the terms of the hedged item. The group therefore performs a qualitative assessment of effectiveness.
The Group uses foreign currency forwards to hedge its exposure to foreign currency risk. Under the Group's policy the critical terms of the forwards must align with the hedged items.
Market risk
Share price risk
The Group's current assets investments is directly exposed to movement in security prices since 63% of current assets investments is listed equities and valued using the observable prices on stock-exchanges. 10% in short-term movement in stock prices would affect the portfolio with 12% in the short term, due to a higher volatility in comparison to the market.
Investments in associates and joint ventures is measured at fair value using non-observable data, but data which to some extend is related to long-term market conditions. Investments in associates and joint ventures is thus not directly exposed to short term stock price movement, but risk is related to Long-term conditions in the market.
Foreign exchange risk
The Group’s currency exposure can be divided in two categories of exposure and risks.
One category is investments denominated in currencies other that DKK/EUR. As per 31 December 2021 investments denominated in currency other than DKK/EUR amount to DKK 841 million and the exposure is mainly related to USD. Derivatives is used to hedge the currency risk and the net exposure is reduced to DKK 670 million. The hedging rate in USD is per 31 December 2021 20%. The average hedging rate in USD for the year was 30%. The duration of the hedging contracts all have a maturity of less than three months after the end of the reporting period.
A change of 10% in USD exchange would have short-term effect on the total comprehensive income by DKK 67 million.
The second category is the underlying currency risk in investment denominated in DKK/EUR where the investments is operating in a global market. Some of the investments have currency exposures due to imbalances in revenue and expenses generated in foreign currencies mostly related to USD. The risk is managed by the investments.
Interest rate risk
The Group’s interest rate risk is mainly related to the groups fixed income investments and the Groups debt instruments.
An increase in interest rate of 1% would negatively affect the fixed income investments with 2.9%.
An increase in interest rate of 1% would positively affect the Groups debt instruments with 2,62%.
The interest rate risk is considered moderate.
Credit risks
The Group’s primary credit exposure is related to fixed income investments, financial instrument, receivables regarding finance leases and cash positions. Major single exposures are either exposures to counterparts with good credit ratings and/or other supporting security measures is in place. The overall credit risk is considered low.
Liquidity risk
The Group manages its liquidity risk by contiguously monitoring and assessing the liquidity positions. Based on the relatively liquid Current Assets Investments and relatively low level of borrowings and liabilities the liquidity risk is considered low.
Maturity analysis
The table below analyses the Group’s financial liabilities into relevant maturity groupings based on the remaining period at the balance sheet date to the contractual maturity date. The amounts disclosed in the table are the contractual undiscounted cash flows.
19
Annual Report | Group Annual Report | Group 62 63
The Group’s financial assets are either measured at amortized cost or fair value through profit and loss. The above specified financial assets and liabilities at fair values have been measured using either from the below three levels of fair value hierarchy:
Level 1:
Quoted prices in active markets for identical markets
Level 2:
Inputs other than quoted prices included within level 1 that are observable for the assets either directly or indirectly
Level 3:
Input for the liabilities and assets that are not based on observable market data. These fair value measurements is form either external portfolio managers or by management estimates using multiples from similar investments or using fair value calculations models such as DCF models.
20 Fee to auditors appointed at the general meeting Audit
Non-derivatives Less than 1 year Between 1 and 5 year More than 5 years Total DKKm DKKm DKKm DKKm As at 31.12.2021 Credit institutions Trade payables Deposits Other payables 242 2 1 191 0 0 0 50 263 0 0 50 505 2 1 291 436 50 313 799 As at 31.12.2020 Credit institutions Trade payables Deposits Other payables 539 12 1 145 0 0 0 0 264 0 0 0 803 12 1 145 697 0 264 961 Fair value of debt correspond approximately to amortised cost of debt. Financial assets and liabilities per measurement category 2021 2020 DKKm DKKm Financial assets Financial assets at amortised cost: Non current receivables Other loans and receivables Cash and cash equivalents 67 23 91 262 24 147 Financial assets at fair value through profit or loss (FVPL): Investments in associates and joint venture Current Asset Investments Other investments 4,241 1,831 621 3,020 1,878 165 Financial liabilities Liabilities at amortised cost: Trade and other payables Credit institutions Deposits Other payables 2 505 1 291 12 803 1 145 Measurement and fair value hierarchy
Notes Notes
2021 2020 DKKm DKKm
Tax
Non-audit services 1 1 0 1 1 1 2 3 Annual Report | Group Annual Report | Group 64 65
fee
advisory services
Notes Notes
21 Lease liabilities
Lease liabilities expiring within the following periods from the balance sheet date:
22 Events after the balance sheet date
No events materially affecting the assessment of the Annual Report have occurred after the balance sheet date.
23 List of group companies
in the profit and loss statement
Interest expenses related to lease liabilites
Expenses relating to short term leases, not capitalized
relating to leases of low-value assets, not capitalized
In 2021 the Group has paid DKK 2,0m regarding lease agreements where of interest expenses related to lease liabilities amount to DKK 0,1m and repayment of lease liability amount to DKK 1,9m.
KIRK
Marie
Marianne Kirk A/S*
Anja Kirk
*Financial Statements are presented in USD, which is the fundctional currency of the Company.
2021 2020 DKKm DKKm
Less than 1 year Between 1 and 5 year More than 5 years 2 6 10 1 5 4 18 10 Classifed in statement of balance sheet: Non-current liabilities Current liabilities 16 2 9 1 18 10 Recognized
0 0 0 0 0 0 0 0
Expenses
Name Place of Registered Office Share Capital Votes Ownership DKKm DKKm DKKm
Kirk Kapital Strategic Investments A/S Kirk Kapital Fondsmæglerselskab A/S
Subsidiaries:
A/S
KIRK Farm
Shipping A/S*
Gunhild Kirk A/S*
Edith Kirk A/S*
Kirk A/S*
A/S*
Aviation A/S*
Komplementarselskab ApS*
P/S* KIRK Property A/S Havneøen 1 P/S Komplementarselskabet Havneøen 1 ApS Vejle, Danmark Vejle, Danmark Vejle, Danmark Vejle, Danmark Vejle, Danmark Vejle, Danmark Vejle, Danmark Vejle, Danmark Vejle, Danmark Vejle, Danmark Vejle, Danmark Vejle, Danmark Vejle, Danmark Vejle, Danmark Vejle, Danmark 100.0 DKK 1.4 DKK 0.5 DKK 0.5 DKK 0.5 DKK 0.5 DKK 1.5 DKK 0.5 DKK 0.5 DKK 10.0 DKK 0.1 DKK 3.2 DKK 0.6 DKK 0.4 DKK 0.1 DKK 100% 100% 100% 100% 100% 100% 100% 100% 100% 57% 57% 57% 100% 100% 100% 100% 100% 100% 100% 100% 100% 100% 100% 100% 40% 40% 40% 100% 100% 100%
KIRK
KKAG
KA1
Annual Report | Group Annual Report | Group 66 67

Statement by Management on the annual report
The Board of Directors and the Executive Board have today considered and approved the annual report of Kirk Kapital A/S for the financial year 1 January31 December 2021.
The Annual report has been prepared in accordance with International Financial Reporting Standards as adopted by the EU, and further requirements in the Danish Financial Statements Act.
In our opinion, the consolidated financial statements and the parent financial statements give a true and fair view of the Group’s and the Parent’s financial position at 31 December 2020 and of the results of their operations and cash flows for the financial year 1 January – 31 December 2021.
In our opinion, the management commentary contains a fair review of the development of the Group's and the Parent’s business and financial matters, the results for the year and of the Parent’s financial position and the financial position as a whole of the entities included in the consolidated financial statements, together with a description of the principal risks and uncertainties that the Group and the Parent face.
We recommend the annual report for adoption at the Annual General Meeting.
Vejle, 26 April 2022
Executive Board Kim Gulstad
Board of Directors Casper Kirk Johansen, Chairman
Anders Kirk Johansen
Peter Beske Nielsen
Birgitte Nielsen
Jens Winther Moberg
Annual Report | Management’s Statement Annual Report | Management’s Statement 69 68


