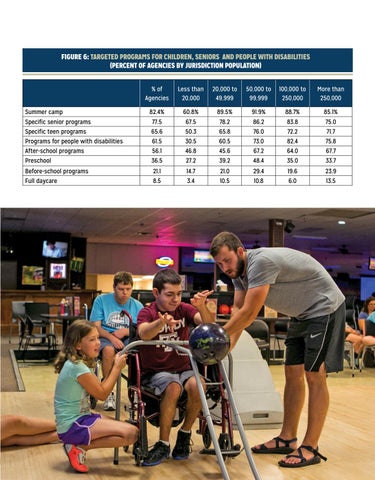
FIGURE 6: TARGETED PROGRAMS FOR CHILDREN, SENIORS AND PEOPLE WITH DISABILITIES (PERCENT OF AGENCIES BY JURISDICTION POPULATION) % of Agencies
Less than 20,000
20,000 to 49,999
50,000 to 99,999
100,000 to 250,000
More than 250,000
82.4%
60.8%
89.5%
91.9%
88.7%
85.1%
Specific senior programs
77.5
67.5
78.2
86.2
83.8
75.0
Specific teen programs
65.6
50.3
65.8
76.0
72.2
71.7
Programs for people with disabilities
61.5
30.5
60.5
73.0
82.4
75.8
After-school programs
56.1
46.8
45.6
67.2
64.0
67.7
Preschool
36.5
27.2
39.2
48.4
35.0
33.7
Before-school programs
21.1
14.7
21.0
29.4
19.6
23.9
Full daycare
8.5
3.4
10.5
10.8
6.0
13.5
Summer camp
2019 NRPA AGENCY PERFORMANCE REVIEW
13