FEATURES
SECTOR FOCUS: E&S REGIONAL PERSPECTIVE
WEST
So goes the West, so goes the US? Perhaps. Home to seven of the 15 state stamping offices, the region remains a bit of a bellwether for the rest of the country. Two of the three offices with the greatest premium increases in the first half of 2021 were in the West: Oregon experienced a 36.4% increase in premiums, while Arizona had a 33% boost compared to mid-year 2020. The growth in Arizona is largely attributed to a building boom, while in other states, premium growth is being driven by casualty coverages. In addition, Idaho saw a 27% increase in transactions, spurred by filings in high-limit accident & health. “The E&S insurance market in the West region is experiencing positive momentum,” says Travis Blackford, regional president of the West Coast wholesale division at Hull & Co. “There is a noticeable uptick in submission count. Inventory provides opportunity, and we have a lot of it.” As a result, rates are increasing. Blackford says there’s been a 3% to 5% boost in the binding contract space and a 5% to 10% increase in the brokerage primary casualty space. “Excess is still a moving target,” he says, citing 10% to 15% increases on clean business and 20% on accounts with losses or tough classes of business, such as large fleet exposures. “The real issue right now is excess carriers’ change in appetite, along with limited capacity and shorter limits offered,” Blackford says. “The excess space can be best described as ‘cleanup on aisle nine.’ In brokerage property, we are seeing a 5% to 10% rate increase with tightening of terms and conditions. If a property is wildfire-exposed in the West, rates can be double.” Meanwhile, new residential and commercial construction has been booming on the West Coast. Blackford says his casualty team has been active writing wrap-up and projectspecific policies for retail partners. He also notes that cannabis has been a growth engine, not only in the West but also nation-
34
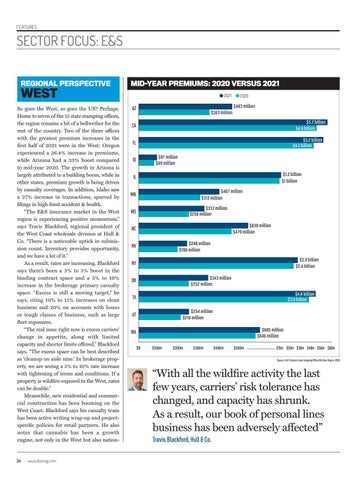
MID-YEAR PREMIUMS: 2020 VERSUS 2021 2021
2020 $483 million
AZ
$363 million $5.7 billion $4.6 billion
CA
$5.2 billion $4.2 billion
FL $97 million $89 million
ID
$1.2 billion $1 billion
IL $407 million $312 million
MN
$337 million $256 million
MS
$630 million $470 million
NC $248 million $196 million
NV
$2.9 billion $2.4 billion
NY $343 million $252 million
OR
$4.6 billion $3.9 billion
TX $254 million $216 million
UT
$685 million $646 million
WA $0
$100m
$200m
$300m
$400m
$500m
$1bn $2bn $3bn $4bn $5bn $6bn Source: 2021 Surplus Lines Stamping Office Mid-Year Report, WSIA
“With all the wildfire activity the last few years, carriers’ risk tolerance has changed, and capacity has shrunk. As a result, our book of personal lines business has been adversely affected” Travis Blackford, Hull & Co.
www.ibamag.com
32-37_Wholesale E&S Market Report 2021-SUBBED.indd 34
27/08/2021 3:29:05 am