Legal services for farmers & rural businesses Call us today or visit our website:
01227 763939 furleypage.co.uk
BLIGHTING RURAL COMMUNITIES
Farmers are picking up the pieces – and the bill – as illegal fly-tipping continues to blight the countryside.
54
Newly-released figures from DEFRA show that there were more than a million incidents of fly-tipping on public land in the past year, and more than 100,000 in the South East alone. Councils in England dealt with 1.08 million fly-tipping incidents in 2022/2023, though these figures only account for waste illegally dumped on public land and reported to the authorities. The Country Land & Business Association (CLA), which represents around 27,000 rural businesses across England and Wales, believes these figures only tell a fraction of the story. Many fly-tipping incidents occur on privately owned land, which the CLA believes paints an even more damaging picture of the financial burden and environmental impact of fly-tipping. While the association claims the situation is so bad that one of its members pays £50,000 a year to clear up waste, the figures also show a 19% drop in the number of fixed penalty notices issued. Regional Director Tim Bamford said the published figures “barely scratch the surface of a crime that’s blighting rural communities, with incidents on private land going unrecorded on a mass scale. "Farmers and landowners bear the cost of removing rubbish and they pay on average £1,000 to remove waste. This is not a victimless crime - in some cases they have paid up to £100,000 to clear up other people’s mess or risk facing prosecution themselves. “It’s not just litter blotting the landscape, but tonnes of household and commercial waste which can often be hazardous – even including asbestos and chemicals
– endangering farmers, wildlife, livestock, crops and the environment. “While courts can sentence offenders to prison or unlimited fines, prosecutions are rare and criminals clearly do not fear the system. We are calling for local authorities to help clear fly-tipping incidents on private as well as public land, while the various enforcement agencies must be properly trained and resourced. “Without more progress farmers, not the criminals, will continue to pay the price.” Colin Rayner, who farms in Berkshire and Surrey and suffers fly-tipping on a weekly basis, said: “We feel we have been abandoned by the law makers and law enforcers. Fly-tipping is a very expensive, ugly plague on the countryside and landowners.” His concerns were shared by Tim Hayward, farm manager at Woolley Park, near Wantage in Oxfordshire, who commented: “We have consistent dumps of builders’ and household waste, car parts, tyres and furniture. “We border two local authorities. One of these has more stringent measures at their recycling centres than the other, which leads to more dumping. Local authorities are also draconian in their responsibilities of clearing rubbish from the highways and not from private land.” Laurie Wates said the Dunsfold and Cranleigh areas in Surrey suffered an “excessive amount” of fly-tipping, adding: “It is like there is absolutely no law enforcement around this in our area. This is meant to be the beautiful Surrey Hills and it is not. “The government just does not seem to take this crime seriously. I have reported eight fly-tips since June on a few lanes in our area.”
FEBRUARY 2024 | WWW.SOUTHEASTFARMER.NET
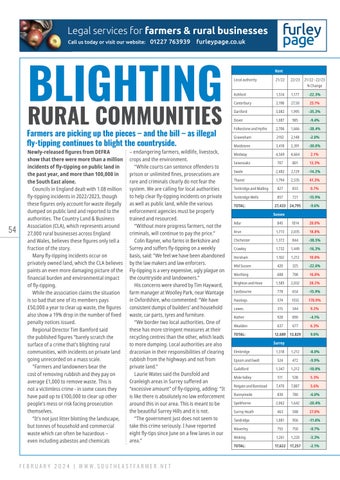
Kent Local authority
21/22
22/23
21/22 - 22/23 % Change
Ashford
1,514
1,177
-22.3%
Canterbury
2,198
27,50
25.1%
Dartford
3,082
1,995
-35.3%
Dover
1,087
985
-9.4%
Folkestone and Hythe
2,706
1,666
-38.4%
Gravesham
2192
2,148
-2.0%
Maidstone
3,418
2,391
-30.0%
Medway
4,569
4,664
2.1%
Sevenoaks
707
801
13.3%
Swale
2,482
2,129
-14.2%
Thanet
1,794
2,535
41.3%
Tonbridge and Malling
827
833
0.7%
Tunbridge Wells
857
721
-15.9%
TOTAL:
27,433
24,795
-9.6%
Sussex Adur
845
1014
20.0%
Arun
1,713
2,035
18.8%
Chichester
1,372
844
-38.5%
Crawley
1,732
1,449
-16.3%
Horsham
1,102
1,212
10.0%
Mid Sussex
420
325
-22.6%
Worthing
688
798
16.0%
Brighton and Hove
1,585
2,032
28.2%
Eastbourne
778
654
-15.9%
Hastings
574
1555
170.9%
Lewes
315
344
9.2%
Rother
928
890
-4.1%
Wealden
637
677
6.3%
TOTAL:
12,689
13,829
9.0%
Surrey Elmbridge
1,318
1,212
-8.0%
Epsom and Ewell
524
472
-9.9%
Guildford
1,347
1,212
-10.0%
Mole Valley
511
538
5.3%
Reigate and Banstead
7,470
7,887
5.6%
Runnymede
830
780
-6.0%
Spelthorne
2,062
1,642
-20.4%
Surrey Heath
463
588
27.0%
Tandridge
1,081
956
-11.6%
Waverley
755
750
-0.7%
Woking
1,261
1,220
-3.3%
TOTAL:
17,622
17,257
-2.1%