11 minute read
Thrust Force Analysis of a Rotating Ionocraft Under High Voltage. Rae-Zan Belen

Thrust Force Analysis of a Rotating Ionocraft under High Voltage
Advertisement
INTRODUCTION
In the early 1920s, Brown and Biefeld [1], [2] discovered that when a very high voltage is applied to an asymmetric capacitor, a force is produced parallel to the electrodes and causes a thrust in the direction of the positive one. Modifying the geometry of the asymmetric capacitor results in a lightweight ionocraft or “lifter,” that may represent a candidate for an alternative novel propulsion system with no moving parts. The potential of this ionocraft to revolutionize future transports with a novel technology has piqued the interest of the US Army [3], [4], the US Navy [5], NASA [6], as well as private companies such as the Honda Corporation [7].
Since the discovery of this thrust force in the nineteen twenties, its origin has been highly speculated upon, and is still poorly understood. There have been several theories proposed to predict the magnitude and origin of this force. The leading theory involves the ionic wind effect (Biefeld-Brown), which describes the polarization of air molecules as the source of propulsion. Other speculative theories also include electrogravitics, which consider antigravity as a possible source. None of these theories however are able to predict the correct magnitude of the thrust force (three order of magnitude lower) [3].
An additional difficulty arises when attempting to experimentally measure the thrust force through kinematic variables due to the high variation of motion of the ionocraft’s lift. If the kinematic variables prove to be a reliable method to infer the dynamics of the system, it is essential to control its motion. Therefore, in this experiment, we decided to constraint the ionocraft into a controlled rotational configuration in order to analyze the ionocraft’s motion on a fixed flight path.
PURPOSE
The purpose of this research is to confirm the constant behavior and magnitude of the thrust force of an ionocraft constrained to move in a circular motion.
METHOD
The method employed in this experiment involved the use of Newton’s second law Σ τ = Iα, to derive the theoretical functional form of the angular displacement of the lifter θ (t) a function of the thrust force (F), the moment of inertia (I), the position of the center of mass of the lifter (r), and the frictional force (f). The experimental angular displacement was then measured, and a nonlinear regression was performed to match the theoretical function with the experimental data by adjusting the value of the thrust force F.
Design Of The Experimental Set-Up
First, the system was designed on SolidWorks in order to obtain necessary values required to fit the theoretical model.
In order to perform a regression analysis between the theoretical model of θ (t) and the experimental data, the knowledge of 2 essential values are required: the moment of inertia of the lifter (I) and the location of its center of mass (r) with respect to the rotating shaft. Since our system is rotating perpendicular to the force due to gravity, the mass of the system was not considered explicitly (it only affected the moment of inertia of the system).
SEQUENCE OF DATA ACQUISITION
1) Frictional force
The friction present in our system comes from three sources: the drag, the friction in the bearings, and the surface friction. We considered two possible models for
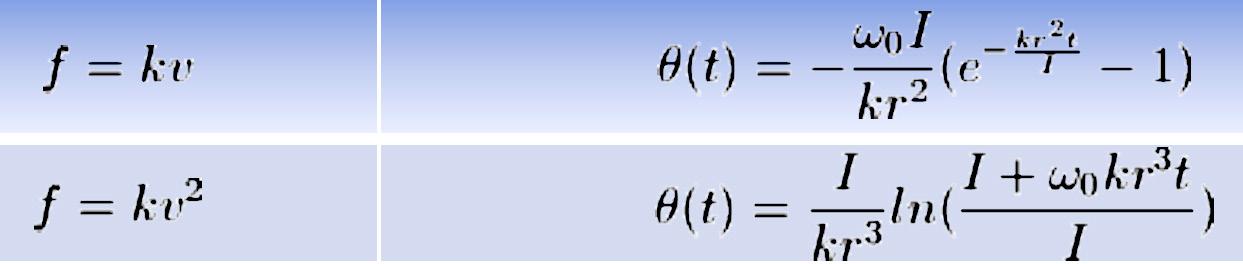
the frictional force: f = kv and f = kv 2 . We derived the functional form of the theoretical angular displacement as a function of time t using both models. Applying Newton’s second law -rf = Ia, we first rewrote our equation in terms of the angular velocity
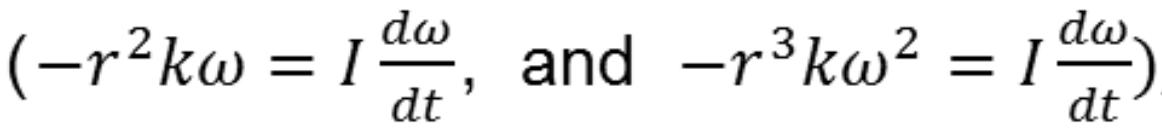
separated the variables t from w, integrated once, separated our variables t and θ once more before integrating a second time. Table 1 below (theoretical
prediction of the angular displacement as a function
of time for each model of the frictional force) shows our final prediction for both models:
In order to estimate the frictional force present in our system, we gave an initial angular velocity to our rotating system and let it rotate freely until it stops while measuring the angular displacement with respect to time. A nonlinear regression analysis was then performed between each theoretical model of the angular displacement and the experimental data in order to obtain the value of k. The magnitude of the error given by GnuPlot for each value was used to identify which model of the frictional force best fit our data (smallest error in the k value).
2) Powered system
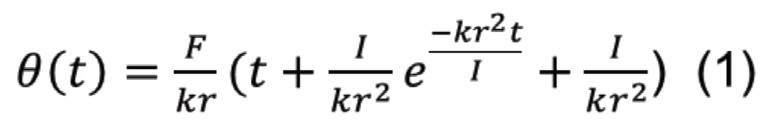
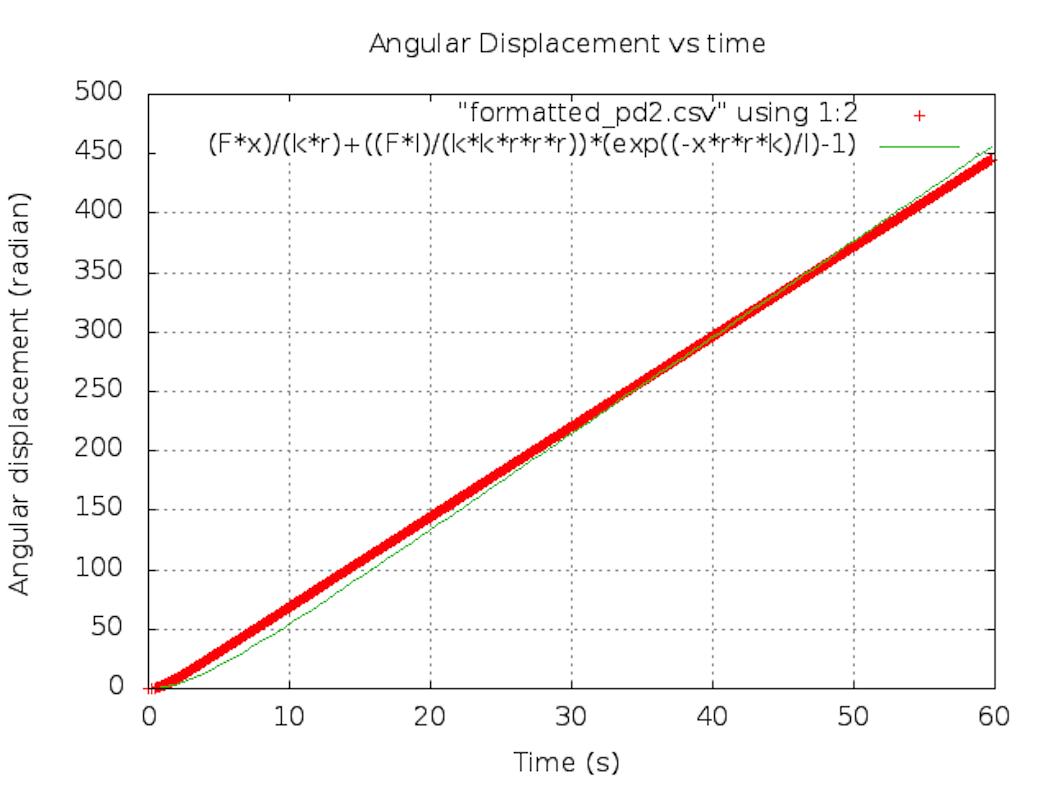
The second stage of the experiment was to power our ionocraft with 40kV volts from rest, and let it rotate for 60 seconds while measuring the angular displacement with respect to time. We proceeded in a similar manner as for the frictional force method, but also included the thrust force in our derivation: -rf + rF = Ia. The following equation for the angular displacement as a function time was obtained:
A nonlinear regression was performed again between the above equation and the experimental data of our powered system to adjust the optimum value of the thrust force F in order to obtain the best possible fit.
RESULTS
The two necessary experimental values obtained from Solidworks were the moment of inertia (I = 0.00155 kg m 2 ), and the distance of the ionocraft’s center of mass with respect to the center of mass of the rotating shaft (r = 0.135 m). The results of the regression analysis to obtain the optimum value of for the frictional force are given in the table 2 below (k values obtained from
regression analysis for each model of the frictional
force ). Since the uncertainty is smaller for f = kv, the precision of the best fit and of k is higher and this model is chosen.
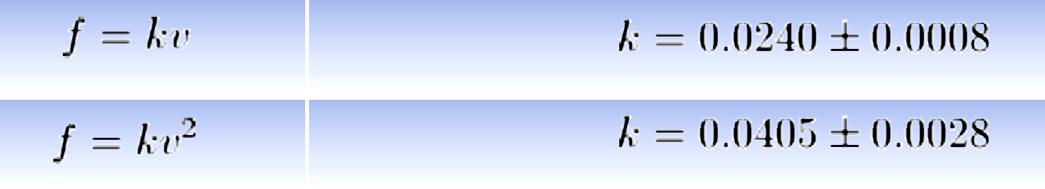
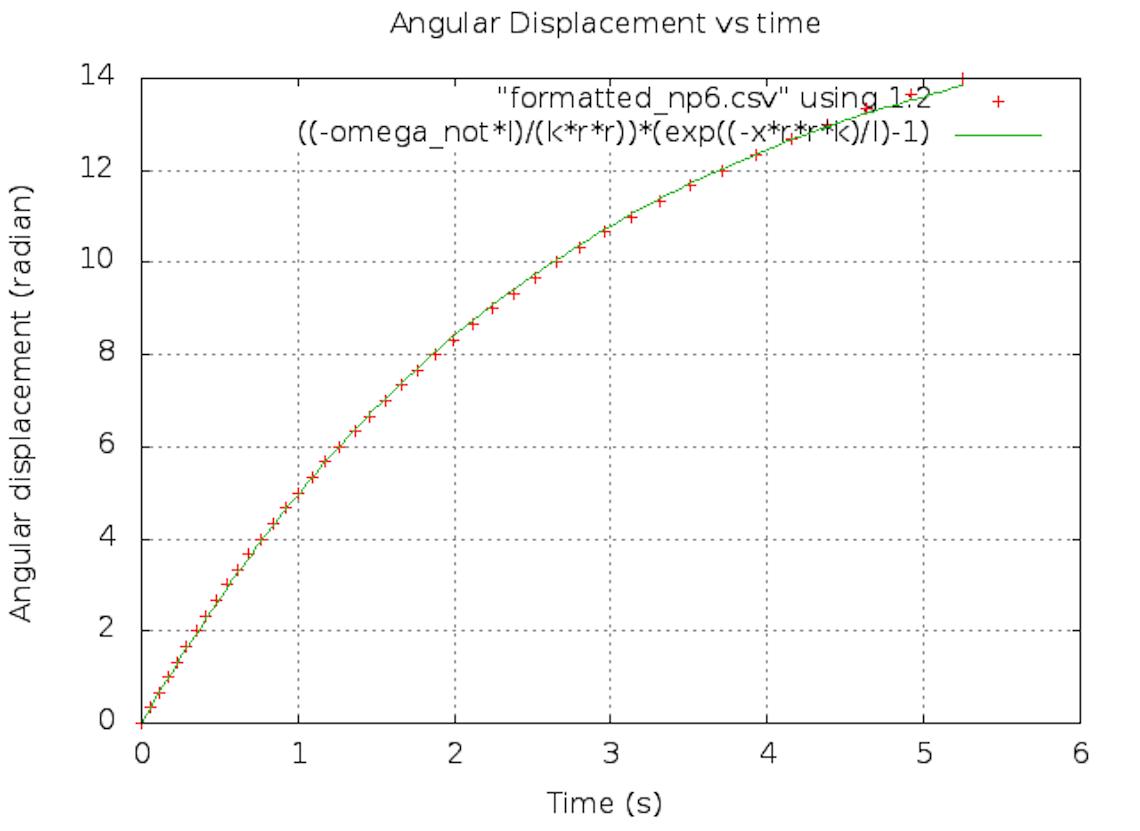
Based on the value of our uncertainties, f = kv appeared to be the most adequate model as confirmed
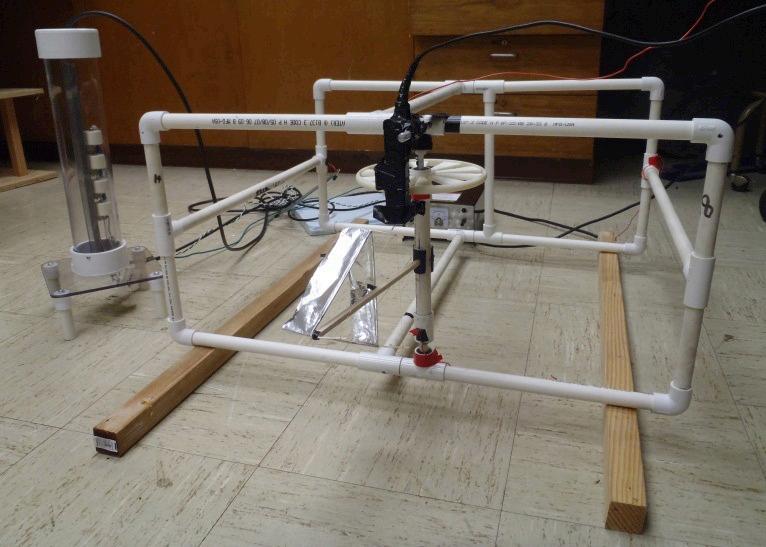
Figure 1: Nonlinear Regression using f = kv.
Figure 2: Nonlinear Regression using
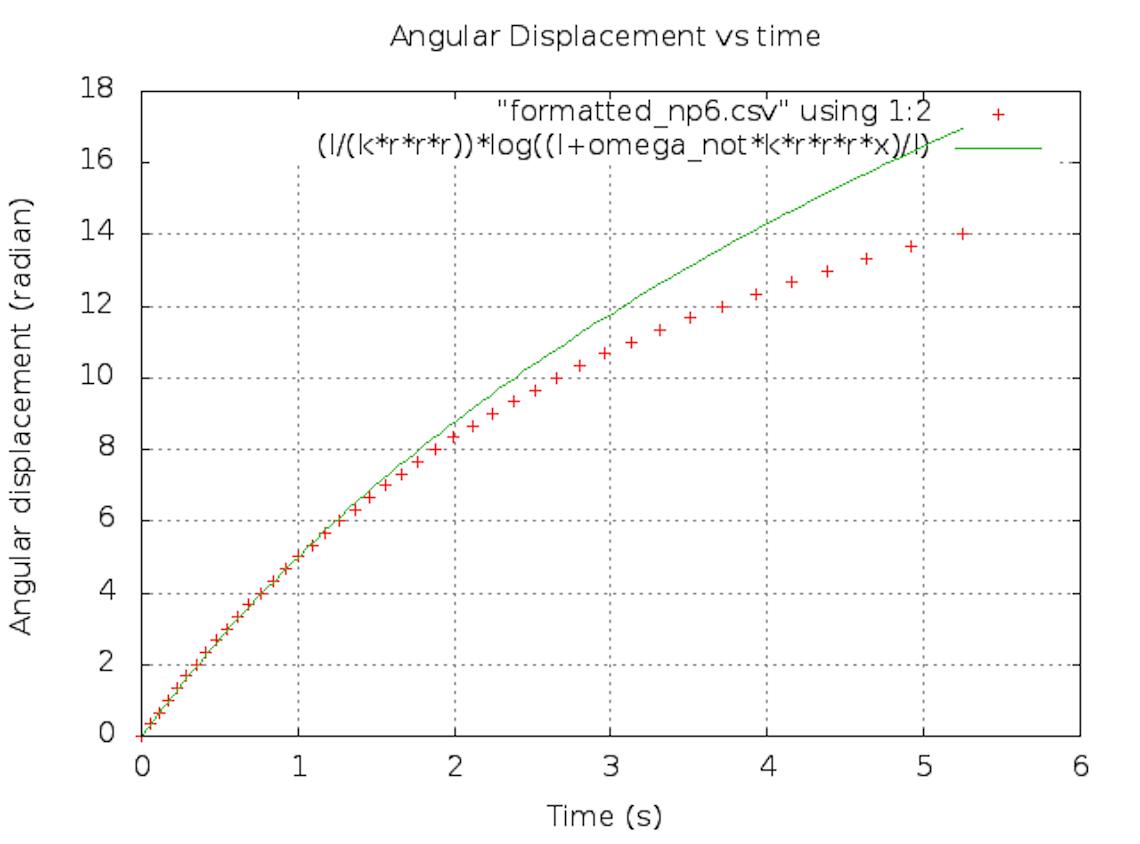
f = kv 2 .
by a visual inspection of each case treated.
The results of the regression analysis performed using data obtained from the ionocraft system powered by 40kV, and equation (1), provided the following value for the thrust force: F=0.029856 +/- 0.000273 N.
Figure 3: Linear Regression using Equation (1).
DISCUSSION AND CONCLUSION
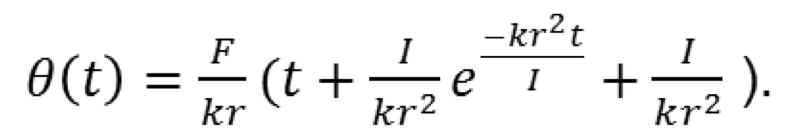
Although I initially thought the model f = kv 2 would have been the best fit, after obtaining the frictional force value, the model f = kv turned out to be the best fit to determine the thrust force. Throughout this project, I have made progress by determining the theoretical analysis for the horizontal configuration of the rotating ionocraft system. I evaluated the torque and found the equation of the angular displacement of the rotating system. The best fit equation for the angular displacement was determined as
From here, the equation was evaluated assuming that the system started at rest with a friction directly proportional to the velocity where the thrust force was determined as 0.029856 +/- 0.000273 N. Although the thrust force value was determined, there is still a lot of work that needs to be done to complete the theoretical analysis of the rotating ionocraft system.
FUTURE RESEARCH
In the future, I could 1) decouple the friction term into three different distinct types in order to obtain a better accuracy 2) increasing the number of ionocrafts in our configuration to confirm that the magnitude of the thrust force is simply additive (by a factor of n in our theoretical prediction). In order to achieve a better frictional force model, we will need to get better bearings for the configuration and obtain precise values of the frictional coefficients from the manufacture.
REFERENCES
[1] Brown, Thomas T. “How I Control Gravity”.
Science and Invention. August 1929. [2] Brown, Thomas T. “Electrokinetic Apparatus”.
“U.S. Patent No. 2,949,550’. August 16,1960. [3] Bahder ,Thomas B. & Chris Fozi, “Force on an Asymmetric Capacitor,” Army Research
Laboratory, March 2003. [4] Miller,William M., Paul B. Miller, Timothy
J Drummond. “Force Characteristics of
Asymmetrical Capacitor Thrusters in Air,” Army
Research Lab-TR-3005, Dec 2002. [5] United State Department of Labor. “Ozone
Chemical Sampling Information” http:// www.osha.gov/dts/chemicalsampling/data/
CH_259300.html. [6] “Is ablation responsible for Asymmetric
Capacitor Thrust in Vacuum?” Proposal by
Quantum Potential Corporation in response to 2011 NASA SBIR Solicitation, Web pdf. [7] Martins, Alexandre A. “Modeling of an EHD
Corona Flow in Nitrogen Gas Using an
Asymmetric Capacitor for Propulsion.” Journal of Electrostatics, Vol 69, Issue 2, 133–138, April 2011.
I would like to acknowledge the National Science Foundation for the funding they have provided to support my research, my advisor Dr. Hervé Collin, our STEM Coordinator Mrs. Keolani Noa, the Kapi`olani Community College STEM Program, Logan Tamayo, Michelle Chu, James Bynes, and Lisa Kotowski. Much mahalo to my family and friends for their support towards the completion of this project.
CanSat 2013
By Kelsey Kawaguchi, Diamond Tachera, Rae-Zan Belen, McClyde Gaborno, Taylor Viti, Logan Tamayo, and Joshua Tamayo (Faculty Mentor: Hervé Collin, Ph.D.)
INTRODUCTION
The International CanSat Competition, sponsored by the American Astronautical Society (AAS), the American Institute of Aeronautics and Astronautics (AIAA), and NASA, is an annual event that engages undergraduate and graduate students in the design, the fabrication, and the launch of a satellite-like system in a space-related mission. This mission simulates a sensor payload traveling through a planetary atmosphere sampling the atmospheric composition during descent.
OBJECTIVES
The objectives of the 2013 mission are to: 1.
2.
3.
4.
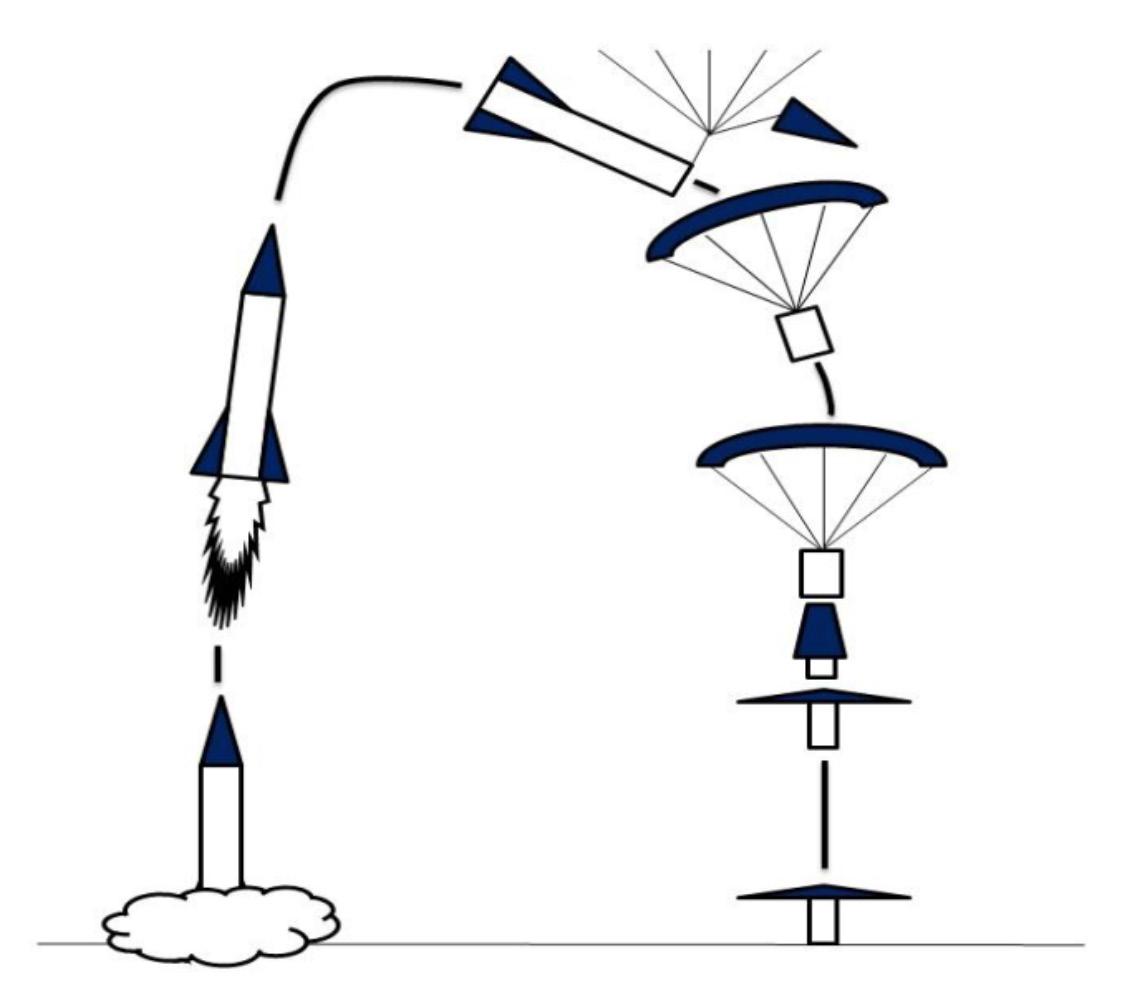
5. Provide a safe flight and landing for an egg while collecting data and performing various maneuvers. Deploy a container from a rocket at approximately 670 meters above earth surface. Control the descent rate of the payload with a passive control system at 20 m/s until 400 meters. Release the payload from the container and deploy an aero-breaking system responsible for actively control the descent rate to 20 m/s. Transmit telemetry data throughout the duration of the entire flight, and display in real time at the Ground Control Station (GCS).
Figure 1. System Concept of Operation 6. Measure the impact force of the lander at a frequency of 100 Hz.
METHOD
The design process has been broken down in several main subsystems aligned with the mission requirement guidelines:
Physical Layout Descent Rate Control Deployment Mechanism and Aero breaking Structure Sensors and Communications
Physical Layout
The Cansat is composed of two systems: a payload (Figure 2) and a container (Figure 3). The container’s role is to protect the payload from apogee to 400
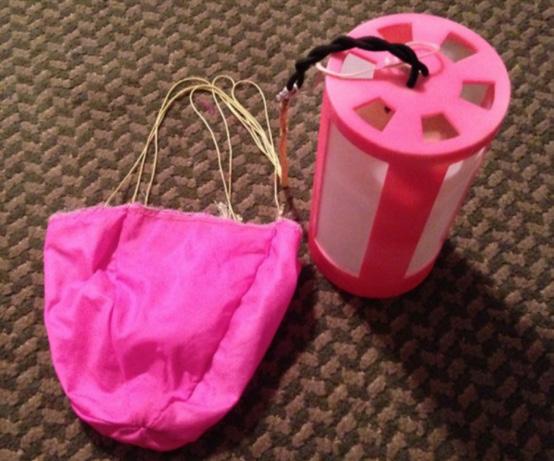
meters, and control the descent rate with a parachute.
Figure 2 (Left). Physical layout of the payload.
Figure 3 (Above). Container connected to the parachute.
Descent Rate Control
The first deployment occurs at apogee, an altitude of approximately 700m. The passive descent control system, a parachute, must ensure that the rate of the Cansat is 20m/s until 500m. In order to design and
predict the parachute diameter D, equation (1) is used:
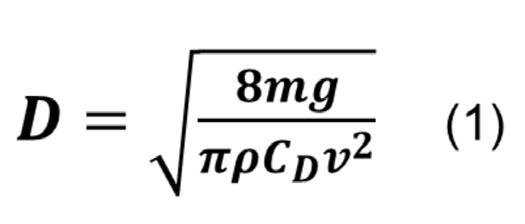
Where m is the mass, g the acceleration due to gravity, ρ the density of the air, C D the drag coefficient, and v the requirement descent rate.
Deployment Mechanism and Aero Breaking Structure
At 500m above earth surface, the sensor payload must deploy itself from the container and is required to utilize its own active descent control system until landing. The deployment mechanism is controlled by the rotation of two servos that releases the base of the container at 400 meters.
The payload is able to slide out of the container, and triggers its active descent rate mechanism with four springs located at the spill hole of the aero breaking system, as shown in Figure 4.
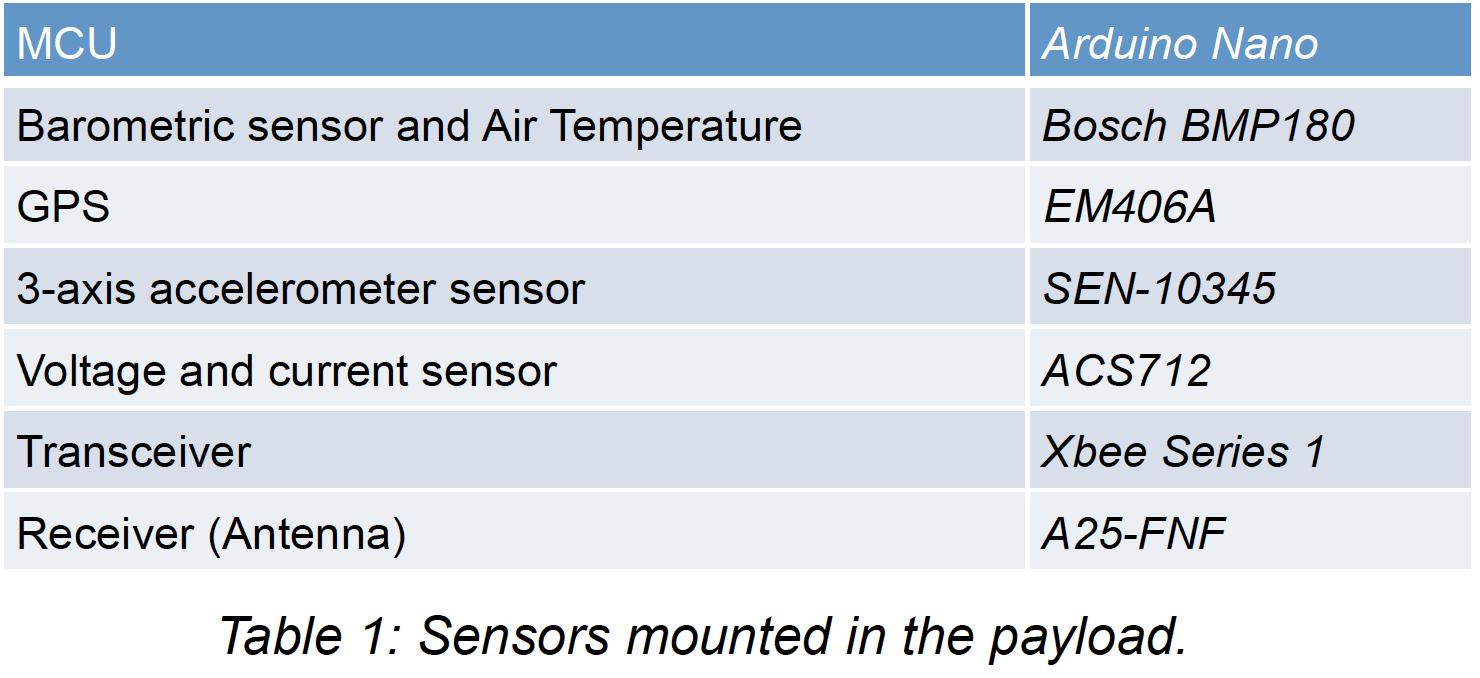
Sensors and Communications
Figure 4. Servos mounted in Tier 1 The sensor payload that was utilized in this project, as shown in Table 1, was composed of one microcontroller, four main sensors, and two types of receiver/transmitters.
All sensors are mounted on several layers (Figure been designed and built specifically for this payload, in agreement to all dimensional and physical constraints dictated by the competition rules.
RESULTS
Figure 5 (Above). Sensor Payload
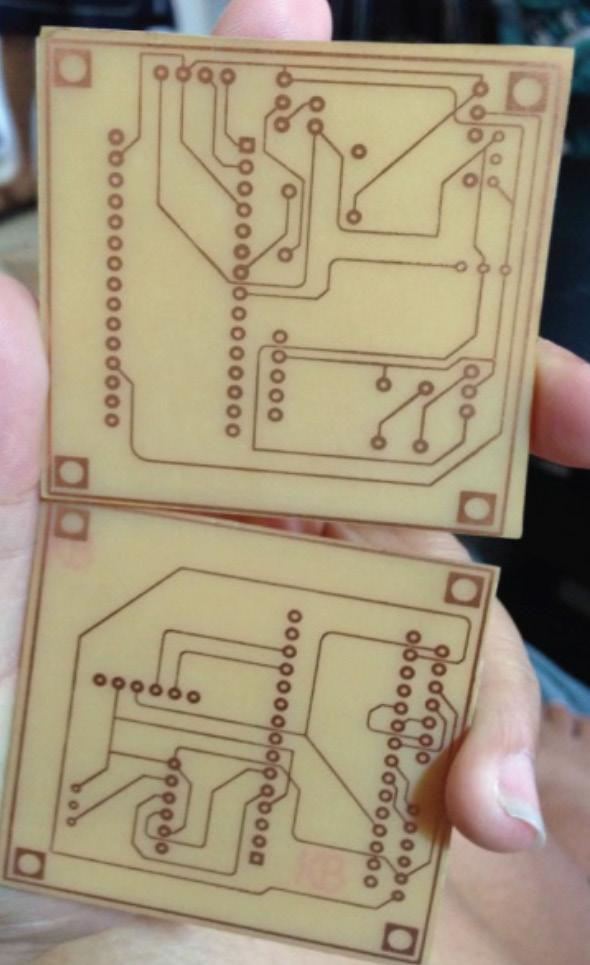
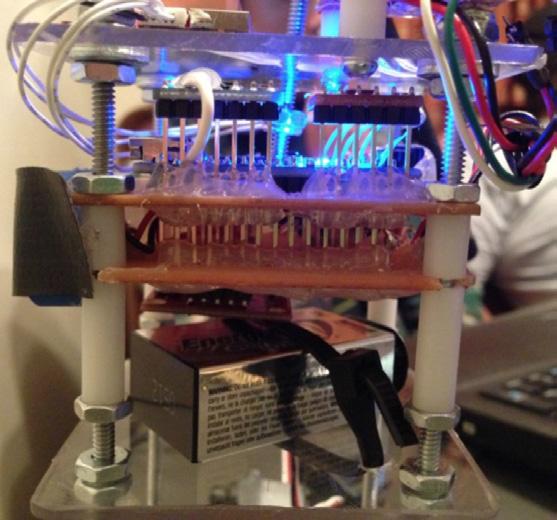
Figure 6 (Right). PCB

5) and placed on PCB boards (Figure 6) that have Boards
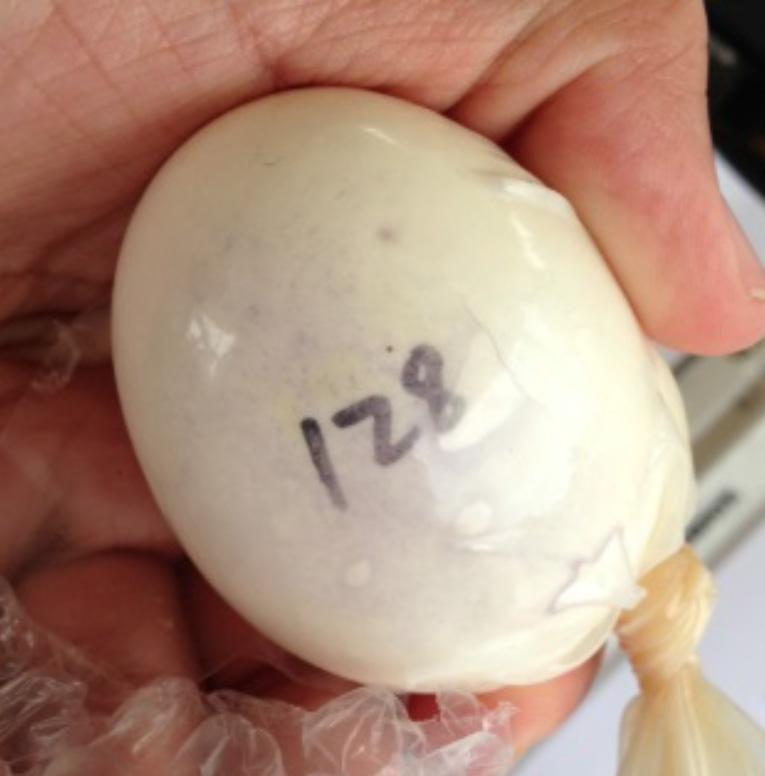
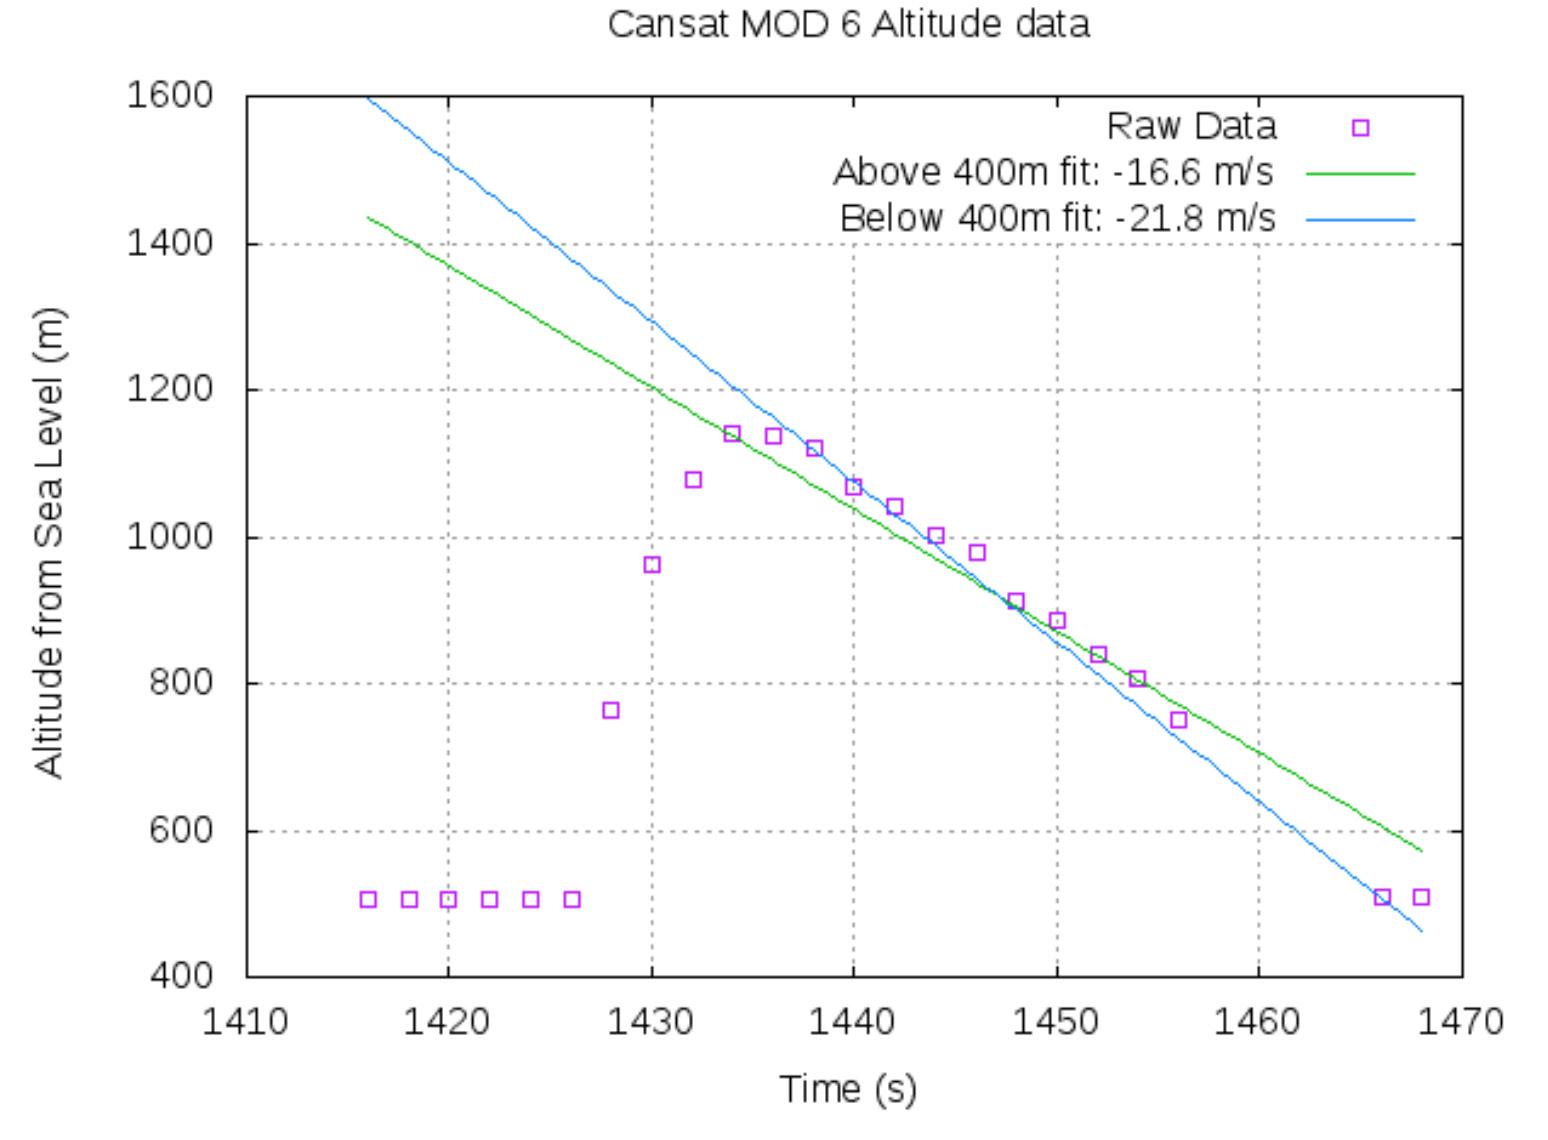
The flight was entirely successful: the payload deployed from the container successfully and fell within ranges of the desired descent rates. The sensor payload as well as the raw egg survived the impact of landing as shown in Figure 7, and all telemetry was sent to the Ground Control Station in integrality. Some results are displayed in Figure 8. Competing against more than twenty other Universities from the United States, and around the world, the Kapi‘olani Community College Team MOD 6 placed first, and won the 2013 Cansat competition (Figure
Figure 7. Intact Egg 9).
Figure 8. Results
Kapi‘olani Community College’s STEM Program, the Hawai‘i Space Grant Consortium, Aunty Keolani Noa, and our ‘Ohana for all their support throughout this entire project.
Figure 9. MOD 6 Team, First-Place Award at 2013 Cansat Competition