APPENDIX 3: Non-Tech Total Work Economic Impacts │ JumpStart 2018 Economic Impact Report
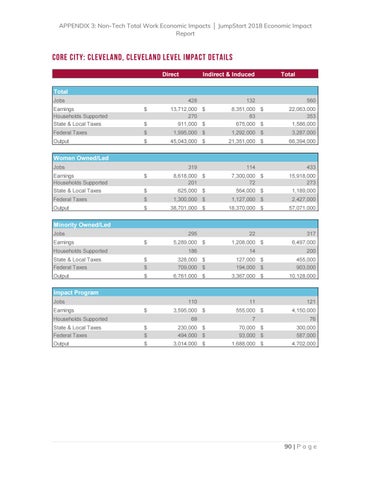
Core City: Cleveland, Cleveland Level Impact Details Indirect & Induced
Direct
Total
Total Jobs
428
Earnings Households Supported State & Local Taxes
$
132
560
$
13,712,000 $ 270 911,000 $
8,351,000 $ 83 675,000 $
22,063,000 353 1,586,000
Federal Taxes
$
1,995,000 $
1,292,000 $
3,287,000
Output
$
45,043,000 $
21,351,000 $
66,394,000
Women Owned/Led Jobs
319
Earnings Households Supported State & Local Taxes
$
Federal Taxes Output
114
433
$
8,618,000 $ 201 625,000 $
7,300,000 $ 72 564,000 $
15,918,000 273 1,189,000
$
1,300,000 $
1,127,000 $
2,427,000
$
38,701,000 $
18,370,000 $
57,071,000
$
5,289,000 $
State & Local Taxes Federal Taxes
$ $
328,000 $ 709,000 $
127,000 $ 194,000 $
455,000 903,000
Output
$
6,761,000 $
3,367,000 $
10,128,000
$
3,595,000 $
State & Local Taxes Federal Taxes
$ $
230,000 $ 494,000 $
70,000 $ 93,000 $
300,000 587,000
Output
$
3,014,000 $
1,688,000 $
4,702,000
Minority Owned/Led Jobs Earnings
295
Households Supported
186
22 1,208,000 $ 14
317 6,497,000 200
Impact Program Jobs Earnings
110
Households Supported
69
11 555,000 $ 7
121 4,150,000 76
90 | P a g e