LUXURY MARKET TRENDS
HAPPY FALL!
The luxury market has seen its final flurry of activity at the end of September and now, just like the weather, things will continue the cooling trend as the year comes to a close. Unsold inventory has grown in several markets within the luxury price ranges as the days on market have trended higher.
The month of October will have the greatest selection of luxury properties available until next March. Looking ahead, the number of listings will dwindle as fewer people choose to list their homes and the “winter cleanup” begins as some sellers take their homes off the market over the holidays, then reposition to bring them back on the market after the first of the year.
We’re here to help you find the right home to move forward in life. Contact your John L. Scott Luxury Specialist to review market conditions and trends that will help you make an informed decision.
J. Lennox Scott Chairman and CEO John L. Scott Real Estate


EXCEPTIONAL HOMES BY
JOHN L.
SCOTT
Exceptional Homes is John L. Scott’s luxury real estate brand. Together with our luxury broker associates, our global partners at Luxury Portfolio International, and our support staff, we strive to provide concierge-level service by putting clients first.
We can ensure you that we are here for you and your family. The real estate market is fast-paced and ever changing, but what hasn’t changed, is our commitment to exceed your expectations when you are ready to buy or sell your home.
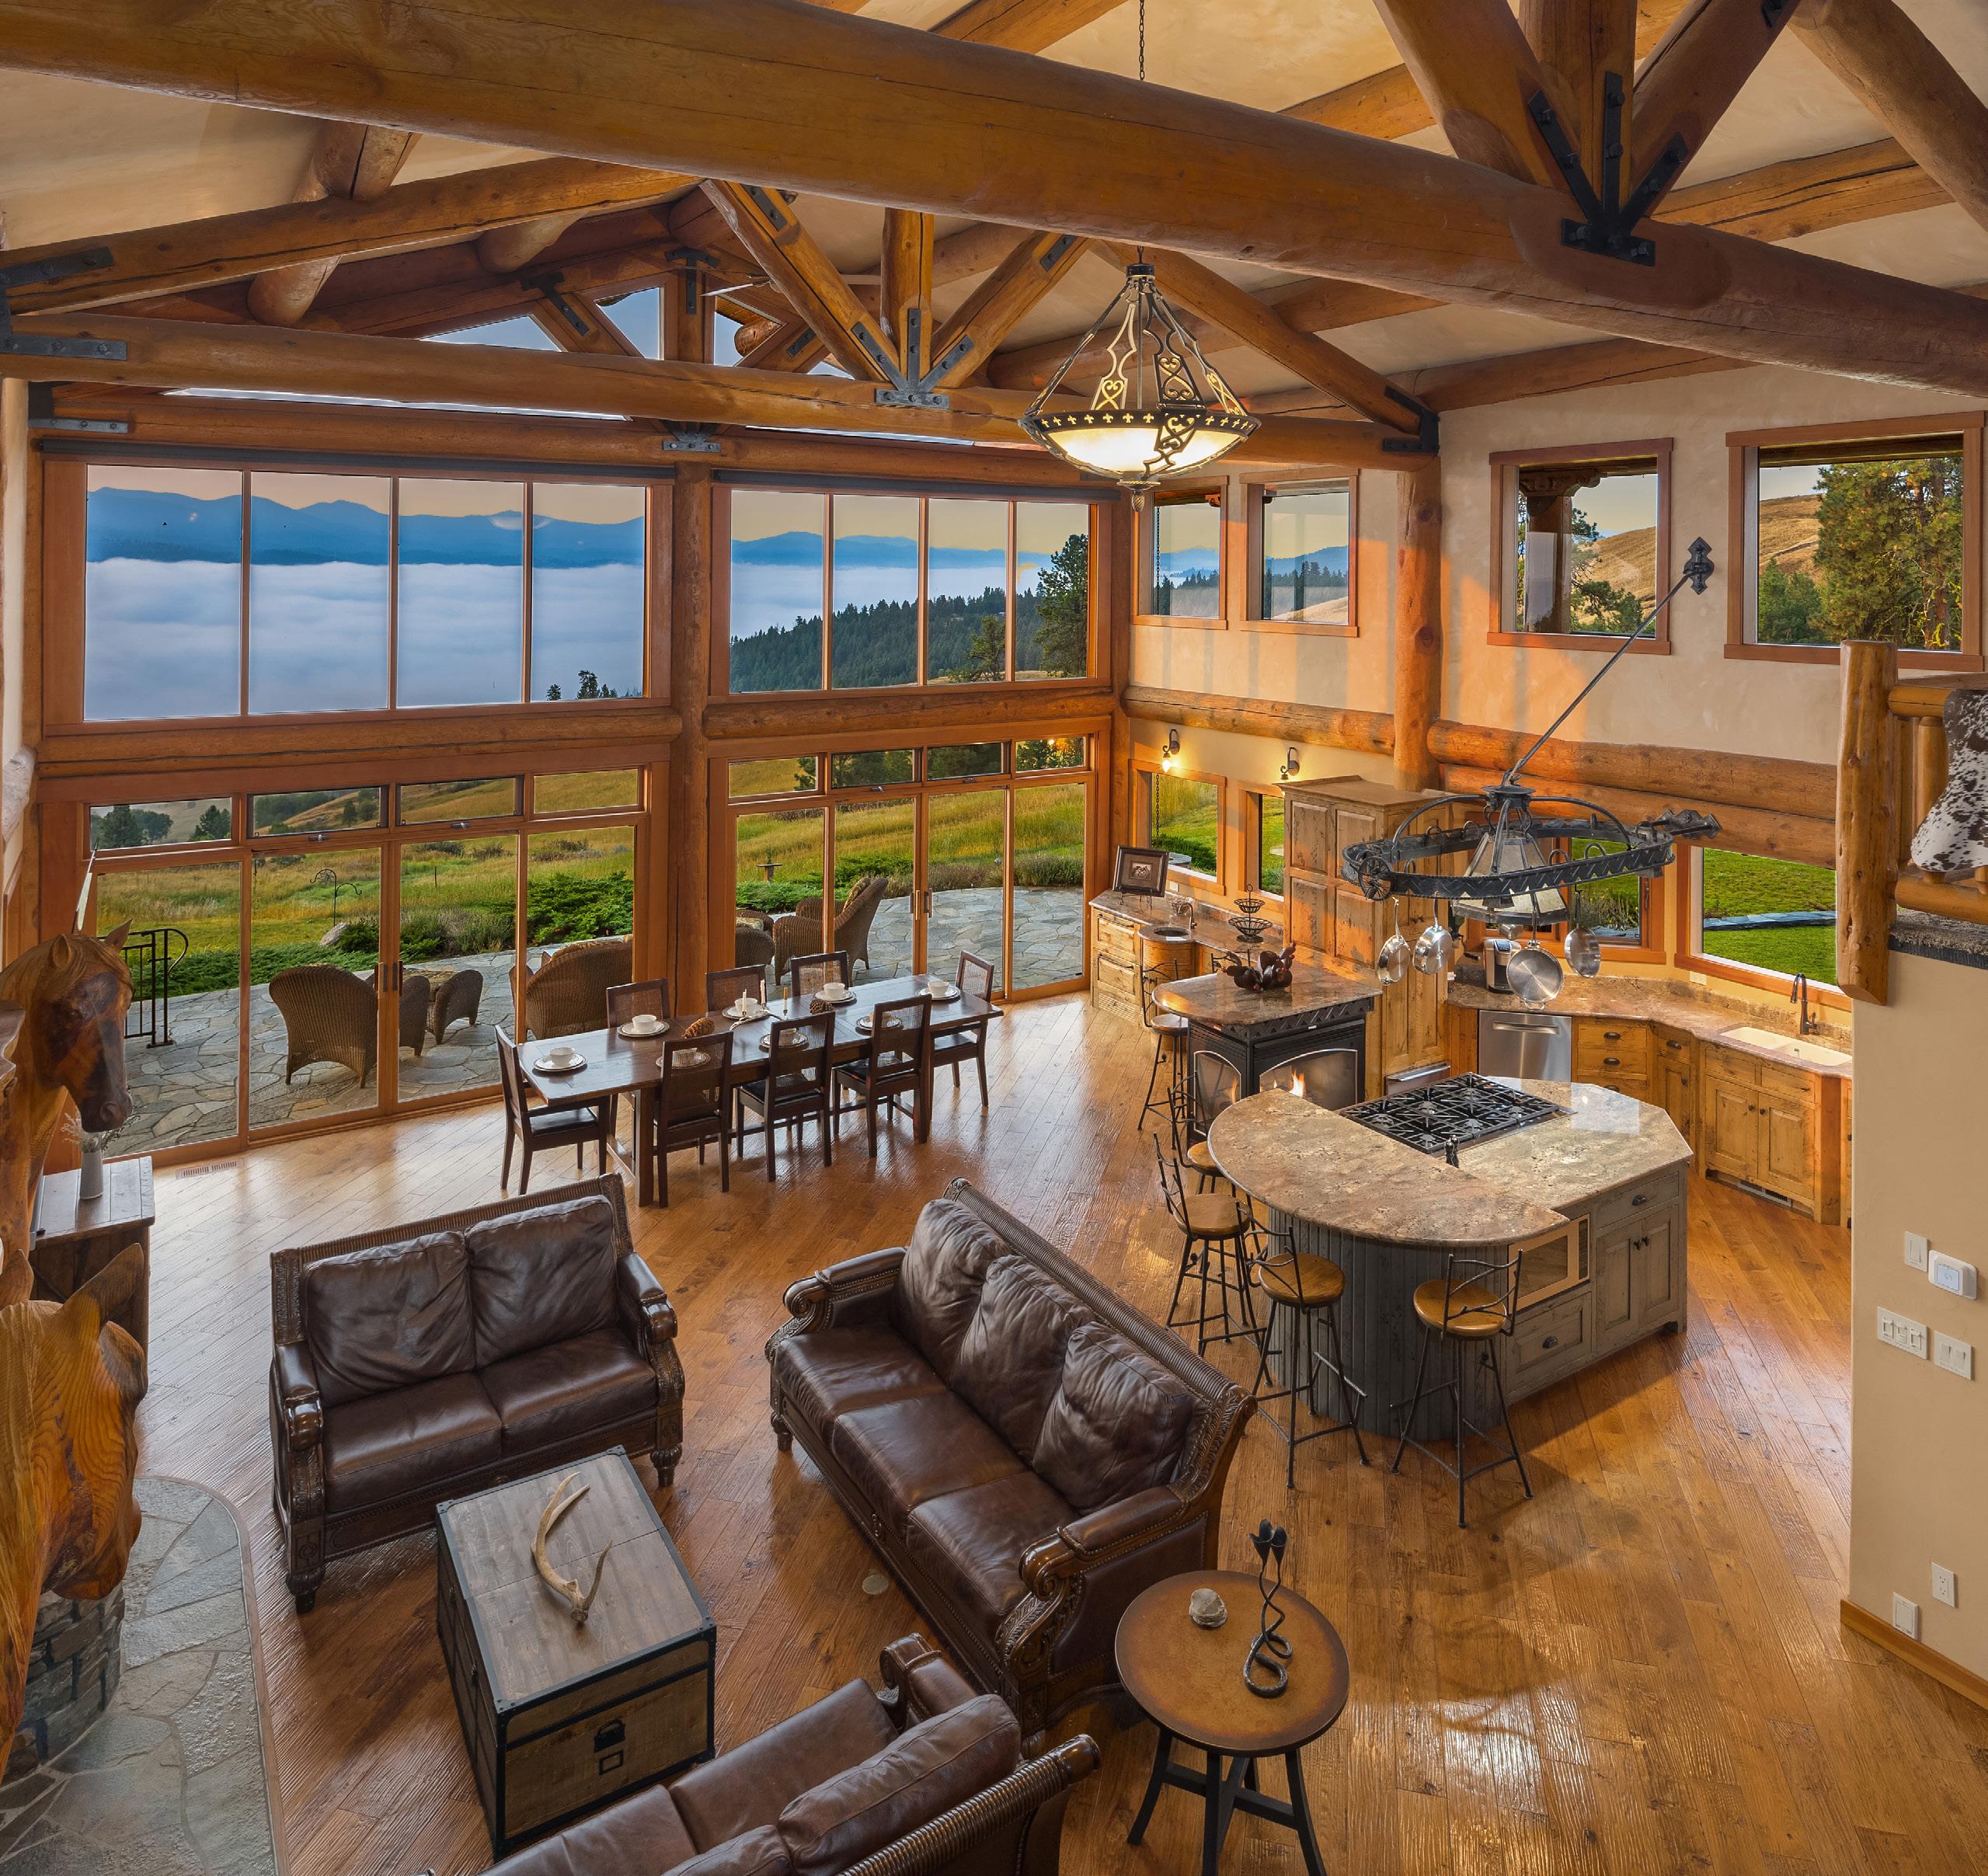
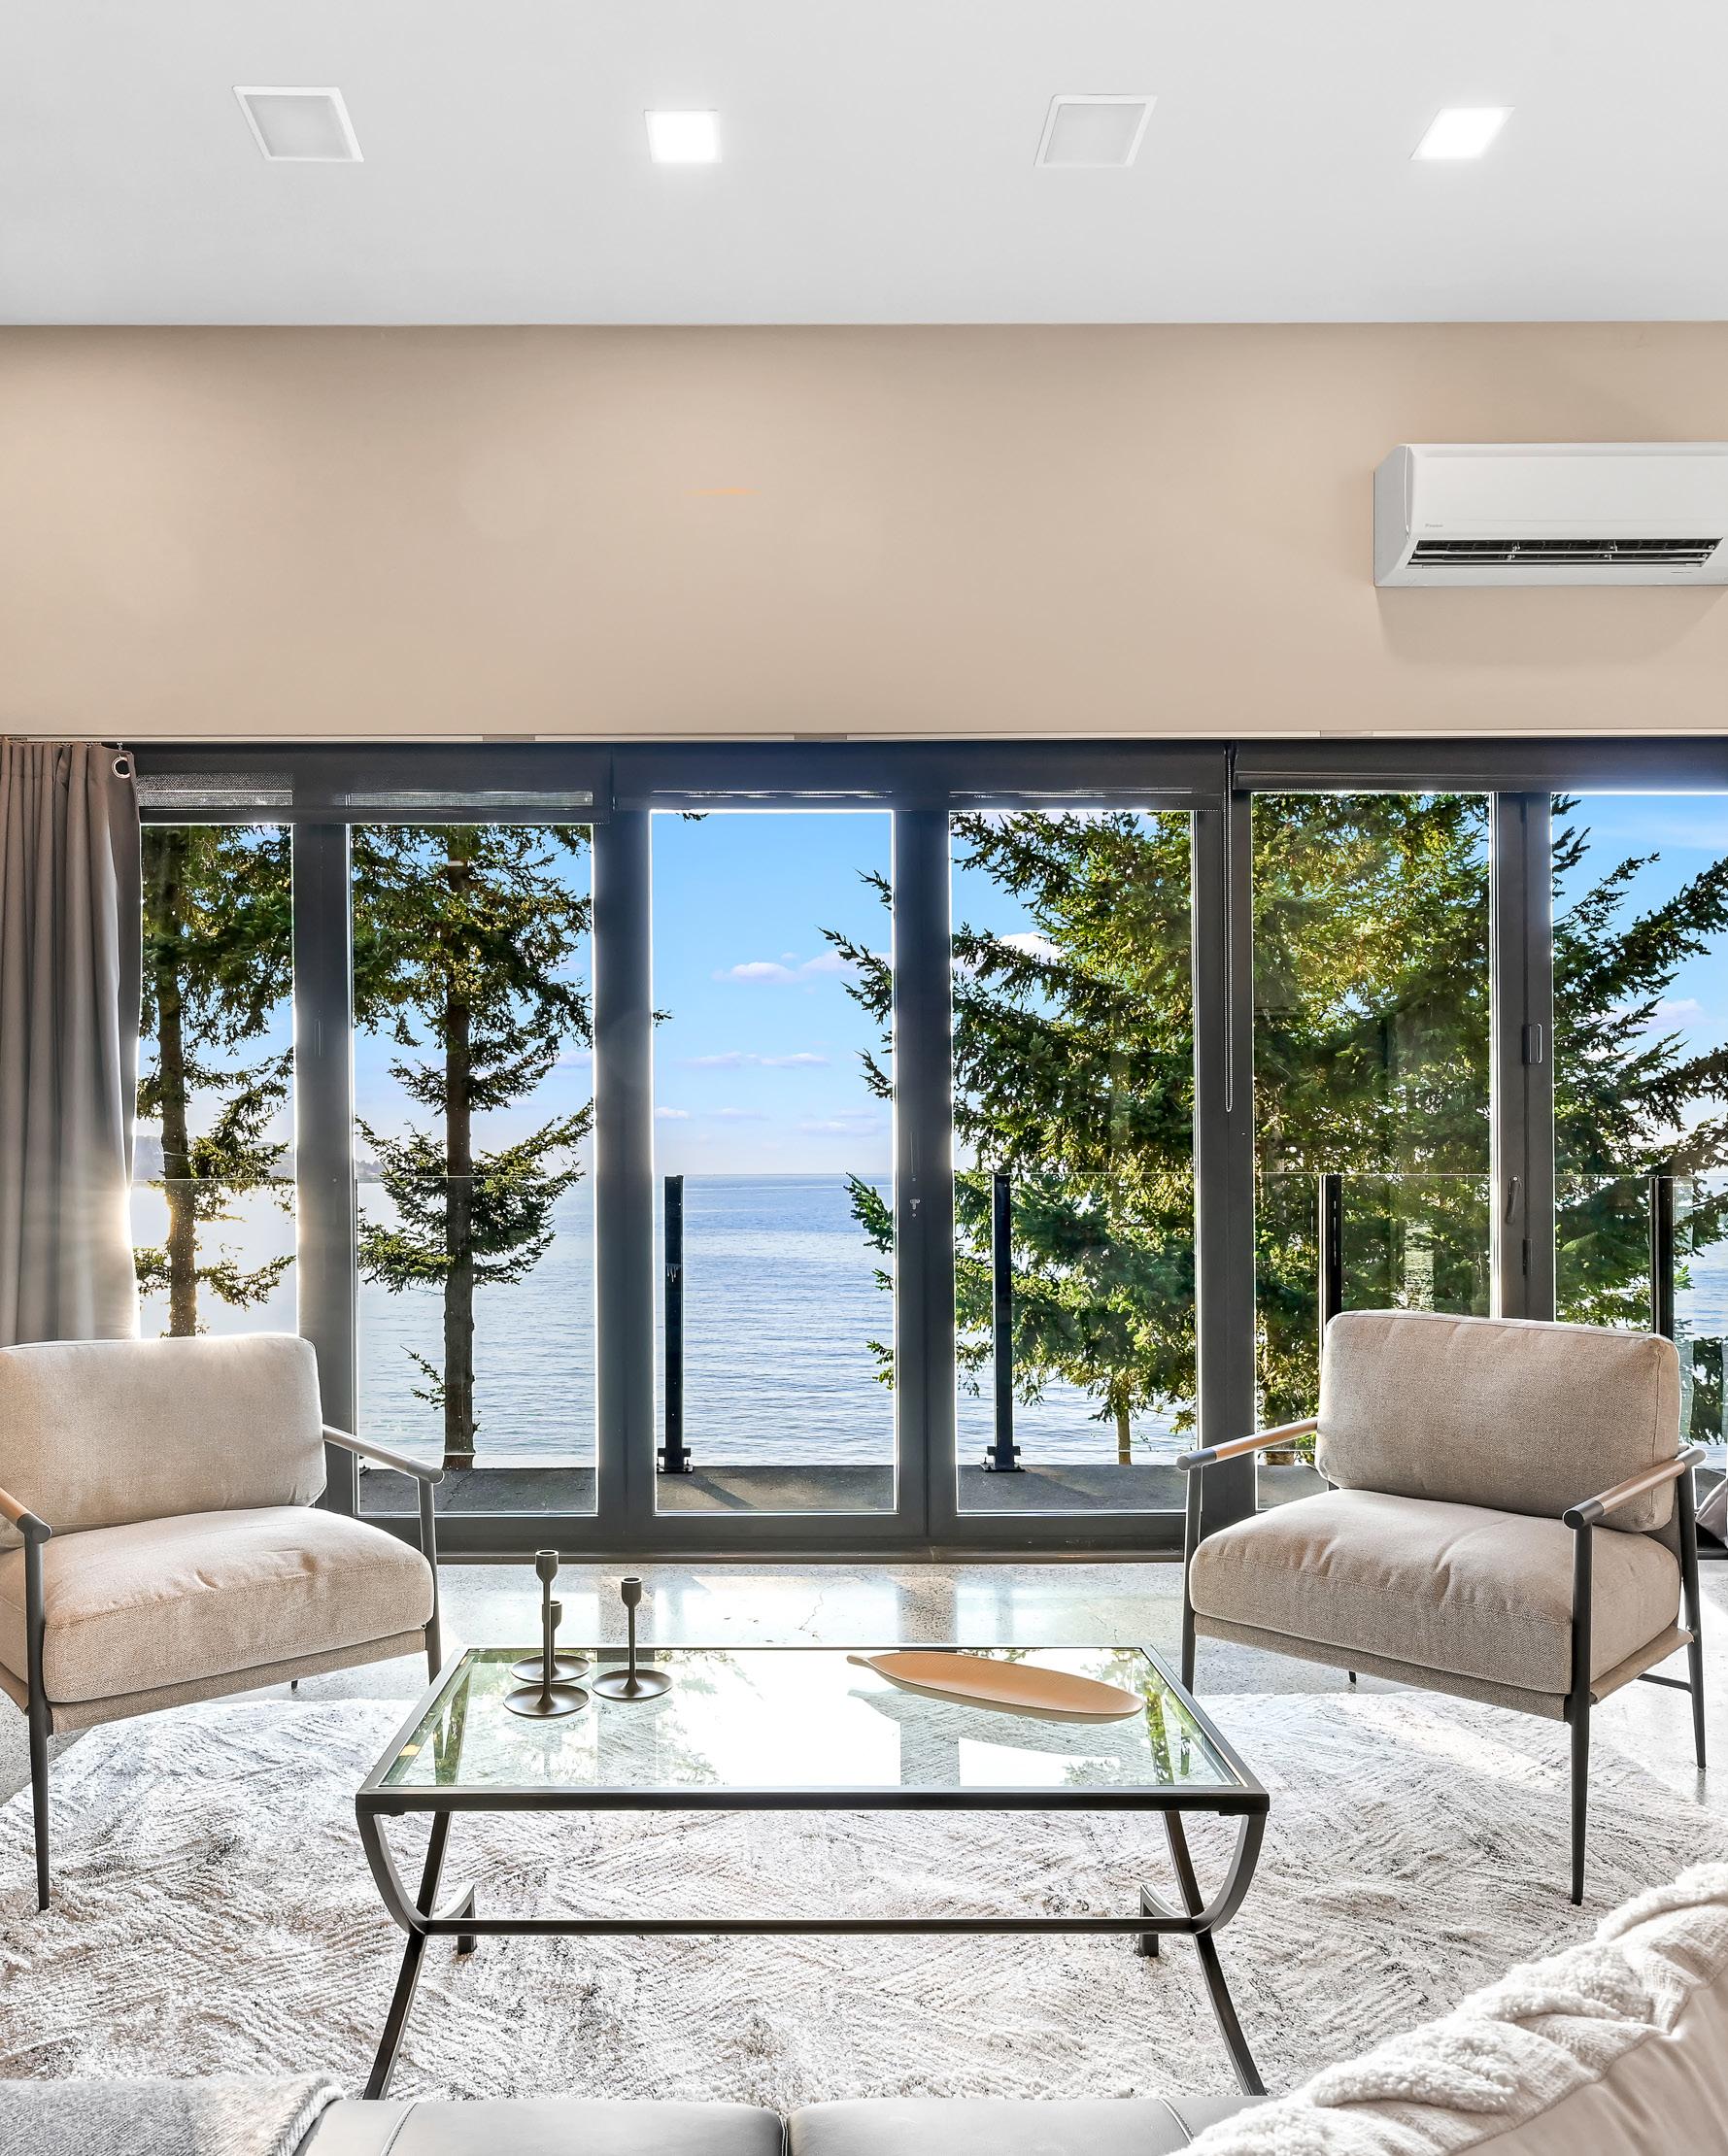
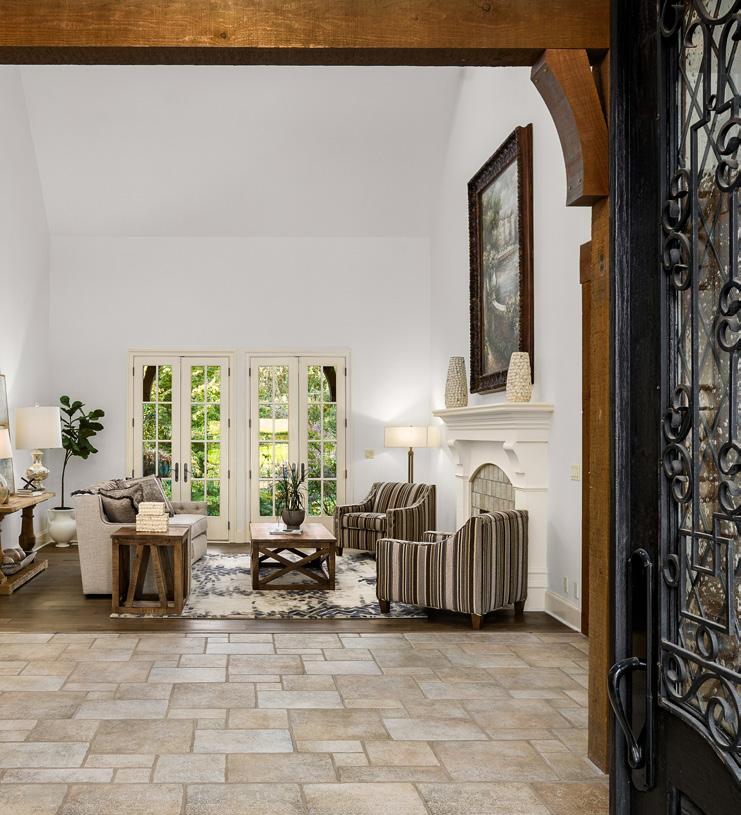
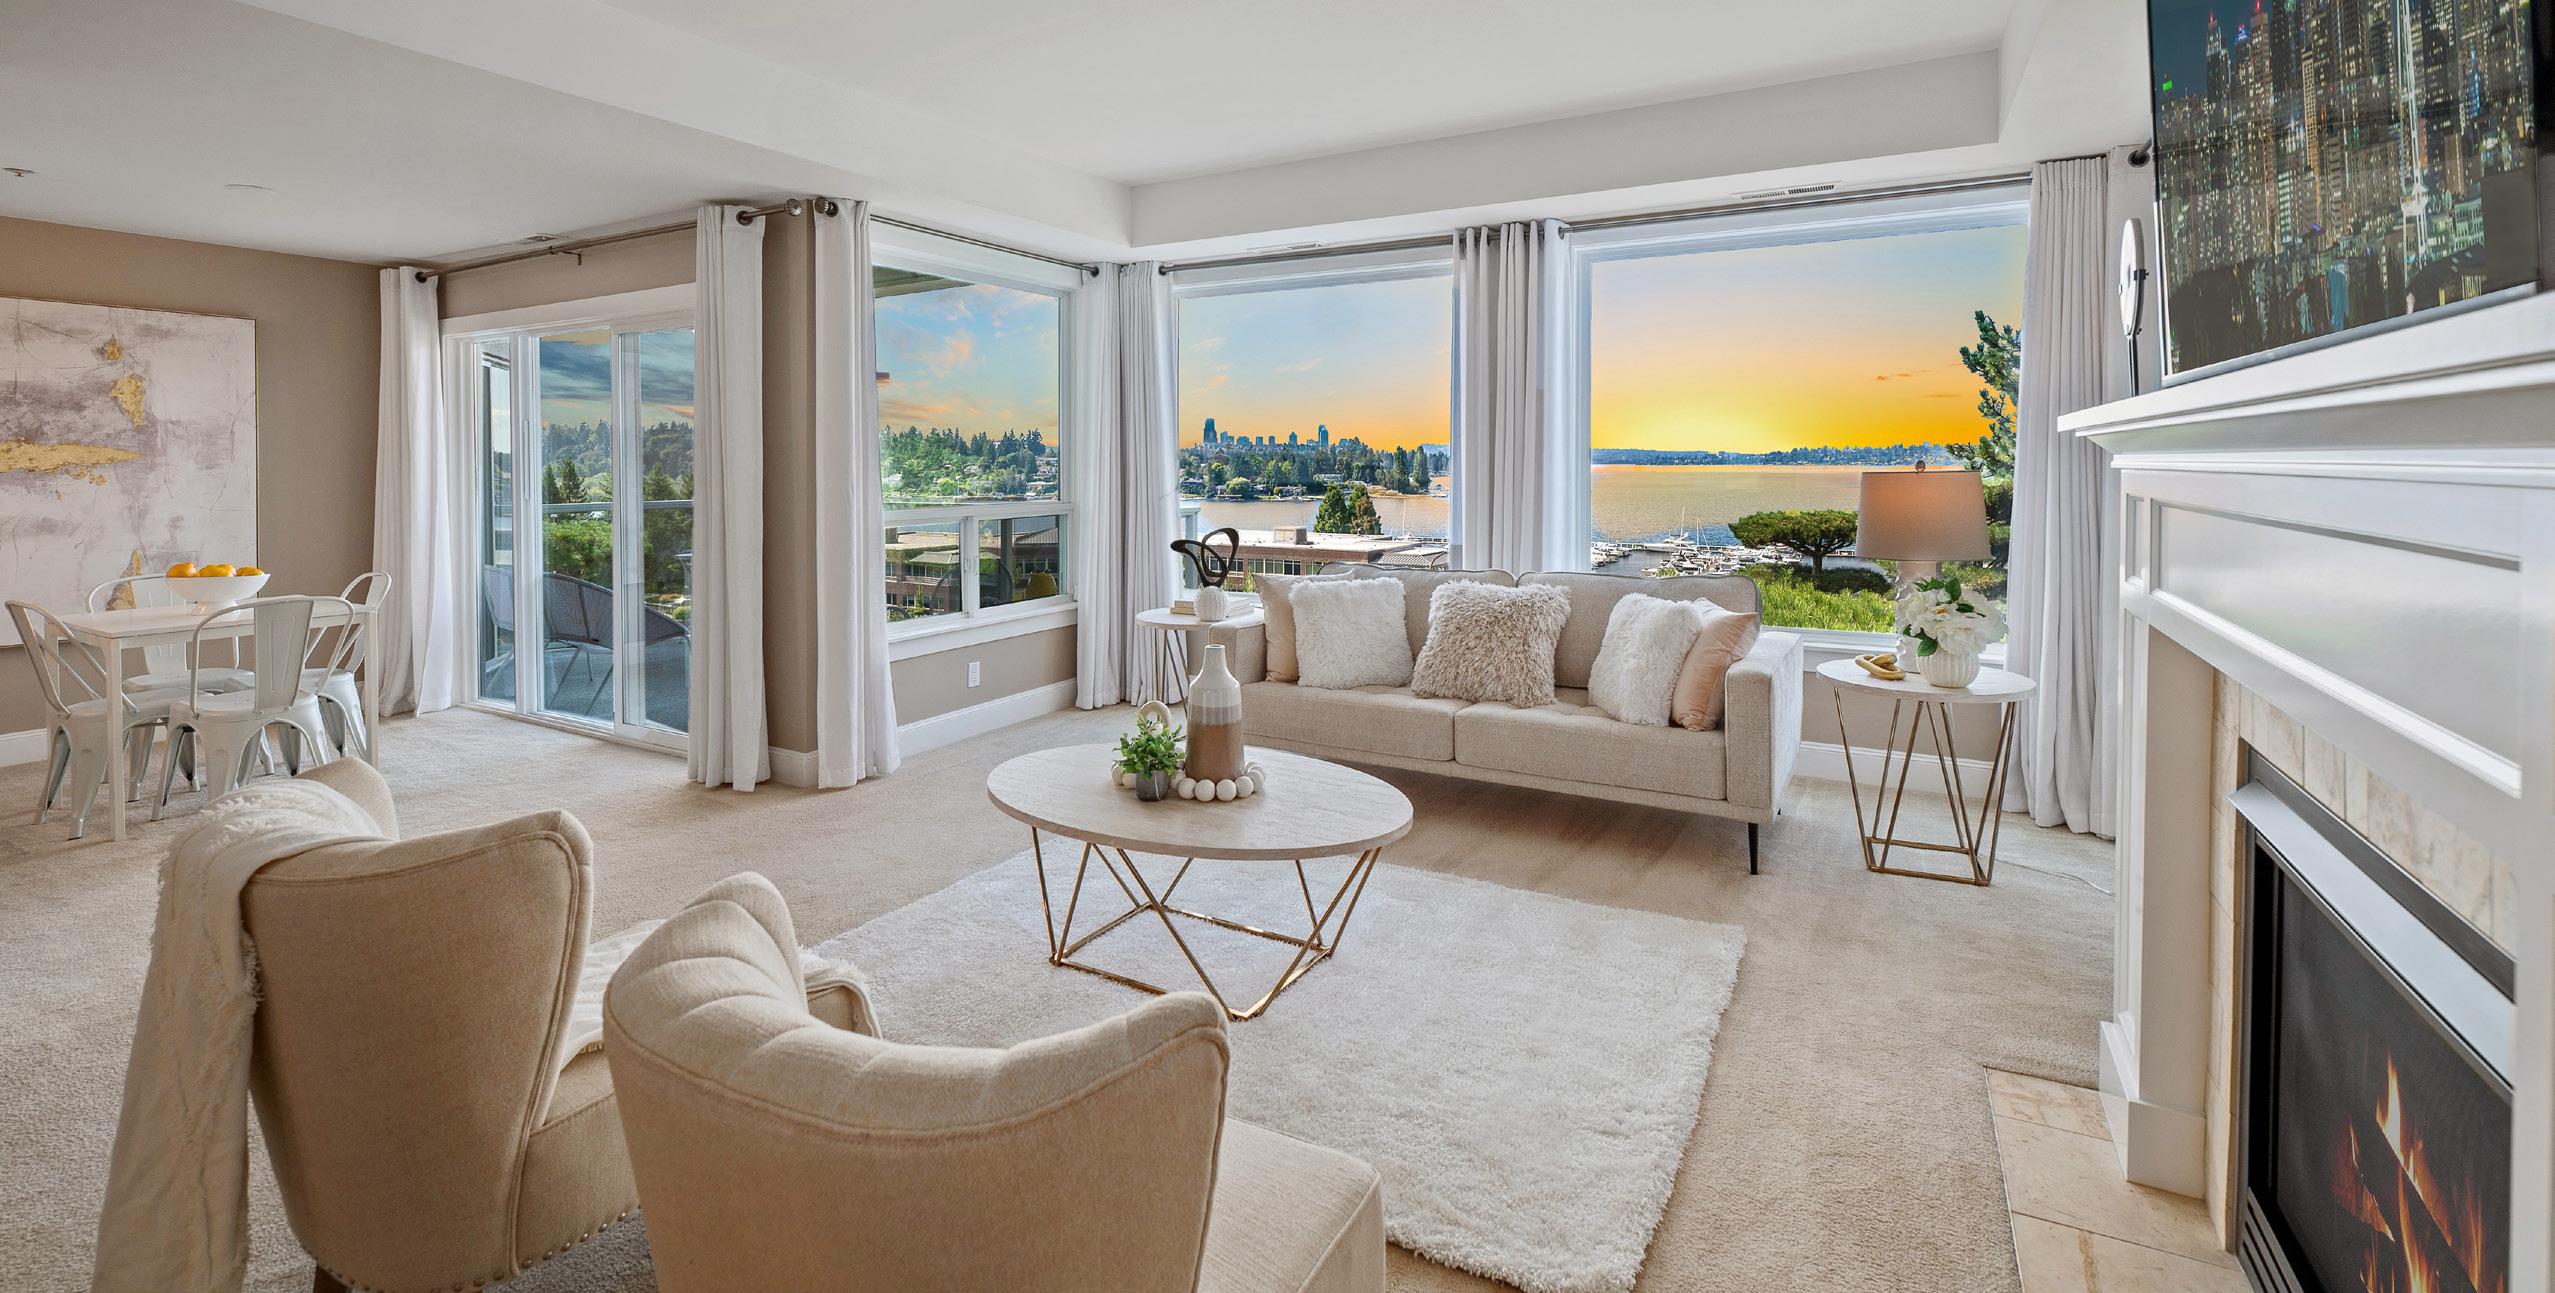
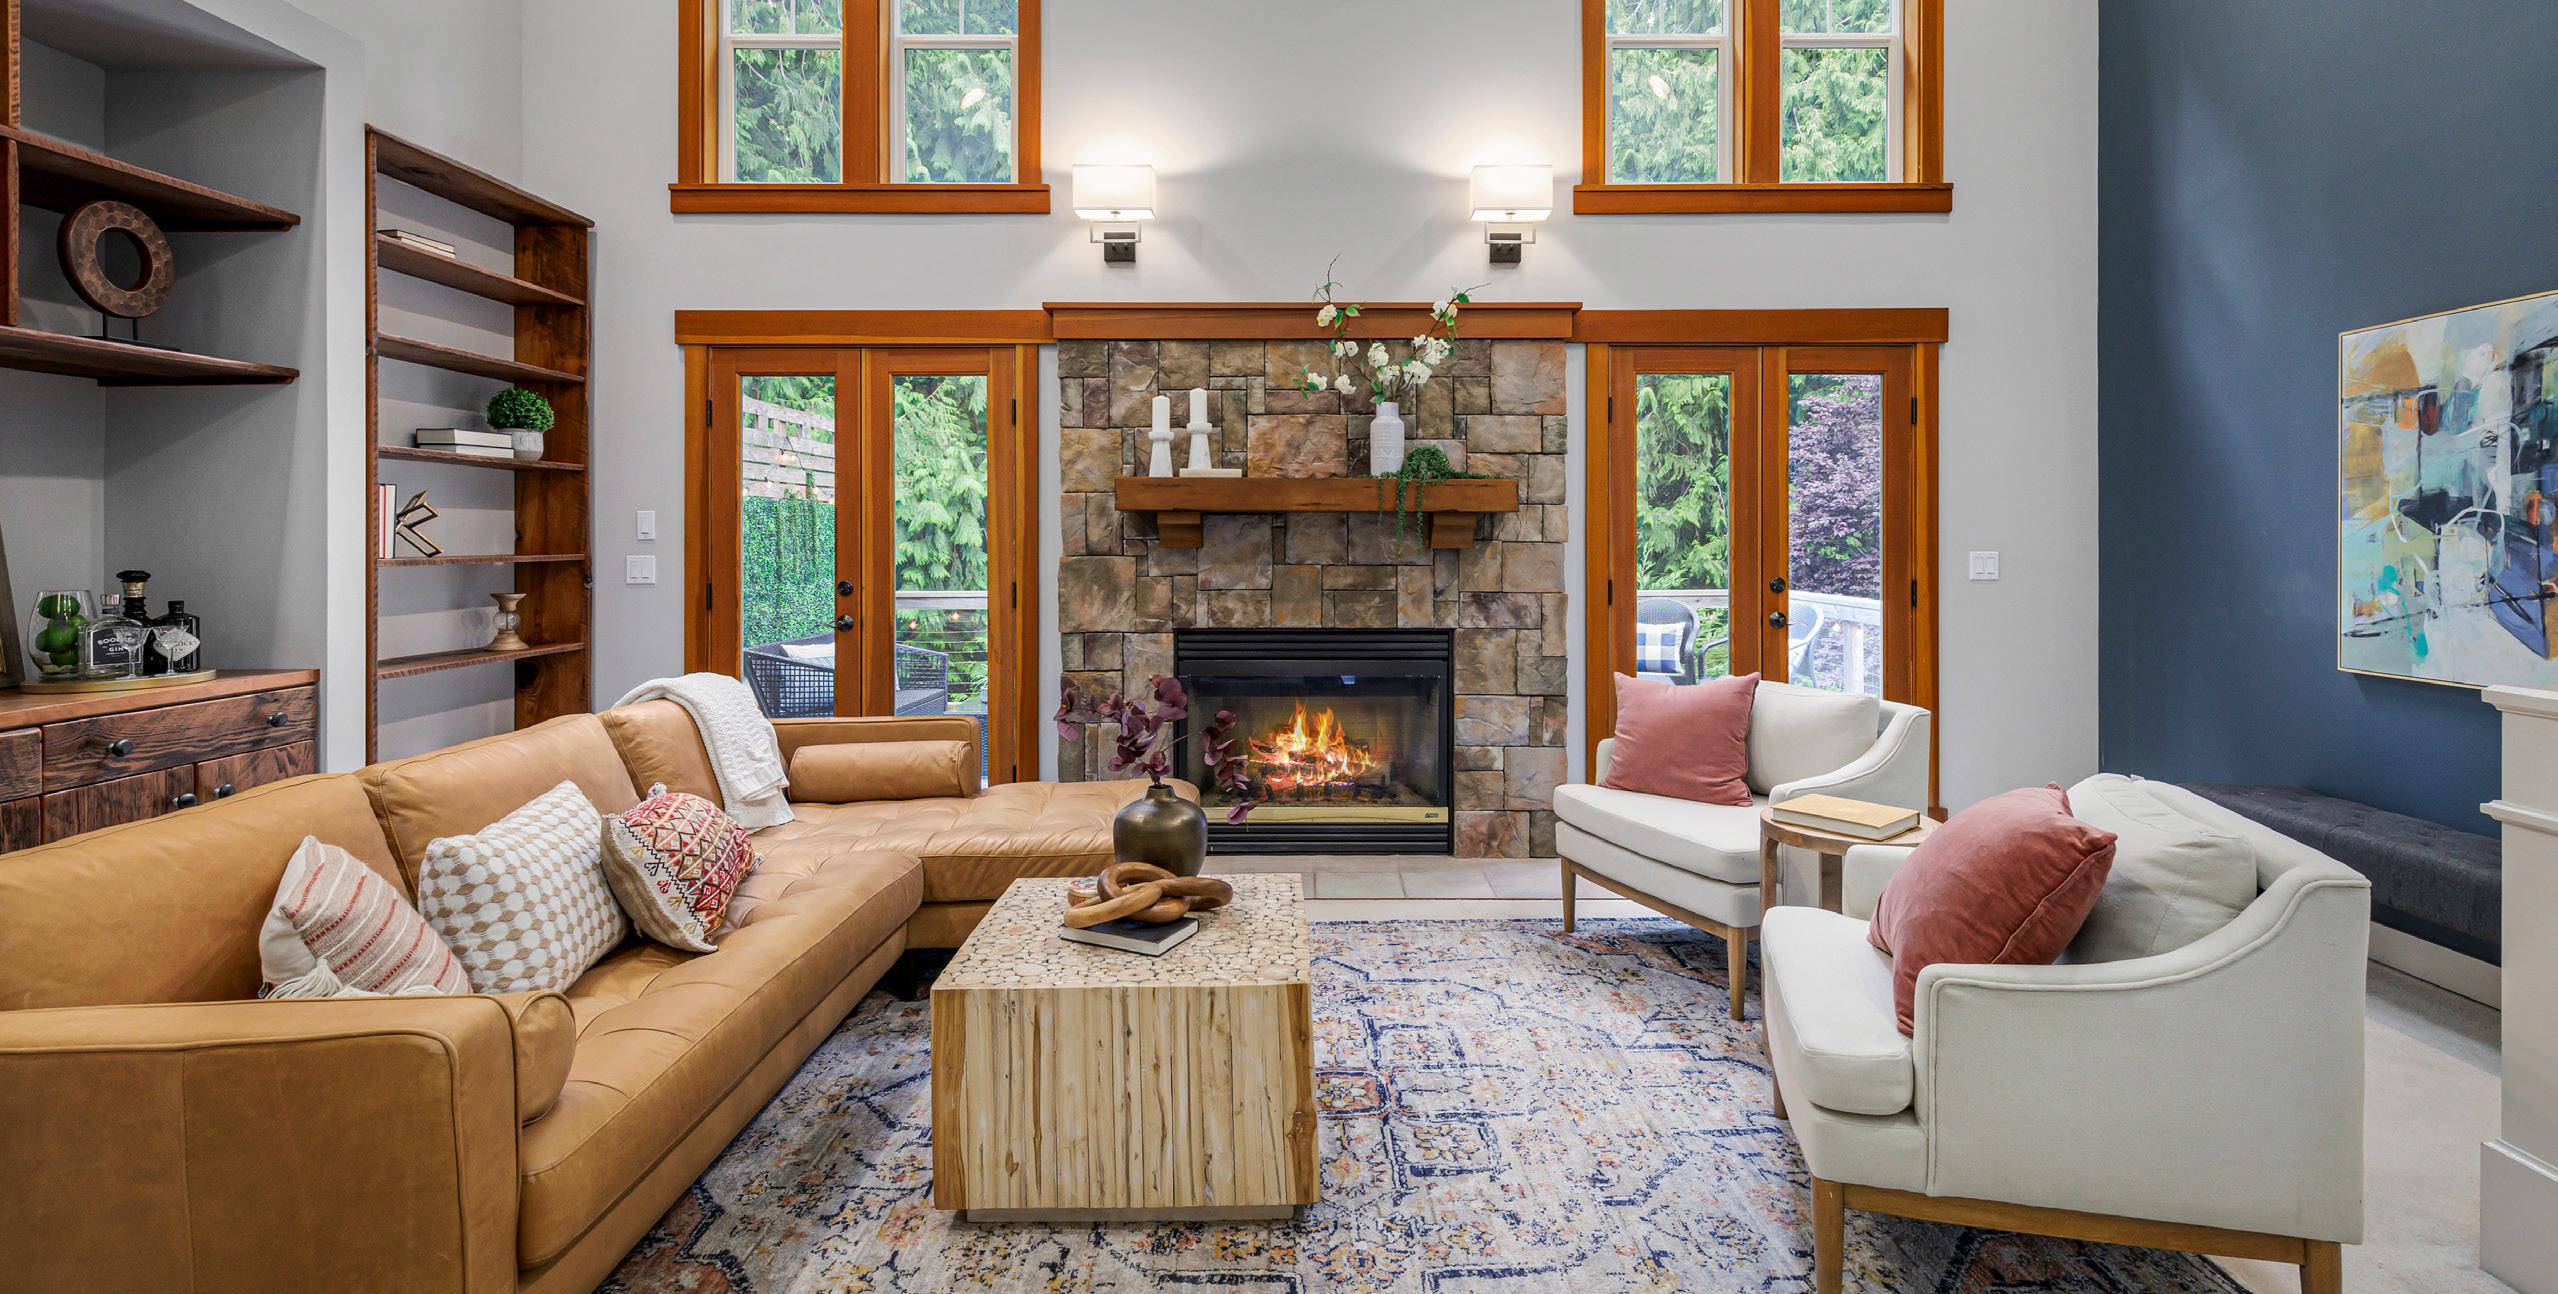
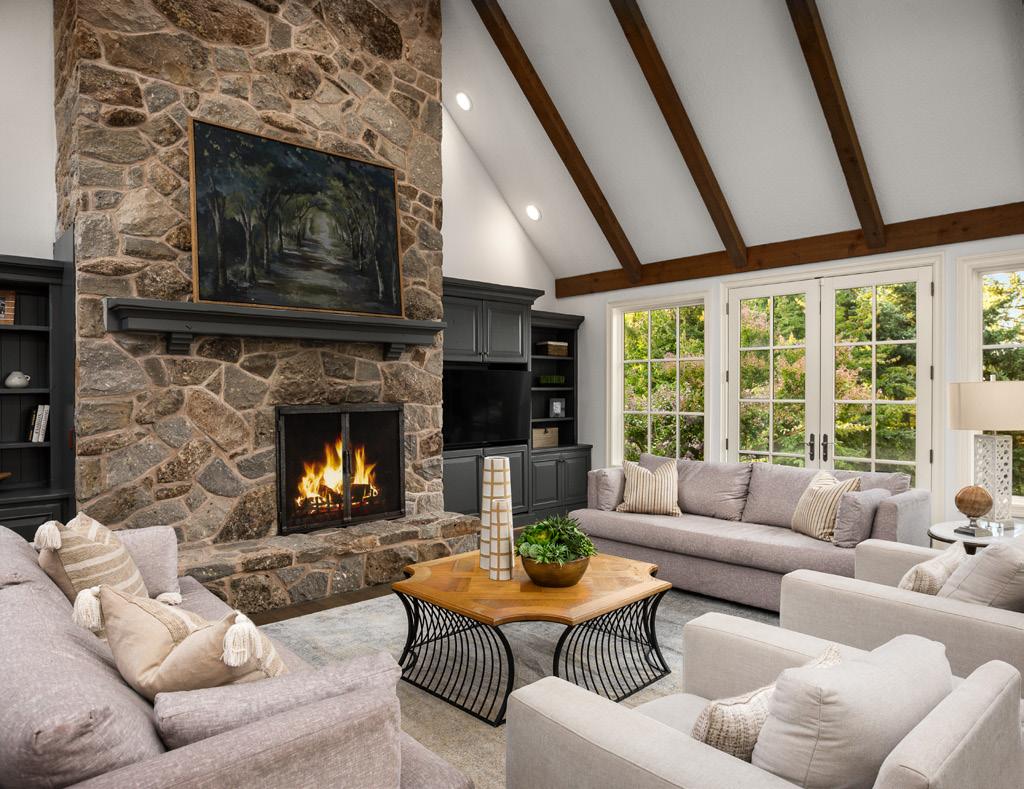
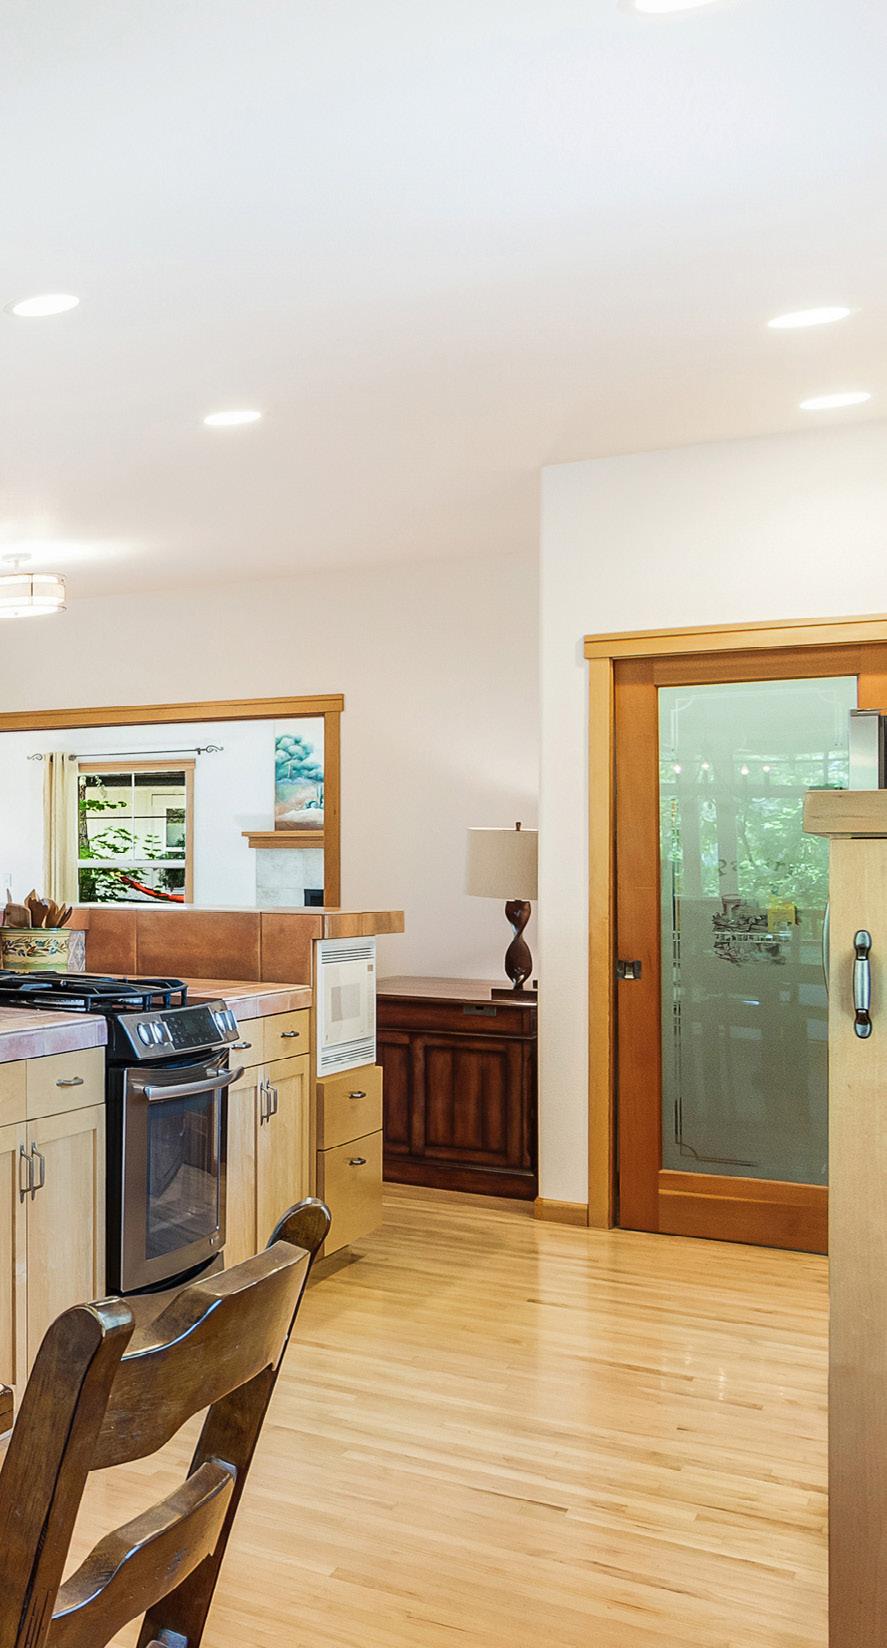
ON THE COVER: OFFERED AT $3,585,000 | JOHNLSCOTT.COM/37104
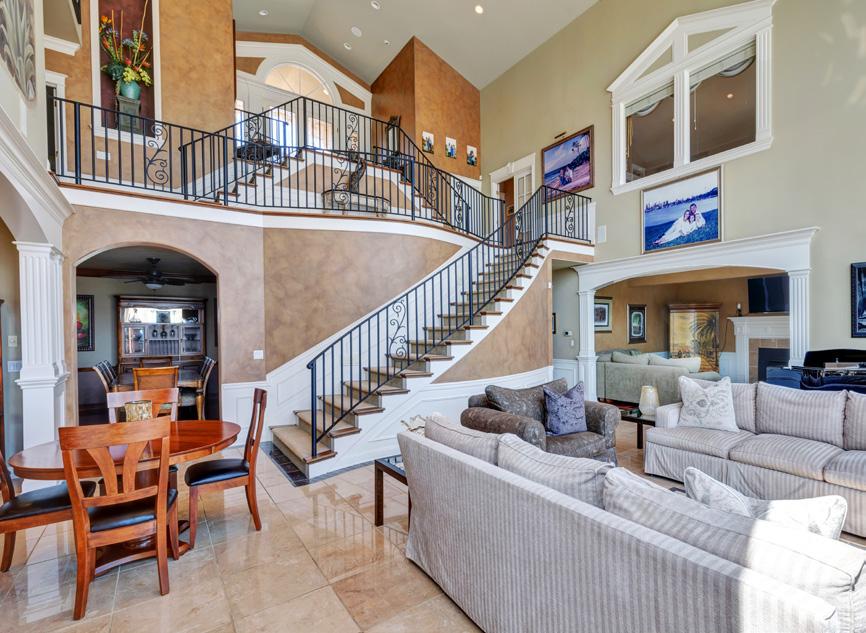
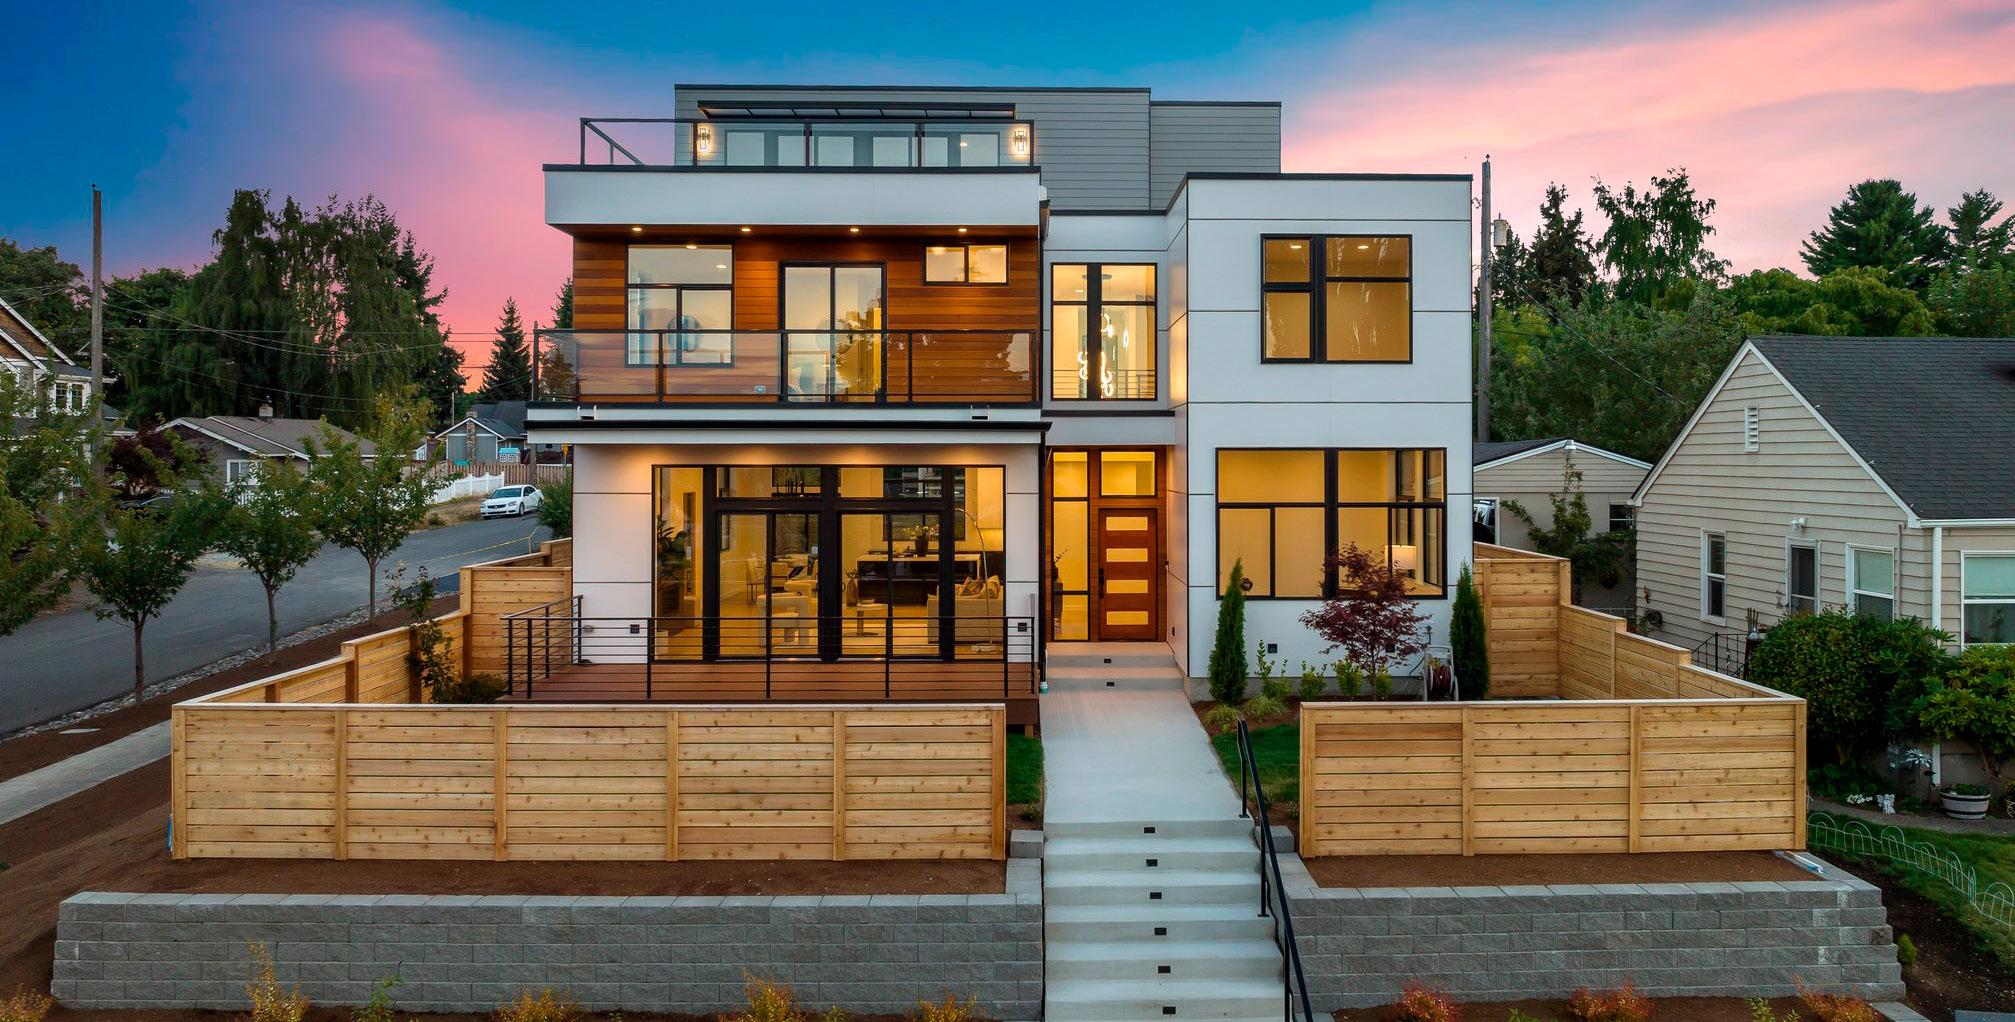
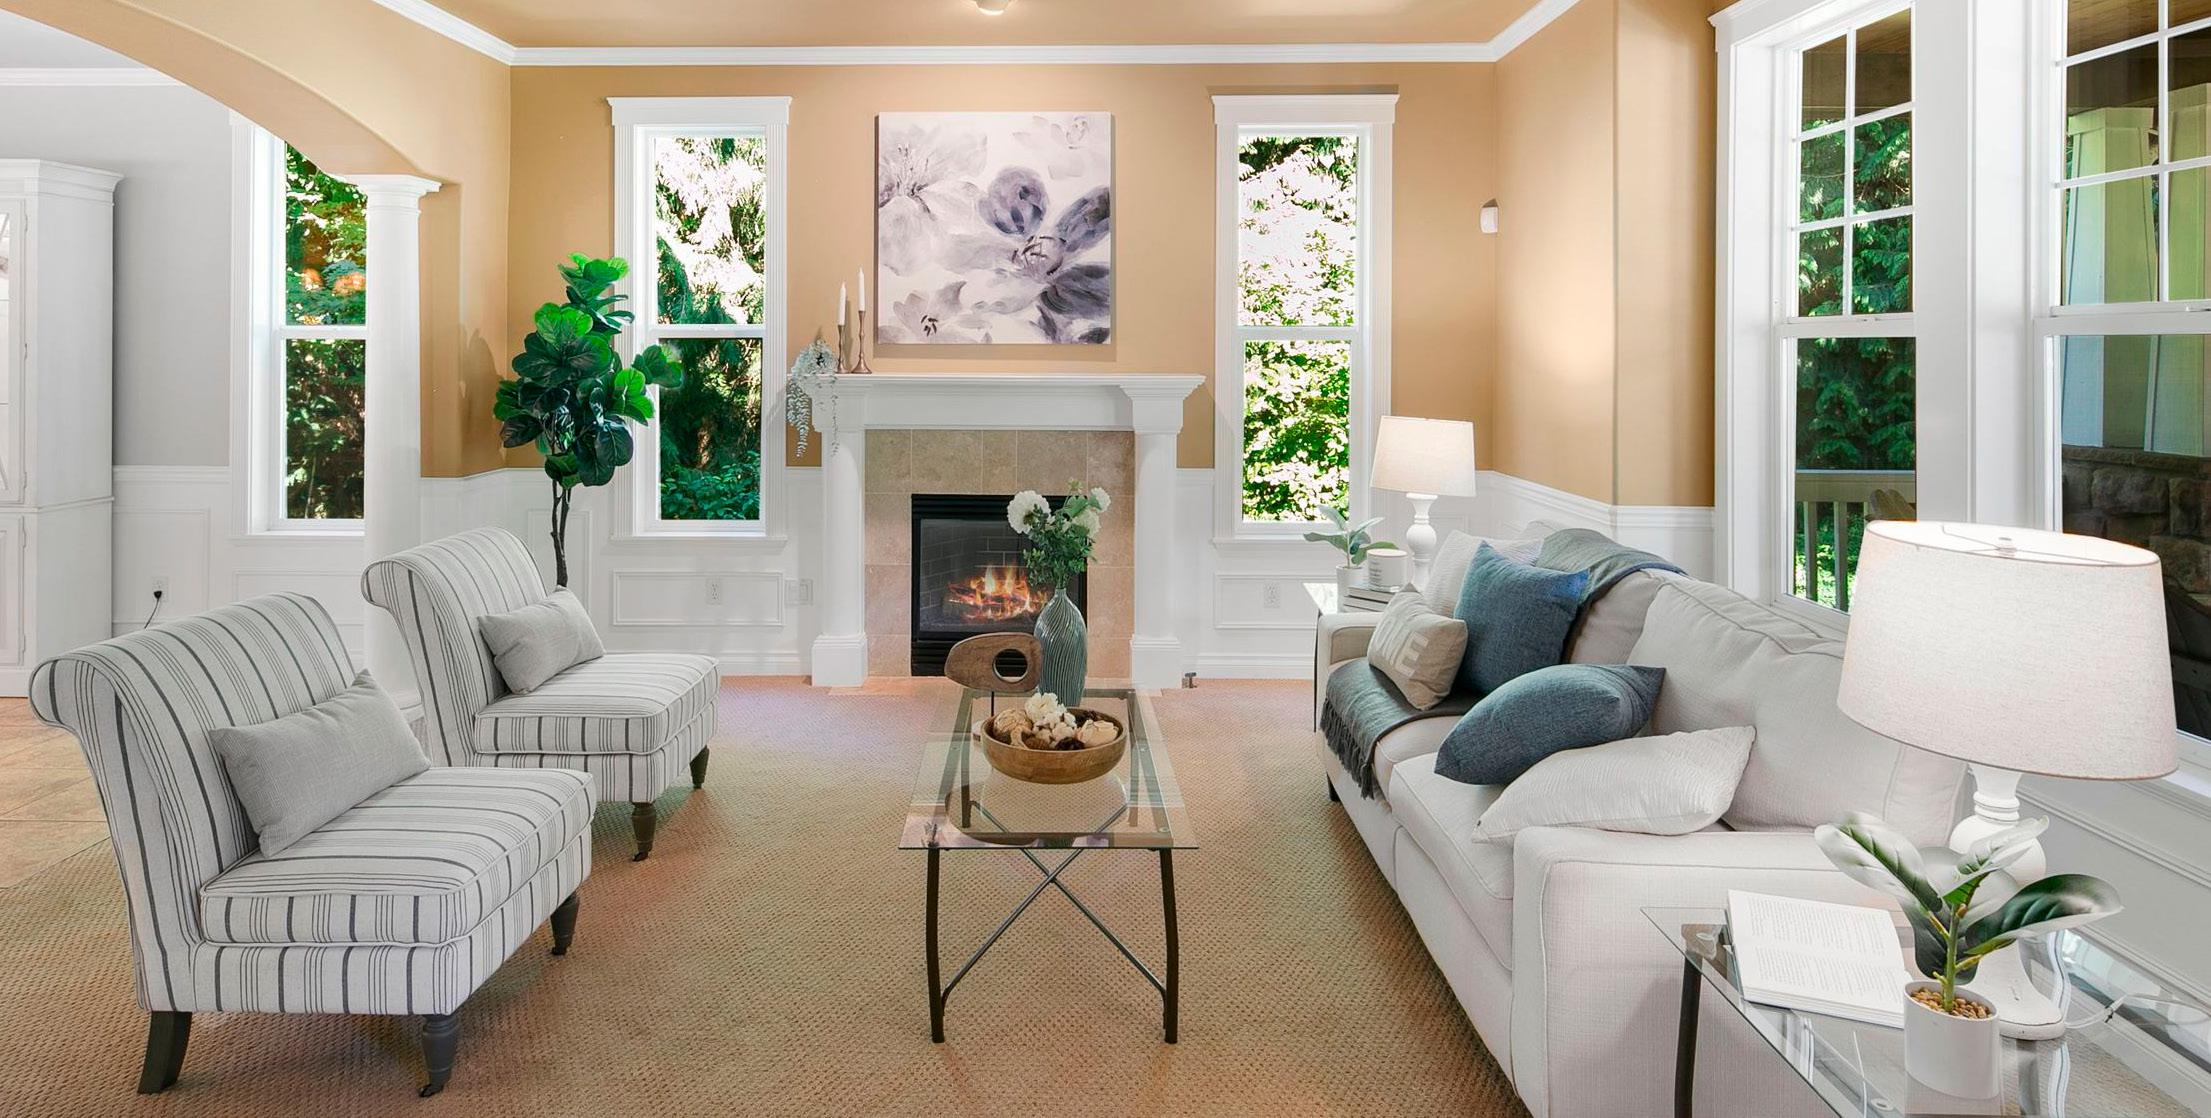
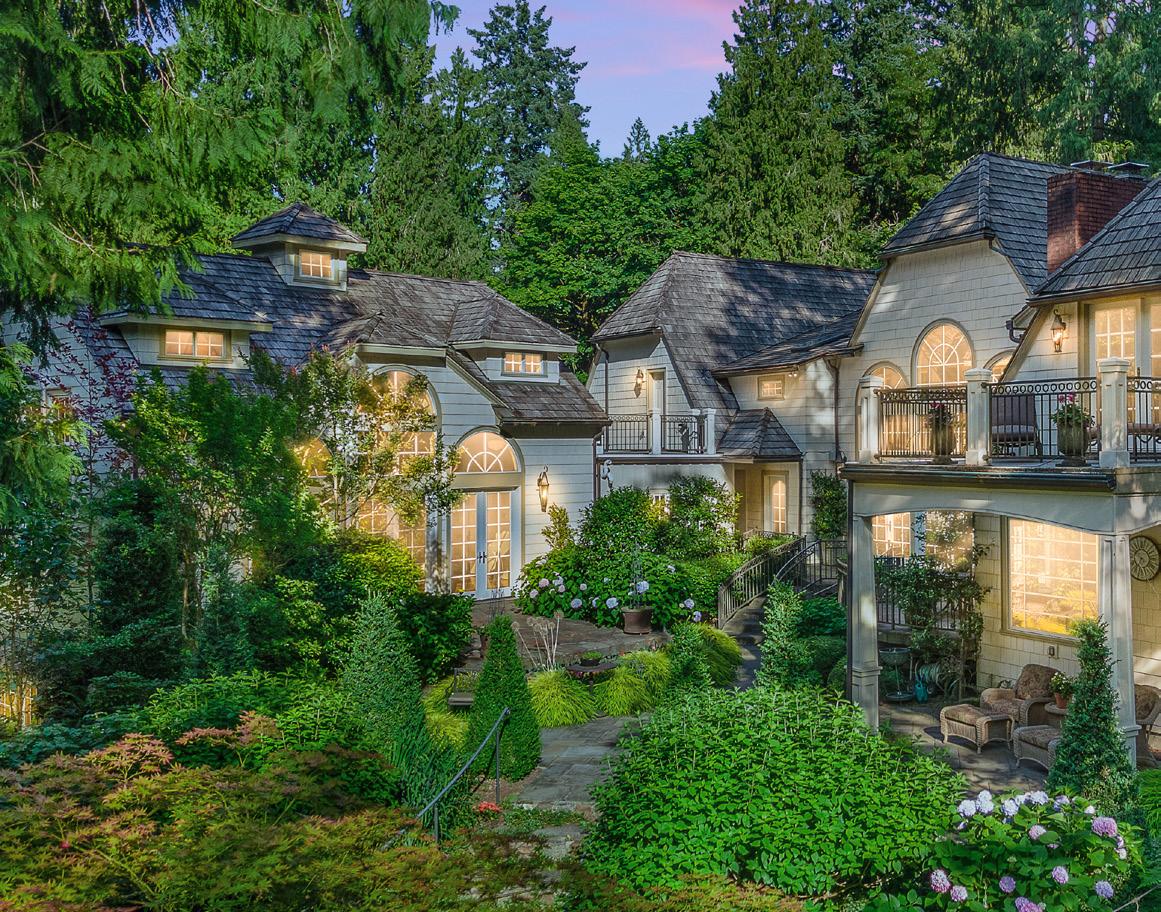
ON THE RIGHT: SOLD | JOHNLSCOTT.COM/74892
Luxury LIVE YOUR
WE ARE GLOBAL
John L. Scott is a founding member of the international organization Leading Real Estate Companies of the World®.
Founded in 1931, JLS operates over 100 offices with over 3,000 agents throughout WA, OR, ID & CA
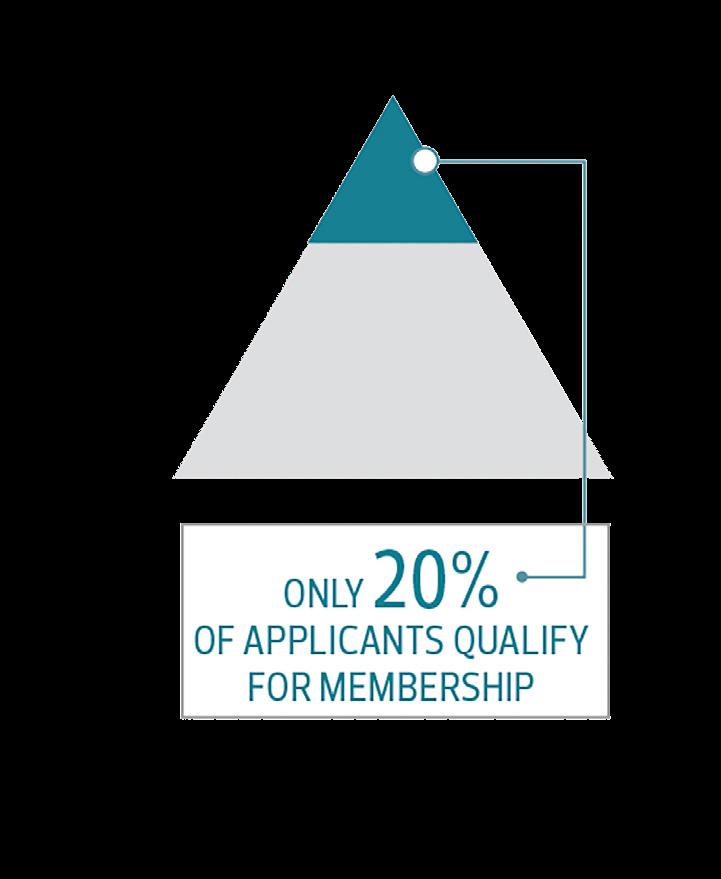
A global community of over 565 real estate companies awarded membership based on rigorous standards for service and performance

BY THE NUMBERS
550 Member Firms

80% of applicants to this network are turned down
John L. Scott’s luxury brand, providing our agents with tools and data to help each and every client live their luxury
The luxury division of LeadingRE & the largest global network of the most powerful, independent luxury firms

4,600 Offices Worldwide Total Inventory $58 BILLION

INDUSTRY-LEADING SALES.
Our invitation-only network was responsible for $353 billion in annual home sales volume among the top 500 U.S. real estate firms in 2022.
Volume shown in billions of dollars. For informational purposes only. In compiling this report, LeadingRE relies on third party sources. The information set forth in the chart above is sourced from the 2023 RealTrends 500, showcasing production for calendar year 2022, accessible via realtrends com. Neither LeadingRE nor its member companies are responsible for the accuracy of third-party data presented herein.
Average Property $2.6 MILLION
Associates Worldwide 6 Continents with Member Companies

130,000

2022 U S H O M E SALE S VO LU M E AM O N G TH E TO P 50 0 U S R E AL E STATE FI RM S $312 K E LL E R W I L LI A M S $353 L E A D IN G R E $124 S OT H E BY’ S I NT E R N ATI O NA L R E A LT Y $120 B E R K S H I R E H AT H AWAY HO M E S E RV I C E S $97 R E / M A X $24 CO R CO R A N $32 C E N T U RY 2 1 $21 U N IT E D R E A L E S TAT E $18 R E A LT Y O N E G R O U P $12 E R A $12 B E T T E R HO M E S A N D GA R D E N S HO M E S MA R T I NT E R N ATI O NA L $30 CO L DW E L L BA N K E R $233 NE T W O R K S , F R A N C H I S E S A N D C O M P A N IE S
JOHN L. SCOTT LUXURY SPECIALISTS SCHOLARS OF THE MARKET

Curious about luxury trends in your neighborhood? See what some of our real estate specialists had to say about the luxury market in their area.

One third of homes in Bellingham are pending within the first week on the market and two thirds are pending within 30 days. We don’t have the same level of frenzy and bidding wars as we did in 2021-2022, but turnkey homes in the hot neighborhoods are still fetching multiple offers and selling above list price. House prices are roughly 20% less than comparable homes in the Seattle metro so we have experienced an influx of remote workers.
We saw a similar number of sales of $1M homes sell in Q3 in 2023 (#33) compared to 2022 (#36.) There are still many to choose from, and it is often taking longer to receive an acceptable offer. However, I have had two recent experiences where my buyers were up against multiple offers, including cash with escalation clauses. Overall, the list-to-sales price ratio remains high. Qualified luxury buyers DO have much to choose from, but it has become clear in this market that not all $1M properties are the same. We recently closed a beautiful home at $2.5M where we had multiple qualified buyers trying to get into escrow. On the flip side, one of our buyers with $3M to spend has so far been unable to find something that checks all of their boxes.
NICOLE TINGVALL Bellingham
SCOTT LEWIS Ashland
BRYCE LEE AND KIMBER LEE
Q3 in the Pierce & South King County luxury market experienced a scarcity of available properties, necessitating careful staging and prepping of homes prior to marketing to maximize their appeal in a competitive market. As we enter fall, luxury home sellers will benefit from a seller’s market with medium intensity; however, the challenge remains with limited inventory. Luxury buyers are increasingly seeking upgraded outdoor amenities, prioritizing privacy, and space, while energy-efficient features and smart home technology continue to be sought-after trends in the luxury market.
BRIAN AND KIM GOLIK


In Q3, the market was a normal to slower market, with homes either moving quickly or staying on the market for a while. We had the good fortune of moving several properties quickly. We feel this was due to correctly pricing it for the current market demands. Currently, the biggest challenge is interest rates. The stock market has pulled back and has lowered the amount of all cash offers, unless you have a Private Wealth Management Portfolio Loan you will be paying a 7%+ loan rate. Conversely, it is a great time to buy with price declines. Sellers are motivated due to “life changes” and spending a lot of time preparing their houses for sale. Moving in to Q4, sellers need to take low offers seriously. The market will be a rocky road. That doesn’t mean accepting a low offer but responding with data to back up their counter-offer pricing. If a buyer has visited 3 or 4 times, they have interest. Buyers are sitting back waiting to see what is going to happen. Instead of waiting for the buyer to write an offer, the seller is writing an offer to the buyer, and as a broker, we need to start the conversation.
2023 Q3 LUXURY MARKET TRENDS
Bellevue Main
Lake Tapps
PUGET SOUND

THIRD QUARTER HIGHLIGHTS
In the third quarter of 2023, luxury sales activity in Seattle, West Bellevue and Mercer Island has continued the trend that began last year. As active inventory has slowly increased in the upper price ranges, buyers have been able to take more time as days on market have trended upwards as well.
2023 Q3 LUXURY MARKET TRENDS Q3 2023 Q3 2022 % Change Number of Sales 116 138 -15.9% Total Dollar Volume $320,455,125 $411,636,875 -22.1% Average Sales Price $2,762,544 $2,982,876 -7.3% Average Days On Market 24 16 49.6% Sold / List Price % 97.3% 98.3% -1.0% Average Price per SQFT $731 $770 -5.0% Quarter-end inventory 141 102 38.2% SEATTLE
The data is for single family residences over $2M in MLS areas 140, 380, 385 390, 700, 701, 705, 710. Some John L. Scott offices are independently owned and operated. All reports presented are based on data supplied by the NWMLS, RMLS, Spokane MLS, and Central Oregon MLS. Neither the Associations nor the MLS guarantees or is in anyway responsible for its accuracy. Data maintained by the Associations or the MLS may not reflect all real estate activities in the market. Information deemed reliable but not guaranteed. OFFERED AT $5,000,000 | JOHNLSCOTT.COM
OFFERED AT $6,350,000 | JOHNLSCOTT.COM/59253
WEST BELLEVUE
Over the last three months in West Bellevue, we’ve seen more closed sales of luxury homes compared with the same period in 2022. The positive news for buyers is that there is also higher active inventory remaining before we enter the winter cleanup months.

Q3 2023 Q3 2022 % Change Number of Sales 50 43 16.2% Total Dollar Volume $207,417,701 $230,652,300 -10.0% Average Sales Price $4,148,354 $5,364,007 -22.6% Average Days On Market 32 24 34.2% Sold / List Price % 97.2% 93.4% 4.0% Average Price per SQFT $1,040 $1,285 -19.0% Quarter-end inventory 60 57 5.2%
The data is for single family residences over $2M in MLS area 520. Some John L. Scott offices are independently owned and operated. All reports presented are based on data supplied by the NWMLS, RMLS, Spokane MLS, and the Central Oregon MLS. Neither the Associations nor the MLS guarantees or is in anyway responsible for its accuracy. Data maintained by the Associations or the MLS may not reflect all real estate activities in the market. Information deemed reliable but not guaranteed.
MERCER ISLAND
Mercer Island remains competitive and in spite of market conditions and interest rates, buyers need to be prepared to move quickly. The active inventory of unsold homes available for buyers is lower than we saw at this time one year ago and many will be waiting in the wings when the spring market kicks off next year.
2023 Q3 LUXURY MARKET TRENDS
Q3 2023 Q3 2022 % Change Number of Sales 44 44 0.0% Total Dollar Volume $168,866,000 $158,170,650 6.7% Average Sales Price $3,837,864 $3,594,788 6.7% Average Days On Market 23 18 30.2% Sold / List Price % 97.2% 98.0% -0.8% Average Price per SQFT $996 $893 11.5% Quarter-end inventory 24 30 -20.0%
AT $14,900,000 | JOHNLSCOTT.COM/73959
OFFERED
The data is for single family residences over $2M in MLS area 510. Some John L. Scott offices are independently owned and operated. All reports presented are based on data supplied by the NWMLS, RMLS, Spokane MLS, and the Central Oregon MLS. Neither the Associations nor the MLS guarantees or is in anyway responsible for its accuracy. Data maintained by the Associations or the MLS may not reflect all real estate activities in the market. Information deemed reliable but not guaranteed.
OFFERED AT $4,250,000 | JOHNLSCOTT.COM/74253
EASTSIDE
Q3 2023 Q3 2022 % Change Number of Sales 322 390 -17.4% Total Dollar Volume $1,003,150,413 $1,226,506,301 -18.2% Average Sales Price $3,115,374 $3,144,888 -0.9% Average Days On Market 28 23 23.2% Sold / List Price % 97.5% 96.4% 1.1% Average Price per SQFT $766 $789 -2.9% Quarter-end inventory 332 311 6.7% The data is for single family residences over $2M in MLS areas 500, 510, 520, 530, 540, 550, 560, 600. Some John L. Scott offices are independently owned and operated. All reports presented are based on data supplied by the NWMLS, RMLS, Spokane MLS, and the Central Oregon MLS. Neither the Associations nor the MLS guarantees or is in anyway responsible for its accuracy. Data maintained by the Associations or the MLS may not reflect all real estate activities in the market. Information deemed reliable but not guaranteed. 23.2% DAYS ON MARKET -0.9% AVERAGE SALES PRICE
2023 Q3 LUXURY MARKET TRENDS KING COUNTY CONDO SOLD | JOHNLSCOTT.COM/29031 Q3 2023 Q3 2022 % Change Number of Sales 31 31 0.0% Total Dollar Volume $86,590,940 $82,904,841 4.4% Average Sales Price $2,793,256 $2,674,350 4.4% Average Days On Market 24 44 -46.6% Sold / List Price % 98.4% 97.0% 1.4% Average Price per SQFT $1,101 $1,182 -6.8% Quarter-end inventory 56 40 40.0% The data is for condominiums over $2M in King County. Some John L. Scott offices are independently owned and operated. All reports presented are based on data supplied by the NWMLS, RMLS, Spokane MLS, and the Central Oregon MLS. Neither the Associations nor the MLS guarantees or is in anyway responsible for its accuracy. Data maintained by the Associations or the MLS may not reflect all real estate activities in the market. Information deemed reliable but not guaranteed. 4.4% AVERAGE SALES PRICE -46.6% AVERAGE DAYS ON MARKET
OFFERED AT $1,899,950 | JOHNLSCOTT.COM/23836
SOUTH KING COUNTY
The data is for single family residences over $1M in MLS areas 100, 110, 120, 130, 140, 300, 310, 320, 330, 340, 350, 360. Some John L. Scott offices are independently owned and operated. All reports presented are based on data supplied by the NWMLS, RMLS, Spokane MLS, and Central Oregon MLS. Neither the Associations nor the MLS guarantees or is in anyway responsible for its accuracy. Data maintained by the Associations or the MLS may not reflect all real estate activities in the market. Information deemed reliable but not guaranteed. Q3 2023 Q3 2022 % Change Number of Sales 171 260 -34.2% Total Dollar Volume $252,826,389 $344,428,059 -26.6% Average Sales Price $1,478,517 $1,324,723 11.6% Average Days On Market 32 25 30.1% Sold / List Price % 98.7% 98.1% 0.6% Average Price per SQFT $431 $390 10.5% Quarter-end inventory 159 161 -1.2%
IN Q3, WE SAW A 11.6% INCREASE IN THE AVERAGE SALES PRICE FOR SOUTH KING COUNTY
2023 Q3 LUXURY MARKET TRENDS Q3 2023 Q3 2022 % Change Number of Sales 173 226 -23.4% Total Dollar Volume $249,197,853 $327,948,274 -24.0% Average Sales Price $1,440,450 $1,451,099 -0.7% Average Days On Market 43 24 77.2% Sold / List Price % 98.3% 97.5% 0.7% Average Price per SQFT $401 $401 0.1% Quarter-end inventory 267 180 48.3%
The data is for single family residences over $1M in Pierce County. Some John L. Scott offices are independently owned and operated. All reports presented are based on data supplied by the NWMLS, RMLS, Spokane MLS, and the Central Oregon MLS. Neither the Associations nor the MLS guarantees or is in anyway responsible for its accuracy. Data maintained by the Associations or the MLS may not reflect all real estate activities in the market. Information deemed reliable but not guaranteed. THE AVERAGE DAYS ON MARKET INCREASED BY 77.2% IN Q3 IN PIERCE COUNTY SOLD | JOHNLSCOTT.COM/27240
PIERCE COUNTY
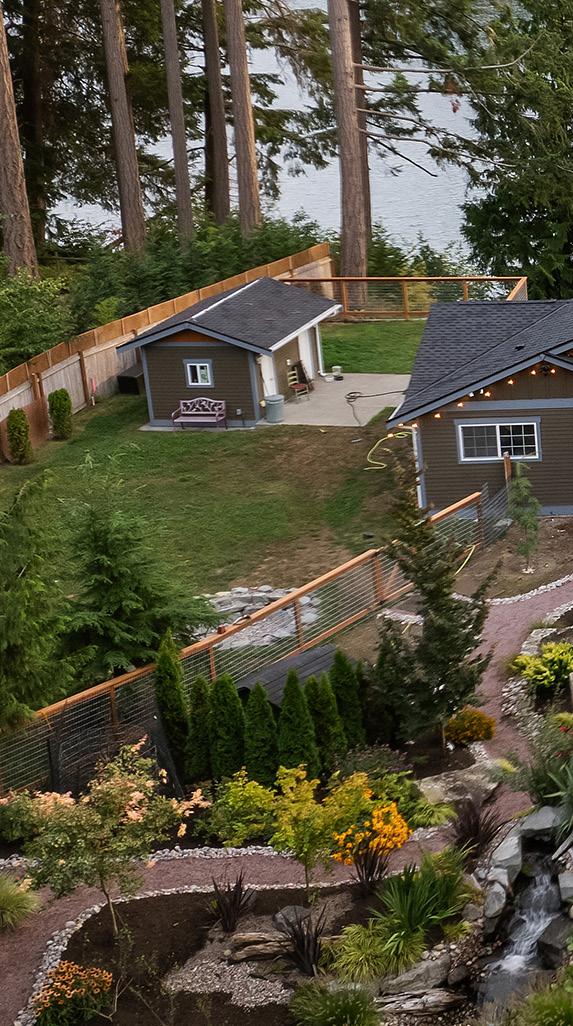
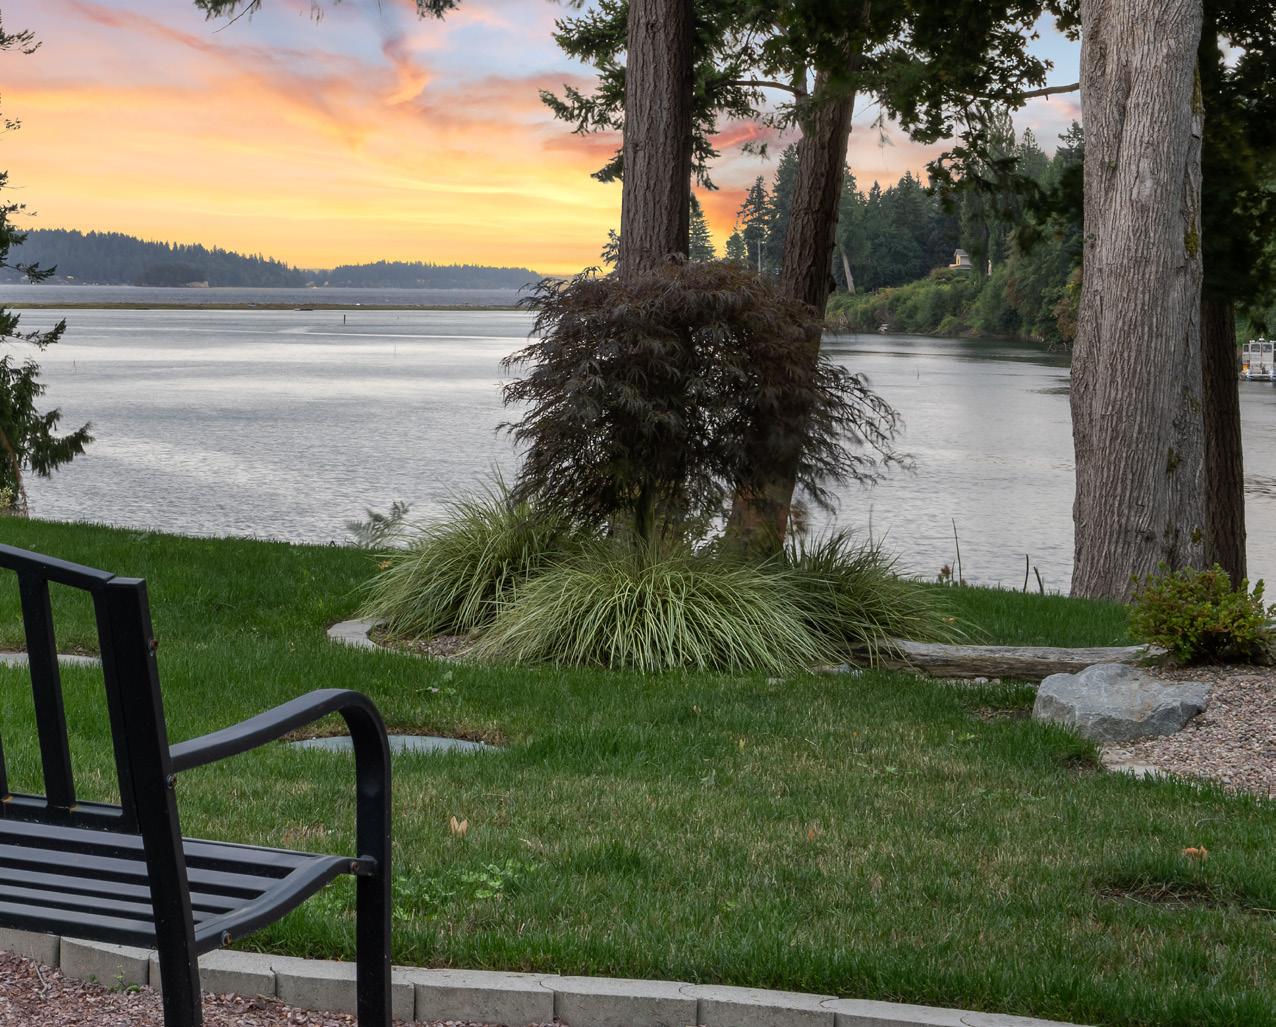
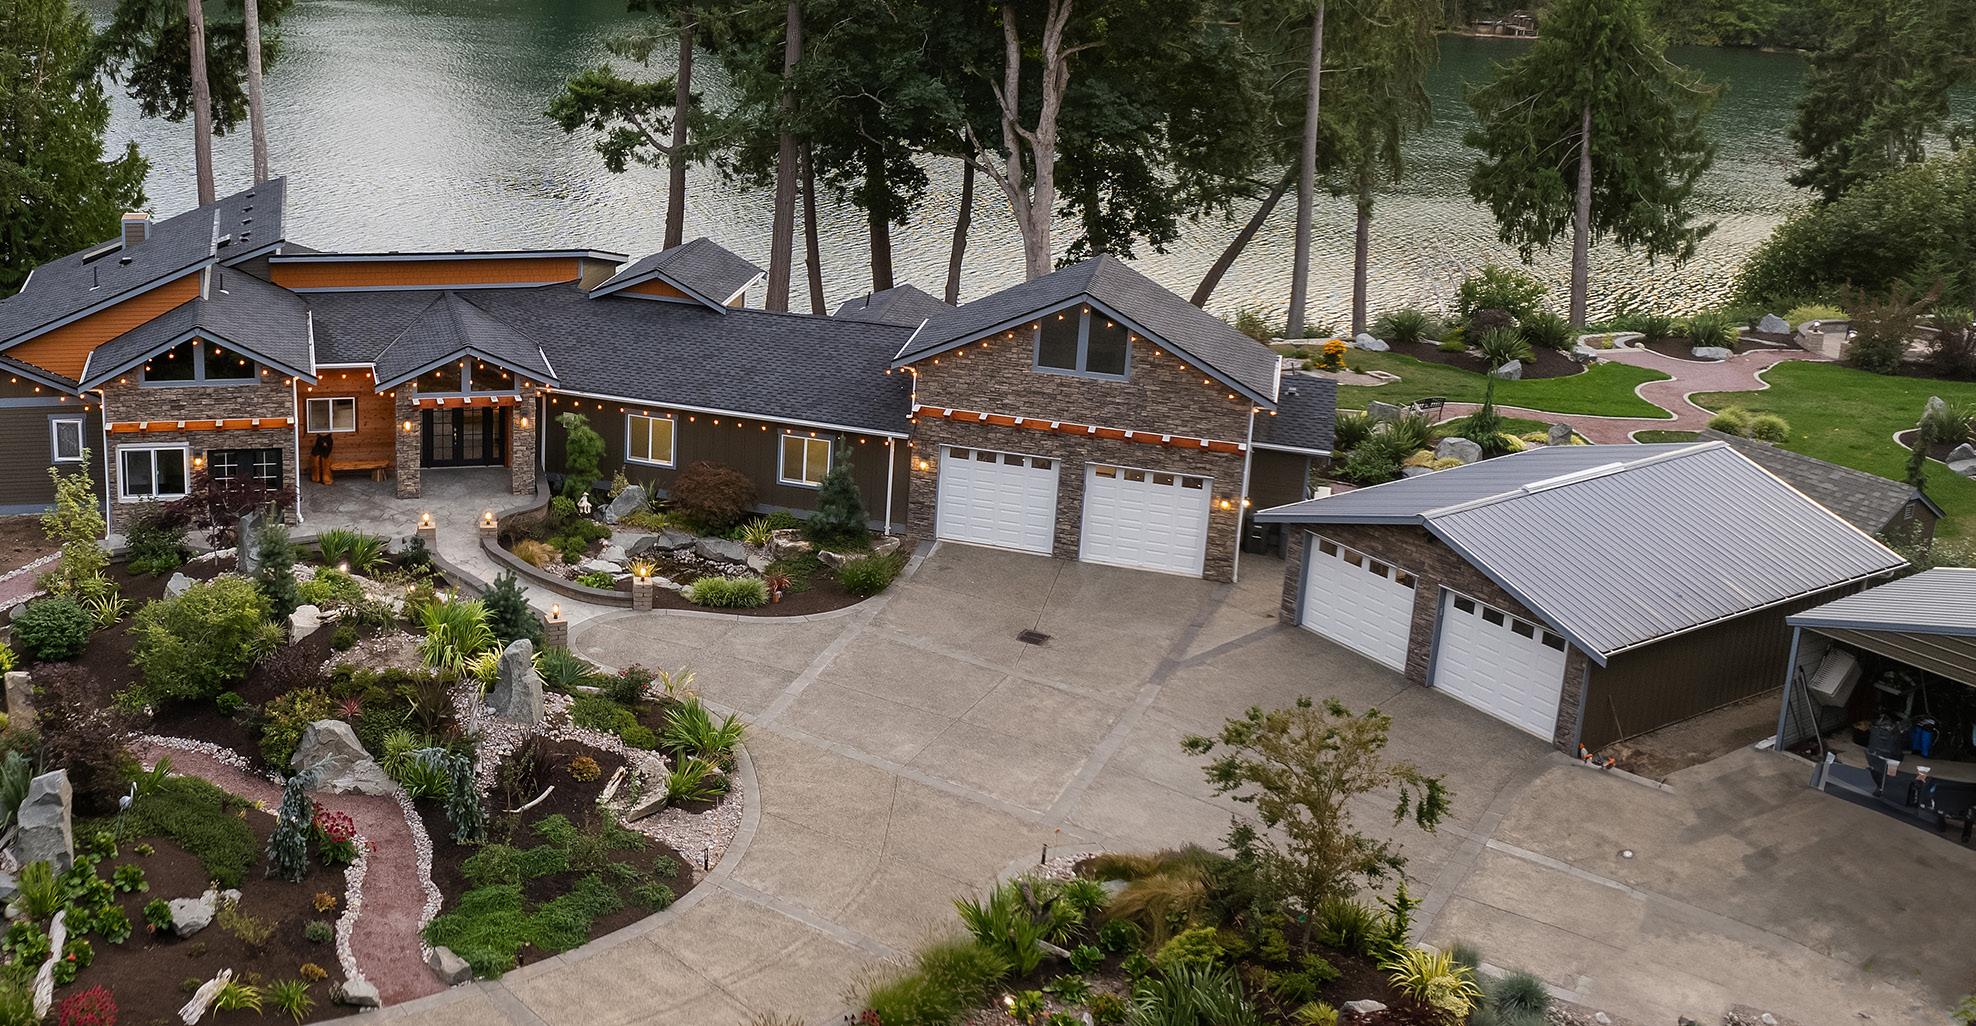
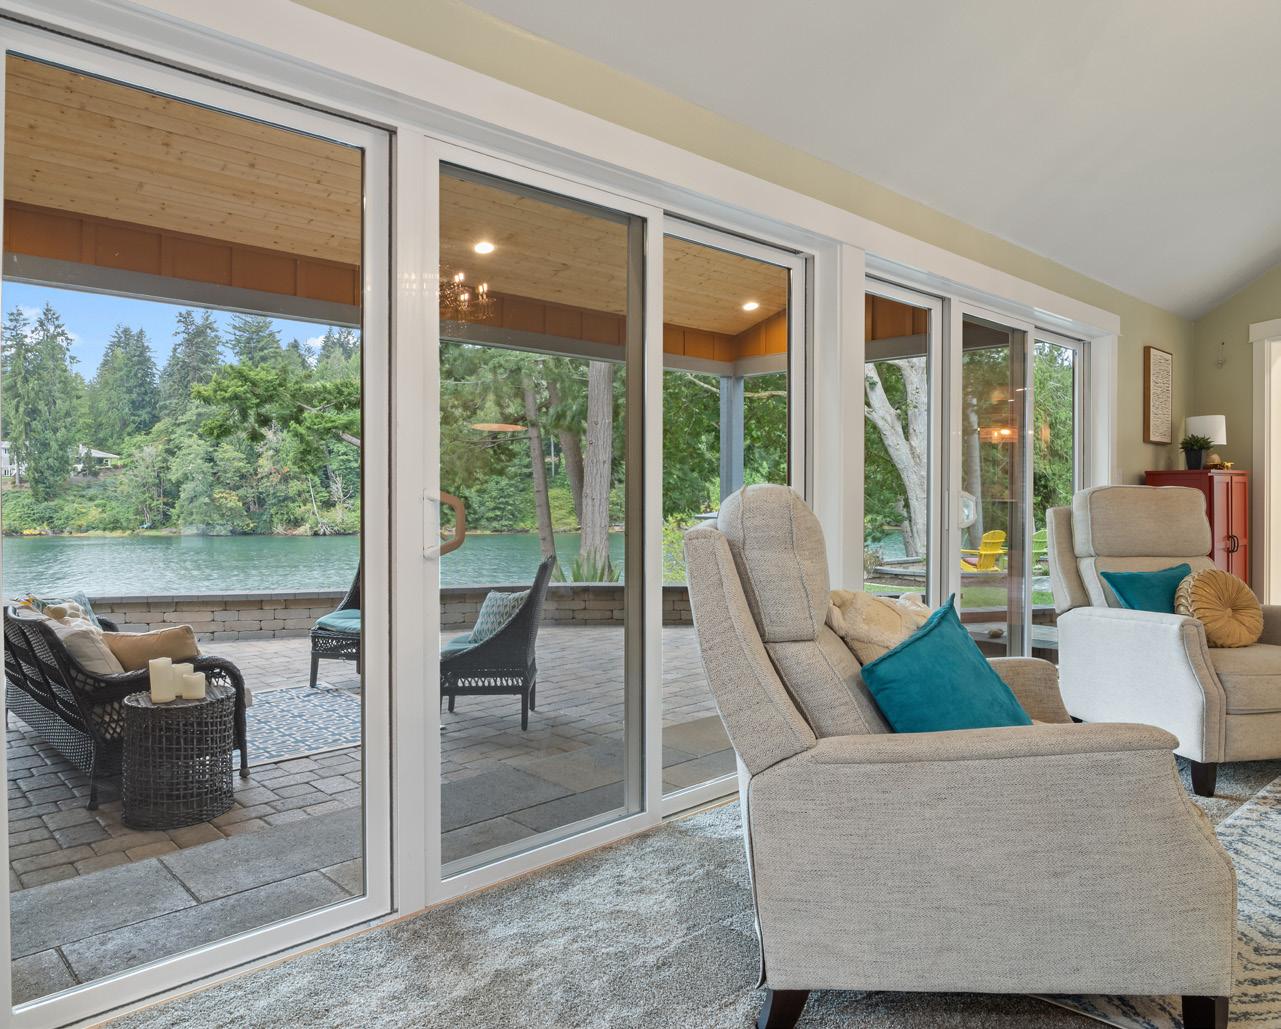
KITSAP COUNTY
OVERALL, THE AVERAGE PRICE PER SQUARE FOOT INCREASED 3.5% IN KITSAP COUNTY
The data is for single family residences over $1M in Kitsap County. Some John L. Scott offices are independently owned and operated. All reports presented are based on data supplied by the NWMLS, RMLS, Spokane MLS, and Central Oregon MLS. Neither the Associations nor the MLS guarantees or is in anyway responsible for its accuracy. Data maintained by the Associations or the MLS may not reflect all real estate activities in the market. Information deemed reliable but not guaranteed. Q3 2023 Q3 2022 % Change Number of Sales 96 129 -25.5% Total Dollar Volume $165,109,964 $201,824,037 -18.1% Average Sales Price $1,719,895 $1,564,527 9.9% Average Days On Market 34 25 35.4% Sold / List Price % 101.6% 99.6% 2.0% Average Price per SQFT $521 $503 3.5% Quarter-end inventory 102 72 41.6%
BAINBRIDGE ISLAND
The demand for the island lifestyle on Bainbridge Island remains strong yet buyers have seen some relief as active inventory has increased. New listings will inevitably slow in the coming months as we close out the year with fewer people putting their homes on the market during the holiday season, which can be a great time to list a property with reduced competition.
2023 Q3 LUXURY MARKET TRENDS Q3 2023 Q3 2022 % Change Number of Sales 17 14 21.4% Total Dollar Volume $52,809,000 $39,485,000 33.7% Average Sales Price $3,106,412 $2,820,357 10.1% Average Days On Market 34 13 166.6% Sold / List Price % 103.6% 99.2% 4.4% Average Price per SQFT $899 $739 21.6% Quarter-end inventory 22 6 266.6% The data is for single family residences over $2M in MLS area 170. Some John L. Scott offices are independently owned and operated. All reports presented are based on data supplied by the NWMLS, RMLS, Spokane MLS, and the Central Oregon MLS. Neither the Associations nor the MLS guarantees or is in anyway responsible for its accuracy. Data maintained by the Associations or the MLS may not reflect all real estate activities in the market. Information deemed reliable but not guaranteed.
SOLD | JOHNLSCOTT.COM/24344
PENDING | JOHNLSCOTT.COM/68885
SNOHOMISH COUNTY
Q3 SAW A 8.7% INCREASE IN DAYS ON MARKET IN SNOHOMISH COUNTY
The data is for single family residences over $1M in Snohomish County. Some John L. Scott offices are independently owned and operated. All reports presented are based on data supplied by the NWMLS, RMLS, Spokane MLS, and Central Oregon MLS. Neither the Associations nor the MLS guarantees or is in anyway responsible for its accuracy. Data maintained by the Associations or the MLS may not reflect all real estate activities in the market. Information deemed reliable but not guaranteed. Q3 2023 Q3 2022 % Change Number of Sales 434 588 -26.1% Total Dollar Volume $583,368,435 $780,216,514 -25.2% Average Sales Price $1,344,167 $1,326,899 1.3% Average Days On Market 27 24 8.7% Sold / List Price % 99.4% 97.6% 1.8% Average Price per SQFT $443 $430 3.0% Quarter-end inventory 275 306 -10.1%
2023 Q3 LUXURY MARKET TRENDS Q3 2023 Q3 2022 % Change Number of Sales 65 48 35.4% Total Dollar Volume $82,799,525 $66,164,000 25.1% Average Sales Price $1,273,839 $1,378,417 -7.5% Average Days On Market 35 21 66.1% Sold / List Price % 96.9% 97.7% -0.8% Average Price per SQFT $493 $504 -2.0% Quarter-end inventory 58 51 13.7% ISLAND COUNTY The data is for single family residences over $1M in Island County. Some John L. Scott offices are independently owned and operated. All reports presented are based on data supplied by the NWMLS, RMLS, Spokane MLS, and the Central Oregon MLS. Neither the Associations nor the MLS guarantees or is in anyway responsible for its accuracy. Data maintained by the Associations or the MLS may not reflect all real estate activities in the market. Information deemed reliable but not guaranteed.
IN
COUNTY OFFERED AT $2,295,000 | JOHNLSCOTT.COM/74924
OVERALL, THE AVERAGE SALES PRICE DECREASED BY 7.5%
ISLAND
LUXURY WATERFRONT
LAKE WASHINGTON
LAKE SAMMAMISH
KING COUNTY
Q3 2023 Q3 2022 % Change Number of Sales 20 30 -33.3% Total Dollar Volume $108,301,125 $204,758,000 -47.1% Average Sales Price $5,415,056 $6,825,267 -20.6% Average Days On Market 32 23 40.2% Sold / List Price % 93.9% 93.4% 0.5% Average Price per SQFT $1,137 $1,448 -21.4% Quarter-end inventory 54 41 31.7%
Q3 2023 Q3 2022 % Change Number of Sales 14 13 7.6% Total Dollar Volume $55,582,600 $47,118,000 17.9% Average Sales Price $3,970,186 $3,624,462 9.5% Average Days On Market 38 35 6.5% Sold / List Price % 97.8% 98.1% -0.2% Average Price per SQFT $1,039 $805 29.1% Quarter-end inventory 29 12 141.6%
Q3 2023 Q3 2022 % Change Number of Sales 55 57 -3.5% Total Dollar Volume $232,395,725 $290,948,000 -20.1% Average Sales Price $4,225,377 $5,104,351 -17.2% Average Days On Market 29 26 12.5% Sold / List Price % 96.1% 94.6% 1.5% Average Price per SQFT $985 $1,142 -13.7% Quarter-end inventory 106 67 58.2%
The data is for waterfront single family residences and condos over $2M. Lake Washington is MLS areas 500, 510, 520, 560, 600, 350, 380, 390, 710, 720. Lake Sammamish is MLS areas 530, 540. Some John L. Scott offices are independently owned and operated. All reports presented are based on data supplied by the NWMLS, RMLS, Spokane MLS, and the Central Oregon MLS. Neither the Associations nor the MLS guarantees or is in anyway responsible for its accuracy. Data maintained by the Associations or the MLS may not reflect all real estate activities in the market. Information deemed reliable but not guaranteed.
2023 Q3 LUXURY MARKET TRENDS OFFERED AT $1,950,000 | JOHNLSCOTT.COM/63235
FEATURED LUXURY LISTINGS
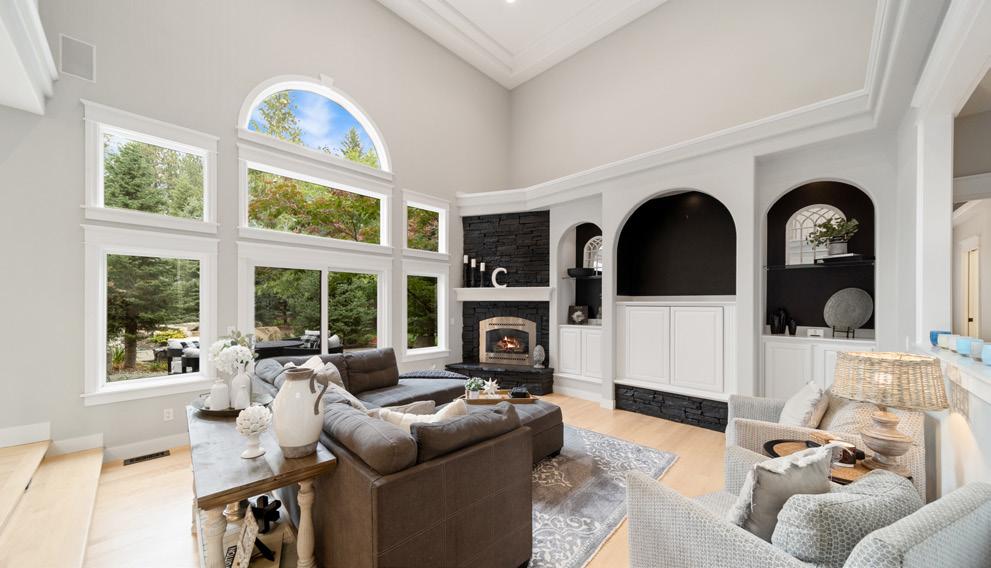


HAYDEN, ID | $2,050,000 | JOHNLSCOTT.COM/39363
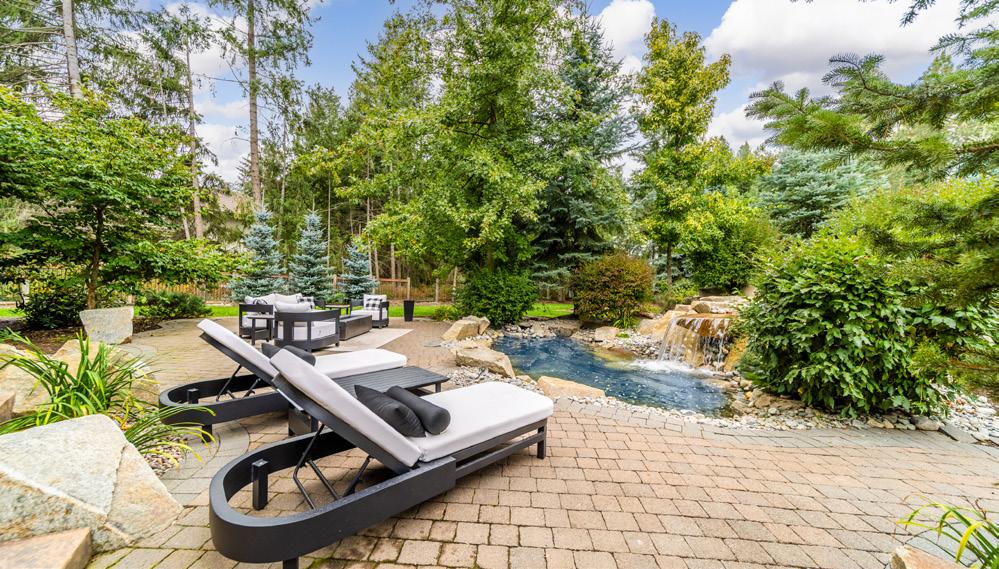
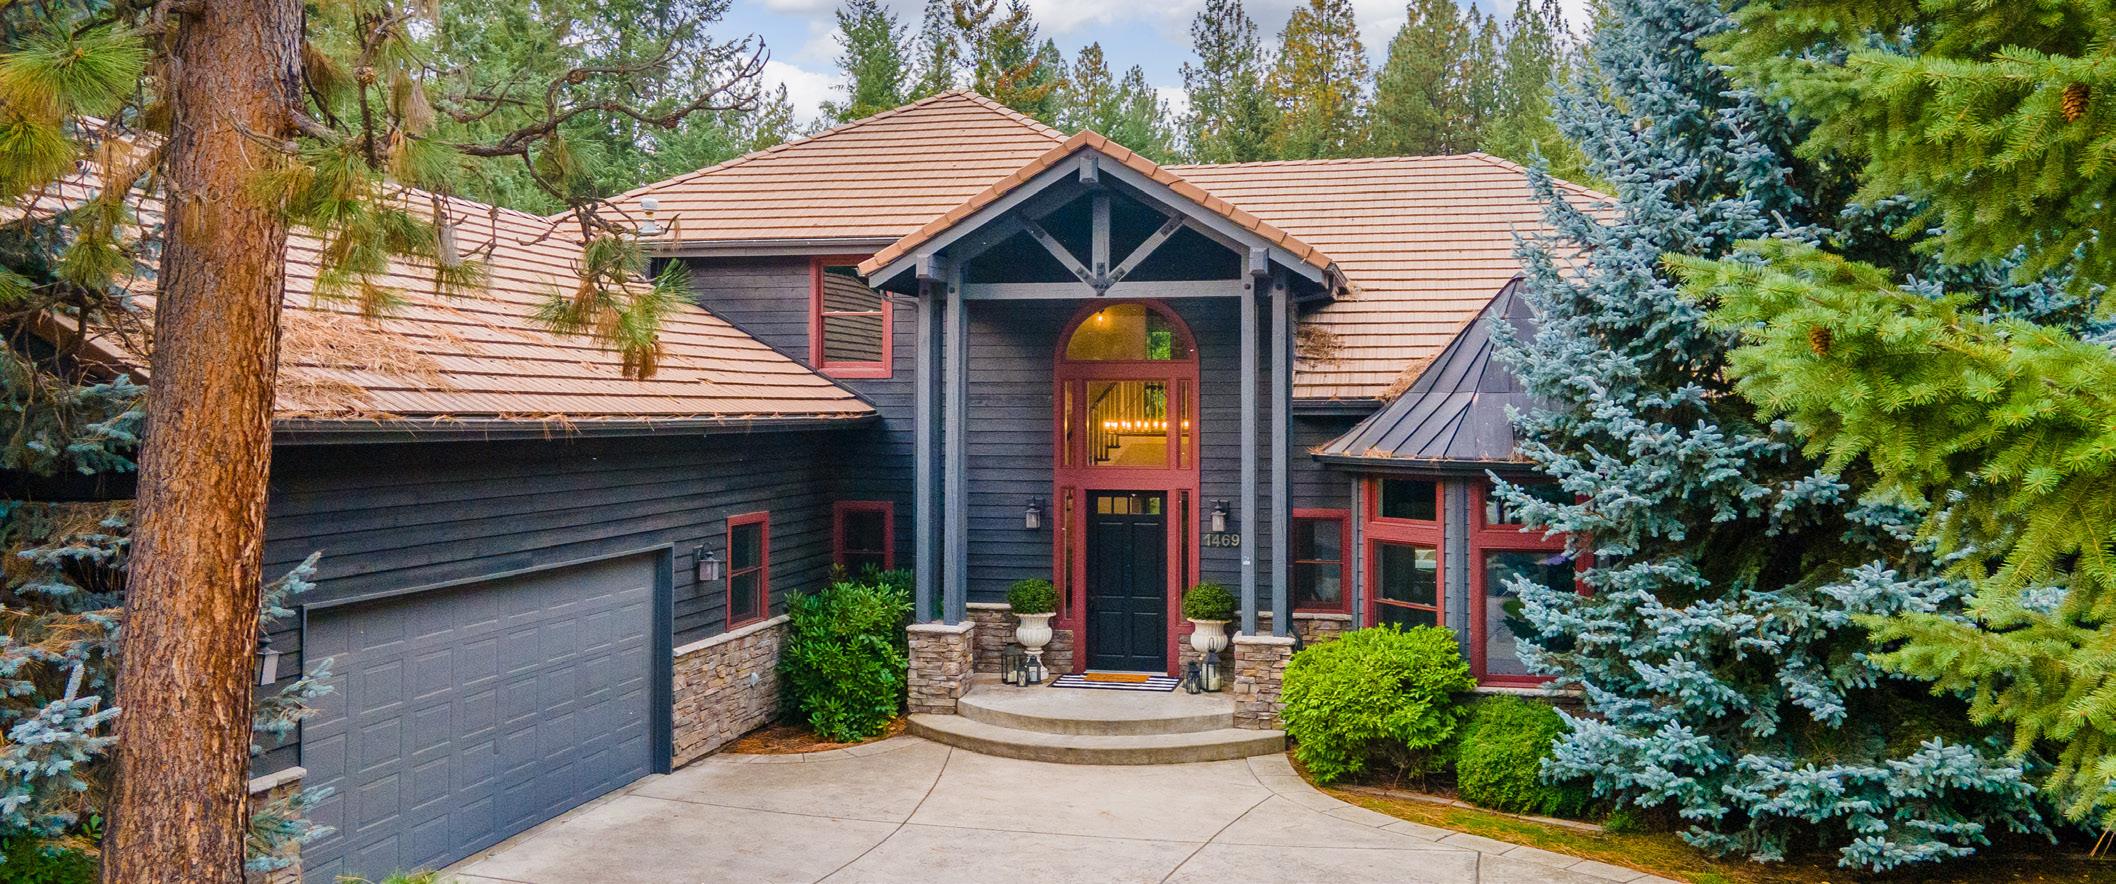
1469 E WOODSTONE DR, HAYDEN, ID 83835
Nestled within a secure gated community near scenic Hayden Lake, this retreat offers a true haven of comfort and luxury. Inside, the main floor offers two primary suites, convenient for multi-generational living. The home has been meticulously updated, including a gourmet kitchen and primary bathroom that reflect modern tastes and functionality. The allure of this home extends beyond its walls to the great outdoors. A swimmable water feature, complete with a chlorination system, and a sunken gas fire pit invites you to relax while surrounded by nature’s abundant wildlife. Embrace the tranquil lake life, with the Hayden Lake Country Club and the Avondale golf course within golf cart distance. This home is not just a residence, it’s a lifestyle.
TANYA BEEBE 208.651.1078 TBeebe@johnlscott.com
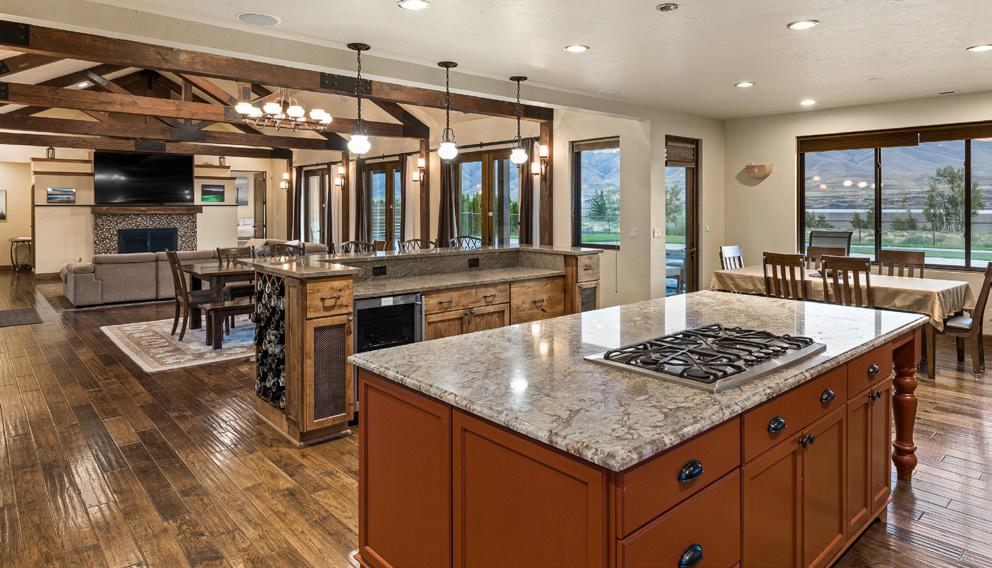
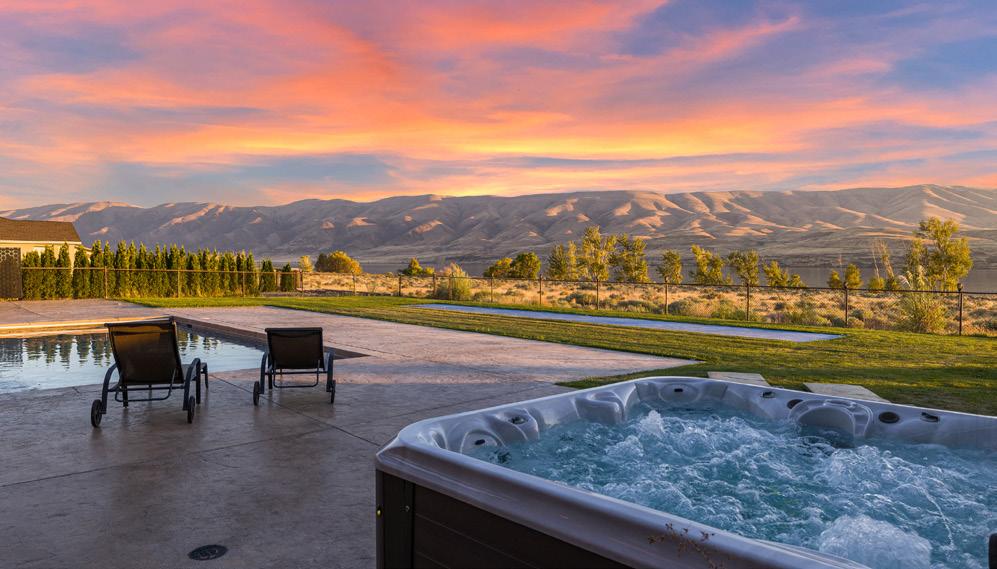
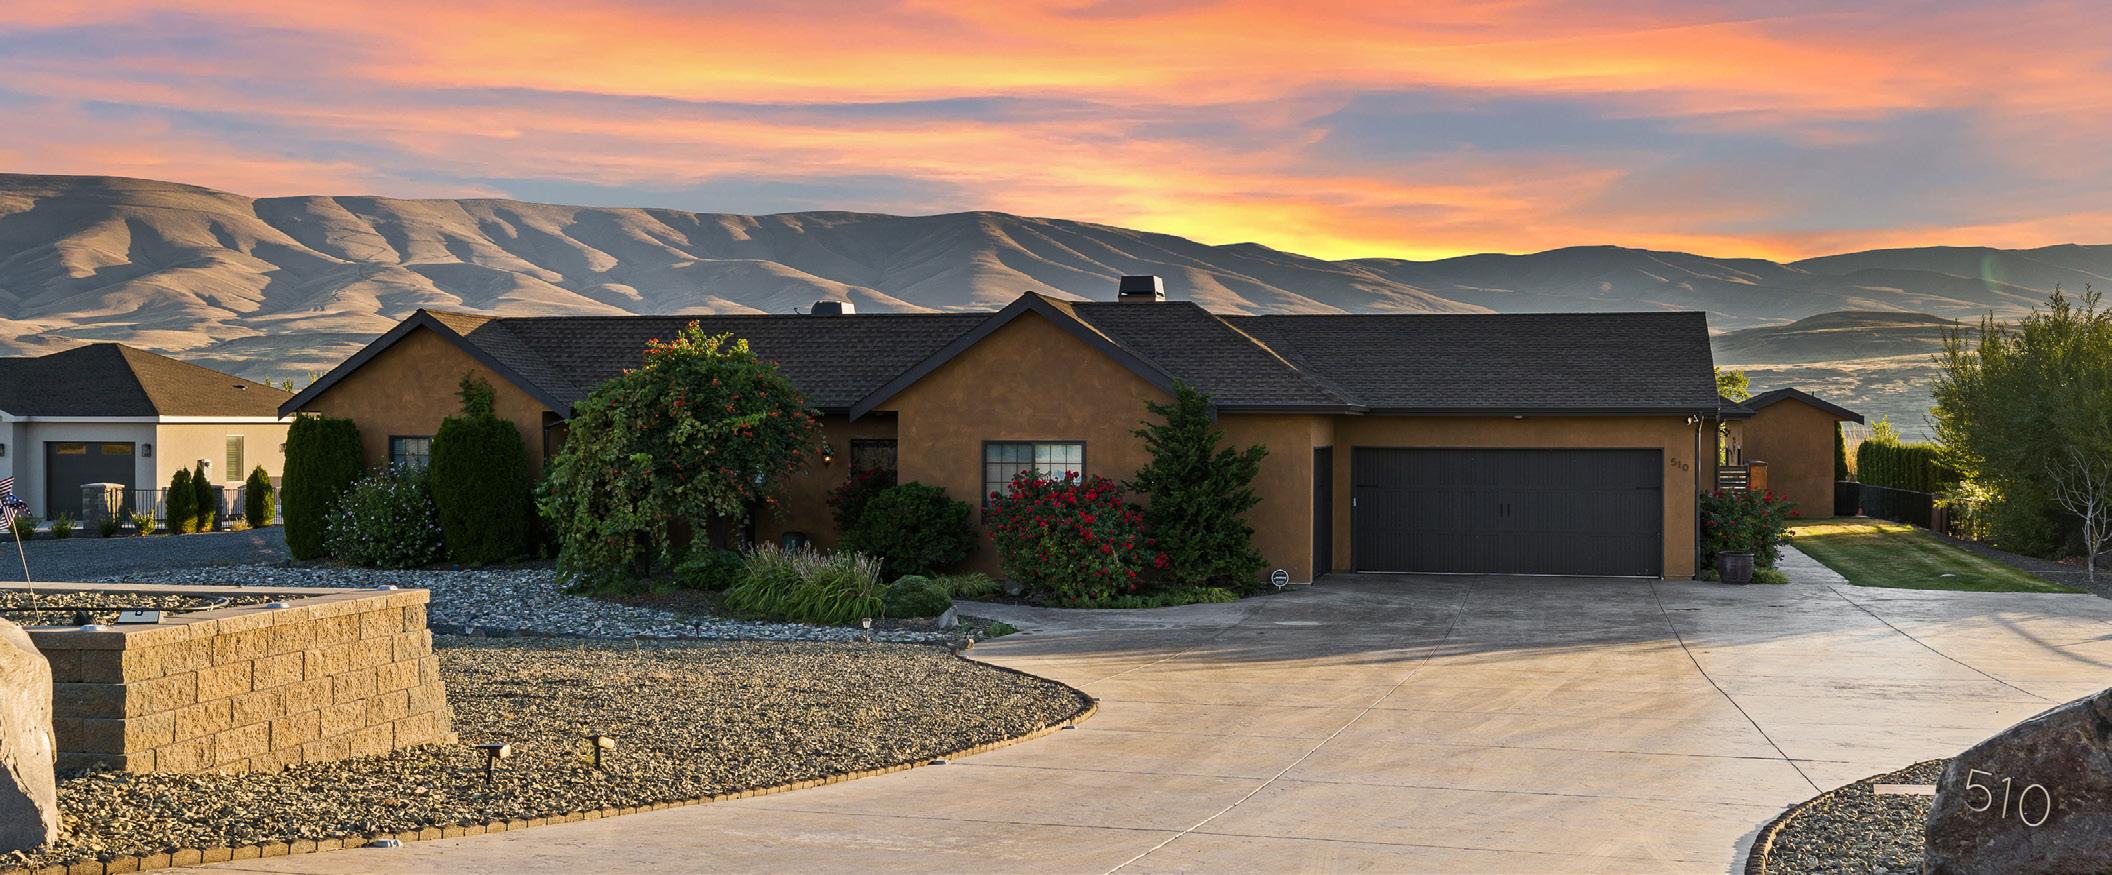
MATTAWA, WA | $2,300,000 | JOHNLSCOTT.COM/22385
510 LAKESIDE WAY SW, MATTAWA, WA 99349
This rich Tuscan inspired rambler sits upon the banks of the Columbia River with grand views of both the river & area mountains. Located within the community of Desert Aire, this home is an outdoor oasis with a stamped concrete back patio, in-ground pool, hot tub and shuffleboard court. A home built for entertaining with large spaces, including a quaint courtyard with built in wood fireplace and backyard with space for all. Between the high-end finishes and the amazing layout, you will enjoy the life of luxury. 18-hole golf course, paved trails along the river, boat launch and regional airport all within minutes from your front door.
KERRY JO HORN

253.691.7817
KerryJoHorn@johnlscott.com
2023 Q3 LUXURY MARKET TRENDS
EASTERN WASHINGTON & IDAHO


2023 Q3 LUXURY MARKET TRENDS
COEUR D’ALENE, IDAHO
Q3 2023 Q3 2022 % Change Number of Sales 117 128 -8.5% Total Dollar Volume $194,484,359 $224,037,565 -13.1% Average Sales Price $1,662,259 $1,750,293 -5.0% Average Days On Market 136 35 291.4% Sold / List Price % 90.9% 95.1% -4.4% Average Price per SQFT $493 $522 -5.4% Quarter-end inventory 271 164 65.2% The data is for single family residences over $1M in Kootenai County. Some John L. Scott offices are independently owned and operated. All reports presented are based on data supplied by the NWMLS, RMLS, Spokane MLS, and Central Oregon MLS. Neither the Associations nor the MLS guarantees or is in anyway responsible for its accuracy. Data maintained by the Associations or the MLS may not reflect all real estate activities in the market. Information deemed reliable but not guaranteed. OFFERED AT $4,150,000 | JOHNLSCOTT.COM/60945
THE AVERAGE SALES PRICE IN COEUR D’ALENE DECREASED 5.0%
SPOKANE COUNTY
9.2%
2023 Q3 LUXURY MARKET TRENDS
Q3 2023 Q3 2022 % Change Number of Sales 49 62 -20.9% Total Dollar Volume $68,084,910 $78,844,699 -13.6% Average Sales Price $1,389,488 $1,271,689 9.2% Average Days On Market 34 26 33.1% Sold / List Price % 92.4% 96.0% -3.7% Average Price per SQFT $310 $306 1.0% Quarter-end inventory 149 46 223.9% The data is for single family residences over $1M in Spokane County. Some John L. Scott offices are independently owned and operated. All reports presented are based on data supplied by the NWMLS, RMLS, Spokane MLS, and Central Oregon MLS. Neither the Associations nor the MLS guarantees or is in anyway responsible for its accuracy. Data maintained by the Associations or the MLS may not reflect all real estate activities in the market. Information deemed reliable but not guaranteed. OFFERED AT $1,450,000 | JOHNLSCOTT.COM/69618
THE AVERAGE SALES PRICE IN SPOKANE COUNTY INCREASED
OREGON & SOUTHWEST WASHINGTON

THIRD QUARTER HIGHLIGHTS
In the third quarter of 2023, luxury sales activity in the Portland Metro area has cooled relative to the same period in 2022 and higher days on market has been a relief to buyers who can take their time to view each new listing. The area has a good amount of inventory compared to similar metro areas, which translates to great opportunities for luxury buyers.
OFFERED AT $2,590,000 | JOHNLSCOTT.COM/66983
In Lake Oswego and West Linn, luxury inventory continues to slowly build because of the intensity adjustment in the market combined with higher interest rates. Great selection is available to buyers as we approach the quiet winter months.
2023 Q3 LUXURY MARKET TRENDS Q3 2023 Q3 2022 % Change Number of Sales 132 202 -34.6% Total Dollar Volume $183,777,916 $297,668,041 -38.2% Average Sales Price $1,392,257 $1,473,604 -5.5% Average Days On Market 36 26 40.0% Sold / List Price % 97.1% 98.6% -1.5% Average Price per SQFT $543 $504 7.7% Quarter-end inventory 250 186 34.4%
The
All reports presented are based on data supplied by the NWMLS, RMLS, Spokane MLS, and Central Oregon MLS. Neither the Associations nor the MLS guarantees or is in anyway responsible for its accuracy. Data maintained by the Associations or the MLS may not reflect all real estate activities in the market. Information deemed reliable but not guaranteed.
data is for single family residences over $1M in Clackamas, Multnomah, Washington and Columbia Counties. Some John L. Scott offices are independently owned and operated.
Q3 2023 Q3 2022 % Change Number of Sales 97 109 -11.0% Total Dollar Volume $194,911,415 $183,302,740 6.3% Average Sales Price $2,009,396 $1,681,677 19.4% Average Days On Market 28 25 12.5% Sold / List Price % 98.3% 99.6% -1.2% Average Price per SQFT $772 $572 35.0% Quarter-end inventory 139 115 20.8%
PORTLAND METRO
AT $3,295,000
LAKE OSWEGO
OFFERED
| JOHNLSCOTT.COM/13341
The data is for single family residences over $1M in Bend Oregon. Some John L. Scott offices are independently owned and operated. All reports presented are based on data supplied by the NWMLS, RMLS, Spokane MLS, and the Central Oregon MLS. Neither the Associations nor the MLS guarantees or is in anyway responsible for its accuracy. Data maintained by the Associations or the MLS may not reflect all real estate activities in the market. Information deemed reliable but not guaranteed. Q3 2023 Q3 2022 % Change Number of Sales 225 276 -18.4% Total Dollar Volume $371,745,425 $431,839,852 -13.9% Average Sales Price $1,652,202 $1,564,637 5.6% Average Days On Market 52 30 74.5% Sold / List Price % 96.9% 97.9% -1.0% Average Price per SQFT $544 $529 2.7% Quarter-end inventory 330 165 100.0%
IN Q3, THE AVERAGE SALES PRICE INCREASED BY 5.6% IN BEND
BEND
Available luxury inventory in Bend has doubled compared with the same period in 2022 offering greater selection for buyers interested in this lifestyle destination.
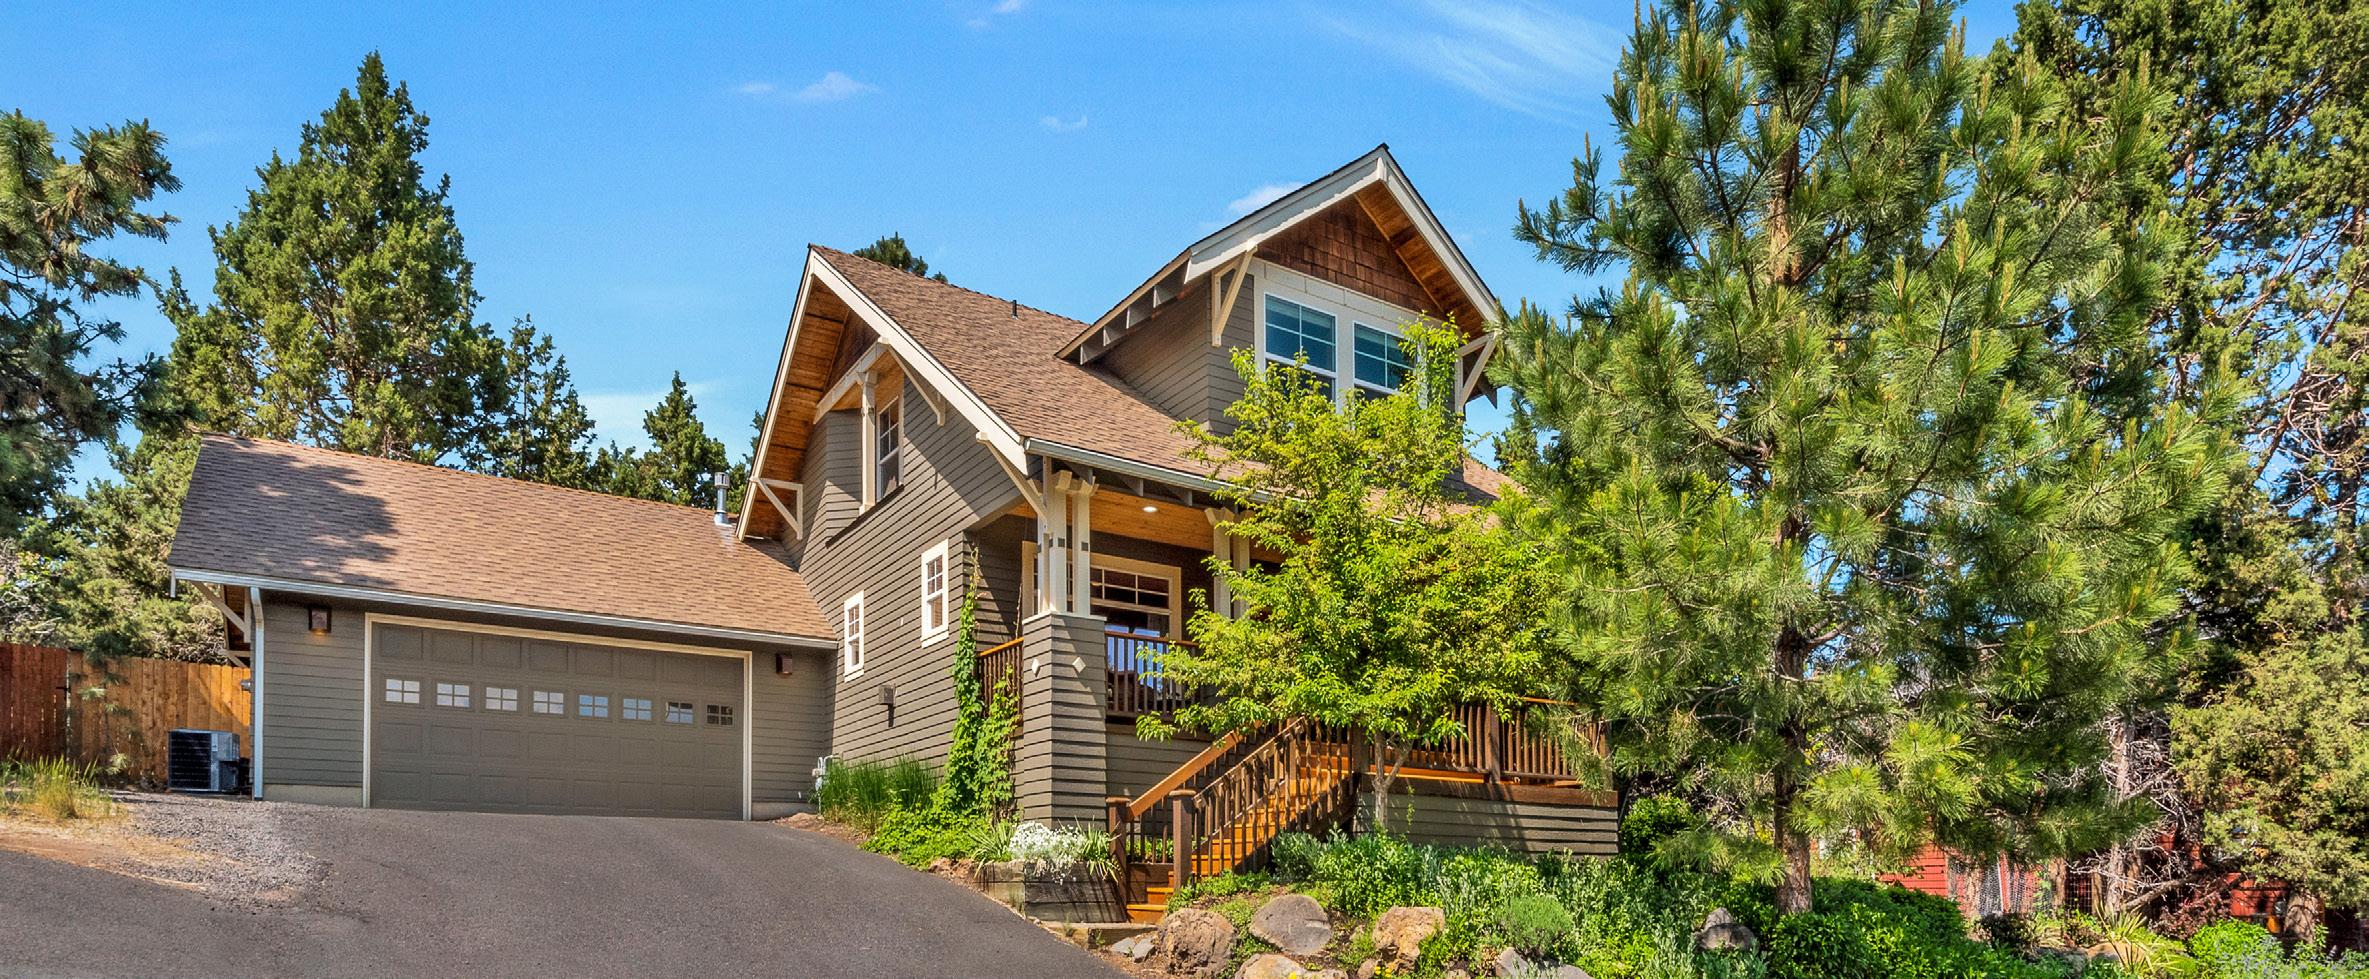
Bend is a lifestyle destination and appeals to high-net-worth individuals from a variety of backgrounds who are looking to purchase a primary residence or second home in the city known for its fantastic outdoor recreation opportunities.
2023 Q3 LUXURY MARKET TRENDS
PENDING | JOHNLSCOTT.COM/33693
The data is for single family residences over $1M in Jackson County. Some John L. Scott offices are independently owned and operated. All reports presented are based on data supplied by the NWMLS, RMLS, Spokane MLS, and Central Oregon MLS. Neither the Associations nor the MLS guarantees or is in anyway responsible for its accuracy. Data maintained by the Associations or the MLS may not reflect all real estate activities in the market. Information deemed reliable but not guaranteed. Q3 2023 Q3 2022 % Change Number of Sales 31 32 -3.1% Total Dollar Volume $39,259,625 $45,830,665 -14.3% Average Sales Price $1,266,440 $1,432,208 -11.5% Average Days On Market 84 112 -24.8% Sold / List Price % 94.7% 92.6% 2.2% Average Price per SQFT $339 $433 -21.8% Quarter-end inventory 116 72 61.1% JACKSON COUNTY
AT $1,875,000 | JOHNLSCOTT.COM/39466
ON
IN
IN
OFFERED
THE AVERAGE DAYS
MARKET DECREASED BY 24.8%
Q3
JACKSON COUNTY
2023 Q3 LUXURY MARKET TRENDS Q3 2023 Q3 2022 % Change Number of Sales 103 131 -21.3% Total Dollar Volume $130,653,512 $177,435,993 -26.3% Average Sales Price $1,268,481 $1,354,473 -6.3% Average Days On Market 52 32 62.6% Sold / List Price % 96.1% 98.1% -2.0% Average Price per SQFT $451 $463 -2.6% Quarter-end inventory 249 160 55.6%
The data is for single family residences over $1M in Clark County. Some John L. Scott offices are independently owned and operated. All reports presented are based on data supplied by the NWMLS, RMLS, Spokane MLS, and the Central Oregon MLS. Neither the Associations nor the MLS guarantees or is in anyway responsible for its accuracy. Data maintained by the Associations or the MLS may not reflect all real estate activities in the market. Information deemed reliable but not guaranteed. OFFERED AT $2,350,000 | JOHNLSCOTT.COM/74458 IN Q3, THE
CLARK
CLARK COUNTY
AVERAGE SALES PRICE DECREASED
6.3% IN
COUNTY
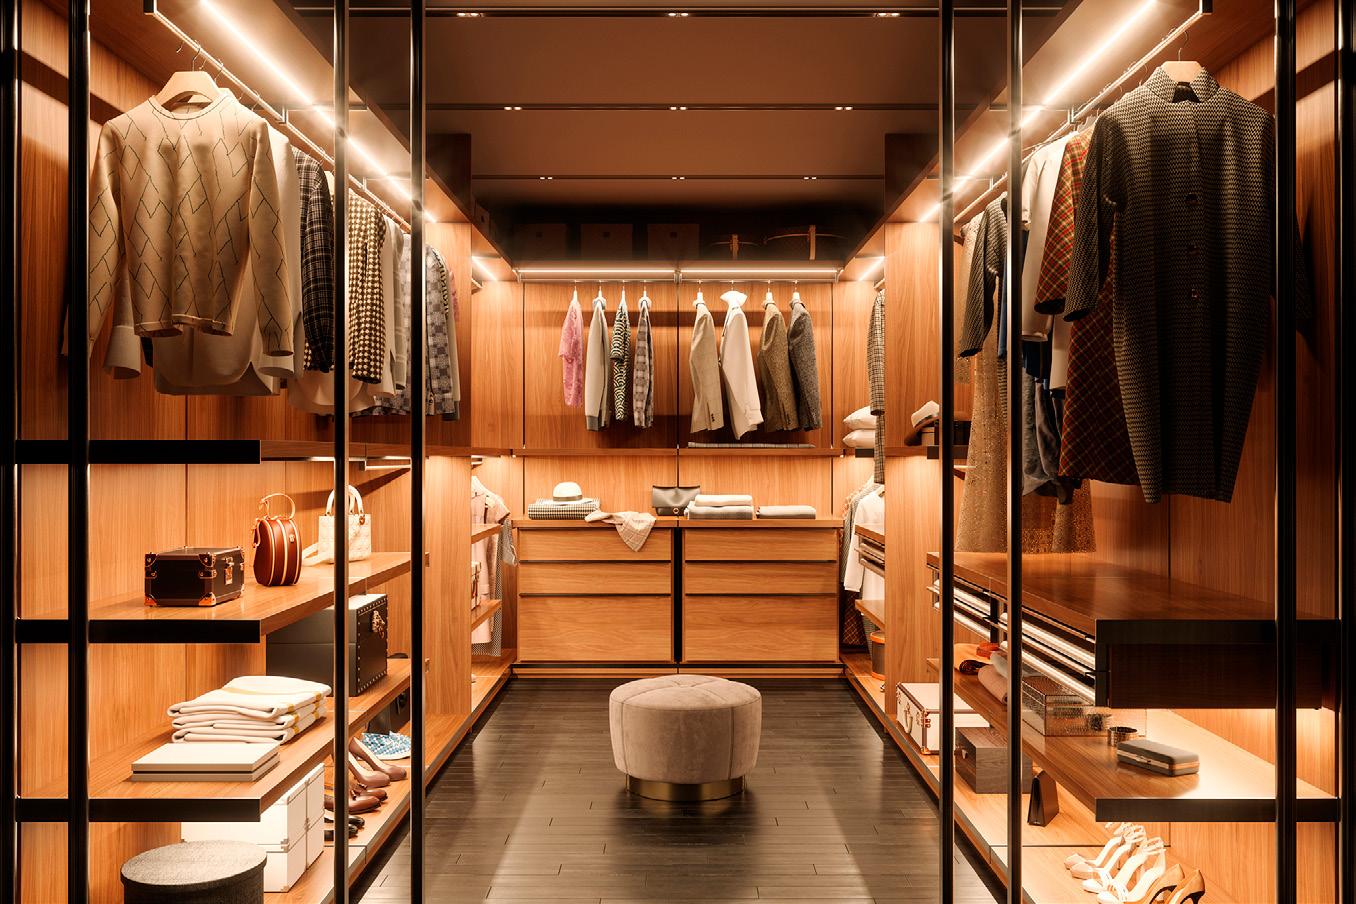
CLOSET CASE ELEVATE THE EXPERIENCE OF EVERY DAY BY TURNING THE CLOSET INTO A LAVISH, BESPOKE DRESSING ROOM
By Lisa Klein
Imagine a boutique experience lounging on a plush settee with an espresso or glass of Champagne before perusing sumptuous racks of beautiful clothing, choosing the perfect bag and shoes from a towering, backlit wall and leisurely adding the final touches to your hair in a space styled just for you. But all of this is happening in your own home — in your closet.
Closets do not have to be haphazardly crammed with garments, shoes hanging lifelessly on the back of the door, a place where you grab your tie from — if you can find the one you want — and run. Thoughtfully designed dressing rooms can be relaxing, personalized places to start and end the day.
“An organized, well-thought-out, beautiful closet becomes a retreat for the homeowner to escape to and enjoy each time they enter it,” says Melissa Adair, senior project manager for the Florida-based Marc-Michaels Interior Design. “It’s refreshing to have everything nicely displayed and organized and makes it a pleasure to get ready for the day.”
Open the door
Getting dressed is, or at least should be, an experience. Many spend a lot of time and money collecting curated closets full of designer duds, accessories and high-wattage jewels, and these all need a proper home and a special place for their owner to appreciate them while getting ready.
“We do spend so much time in our bathrooms and our closets, and normally we forget to actually enjoy that time,” says Doniphan Moore, principal of Doniphan Moore Interiors in Dallas, Texas. “By really putting the effort in, I think you create the experience that you have.”
The place where one gets dressed is incredibly personal, and should both reflect the individual and make them feel good, setting the mood for each day.
“You want to feel special; you want to feel confident; you want to feel happy,” says Julie Dodson, founder and creative director of the Houston, Texas-based Dodson Interiors.
“[A closet] should be a space that just puts a smile on your face,” she says. “You’ve got all your favorite things around you.”
A customized closet is both a reflection of an individual’s own impeccable style and a space that needs to remain functional, with an optimized layout and a spot for everything.
Mr. Moore recommends thinking about the design-standard “kitchen triangle” of refrigerator, sink and stove, but for getting dressed. The “closet triangle” could be clothing storage, a place to sit while putting on shoes and a full-length mirror for checking out the final ensemble. And leaving enough space in between is key.
“By having things a little more spread out and less crammed, I think it allows the person who’s living with those things to appreciate those things more, by showing everything so beautifully,” Mr. Moore advises. “Presentation is everything right?”
Dress it up
Not everything needs to be seen, however, and using a mix of both open and closed storage keeps things clean and organized. Rows and rows of clothes on hangers not only look messy and monotonous, but take the focus off of the good stuff. Hiding some items in drawers and behind doors while displaying special pieces lets the best shine.
“I like to display eye-catching items — the beautiful bags and shoes, maybe a gorgeous dress — and hide the more day-to-day items,” Ms. Adair says.
There are also collectors who want to have their prized possessions on view, from walls of handbags and shoes to glass-top cases for jewelry and watches. This makes for both a happy place and one that is visually stunning.
Functional pieces can also add to the aesthetic. While a closet may only be seen by the household it serves, and usually by only one or two members, that does not mean the furniture in it need be boring. In fact, the opposite is true. Choosing beautiful chests, dressers, tables and vanities levels-up the experience.
Seating is another important addition, from the practical bench to posh sofas and chairs for lounging — and sharing the space with friends and family.
Another must-have, the floor-length mirror, can also be a focal point for gathering with loved ones. Ms. Dodson likes to install a three-way version, whenever space allows, for viewing all angles.
“I put one in a client’s closet years ago,” she says. “She had three daughters, and they would all get dressed in there and check themselves out in that mirror. Again, it makes you feel special. It’s like your own little space.”
A dry bar or coffee nook adds to the social ambiance, or also becomes a perfect getaway spot for some alone time.
A CLOSET THIS MAJOR calls for décor that is considered just as much as that of the living room — and can be as outré as one wants since it lives in a hidden-away place. Some choose to lean ultrafeminine or masculine, while others opt for a decadent mix of both in a shared space.
Either way, layering luxe materials such as lacquered wood, marble, brass, glass, silk carpeting, velvet upholstery and crystal light fixtures ensures an all-out glam factor, and focusing lighting on displayed pieces makes them pop. A closet is also the perfect place to showcase personal photographs and sentimental objects, Ms. Adair advises — a reminder that it is a place all to oneself.
“These rooms are such little jewel box moments,” Ms. Dodson says. “Creating those places and little moments that allow you to escape life for a minute — that closet is your space.”
Text reproduced with permission from Luxury Portfolio International and Luxury Portfolio magazine. © Luxury Portfolio International. All rights reserved.
Photo credit: istock.com
2023 Q3 LUXURY MARKET TRENDS
@JLSexceptionalhomes @exceptional_homesjls Connect with us: OFFERED AT $4,250,000 | JOHNLSCOTT.COM/70765
