LUXURY MARKET TRENDS
WELCOME SUMMER!
The luxury real estate market is still seeing the effects of the intensity adjustment that started last year. This is currently being demonstrated through fewer closed transactions than the same period one year ago, with more active inventory for buyers to choose from in nearly all of our luxury markets.
There are a variety of life events that can prompt you to buy or sell. In today’s market, luxury buyers and sellers could be navigating life events including getting a new job or a promotion, or family changes. Additionally, seniors, retirees, and those in their homes for 5+ years, with major home equity are on the move. Whatever the reason for buying or selling, our luxury broker associates can help you along the way.
We hope you enjoy our Luxury Market Trends report covering the second quarter of 2023!
J. Lennox Scott Chairman and CEO

 John L. Scott Real Estate
EXCEPTIONAL HOMES
BY JOHN L. SCOTT
Exceptional Homes is John L. Scott’s luxury real estate brand. Together with our luxury broker associates, our global partners at Luxury Portfolio International, and our support staff, we strive to provide concierge-level service by putting clients first.
We can ensure you that we are here for you and your family. The real estate market is fast-paced and ever changing, but what hasn’t changed, is our commitment to exceed your expectations when you are ready to buy or sell your home.
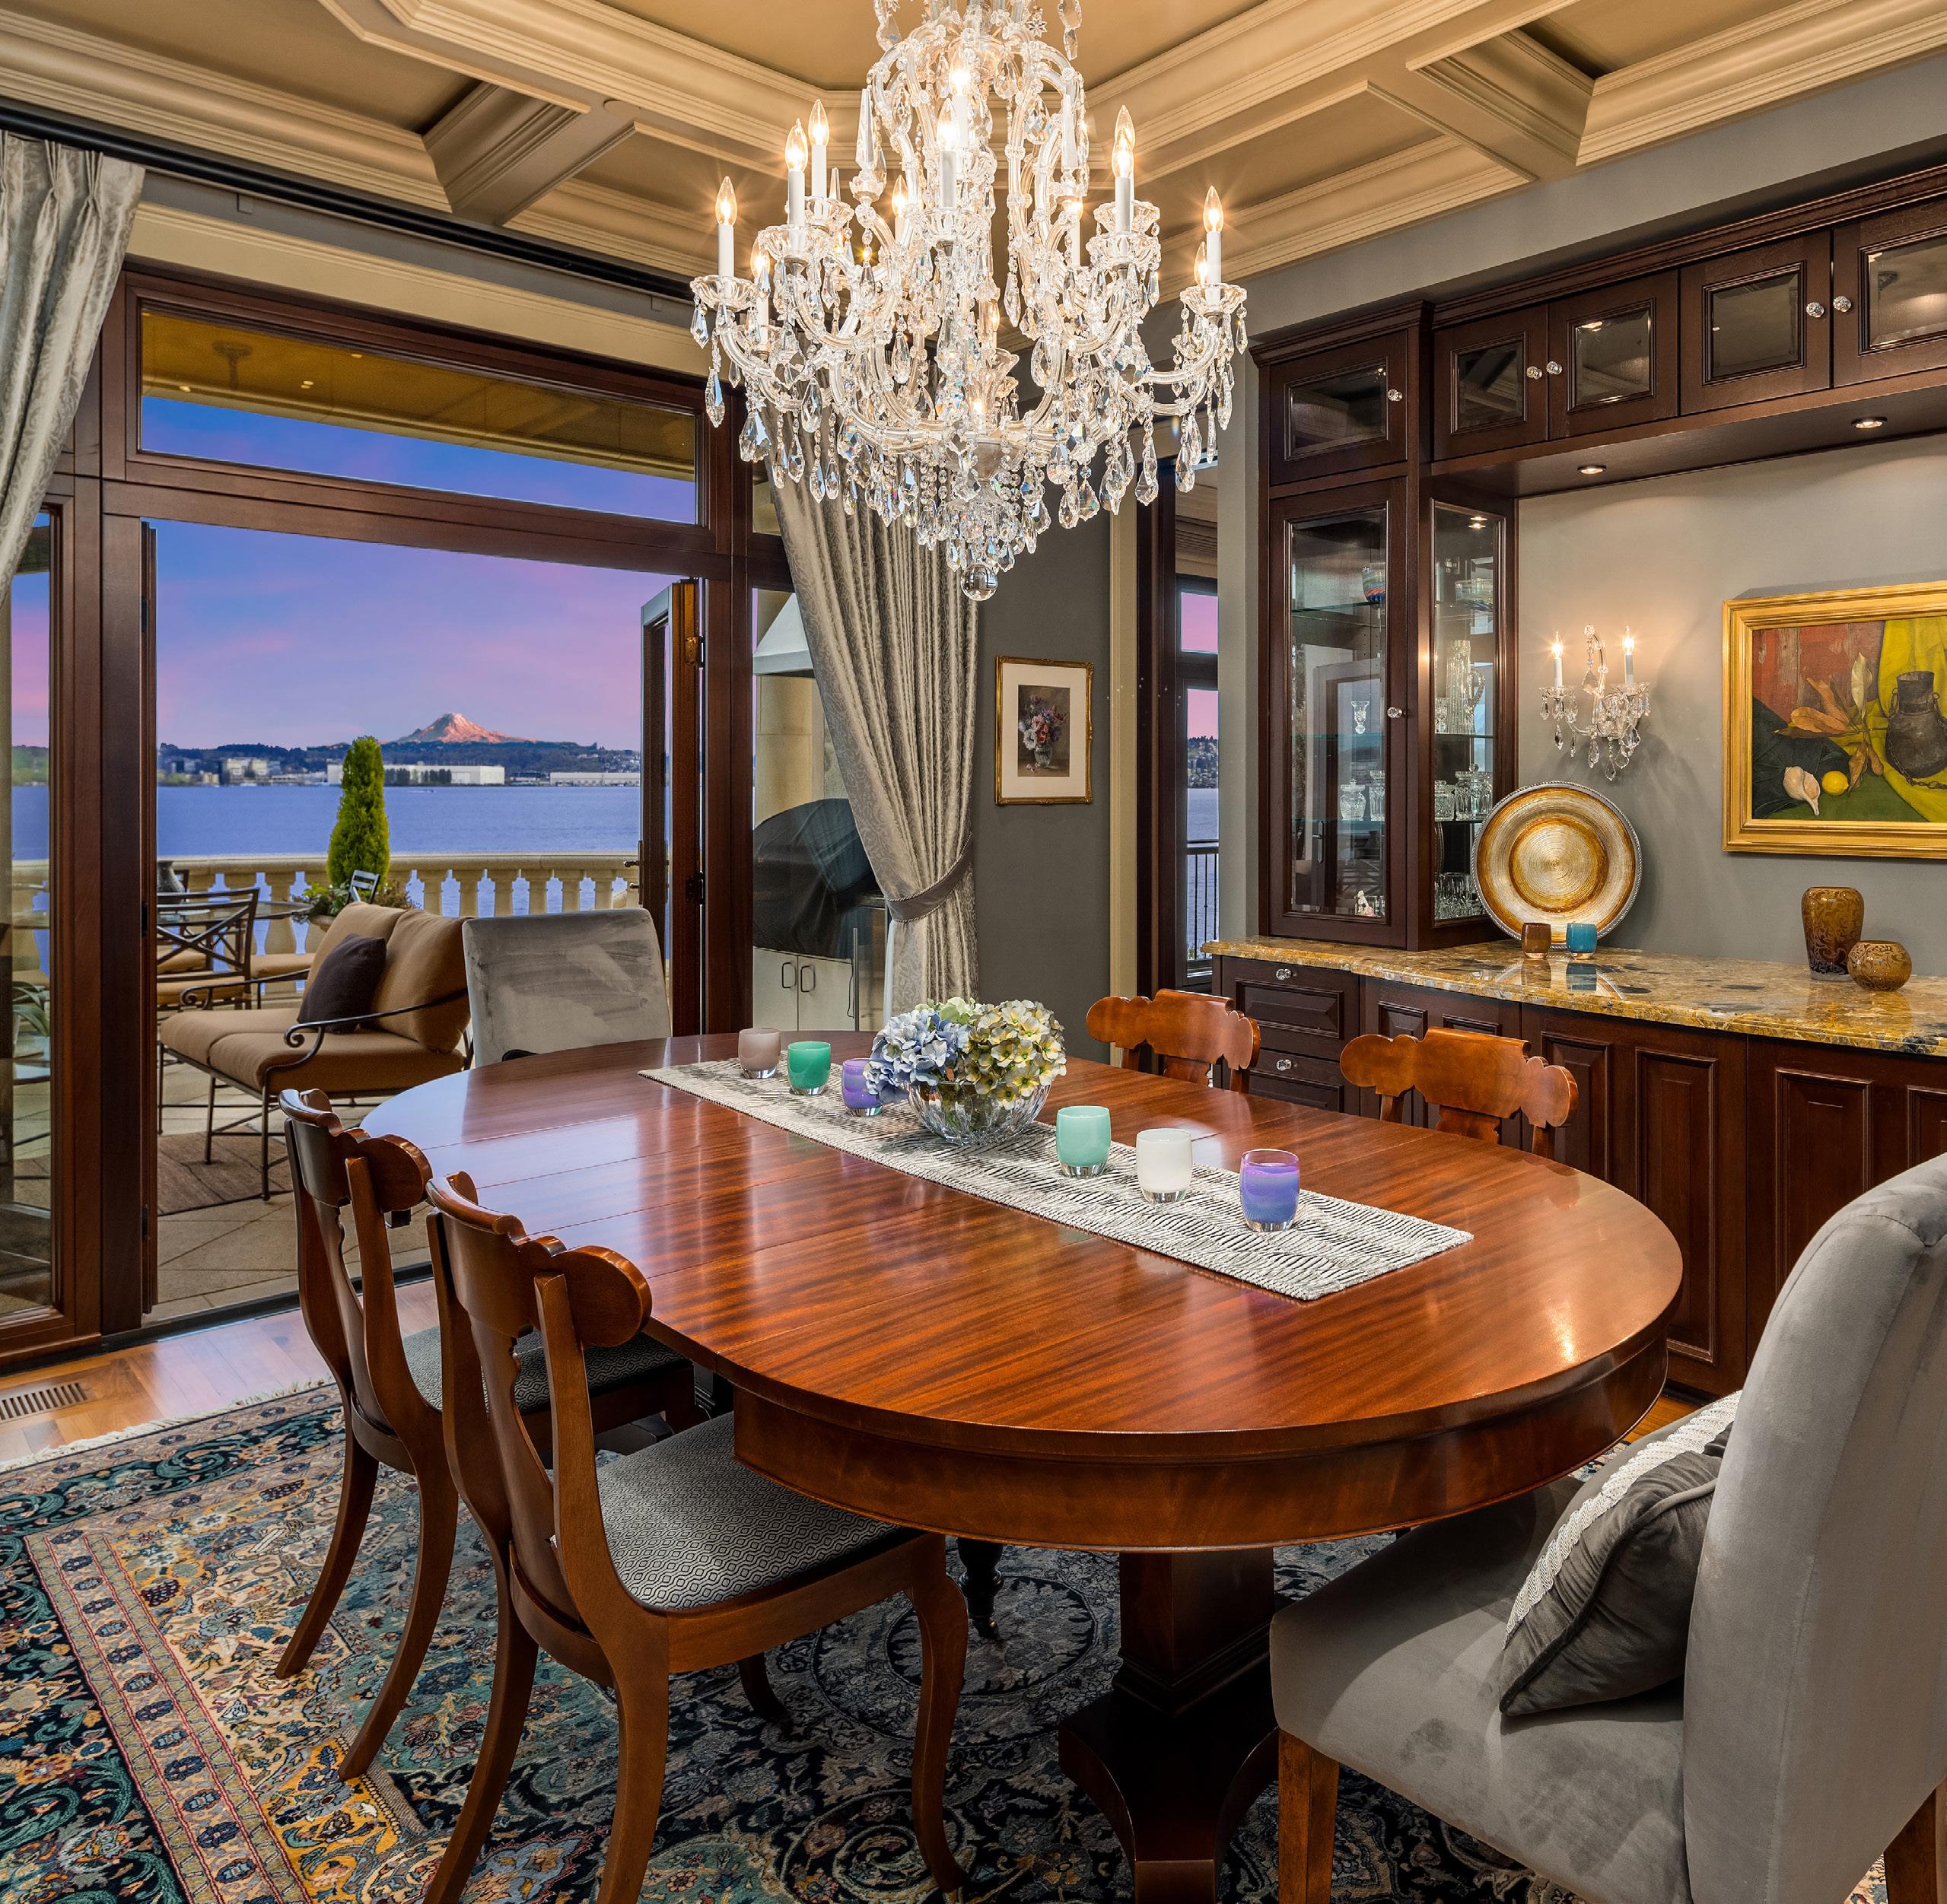
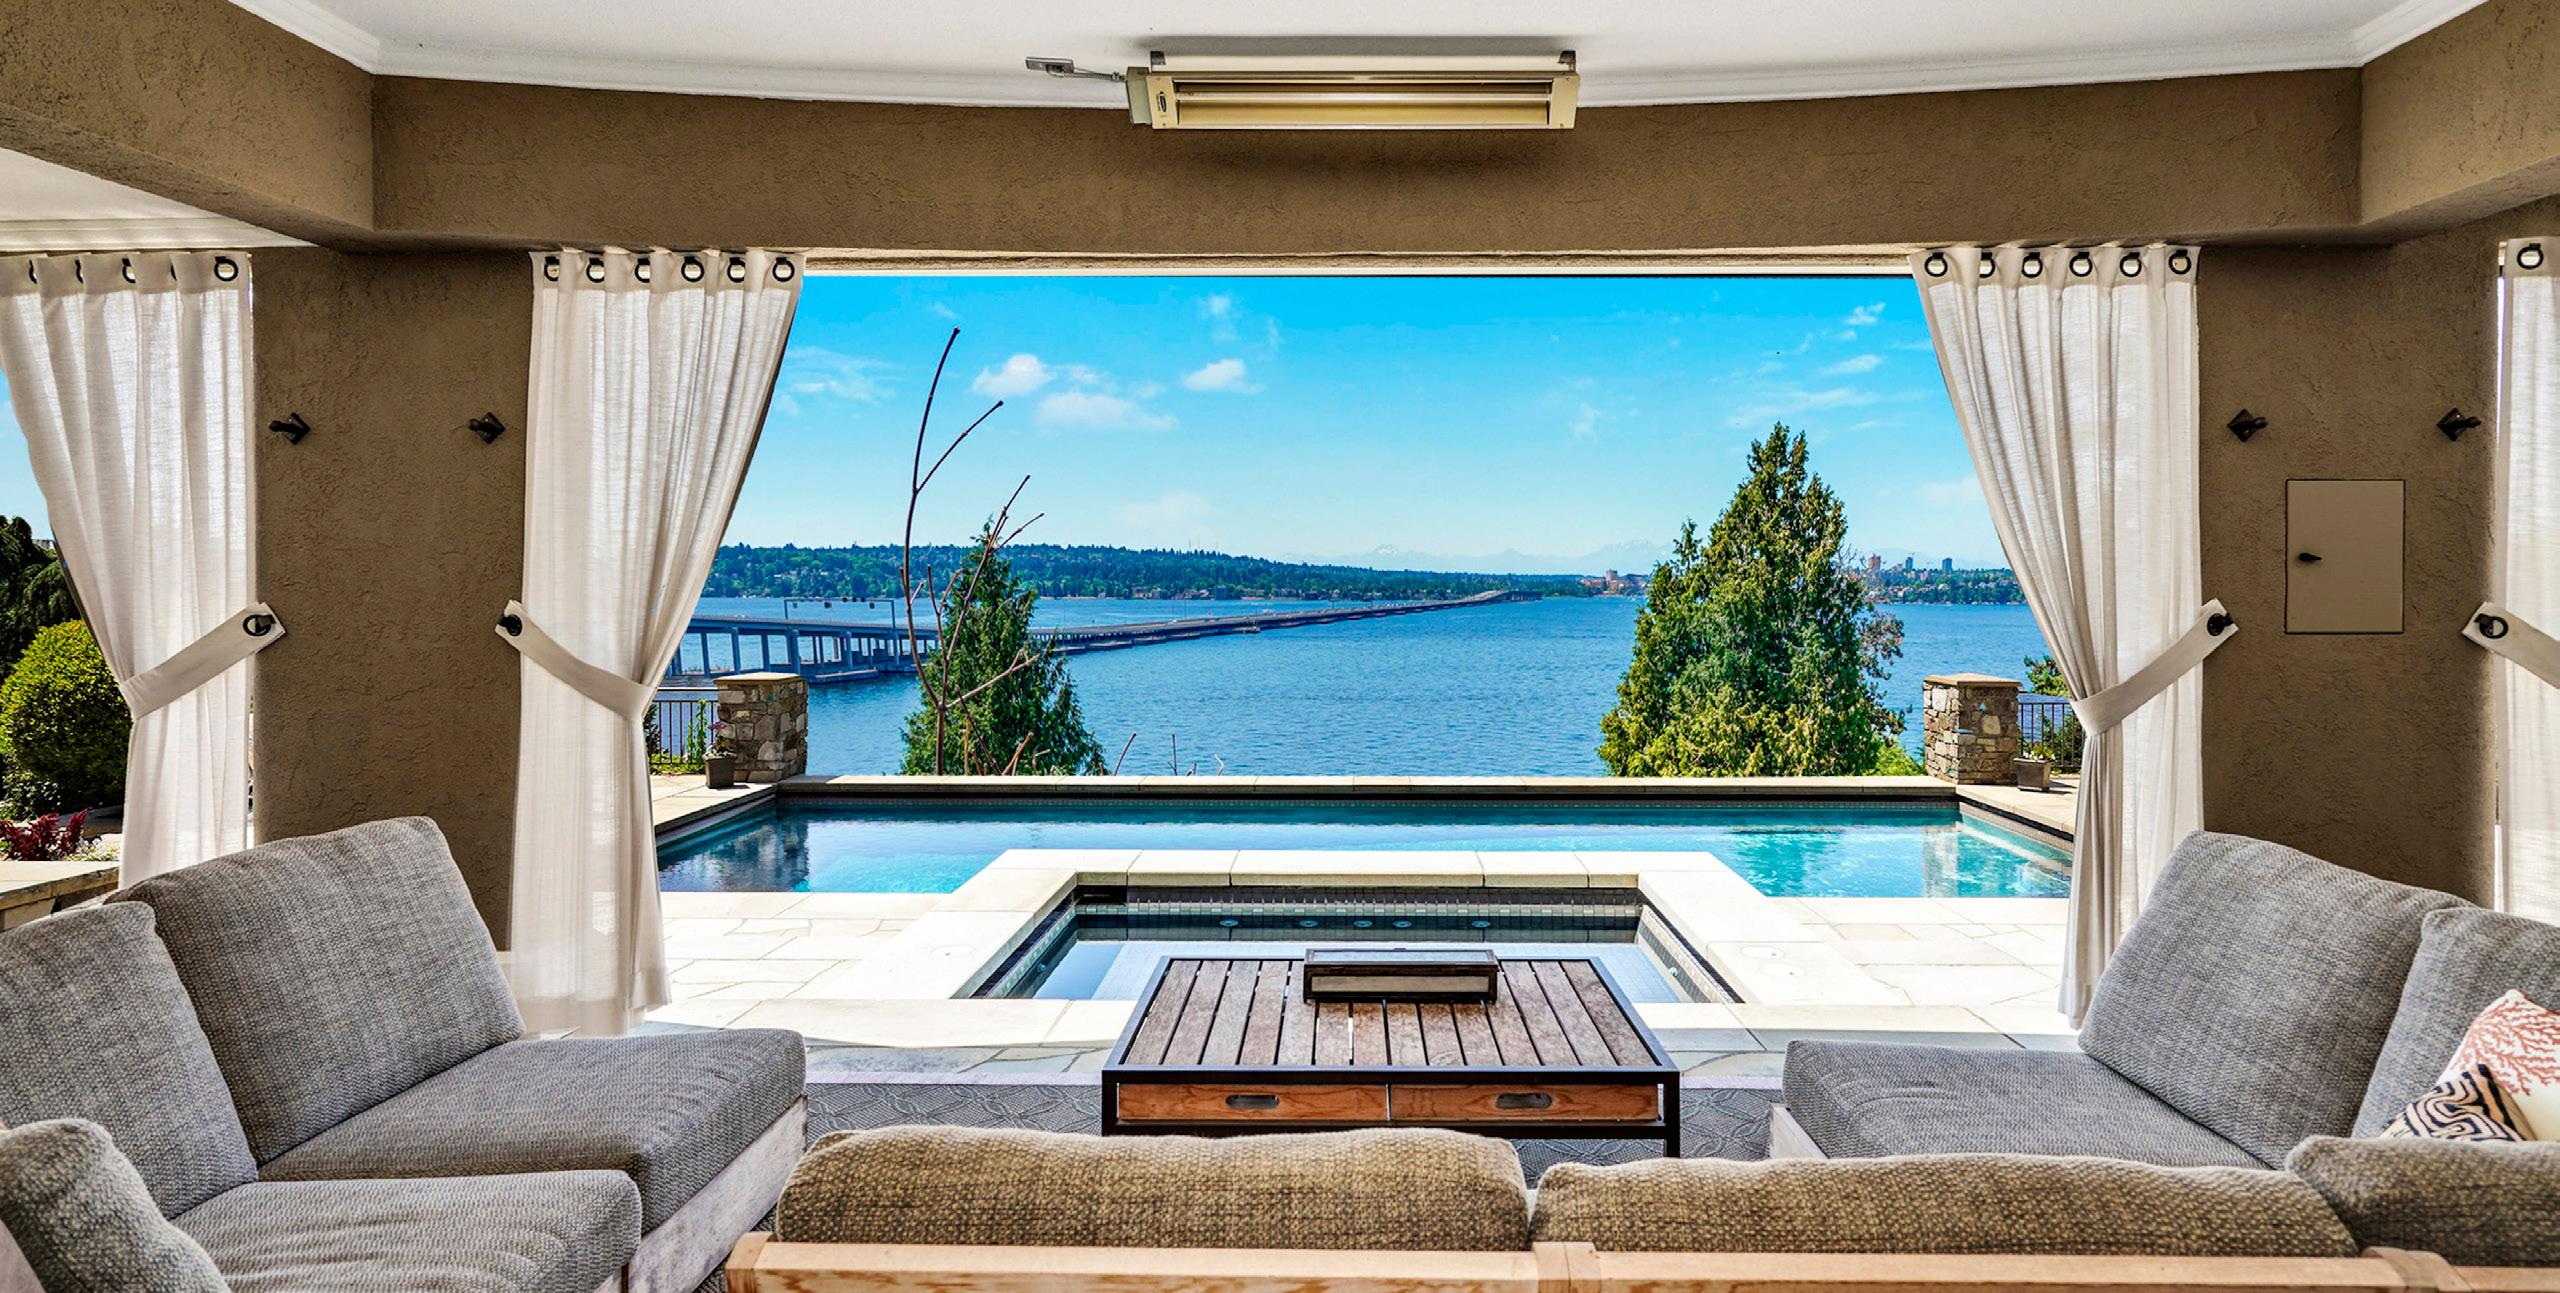
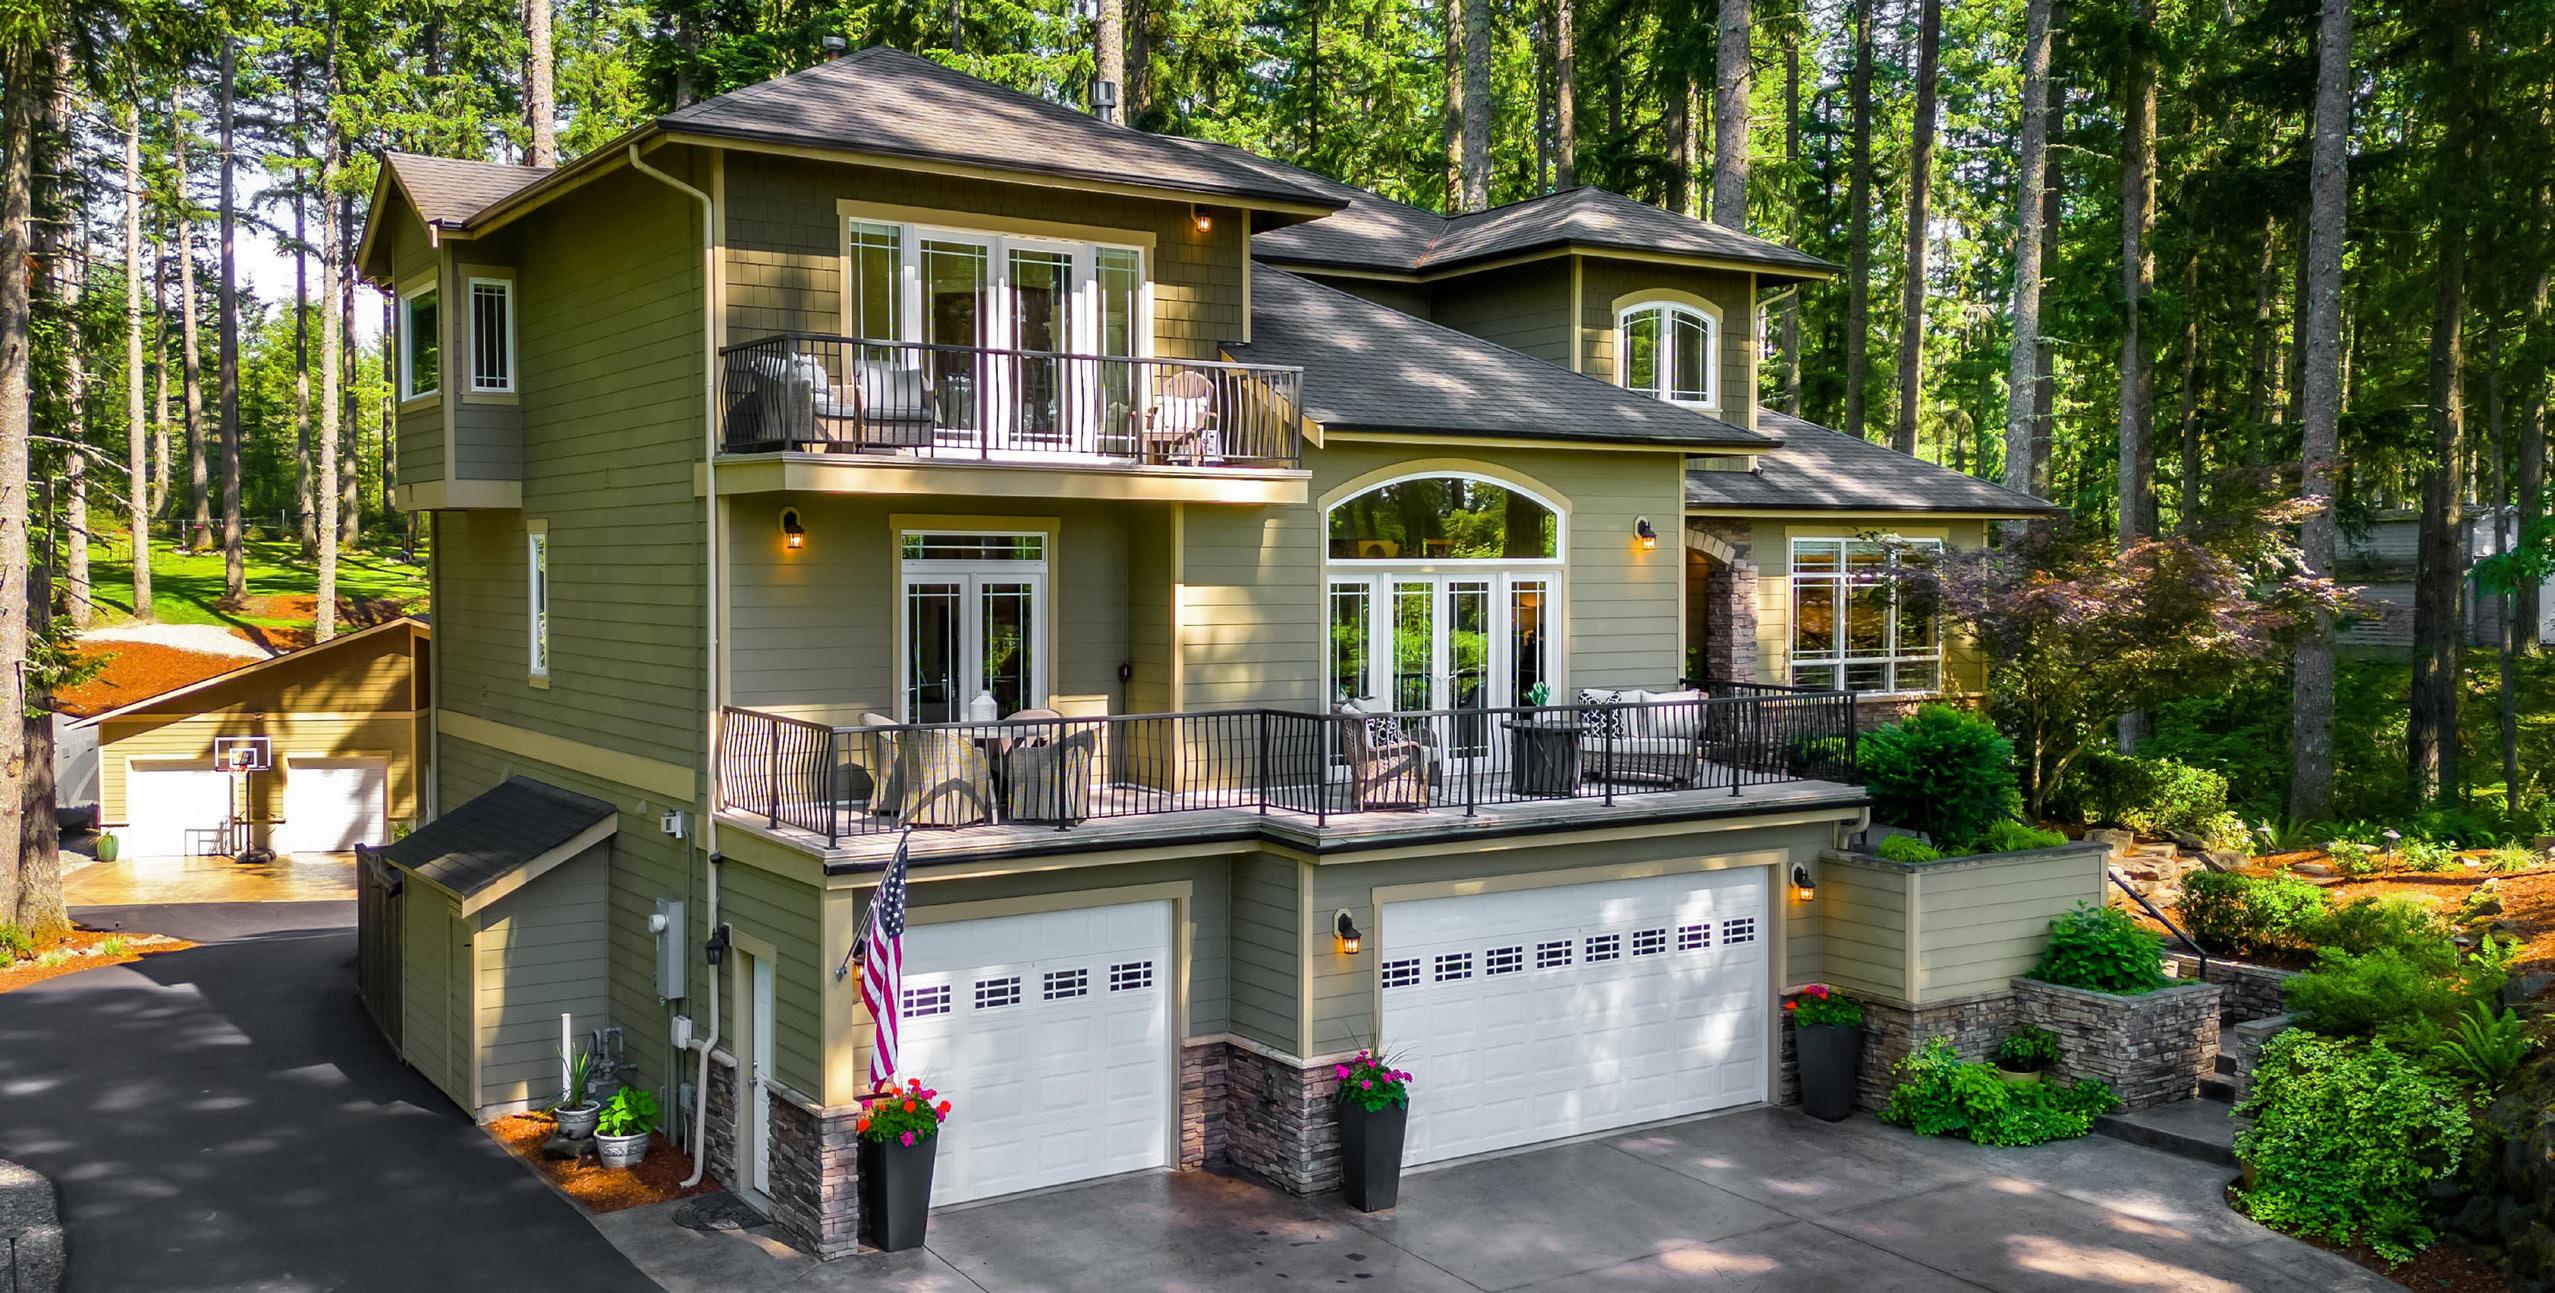
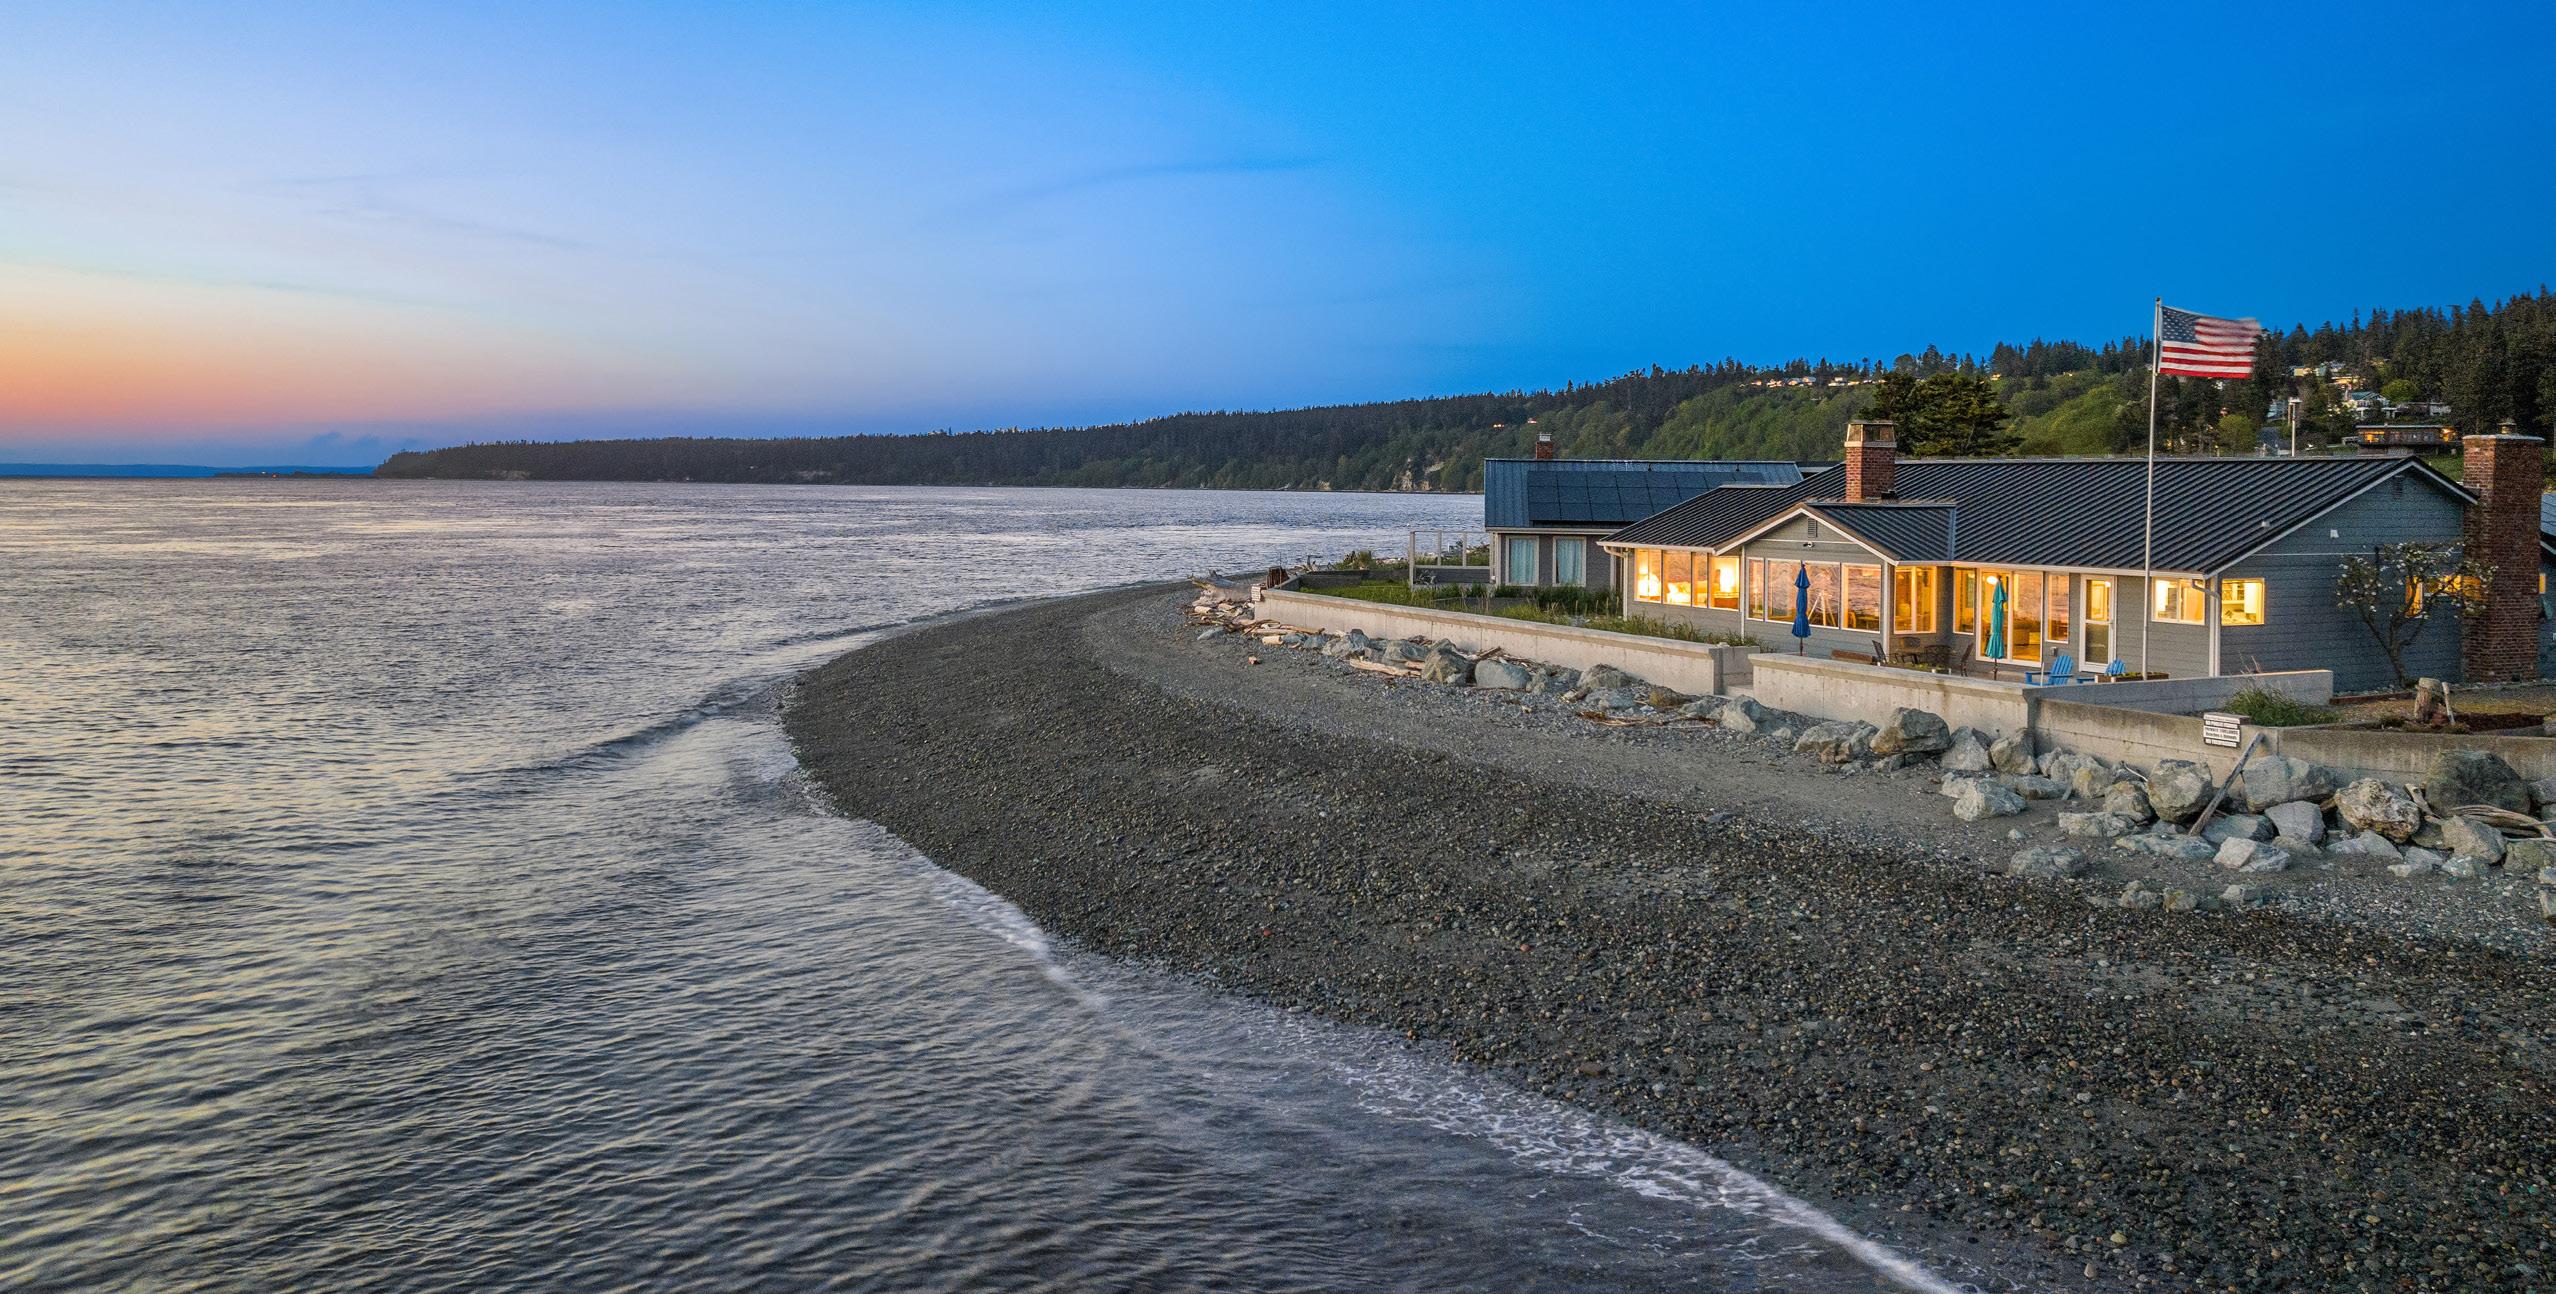
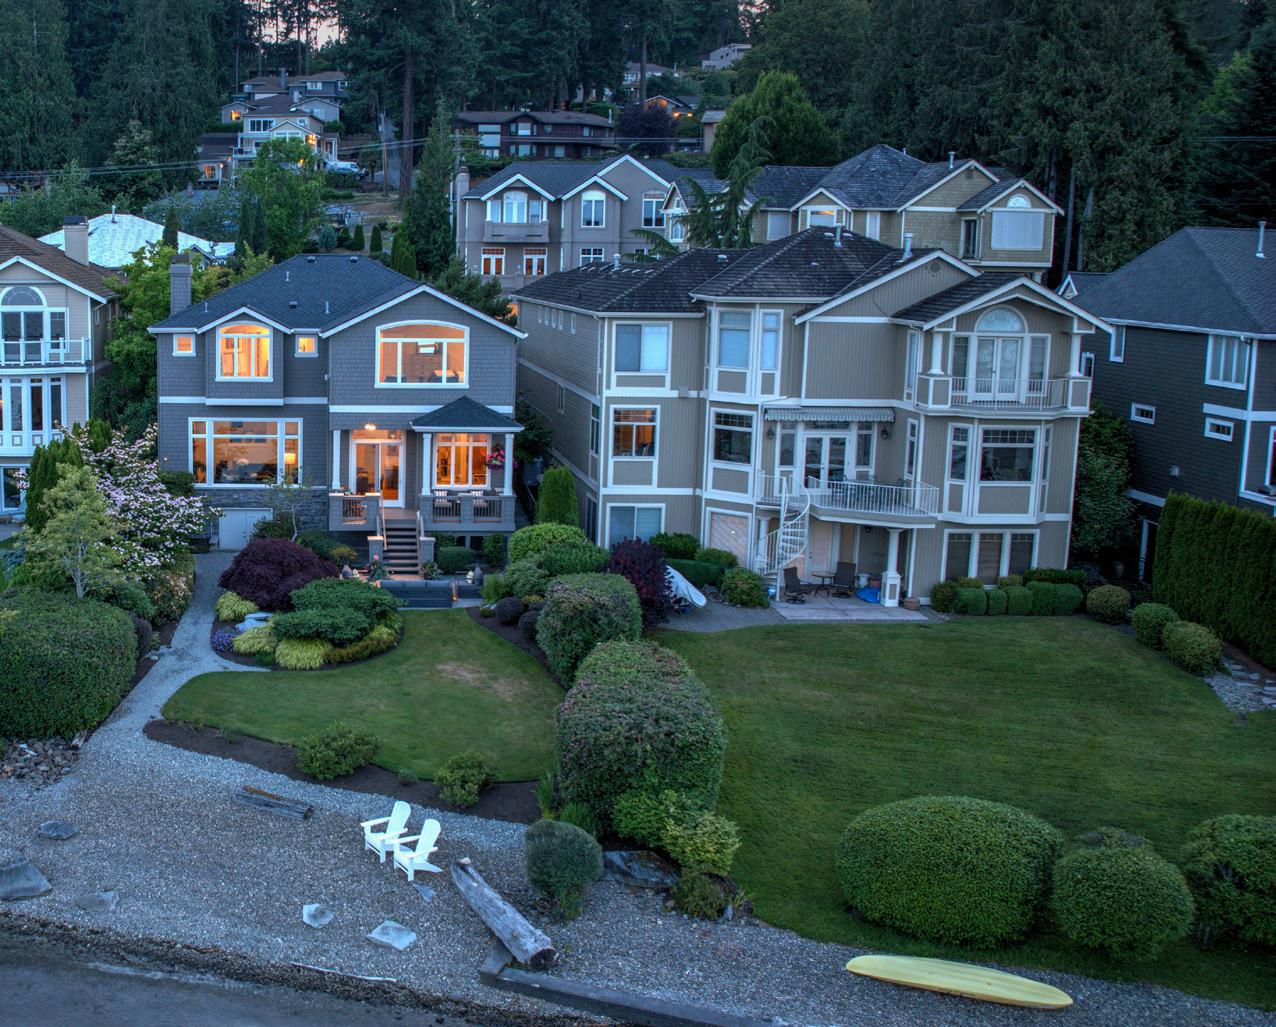
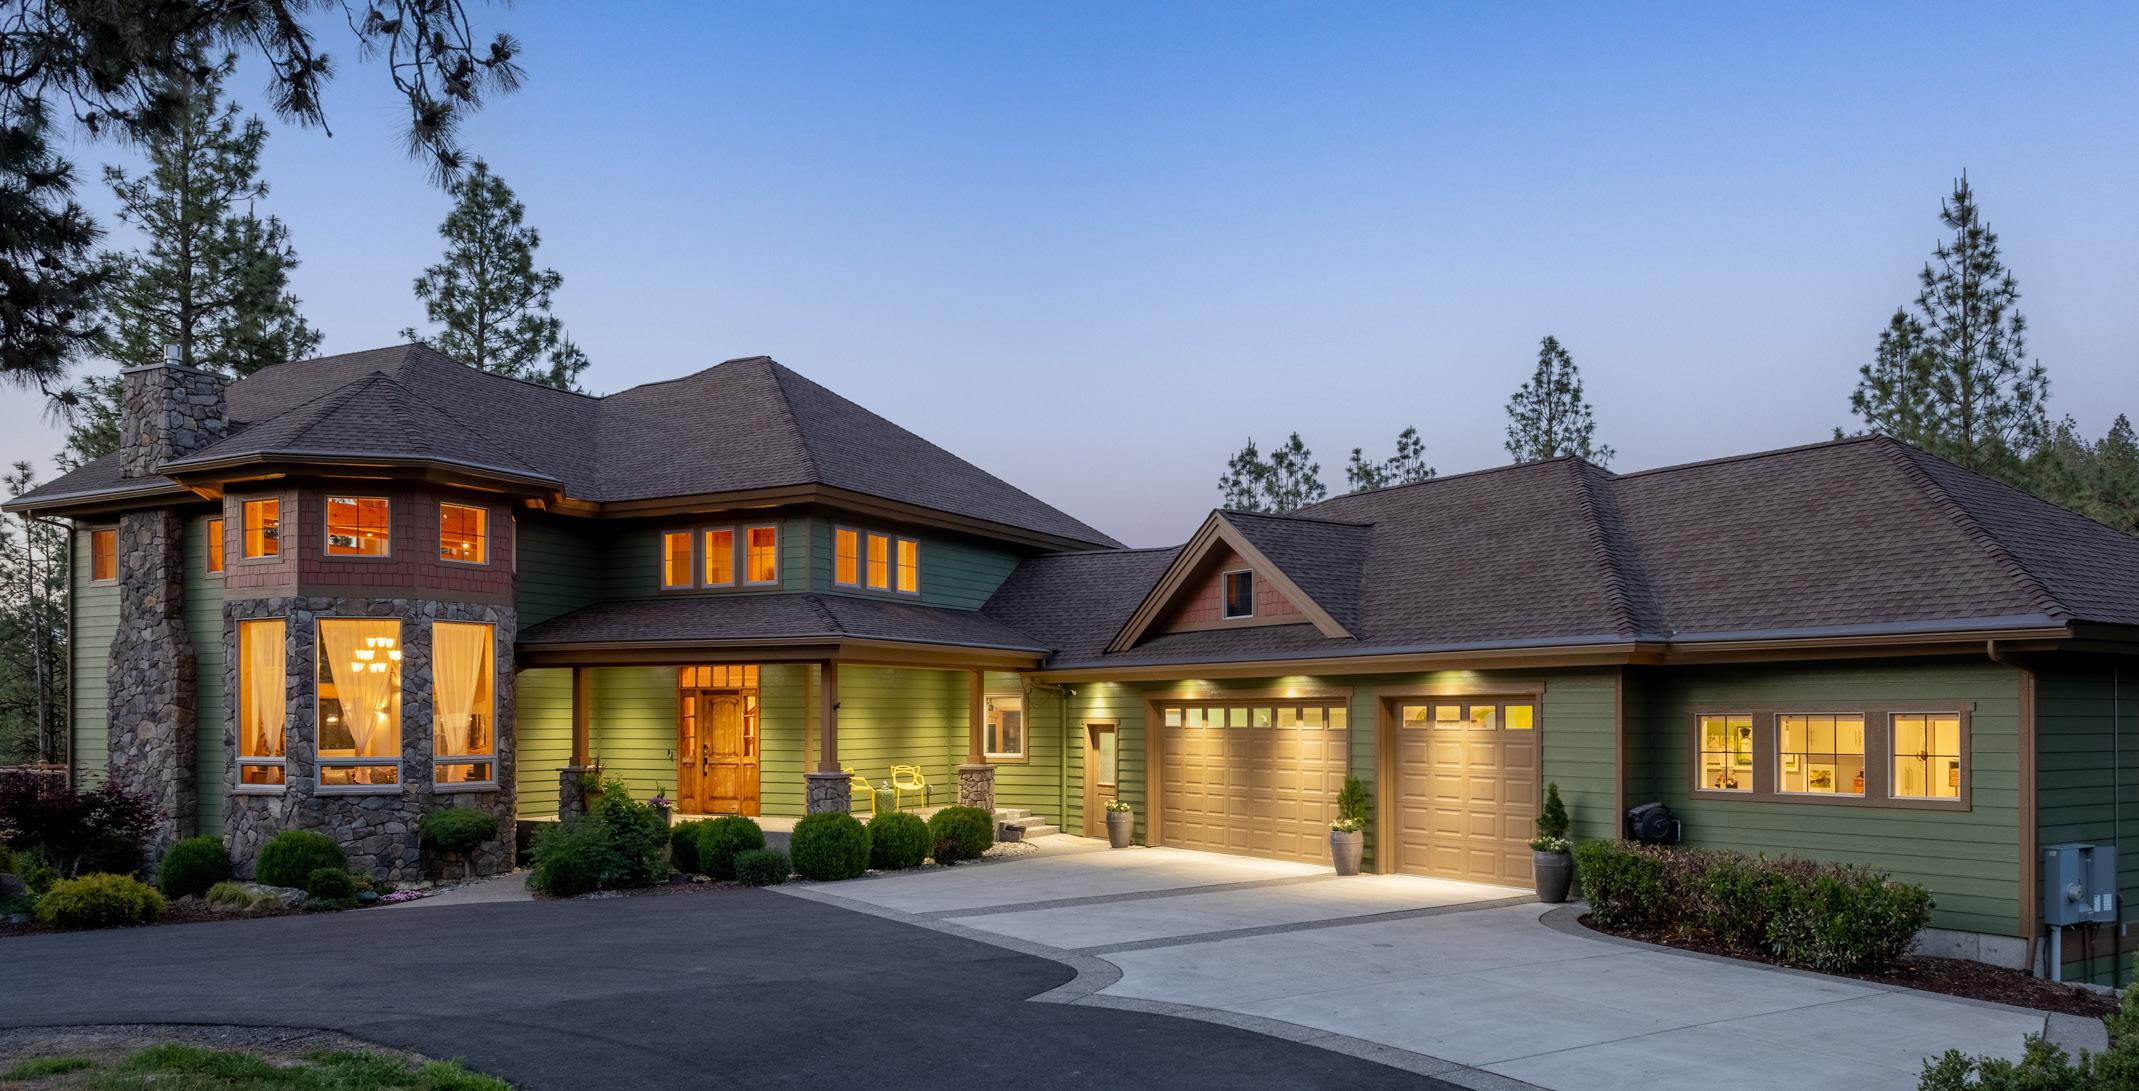
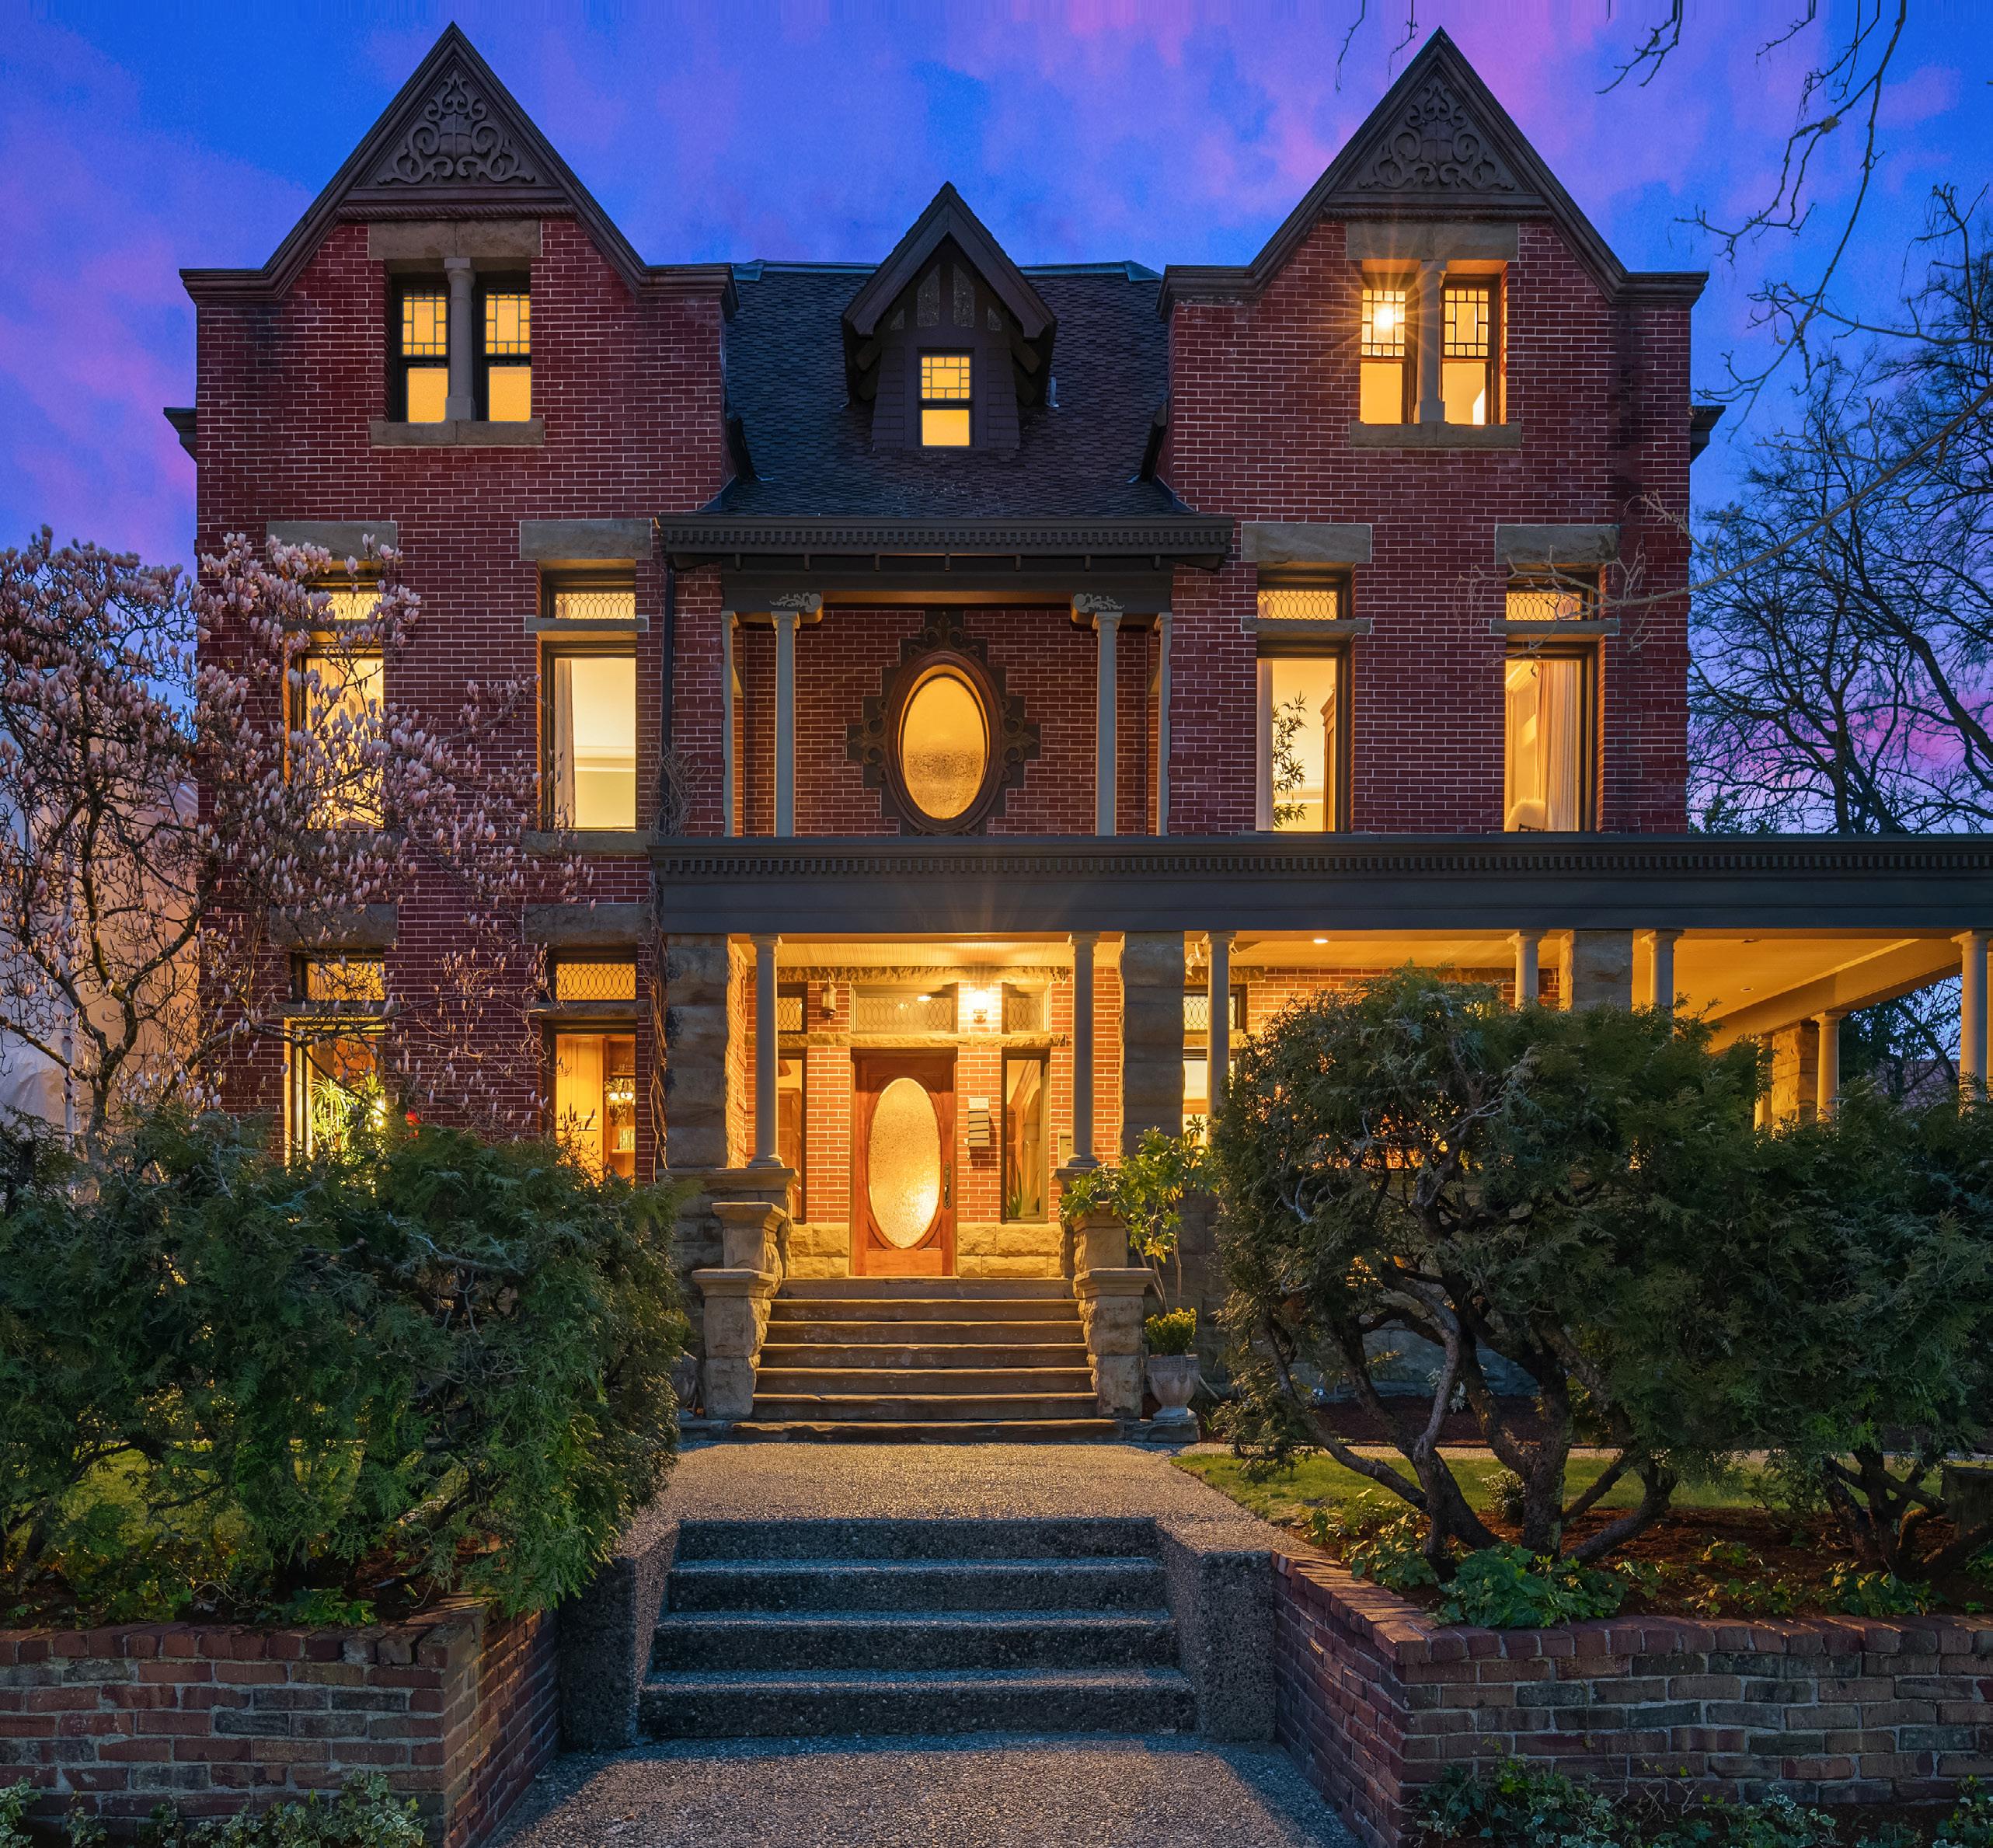
ON THE COVER: OFFERED AT $14,900,000 | JOHNLSCOTT.COM/73959
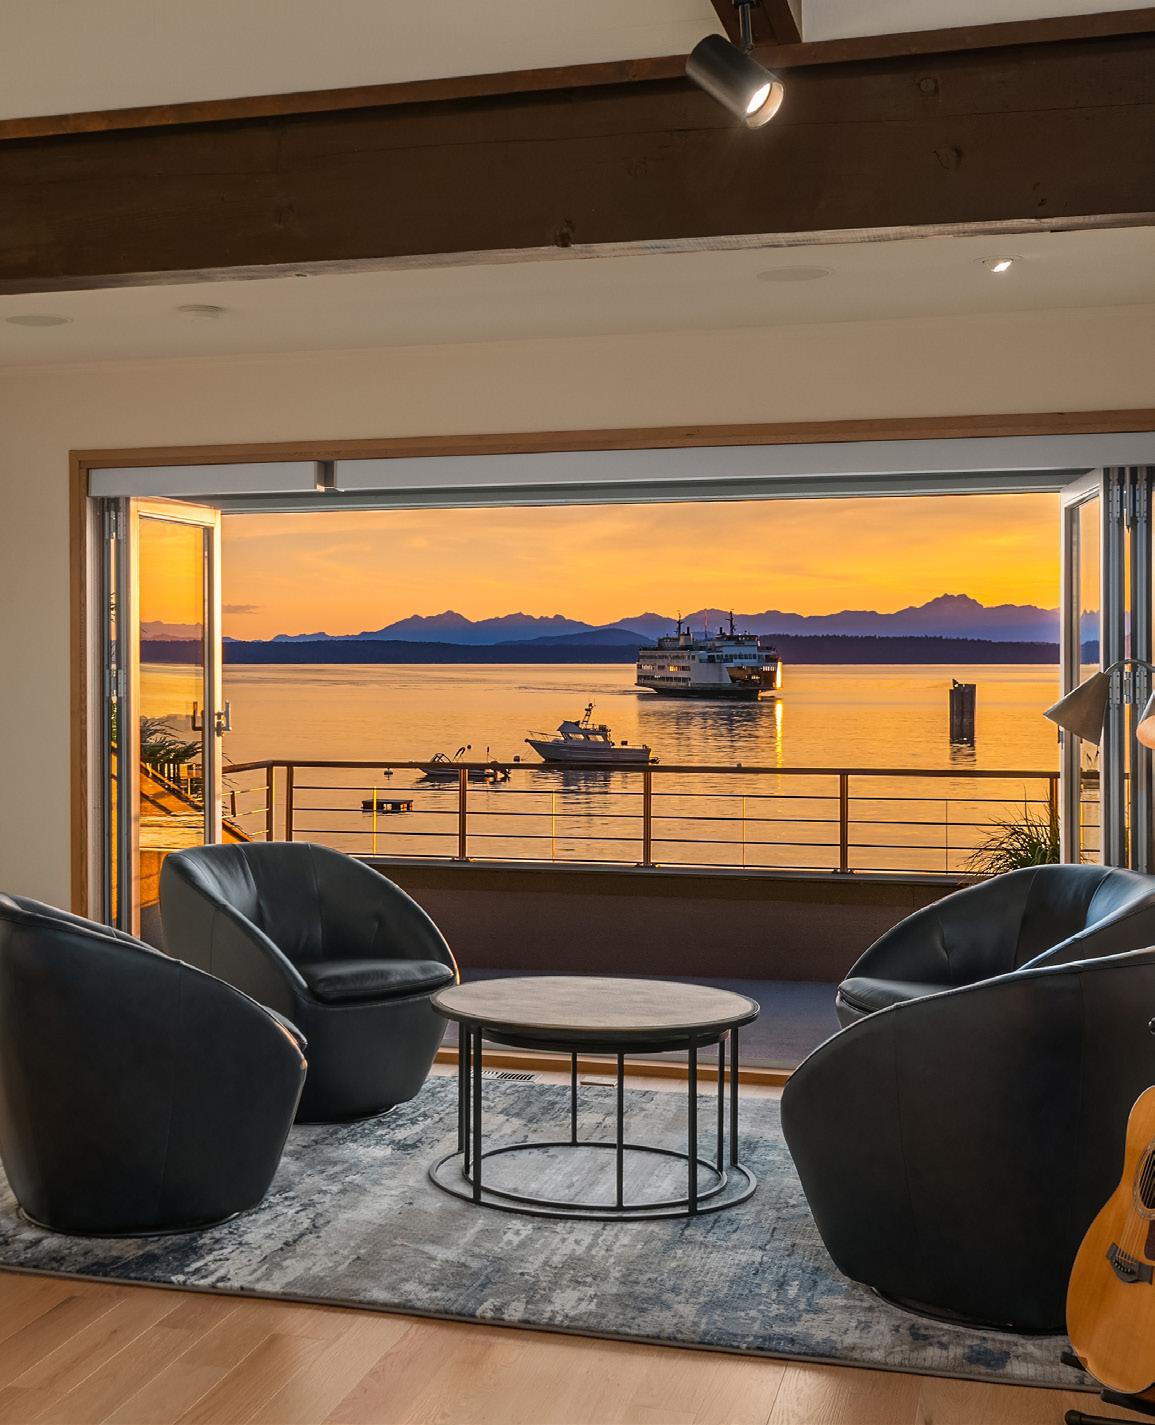
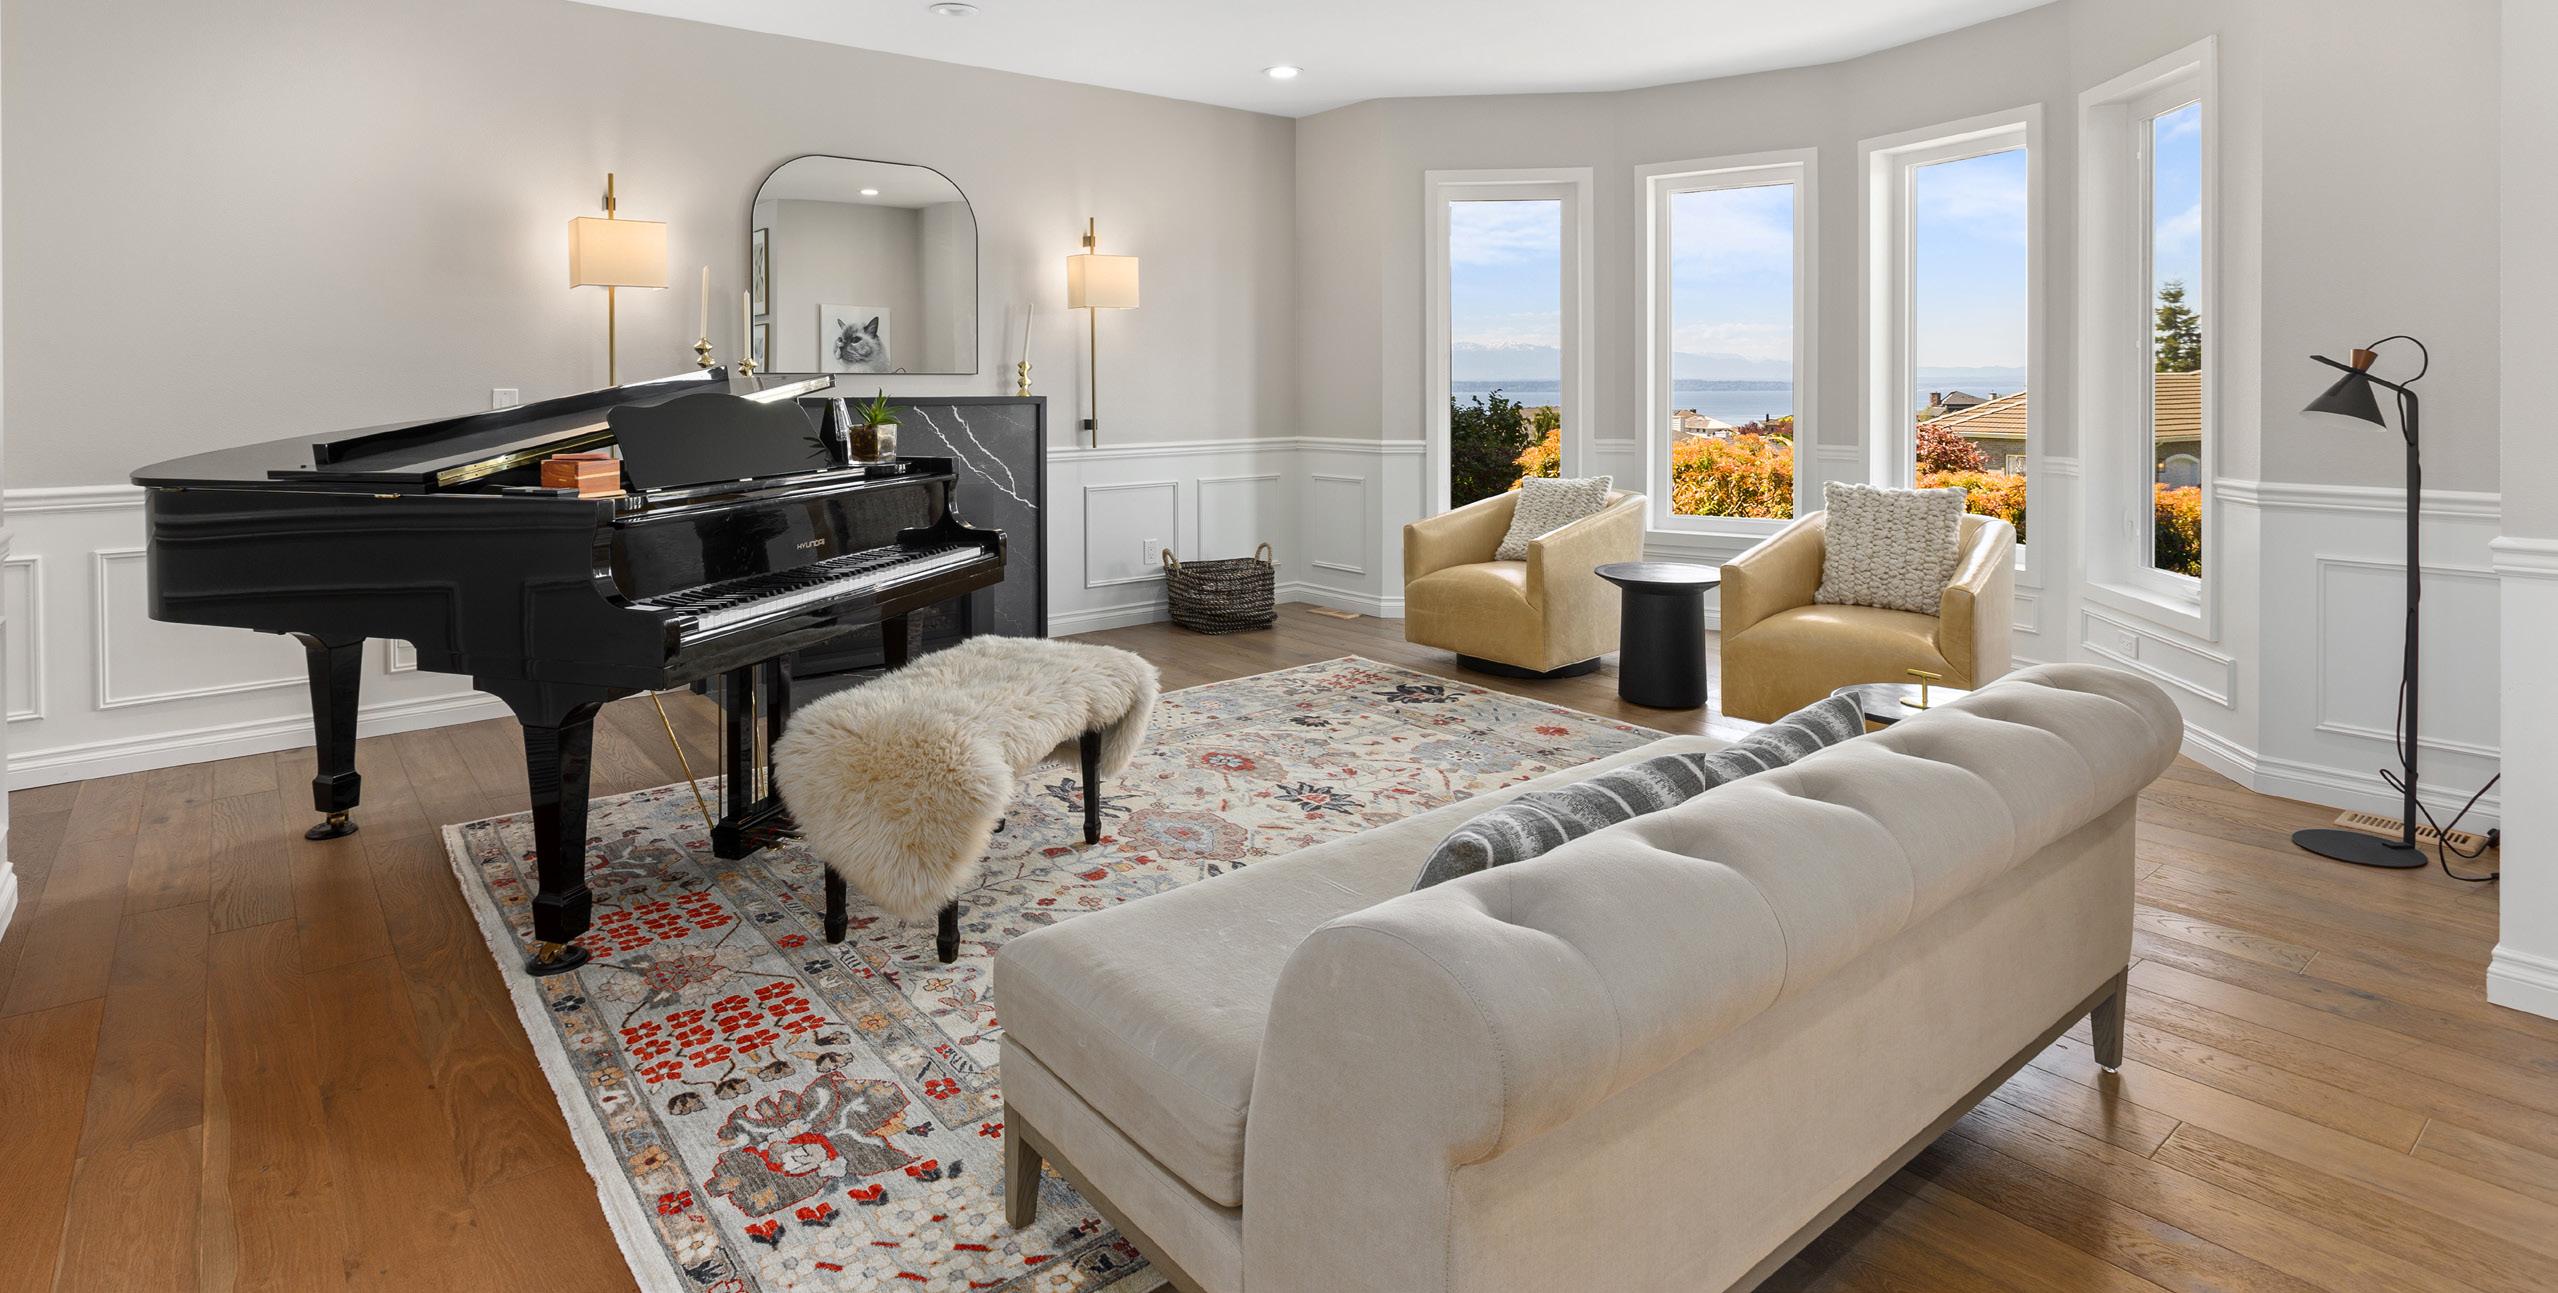
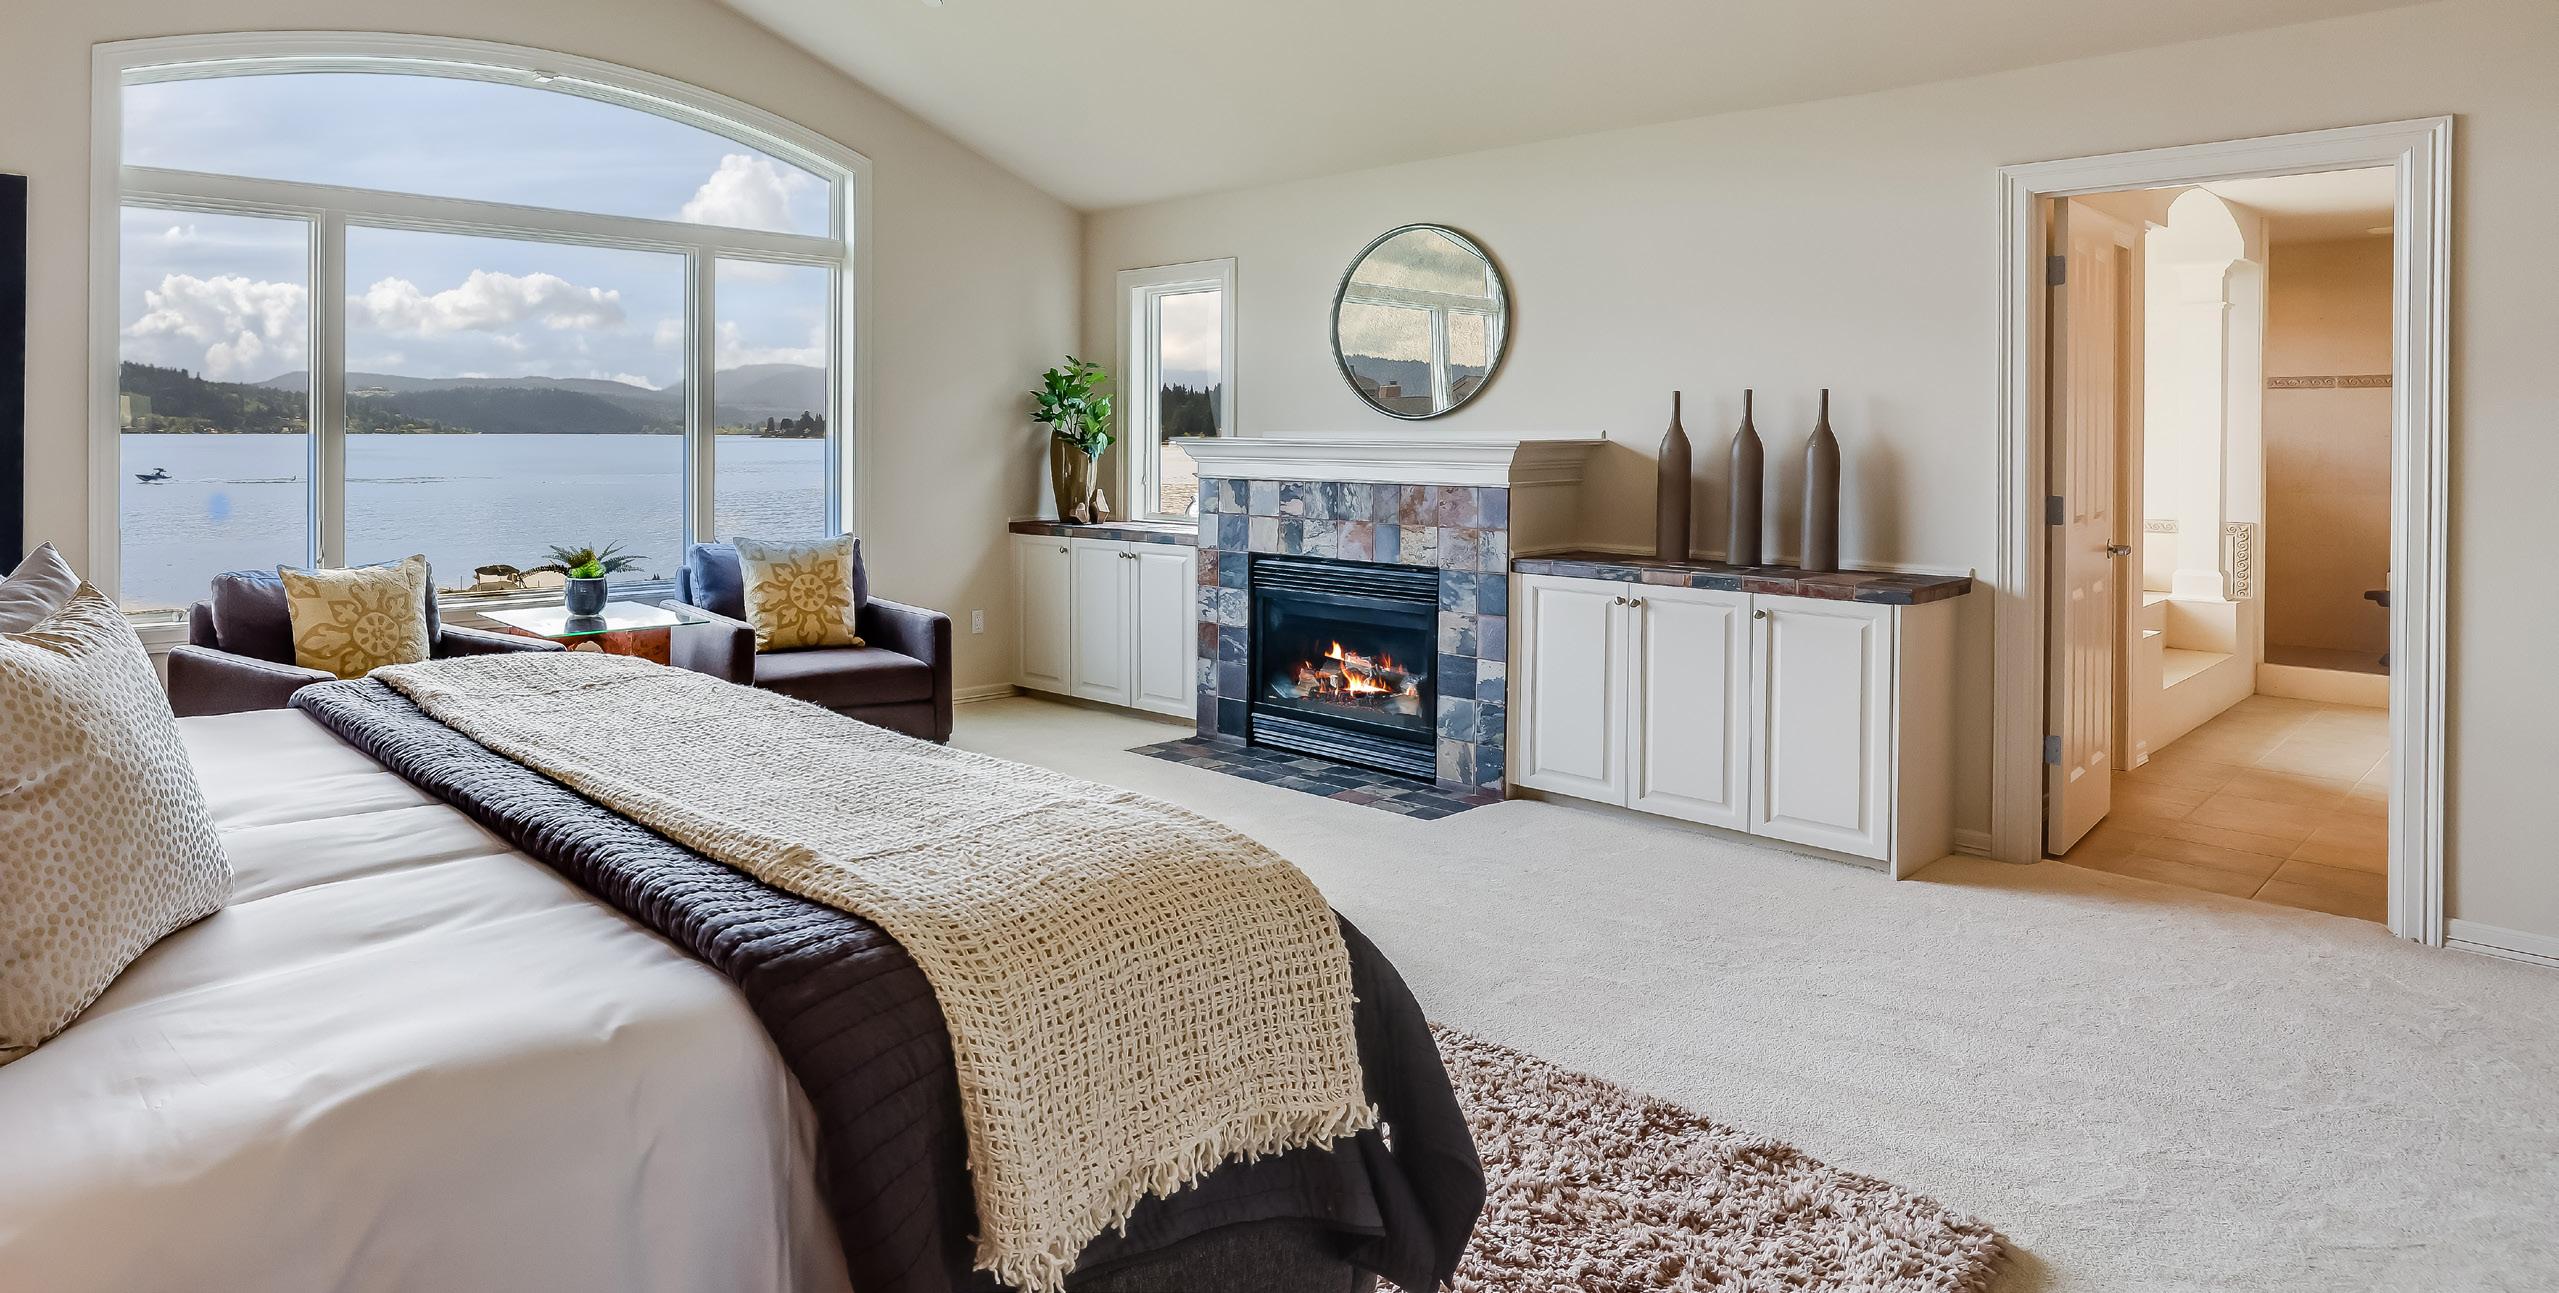
ON THE RIGHT: OFFERED AT $3,000,000 | JOHNLSCOTT.COM/49730
Luxury LIVE YOUR

WE ARE GLOBAL
John L. Scott is a founding member of the international organization Leading Real Estate Companies of the World®.
Founded in 1931, JLS operates over 100 offices with over 3,000 agents throughout WA, OR, ID & CA
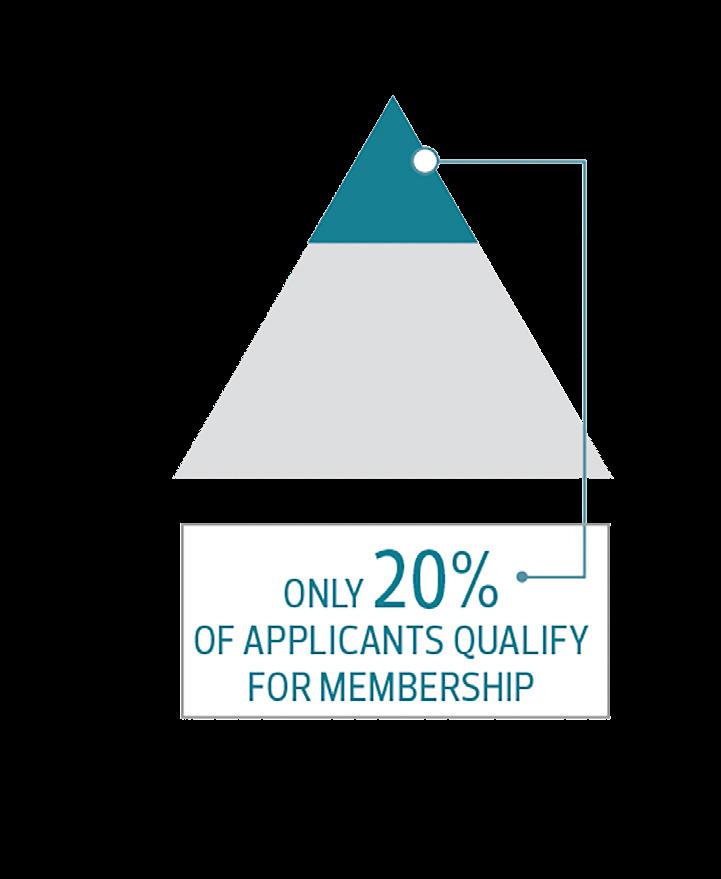
A global community of over 565 real estate companies awarded membership based on rigorous standards for service and performance

BY THE NUMBERS
550 Member Firms

80% of applicants to this network are turned down
John L. Scott’s luxury brand, providing our agents with tools and data to help each and every client live their luxury
The luxury division of LeadingRE & the largest global network of the most powerful, independent luxury firms

4,600 Offices Worldwide Total Inventory $58 BILLION

INDUSTRY-LEADING SALES.
Our invitation-only network was responsible for $353 billion in annual home sales volume among the top 500 U.S. real estate firms in 2022.
Volume shown in billions of dollars. For informational purposes only. In compiling this report, LeadingRE relies on third party sources. The information set forth in the chart above is sourced from the 2023 RealTrends 500, showcasing production for calendar year 2022, accessible via realtrends com. Neither LeadingRE nor its member companies are responsible for the accuracy of third-party data presented herein.
Average Property $2.6 MILLION
Associates Worldwide 6 Continents with Member Companies

130,000

2022 U S H O M E SALE S VO LU M E AM O N G TH E TO P 50 0 U S R E AL E STATE FI RM S $312 K E LL E R W I L LI A M S $353 L E A D IN G R E $124 S OT H E BY’ S I NT E R N ATI O NA L R E A LT Y $120 B E R K S H I R E H AT H AWAY HO M E S E RV I C E S $97 R E / M A X $24 CO R CO R A N $32 C E N T U RY 2 1 $21 U N IT E D R E A L E S TAT E $18 R E A LT Y O N E G R O U P $12 E R A $12 B E T T E R HO M E S A N D GA R D E N S HO M E S MA R T I NT E R N ATI O NA L $30 CO L DW E L L BA N K E R $233 NE T W O R K S , F R A N C H I S E S A N D C O M P A N IE S
JOHN L. SCOTT LUXURY SPECIALISTS SCHOLARS OF THE MARKET
Curious about luxury trends in your neighborhood? See what some of our real estate specialists had to say about the luxury market in their area.


The luxury market has been steady, but not as much inventory is on the market. I have been working to find off-market homes to show buyers. Sellers need more time to get their homes ready to list or will sell off-market if they are not rushed to find a new home. The market is still a sellers’ market going into the summer. This is caused by low inventory in many neighborhoods. If a home is clean, updated, and has professional landscaping, it sells fast because buyers don’t have the time to remodel and would pay more for a home that is move-in-ready. The high-end market has not been affected by high-interest rates because most are cash buyers that are moving funds around, borrowing from other accounts, or buying their new home and then moving and listing their current home.
Homes in the luxury market don’t seem to be affected much by interest rates. The majority of the buyers in this market are not first-time homeowners and know that they can refinance once the rates come down.

 LYNDA O’NEILL Lake Oswego, OR
CINDY THACKERY Beaverton Sunset Corridor, OR
LYNDA O’NEILL Lake Oswego, OR
CINDY THACKERY Beaverton Sunset Corridor, OR
Lake Oswego had two six-million-plus homes go into contract last week. Neither were underpriced, and both were in good condition and off-market. Buyers are still paying a premium at the high end for the opportunity to buy a home before it comes to market. Condition in the ultra-high end is more important than price right now.


WEISS
The luxury market for Q2 can best be described as house specific with some homes fetching multiple offers and premium pricing while others sit on the market for some time. Overall, between $2-3M we still have a shortage of listings with only 1.6 months of inventory at the end of Q2. At $3M+ there is a healthy selection of homes for buyers with inventory sitting at 5.4 months. Luxury lifestyle properties continue to be an opportunity as people will make a move for that “SPECIAL” lifestyle home. Challenges for the luxury market continue to be a shortage of inventory in the entry level luxury segment as well as economic headwinds such as volatility in the stock/ bond markets, rising rates for those financing a portion of their purchase, and continued uncertainty. I don’t believe rates are having a large impact on the luxury market; however, it does make the cost to borrow more expensive which takes some demand out of the market. We still have a nice percentage of CASH transactions in the market.

2023 Q2 LUXURY MARKET TRENDS
MARTIN
Sammamish, WA
AMY KANE
Lake Oswego, OR
PUGET SOUND

SECOND QUARTER HIGHLIGHTS
The luxury market of Seattle, while still competitive, has adjusted from the previous frenzy to allow buyers more time to find their next home. More active inventory combined with extended days on market is a great opportunity to explore what is available during the next few months while the weather is at it’s best, a luxury that hasn’t been available the past couple years.
2023 Q2 LUXURY MARKET TRENDS Q2 2023 Q2 2022 % Change Number of Sales 127 164 -22.5% Total Dollar Volume $372,048,278 $505,263,862 -26.3% Average Sales Price $2,929,514 $3,080,877 -4.9% Average Days On Market 26 16 60.7% Sold / List Price % 98.4% 104.4% -5.6% Average Price per SQFT $770 $793 -2.9% Quarter-end inventory 144 87 65.5%
SEATTLE
The data is for single family residences over $2M in MLS areas 140, 380, 385 390, 700, 701, 705, 710. Some John L. Scott offices are independently owned and operated. All reports presented are based on data supplied by the NWMLS, RMLS, Spokane MLS, and Central Oregon MLS. Neither the Associations nor the MLS guarantees or is in anyway responsible for its accuracy. Data maintained by the Associations or the MLS may not reflect all real estate activities in the market. Information deemed reliable but not guaranteed. OFFERED AT $3,200,000 | JOHNLSCOTT.COM /85693
OFFERED AT $6,750,000 | JOHNLSCOTT.COM/16782
WEST BELLEVUE
In the second quarter of 2023 the West Bellevue market mirrored pre-pandemic levels of activity. Active listings are now heading upward following the traditional patterns we see in the summer months as buyers are dispersed across more available inventory.

Q2 2023 Q2 2022 % Change Number of Sales 58 76 -23.6% Total Dollar Volume $238,819,387 $357,484,633 -33.1% Average Sales Price $4,117,576 $4,703,745 -12.4% Average Days On Market 33 9 252.2% Sold / List Price % 95.9% 101.0% -5.0% Average Price per SQFT $1,033 $1,190 -13.1% Quarter-end inventory 59 45 31.1%
The data is for single family residences over $2M in MLS area 520. Some John L. Scott offices are independently owned and operated. All reports presented are based on data supplied by the NWMLS, RMLS, Spokane MLS, and the Central Oregon MLS. Neither the Associations nor the MLS guarantees or is in anyway responsible for its accuracy. Data maintained by the Associations or the MLS may not reflect all real estate activities in the market. Information deemed reliable but not guaranteed.
MERCER ISLAND
Mercer Island’s luxury market has faced a scarcity of inventory for the last two years, which created fierce competition for each new listing. While there is still a shortage of available homes for sale up to $3M, we’re also seeing more new listings coming on the market and a greater selection for buyers.
2023 Q2 LUXURY MARKET TRENDS
Q2 2023 Q2 2022 % Change Number of Sales 48 60 -20.0% Total Dollar Volume $146,762,608 $201,465,800 -27.1% Average Sales Price $3,057,554 $3,357,763 -8.9% Average Days On Market 24 7 228.2% Sold / List Price % 97.8% 105.6% -7.3% Average Price per SQFT $807 $870 -7.2% Quarter-end inventory 27 25 8.0% PENDING | JOHNLSCOTT.COM/61123
The data is for single family residences over $2M in MLS area 510. Some John L. Scott offices are independently owned and operated. All reports presented are based on data supplied by the NWMLS, RMLS, Spokane MLS, and the Central Oregon MLS. Neither the Associations nor the MLS guarantees or is in anyway responsible for its accuracy. Data maintained by the Associations or the MLS may not reflect all real estate activities in the market. Information deemed reliable but not guaranteed.
OFFERED AT $2,100,000 | JOHNLSCOTT.COM/15286
EASTSIDE
Q2 2023 Q2 2022 % Change Number of Sales 337 543 -37.9% Total Dollar Volume $1,003,186,911 $1,716,255,342 -41.5% Average Sales Price $2,976,816 $3,160,691 -5.8% Average Days On Market 28 9 219.7% Sold / List Price % 97.2% 102.8% -5.4% Average Price per SQFT $746 $804 -7.1% Quarter-end inventory 311 312 -0.3% The data is for single family residences over $2M in MLS areas 500, 510, 520, 530, 540, 550, 560, 600. Some John L. Scott offices are independently owned and operated. All reports presented are based on data supplied by the NWMLS, RMLS, Spokane MLS, and the Central Oregon MLS. Neither the Associations nor the MLS guarantees or is in anyway responsible for its accuracy. Data maintained by the Associations or the MLS may not reflect all real estate activities in the market. Information deemed reliable but not guaranteed. 219.7% DAYS ON MARKET -5.8% AVERAGE SALES PRICE
2023 Q2 LUXURY MARKET TRENDS KING COUNTY CONDO OFFERED AT $1,895,000 | JOHNLSCOTT.COM/13172 Q2 2023 Q2 2022 % Change Number of Sales 19 35 -45.7% Total Dollar Volume $57,839,688 $107,126,000 -46.0% Average Sales Price $3,044,194 $3,060,743 -0.5% Average Days On Market 38 82 -53.5% Sold / List Price % 96.7% 97.2% -0.6% Average Price per SQFT $1,346 $1,242 8.3% Quarter-end inventory 56 44 27.2% The data is for condominiums over $2M in King County. Some John L. Scott offices are independently owned and operated. All reports presented are based on data supplied by the NWMLS, RMLS, Spokane MLS, and the Central Oregon MLS. Neither the Associations nor the MLS guarantees or is in anyway responsible for its accuracy. Data maintained by the Associations or the MLS may not reflect all real estate activities in the market. Information deemed reliable but not guaranteed. -0.5% AVERAGE SALES PRICE -45.7% NUMBER OF SALES
SOUTH KING COUNTY
The data is for single family residences over $1M in MLS areas 100, 110, 120, 130, 140, 300, 310, 320, 330, 340, 350, 360. Some John L. Scott offices are independently owned and operated. All reports presented are based on data supplied by the NWMLS, RMLS, Spokane MLS, and Central Oregon MLS. Neither the Associations nor the MLS guarantees or is in anyway responsible for its accuracy. Data maintained by the Associations or the MLS may not reflect all real estate activities in the market. Information deemed reliable but not guaranteed. Q2 2023 Q2 2022 % Change Number of Sales 164 316 -48.1% Total Dollar Volume $232,353,744 $442,671,558 -47.5% Average Sales Price $1,416,791 $1,400,859 1.1% Average Days On Market 41 17 134.6% Sold / List Price % 100.0% 104.0% -3.8% Average Price per SQFT $415 $407 2.0% Quarter-end inventory 173 185 -6.4% OFFERED AT $1,750,000 | JOHNLSCOTT.COM/57611
IN Q2, WE SAW A 1.1% INCREASE IN THE AVERAGE SALES PRICE FOR SOUTH KING COUNTY
2023 Q2 LUXURY MARKET TRENDS Q2 2023 Q2 2022 % Change Number of Sales 158 251 -37.0% Total Dollar Volume $226,091,695 $374,483,390 -39.6% Average Sales Price $1,430,960 $1,491,966 -4.0% Average Days On Market 44 23 90.0% Sold / List Price % 98.3% 101.6% -3.1% Average Price per SQFT $386 $412 -6.1% Quarter-end inventory 228 180 26.6%
The data is for single family residences over $1M in Pierce County. Some John L. Scott offices are independently owned and operated. All reports presented are based on data supplied by the NWMLS, RMLS, Spokane MLS, and the Central Oregon MLS. Neither the Associations nor the MLS guarantees or is in anyway responsible for its accuracy. Data maintained by the Associations or the MLS may not reflect all real estate activities in the market. Information deemed reliable but not guaranteed. THE AVERAGE DAYS ON MARKET INCREASED BY 90.0% IN Q2 IN PIERCE COUNTY OFFERED AT $1,900,000 | JOHNLSCOTT.COM/56429
PIERCE COUNTY
KITSAP COUNTY
OVERALL, THE AVERAGE PRICE PER SQUARE FOOT DECREASED 4.9% IN KITSAP COUNTY
The data is for single family residences over $1M in Kitsap County. Some John L. Scott offices are independently owned and operated. All reports presented are based on data supplied by the NWMLS, RMLS, Spokane MLS, and Central Oregon MLS. Neither the Associations nor the MLS guarantees or is in anyway responsible for its accuracy. Data maintained by the Associations or the MLS may not reflect all real estate activities in the market. Information deemed reliable but not guaranteed. Q2 2023 Q2 2022 % Change Number of Sales 111 134 -17.1% Total Dollar Volume $200,146,089 $251,344,042 -20.3% Average Sales Price $1,803,118 $1,875,702 -3.8% Average Days On Market 26 18 43.0% Sold / List Price % 99.4% 106.8% -6.9% Average Price per SQFT $545 $573 -4.9% Quarter-end inventory 83 63 31.7%
AT $1,170,000 | JOHNLSCOTT.COM/56931
OFFERED
BAINBRIDGE ISLAND
The overall luxury market on Bainbridge Island is resilient, with the island lifestyle cementing the local area as a favorite destination for high-net-worth individuals. During the second quarter of 2023, sales were just slightly down from the same period in 2022, a testament to the strength of the desirable island market.
In the coming months, there will be a solid selection of available luxury properties on Bainbridge Island benefiting those looking to lay down new roots locally.
2023 Q2 LUXURY MARKET TRENDS Q2 2023 Q2 2022 % Change Number of Sales 23 25 -8.0% Total Dollar Volume $73,220,300 $87,940,000 -16.7% Average Sales Price $3,183,491 $3,517,600 -9.5% Average Days On Market 28 7 309.9% Sold / List Price % 96.5% 105.5% -8.5% Average Price per SQFT $774 $856 -9.5% Quarter-end inventory 19 3 533.3% The data is for single family residences over $2M in MLS area 170. Some John L. Scott offices are independently owned and operated. All reports presented are based on data supplied by the NWMLS, RMLS, Spokane MLS, and the Central Oregon MLS. Neither the Associations nor the MLS guarantees or is in anyway responsible for its accuracy. Data maintained by the Associations or the MLS may not reflect all real estate activities in the market. Information deemed reliable but not guaranteed.
SOLD | JOHNLSCOTT.COM/52691
OFFERED AT $2,675,000 | JOHNLSCOTT.COM/33361
SNOHOMISH COUNTY
Q2 SAW A 166.5% INCREASE IN DAYS ON MARKET IN SNOHOMISH COUNTY
The data is for single family residences over $1M in Snohomish County. Some John L. Scott offices are independently owned and operated. All reports presented are based on data supplied by the NWMLS, RMLS, Spokane MLS, and Central Oregon MLS. Neither the Associations nor the MLS guarantees or is in anyway responsible for its accuracy. Data maintained by the Associations or the MLS may not reflect all real estate activities in the market. Information deemed reliable but not guaranteed. Q2 2023 Q2 2022 % Change Number of Sales 417 765 -45.4% Total Dollar Volume $558,900,399 $1,085,730,266 -48.5% Average Sales Price $1,340,289 $1,419,255 -5.5% Average Days On Market 29 11 166.5% Sold / List Price % 99.4% 104.6% -5.0% Average Price per SQFT $430 $474 -9.2% Quarter-end inventory 245 352 -30.4%
2023 Q2 LUXURY MARKET TRENDS Q2 2023 Q2 2022 % Change Number of Sales 44 66 -33.3% Total Dollar Volume $63,170,330 $105,888,103 -40.3% Average Sales Price $1,435,689 $1,604,365 -10.5% Average Days On Market 44 24 82.6% Sold / List Price % 98.3% 102.0% -3.5% Average Price per SQFT $471 $481 -2.0% Quarter-end inventory 82 54 51.8% ISLAND COUNTY The data is for single family residences over $1M in Island County. Some John L. Scott offices are independently owned and operated. All reports presented are based on data supplied by the NWMLS, RMLS, Spokane MLS, and the Central Oregon MLS. Neither the Associations nor the MLS guarantees or is in anyway responsible for its accuracy. Data maintained by the Associations or the MLS may not reflect all real estate activities in the market. Information deemed reliable but not guaranteed.
SOLD | JOHNLSCOTT.COM/24549
OVERALL, THE AVERAGE SALES PRICE DECREASED BY 10.5% IN ISLAND COUNTY
LUXURY WATERFRONT
LAKE WASHINGTON
LAKE SAMMAMISH
KING COUNTY
Q2 2023 Q2 2022 % Change Number of Sales 27 29 -6.9% Total Dollar Volume $144,530,888 $145,802,500 -0.8% Average Sales Price $5,352,996 $5,027,672 6.4% Average Days On Market 38 14 177.3% Sold / List Price % 95.3% 100.7% -5.3% Average Price per SQFT $1,339 $1,267 5.7% Quarter-end inventory 47 26 80.77%
Q2 2023 Q2 2022 % Change Number of Sales 5 9 -44.4% Total Dollar Volume $15,335,000 $43,400,000 -64.6% Average Sales Price $3,067,000 $4,822,222 -36.4% Average Days On Market 49 18 166.1% Sold / List Price % 93.2% 98.2% -5.1% Average Price per SQFT $799 $1,136 -29.7% Quarter-end inventory 25 18 38.89%
Q2 2023 Q2 2022 % Change Number of Sales 48 45 6.67% Total Dollar Volume $203,639,887 $215,597,000 -5.5% Average Sales Price $4,242,498 $4,791,044 -11.4% Average Days On Market 39 26 51.6% Sold / List Price % 95.2% 100.2% -4.9% Average Price per SQFT $1,132 $1,154 -1.9% Quarter-end inventory 94 67 40.30%
The data is for waterfront single family residences and condos over $2M. Lake Washington is MLS areas 500, 510, 520, 560, 600, 350, 380, 390, 710, 720. Lake Sammamish is MLS areas 530, 540. Some John L. Scott offices are independently owned and operated. All reports presented are based on data supplied by the NWMLS, RMLS, Spokane MLS, and the Central Oregon MLS. Neither the Associations nor the MLS guarantees or is in anyway responsible for its accuracy. Data maintained by the Associations or the MLS may not reflect all real estate activities in the market. Information deemed reliable but not guaranteed.
2023 Q2 LUXURY MARKET TRENDS PENDING | JOHNLSCOTT.COM/53714
FEATURED LUXURY LISTINGS


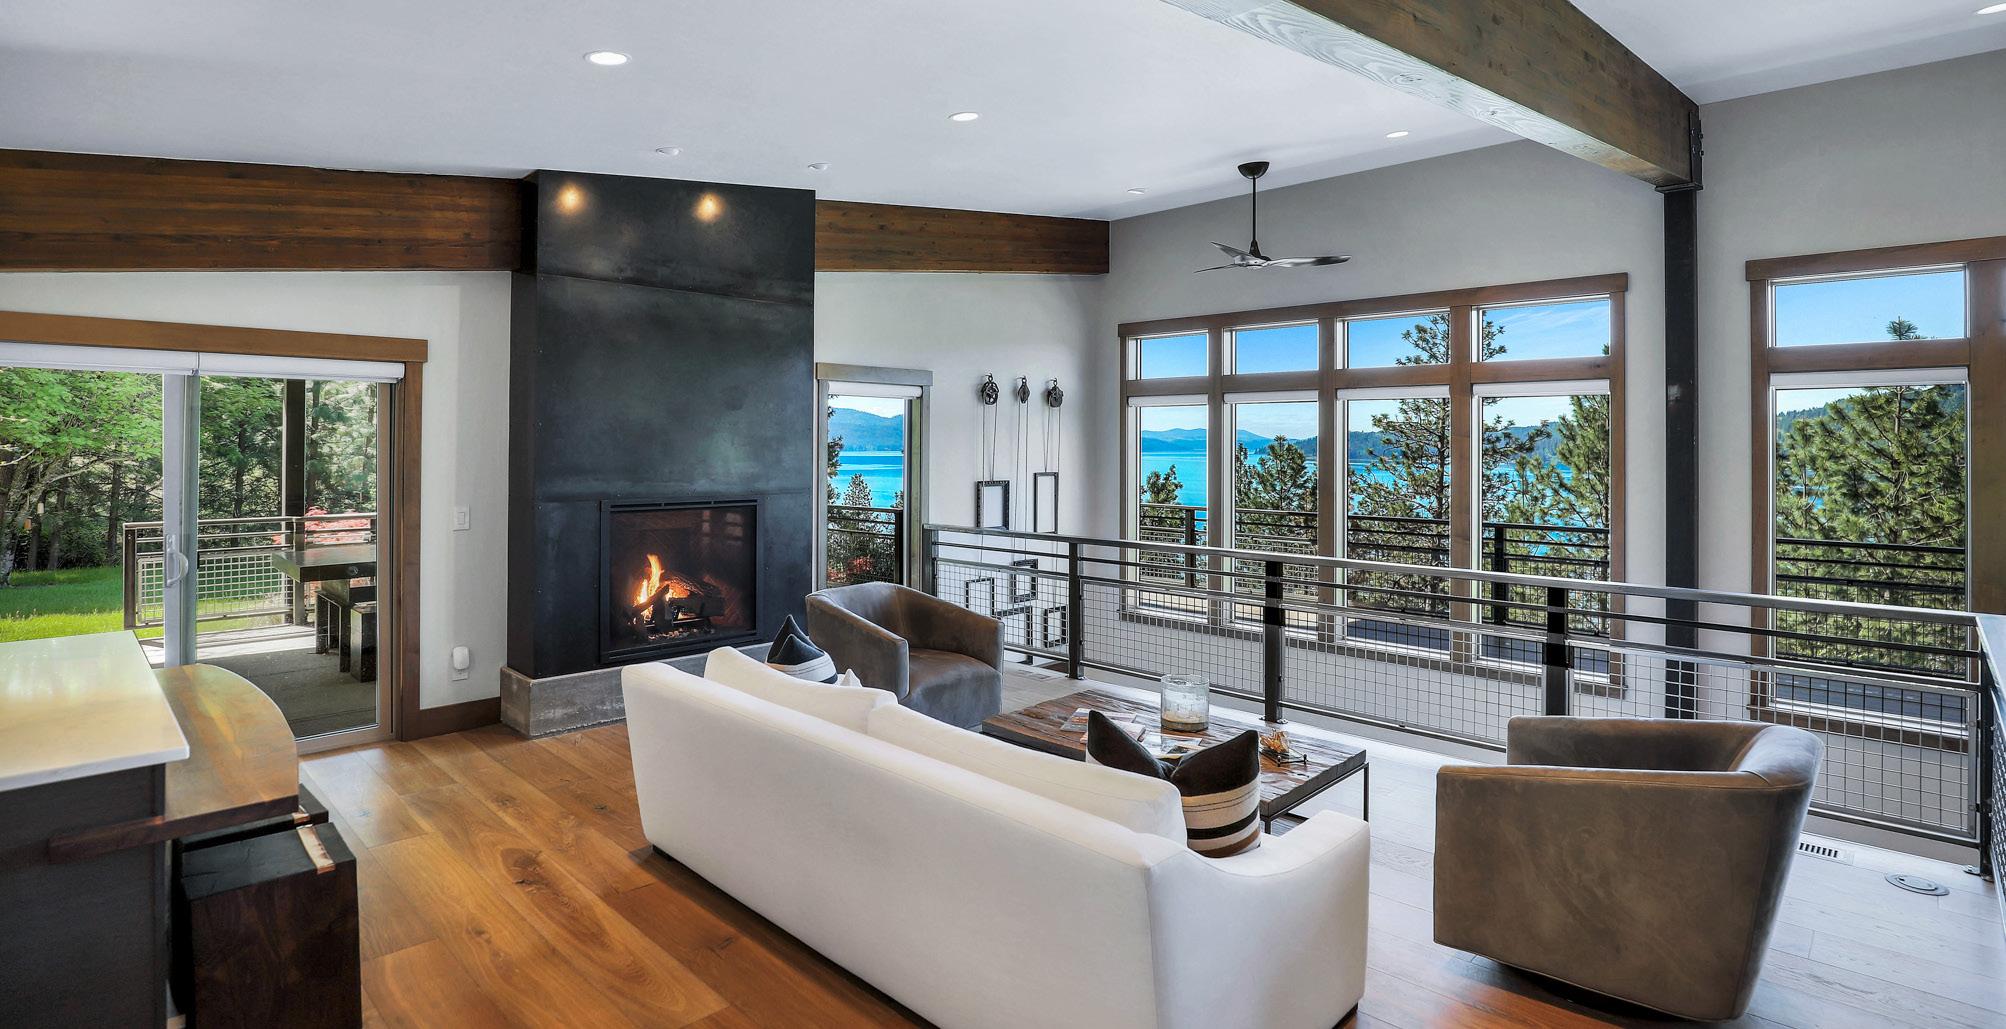
CLE ELUM, WA | $3,325,000 | JOHNLSCOTT.COM/69838


1040 PINEGRASS LOOP, CLE ELUM, WA 98922
Custom ridge view home is nestled on the desirable Pinegrass Loop and designed by renowned architect, Peter Swindley. This home was painstakingly planned for a unique, modern feel perfect for entertaining. Massive, reclaimed timbers, granite, and steel elements are prominent in the design. Primary and junior suites are on the main level with double guest suites, a bunkroom, and a bonus room on the upper level. Two special powder rooms, a fun bar set-up, and a craft/work area complete the main level. Enjoy one of the best views from the heated and covered patio with a large bluestone and granite firepit. Experience the benefits of a conditioned crawl space, shop area, and oversized garage.
SUSAN WEST 509.304.4007
SusanWest@johnlscott.com
MEDINA, WA | $6,750,000 | JOHNLSCOTT.COM/16782

3313 EVERGREEN POINT RD, MEDINA, WA 98039
This luxurious west-facing home on Medina’s coveted Evergreen Point overlooks Lake Washington, the Olympic Mountains, and Seattle. Impeccably finished, this home features Wolf and Sub-Zero appliances, a 20kw gas generator, air conditioning, a temp-controlled wine cellar featured in Seattle Times, and custom art lighting. Experience true tranquility in the primary suite boasting three walk-in closets, a media center, an onyx chandelier, radiant heat floor, and a steam shower. The lower level offers a separate garage and entrance for a possible MIL apartment, provides an entertainment area designed around the hot tub and pool with a heated deck, and opens to a gym, bistro, and home theatre. Spectacular garden designed by renowned landscape architect Tom Berger, integrating 100+ rose bushes and Japanese Maples.


KYLE BUSH

425.830.1292
KyleB@johnlscott.com
2023 Q2 LUXURY MARKET TRENDS
EASTERN WASHINGTON & IDAHO


2023 Q2 LUXURY MARKET TRENDS
COEUR D’ALENE, IDAHO
Q2 2023 Q2 2022 % Change Number of Sales 126 125 0.8% Total Dollar Volume $188,964,150 $222,444,066 -15.0% Average Sales Price $1,499,715 $1,779,553 -15.7% Average Days On Market 210 24 780.5% Sold / List Price % 81.3% 95.4% -14.7% Average Price per SQFT $ 422 $544 -22.4% Quarter-end inventory 267 184 45.1% The data is for single family residences over $1M in Kootenai County. Some John L. Scott offices are independently owned and operated. All reports presented are based on data supplied by the NWMLS, RMLS, Spokane MLS, and Central Oregon MLS. Neither the Associations nor the MLS guarantees or is in anyway responsible for its accuracy. Data maintained by the Associations or the MLS may not reflect all real estate activities in the market. Information deemed reliable but not guaranteed. OFFERED AT $4,150,000 | JOHNLSCOTT.COM/60945
THE AVERAGE SALES PRICE IN COEUR D’ALENE DECREASED 15.7%
SPOKANE COUNTY
THE AVERAGE SALES PRICE IN SPOKANE COUNTY DECREASED
3.4%
2023 Q2 LUXURY MARKET TRENDS
Q2 2023 Q2 2022 % Change Number of Sales 42 70 -40.0% Total Dollar Volume $52,381,441 $90,371,894 -42.0% Average Sales Price $1,247,177 $1,291,027 -3.4% Average Days On Market 45 17 168.7% Sold / List Price % 96.8% 100.7% -3.8% Average Price per SQFT $286 $295 -3.0% Quarter-end inventory 131 38 244.7% The data is for single family residences over $1M in Spokane County. Some John L. Scott offices are independently owned and operated. All reports presented are based on data supplied by the NWMLS, RMLS, Spokane MLS, and Central Oregon MLS. Neither the Associations nor the MLS guarantees or is in anyway responsible for its accuracy. Data maintained by the Associations or the MLS may not reflect all real estate activities in the market. Information deemed reliable but not guaranteed. SOLD | JOHNLSCOTT.COM/66052
OREGON & SOUTHWEST WASHINGTON

SECOND QUARTER HIGHLIGHTS
The luxury market in the Portland Metro area has remained steady throughout the second quarter of 2023, with very high sales activity for homes priced above $1 million. Meanwhile, luxury listings have returned to pre-pandemic levels, offering increased buyer selection locally.

SOLD | JOHNLSCOTT.COM/53022
In Lake Oswego and West Linn, available luxury inventory has increased offering buyers far greater selection than has been available the past few years.
OFFERED AT $3,295,000 | JOHNLSCOTT.COM/13341

2023 Q2 LUXURY MARKET TRENDS Q2 2023 Q2 2022 % Change Number of Sales 181 245 -26.1% Total Dollar Volume $247,999,213 $370,629,203 -33.0% Average Sales Price $1,370,161 $1,512,772 -9.4% Average Days On Market 29 20 43.2% Sold / List Price % 99.3% 104.7% -5.2% Average Price per SQFT $530 $392 35.2% Quarter-end inventory 216 196 10.2%
The
All reports presented
data supplied
NWMLS, RMLS, Spokane MLS,
Central Oregon MLS. Neither the Associations nor the MLS guarantees or is in anyway responsible for its accuracy. Data maintained by the Associations or the MLS may not reflect all real estate activities in the market. Information deemed reliable but not guaranteed.
data is for single family residences over $1M in Clackamas, Multnomah, Washington and Columbia Counties. Some John
L. Scott offices are independently owned and operated.
are based on
by the
and
Q2 2023 Q2 2022 % Change Number of Sales 102 130 -21.5% Total Dollar Volume $176,677,776 $228,554,002 -22.7% Average Sales Price $1,732,135 $1,758,108 -1.4% Average Days On Market 29 16 76.0% Sold / List Price % 98.1% 103.2% -4.9% Average Price per SQFT $691 $462 49.6% Quarter-end inventory 141 94 50.0%
PORTLAND METRO
LAKE OSWEGO

The data is for single family residences over $1M in Bend Oregon. Some John L. Scott offices are independently owned and operated. All reports presented are based on data supplied by the NWMLS, RMLS, Spokane MLS, and the Central Oregon MLS. Neither the Associations nor the MLS guarantees or is in anyway responsible for its accuracy. Data maintained by the Associations or the MLS may not reflect all real estate activities in the market. Information deemed reliable but not guaranteed. Q2 2023 Q2 2022 % Change Number of Sales 186 269 -30.8% Total Dollar Volume $288,469,739 $423,367,456 -31.8% Average Sales Price $1,550,913 $1,573,857 -1.4% Average Days On Market 56 23 145.8% Sold / List Price % 97.5% 100.8% -3.2% Average Price per SQFT $529 $530 -0.3% Quarter-end inventory 348 173 101.1%
IN Q2, THE AVERAGE SALES PRICE DECREASED BY 1.4% IN BEND
BEND
In the second quarter of 2023, active luxury listings in Bend slowly built up with fewer closed transactions and more available inventory. While the pace has slowed a bit from what we’ve seen in the past couple years, the demand has returned to what was typical pre-pandemic. Bend and the surrounding areas consistently draw out of area interest from buyers looking for the lifestyle this unique market affords.


2023 Q2 LUXURY MARKET TRENDS
OFFERED AT $1,395,000 | JOHNLSCOTT.COM/74373

The data is for single family residences over $1M in Jackson County. Some John L. Scott offices are independently owned and operated. All reports presented are based on data supplied by the NWMLS, RMLS, Spokane MLS, and Central Oregon MLS. Neither the Associations nor the MLS guarantees or is in anyway responsible for its accuracy. Data maintained by the Associations or the MLS may not reflect all real estate activities in the market. Information deemed reliable but not guaranteed. Q2 2023 Q2 2022 % Change Number of Sales 21 39 -46.1% Total Dollar Volume $29,445,500 $50,594,750 -41.8% Average Sales Price $1,402,167 $1,297,301 8.0% Average Days On Market 125 87 44.4% Sold / List Price % 94.4% 96.2% -1.8% Average Price per SQFT $327 $356 -7.9% Quarter-end inventory 135 56 141.0% JACKSON COUNTY OFFERED AT $1,500,000 | JOHNLSCOTT.COM/23651166 THE AVERAGE DAYS ON MARKET INCREASED BY 44.4% IN Q2 IN JACKSON COUNTY

2023 Q2 LUXURY MARKET TRENDS Q2 2023 Q2 2022 % Change Number of Sales 101 151 -33.1% Total Dollar Volume $132,079,337 $212,360,808 -37.8% Average Sales Price $1,307,716 $1,406,363 -7.0% Average Days On Market 46 31 45.2% Sold / List Price % 98.1% 100.6% -2.4% Average Price per SQFT $435 $361 20.4% Quarter-end inventory 238 151 57.6%
The data is for single family residences over $1M in Clark County. Some John L. Scott offices are independently owned and operated. All reports presented are based on data supplied by the NWMLS, RMLS, Spokane MLS, and the Central Oregon MLS. Neither the Associations nor the MLS guarantees or is in anyway responsible for its accuracy. Data maintained by the Associations or the MLS may not reflect all real estate activities in the market. Information deemed reliable but not guaranteed. OFFERED AT $2,100,000 | JOHNLSCOTT.COM/14045 IN Q2, THE
SALES
CLARK COUNTY
CLARK COUNTY
AVERAGE
PRICE DECREASED 7.0% IN
SOLRE: DEMANDS OF A NEW AFFLUENT GENERATION
RESIDENTIAL REAL ESTATE PORTFOLIO
The world of luxury real estate is vast and dynamic, with preferences and ownership trends varying across age groups. Here, we look at the fascinating differences between luxury homeowners under 35 and those aged 35-64, highlighting their unique perspectives on property ownership and revealing insights that could potentially reshape the luxury property market.
Extended-family Properties: The New Frontier for Young Luxury Homeowners
In a surprising twist, data shows that 52% of luxury homeowners under 35 own extended-family properties, compared to 38% of those aged 35-64 – a notable difference of 13 percentage points.
Younger generations place a higher value on family and communal living, which has translated into a growing preference for extended-family properties
Residential Real Estate Owned: Extended-family Property
College/University Property Investments: The Future of Luxury Real Estate?
Another intriguing finding is the significant difference in the ownership of college/university properties between the two age groups.

While only 9% of luxury homeowners aged 35-64 own such properties, a staggering 22% of those under 35 have ventured into this market – a difference of 13 percentage points.
This trend might be driven by younger generations’ focus on education and investment in their children’s future.
By owning college/university properties, these young luxury homeowners are not only securing prime real estate but also investing in the future success of the next generation.
Weekend/Retreat Properties: The New Status Symbol?
While vacation properties remain popular among both age groups, weekend/retreat properties have emerged as a new status symbol for luxury homeowners under 35. The data highlights a 10-percentage point difference, with 33% of younger homeowners owning weekend/retreat properties compared to just 23% of their middle-aged counterparts. These younger buyers are looking for more than just a place to escape their busy lives. They are seeking exclusive experiences and one-of-a-kind retreats that allow them to unwind while enjoying luxurious amenities and stunning locations.


Residential Real Estate Owned: Weekend/Retreat Property
The luxury real estate market is undergoing a significant transformation, driven by the evolving preferences of younger affluent buyers. Are you prepared to rise to the occasion with Luxury Portfolio in your corner? In the second installment of State of Luxury Real Estate (SOLRE) 2023, Luxury Portfolio International® examines the demands of a new affluent generation and share the unique preferences of different generations of luxury homeowners. View the full report here: luxuryportfolio.com/reports
2023 Q2 LUXURY MARKET TRENDS
PENDING | JOHNLSCOTT.COM/13003
@JLSexceptionalhomes @exceptional_homesjls Connect with us:
