2023 Q1 Luxury Market Trends

Page 1

LUXURY MARKET TRENDS

HAPPY SPRING!

We are currently in the prime-time season for the luxury market, which runs from March through October. In many markets across the Pacific Northwest, buyer demand increases over the months ahead.

After the winter cleanup of unsold luxury properties, we often see a shortage of inventory of luxury listings. As more properties come onto the market, buyers will find a greater selection this time of year.

Spring is truly the best time of year to showcase your home if you’re looking to sell, and buyers can expect to see more homes coming on the market during this season. Whether you’re looking to sell your family home or purchase a vacation property in a destination location, our John L. Scott luxury broker associates are here to help.

EXCEPTIONAL HOMES

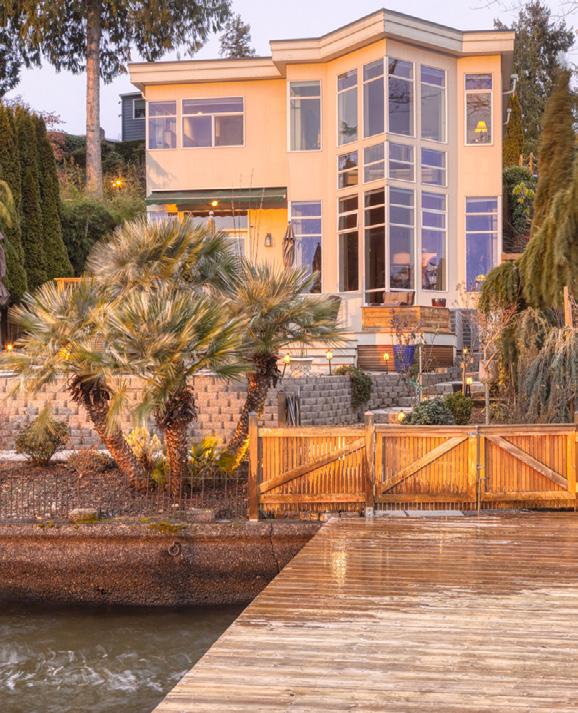
We hope you enjoy this edition of our Luxury Market Trends report! ON THE COVER: OFFERED AT $1,750,000 | JOHNLSCOTT.COM/57015

Exceptional Homes is John L. Scott’s luxury real estate brand. Together with our luxury broker associates, our global partners at Luxury Portfolio International, and our support staff, we strive to provide concierge-level service by putting clients first.

We can ensure you that we are here for you and your family. The real estate market is fast-paced and ever changing, but what hasn’t changed, is our commitment to exceed your expectations when you are ready to buy or sell your home. ON

THE RIGHT: PENDING| JOHNLSCOTT.COM/17351

Luxury LIVE YOUR

WE ARE GLOBAL

John L. Scott is a founding member of the international organization Leading Real Estate Companies of the World®.

Founded in 1931, JLS operates over 100 offices with over 3,000 agents throughout WA, OR, ID & CA

A global community of over 565 real estate companies awarded membership based on rigorous standards for service and performance

BY THE NUMBERS

550 Member Firms

80% of applicants to this network are turned down

John L. Scott’s luxury brand, providing our agents with tools and data to help each and every client live their luxury

The luxury division of LeadingRE & the largest global network of the most powerful, independent luxury firms

4,600 Offices Worldwide

Total Inventory $58 BILLION

Associates Worldwide 6 Continents with Member Companies 130,000
U.S. HOME SALES VOLUME
ESTATE
FRANCHISE
BRAND. $296 BILLION IN U.S. HOME SALES VOLUME.
Average Property $2.6 MILLION MORE
THAN ANY OTHER REAL
NETWORK,
OR BROKERAGE

JOHN L. SCOTT LUXURY SPECIALISTS SCHOLARS OF THE MARKET

Curious about luxury trends in your neighborhood? See what some of our real estate specialists had to say about the luxury market in their area.

GOLD PROPERTIES

In Q1, we saw a high demand for luxury properties while inventory remained scarce. Buyers were highly motivated to capitalize on potential properties quickly, with many going under contract in less than a week. We believe the spring market will be even stronger than Q1, with more inventory and buying opportunities. We believe the lack of inventory has allowed for a seller’s market; with more inventory we will see more of an equilibrium luxury market.

Overall, the luxury market was extremely resilient in Q1. With fewer listings coming on the market, we are seeing low inventory in Sammamish. Homes in market-ready condition on day one are fetching strong buyer interest and even some multiple offer situations. I believe we will continue to see a lack of new listings compared to spring markets of the past as volatility in macroeconomic indicators continues. The low inventory levels have kept prices up for sellers and a competitive environment for buyers on turn-key new listings priced competitively.

MARTIN WEISS Sammamish, WA Lake Oswego, OR

In the first quarter of 2023, the luxury real estate market in Spokane experienced a notable decline, with homes priced above one million dollars going under contract within the first 30 days at a roughly 20% decrease compared to the previous year. Consequently, inventory levels have increased, and the months of inventory have nearly tripled during the same period, as compared to the first quarter of 2022. The current luxury real estate market in Spokane offers buyers a larger selection of homes due to the increased number of luxury properties and months of inventory available. However, the longer days on market have resulted in a higher chance of homeowners receiving offers lower than their listing price. Therefore, it is now more crucial than ever to price homes accurately in this market with increased inventory.

Q1 started out slightly slower, however in the last few weeks we’ve seen that well-priced homes are still in demand. From 2 million and up, we’ve seen 30% to 40% pending in the first week and 70% to 80% pending within the first month. Showings are strong, and we’re still seeing multiple offers. Even with news of layoffs in the tech sector, many are still looking for homes that have moved here in the last few years. There is still high demand. Inventory is down and prices are still strong, although down from the height of last year. In perspective, even with low inventory we’re seeing relatively strong sales and if interest rates go down, which they should, we’ll likely see price and demand increase, along with more inventory from the typical spring selling season.

2023 Q1 LUXURY MARKET TRENDS
DANIEL DAILEY Spokane, WA DAN WINGARD Redmond, WA

PUGET SOUND

FIRST QUARTER HIGHLIGHTS

The luxury market in Seattle over the first quarter of 2023 has continued the intensity adjustment that began in 2022, but in many of the luxury price ranges the buyer demand continues to meet or exceed the relatively low inventory. While total sales are lower than we saw in the first quarter of 2022, the overall intensity and inventory are strong/healthy as we kickoff the busy spring sales season.

2023 Q1 LUXURY MARKET TRENDS Q1 2023 Q1 2022 % Change Number of Sales 50 82 -39.0% Total Dollar Volume 154,552,190 248,450,990 -37.7% Average Sales Price 3,091,044 3,029,890 2.0% Average Days On Market 26 30 -13.4% Sold / List Price % 97.0% 100.9% -3.9% Average Price per SQFT $762 $775 -1.6% Quarter-end inventory 90 50 80.0% SEATTLE
The data is for single family residences over $2M in MLS areas 140, 380, 385 390, 700, 701, 705, 710. Some John L. Scott offices are independently owned and operated. All reports presented are based on data supplied by the NWMLS, RMLS, Spokane MLS, and Central Oregon MLS. Neither the Associations nor the MLS guarantees or is in anyway responsible for its accuracy. Data maintained by the Associations or the MLS may not reflect all real estate activities in the market. Information deemed reliable but not guaranteed. OFFERED AT $2,750,000 | JOHNLSCOTT.COM /18216

OFFERED AT $4,250,000 | JOHNLSCOTT.COM/35851

WEST BELLEVUE

West Bellevue is a coveted luxury market and demand rarely falters at nearly all price points. As we enter the busy sales season the inventory is healthy, a welcome change to the shortage of inventory we saw at this time in 2022, offering a wider selection for buyers.

Q1 2023 Q1 2022 % Change Number of Sales 29 48 -39.5% Total Dollar Volume 188,364,800 241,921,027 -22.1% Average Sales Price 6,495,338 5,040,021 28.8% Average Days On Market 40 16 154.7% Sold / List Price % 97.4% 101.1% -3.6% Average Price per SQFT $1,400 $1,107 26.4% Quarter-end inventory 44 21 109.5%
The data is for single family residences over $2M in MLS area 520. Some John L. Scott offices are independently owned and operated. All reports presented are based on data supplied by the NWMLS, RMLS, Spokane MLS, and the Central Oregon MLS. Neither the Associations nor the MLS guarantees or is in anyway responsible for its accuracy. Data maintained by the Associations or the MLS may not reflect all real estate activities in the market. Information deemed reliable but not guaranteed.

MERCER ISLAND

Mercer Island’s luxury market remains competitive and we see a shortage of inventory of luxury homes available for buyers to consider. As we progress into the spring and summer months, inventory should increase in alignment with the annual sales cycle.

2023 Q1 LUXURY MARKET TRENDS
Q1 2023 Q1 2022 % Change Number of Sales 24 21 14.2% Total Dollar Volume 77,376,000 69,841,914 10.7% Average Sales Price 3,224,000 3,325,805 -3.0% Average Days On Market 41 29 44.0% Sold / List Price % 99.20% 106.10% -6.5% Average Price per SQFT $847 $795 6.4% Quarter-end inventory 26 7 271.4% SOLD | JOHNLSCOTT.COM/55996
The data is for single family residences over $2M in MLS area 510. Some John L. Scott offices are independently owned and operated. All reports presented are based on data supplied by the NWMLS, RMLS, Spokane MLS, and the Central Oregon MLS. Neither the Associations nor the MLS guarantees or is in anyway responsible for its accuracy. Data maintained by the Associations or the MLS may not reflect all real estate activities in the market. Information deemed reliable but not guaranteed.

OFFERED AT $3,850,000 | JOHNLSCOTT.COM/13852

EASTSIDE
Q1 2023 Q1 2022 % Change Number of Sales 196 265 -26.0% Total Dollar Volume 656,885,070 928,981,125 -29.2% Average Sales Price 3,351,454 3,505,589 -4.4% Average Days On Market 45 14 223.8% Sold / List Price % 96.6% 105.1% -8.1% Average Price per SQFT $789 $831 -4.9% Quarter-end inventory 192 90 113.3% The data is for single family residences over $2M in MLS areas 500, 510, 520, 530, 540, 550, 560, 600. Some John L. Scott offices are independently owned and operated. All reports presented are based on data supplied by the NWMLS, RMLS, Spokane MLS, and the Central Oregon MLS. Neither the Associations nor the MLS guarantees or is in anyway responsible for its accuracy. Data maintained by the Associations or the MLS may not reflect all real estate activities in the market. Information deemed reliable but not guaranteed. 223.8% DAYS ON MARKET † -4.4% AVERAGE SALES PRICE †
2023 Q1 LUXURY MARKET TRENDS KING COUNTY CONDO SOLD | JOHNLSCOTT.COM/12041 Q1 2023 Q1 2022 % Change Number of Sales 4 13 -69.2% Total Dollar Volume 10,645,000 37,744,500 -71.8% Average Sales Price 2,661,250 2,903,423 -8.3% Average Days On Market 87 44 96.5% Sold / List Price % 94.0% 96.9% -2.9% Average Price per SQFT $1,207 $1,050 15.0% Quarter-end inventory 27 24 12.5% The data is for condominiums over $2M in King County. Some John L. Scott offices are independently owned and operated. All reports presented are based on data supplied by the NWMLS, RMLS, Spokane MLS, and the Central Oregon MLS. Neither the Associations nor the MLS guarantees or is in anyway responsible for its accuracy. Data maintained by the Associations or the MLS may not reflect all real estate activities in the market. Information deemed reliable but not guaranteed. -8.3% AVERAGE SALES PRICE -69.2% NUMBER OF SALES † †

OFFERED AT $2,750,000 | JOHNLSCOTT.COM/17738

SOUTH KING COUNTY

PRICE FOR SOUTH KING COUNTY

The data is for single family residences over $1M in MLS areas 100, 110, 120, 130, 140, 300, 310, 320, 330, 340, 350, 360. Some John L. Scott offices are independently owned and operated. All reports presented are based on data supplied by the NWMLS, RMLS, Spokane MLS, and Central Oregon MLS. Neither the Associations nor the MLS guarantees or is in anyway responsible for its accuracy. Data maintained by the Associations or the MLS may not reflect all real estate activities in the market. Information deemed reliable but not guaranteed. Q1 2023 Q1 2022 % Change Number of Sales 121 109 11.0% Total Dollar Volume 168,545,896 159,297,006 5.8% Average Sales Price 1,392,941 1,461,440 -4.6% Average Days On Market 60 30 99.6% Sold / List Price % 98.2% 104.5% -6.0% Average Price per SQFT $387 $418 -7.4% Quarter-end inventory 76 59 28.8%
IN Q1, WE SAW A -4.6% DECREASE IN THE AVERAGE SALES
2023 Q1 LUXURY MARKET TRENDS Q1 2023 Q1 2022 % Change Number of Sales 98 111 -11.7% Total Dollar Volume 137,492,456 161,914,616 -15.0% Average Sales Price 1,402,984 1,458,690 -3.8% Average Days On Market 62 35 78.4% Sold / List Price % 97.0% 101.0% -4.0% Average Price per SQFT $373 $387 -3.4% Quarter-end inventory 127 69 84.0% PIERCE COUNTY The data is for single family residences over $1M in Pierce County. Some John L. Scott offices are independently owned and operated. All reports presented are based on data supplied by the NWMLS, RMLS, Spokane MLS, and the Central Oregon MLS. Neither the Associations nor the MLS guarantees or is in anyway responsible for its accuracy. Data maintained by the Associations or the MLS may not reflect all real estate activities in the market. Information deemed reliable but not guaranteed. THE AVERAGE DAYS ON MARKET INCREASED BY 78.4% IN Q1 IN PIERCE COUNTY OFFERED AT $2,499,950 | JOHNLSCOTT.COM/70936

OFFERED AT $1,750,000 | JOHNLSCOTT.COM/68993

KITSAP COUNTY

OVERALL, THE AVERAGE PRICE PER SQUARE FOOT INCREASED 2.9% IN KITSAP COUNTY

The data is for single family residences over $1M in Kitsap County. Some John L. Scott offices are independently owned and operated. All reports presented are based on data supplied by the NWMLS, RMLS, Spokane MLS, and Central Oregon MLS. Neither the Associations nor the MLS guarantees or is in anyway responsible for its accuracy. Data maintained by the Associations or the MLS may not reflect all real estate activities in the market. Information deemed reliable but not guaranteed. Q1 2023 Q1 2022 % Change Number of Sales 45 54 -16.6% Total Dollar Volume 69,915,775 89,412,708 -21.8% Average Sales Price 1,553,684 1,655,791 -6.1% Average Days On Market 63 41 51.8% Sold / List Price % 98.5% 108.0% -8.8% Average Price per SQFT $483 $469 2.9% Quarter-end inventory 49 31 58.0%

BAINBRIDGE ISLAND

Bainbridge Island is always a sought-after destination for luxury buyers pursuing the lifestyle that only Bainbridge can offer. Demand remains high as 81% of listings were sold in the first 30 days on the market, which translates to a frenzy of Sales Activity Intensity™.

2023 Q1 LUXURY MARKET TRENDS Q1 2023 Q1 2022 % Change Number of Sales 5 4 25.0% Total Dollar Volume 17,830,700 11,066,000 61.1% Average Sales Price 3,566,140 2,766,500 28.9% Average Days On Market 3 12 -71.6% Sold / List Price % 101.7% 101.1% 0.6% Average Price per SQFT $833 $555 49.9% Quarter-end inventory 13 5 160.0% The data is for single family residences over $2M in MLS area 170. Some John L. Scott offices are independently owned and operated. All reports presented are based on data supplied by the NWMLS, RMLS, Spokane MLS, and the Central Oregon MLS. Neither the Associations nor the MLS guarantees or is in anyway responsible for its accuracy. Data maintained by the Associations or the MLS may not reflect all real estate activities in the market. Information deemed reliable but not guaranteed.

OFFERED AT $1,995,000 | JOHNLSCOTT.COM/10799

SNOHOMISH COUNTY

Q1 SAW A 255.7% INCREASE IN DAYS ON MARKET IN SNOHOMISH COUNTY

The data is for single family residences over $1M in Snohomish County. Some John L. Scott offices are independently owned and operated. All reports presented are based on data supplied by the NWMLS, RMLS, Spokane MLS, and Central Oregon MLS. Neither the Associations nor the MLS guarantees or is in anyway responsible for its accuracy. Data maintained by the Associations or the MLS may not reflect all real estate activities in the market. Information deemed reliable but not guaranteed. Q1 2023 Q1 2022 % Change Number of Sales 276 381 -27.5% Total Dollar Volume 349,287,723 558,070,012 -37.4% Average Sales Price 1,265,535 1,464,751 -13.6% Average Days On Market 51 14 255.7% Sold / List Price % 98.2% 109.9% -10.6% Average Price per SQFT $418 $477 -12.4% Quarter-end inventory 132 95 38.9%
2023 Q1 LUXURY MARKET TRENDS Q1 2023 Q1 2022 % Change Number of Sales 20 35 -42.8% Total Dollar Volume 32,120,500 54,843,500 -41.4% Average Sales Price 1,606,025 1,566,957 2.4% Average Days On Market 53 47 12.5% Sold / List Price % 98.1% 101.8% -3.6% Average Price per SQFT $506 $512 -1.1% Quarter-end inventory 41 18 127.7% ISLAND COUNTY The data is for single family residences over $1M in Island County. Some John L. Scott offices are independently owned and operated. All reports presented are based on data supplied by the NWMLS, RMLS, Spokane MLS, and the Central Oregon MLS. Neither the Associations nor the MLS guarantees or is in anyway responsible for its accuracy. Data maintained by the Associations or the MLS may not reflect all real estate activities in the market. Information deemed reliable but not guaranteed.
OFFERED AT $1,299,950 | JOHNLSCOTT.COM/28763
OVERALL, THE AVERAGE SALES PRICE INCREASED BY 2.4% IN ISLAND COUNTY

LUXURY WATERFRONT

LAKE WASHINGTON

LAKE SAMMAMISH

KING COUNTY

Q1 2023 Q1 2022 % Change Number of Sales 15 16 -6.2% Total Dollar Volume 144,538,000 93,373,775 54.8% Average Sales Price 9,635,867 5,835,861 65.1% Average Days On Market 44 22 102.9% Sold / List Price % 97.3% 100.3% -3.0% Average Price per SQFT $1,741 $1,176 48.0% Quarter-end inventory 40 13 207.6%
Q1 2023 Q1 2022 % Change Number of Sales 3 5 -40.0% Total Dollar Volume 7,050,000 26,400,000 -73.3% Average Sales Price 2,350,000 5,280,000 -55.4% Average Days On Market 40 62 -35.3% Sold / List Price % 90.4% 94.8% -4.7% Average Price per SQFT $535 $1,264 -57.6% Quarter-end inventory 12 1 1100.0%
Q1 2023 Q1 2022 % Change Number of Sales 26 30 -13.3% Total Dollar Volume 174,453,000 146,243,775 19.2% Average Sales Price 6,709,731 4,874,793 37.6% Average Days On Market 41 34 19.6% Sold / List Price % 97.0% 97.4% -0.4% Average Price per SQFT $1,395 $1,106 26.1% Quarter-end inventory 67 19 252.6%
The data is for waterfront single family residences and condos over $2M. Lake Washington is MLS areas 500, 510, 520, 560, 600, 350, 380, 390, 710, 720. Lake Sammamish is MLS areas 530, 540. Some John L. Scott offices are independently owned and operated. All reports presented are based on data supplied by the NWMLS, RMLS, Spokane MLS, and the Central Oregon MLS. Neither the Associations nor the MLS guarantees or is in anyway responsible for its accuracy. Data maintained by the Associations or the MLS may not reflect all real estate activities in the market. Information deemed reliable but not guaranteed.
2023 Q1 LUXURY MARKET TRENDS PENDING | JOHNLSCOTT.COM/67743

FEATURED LUXURY LISTINGS

KENT, WA | $1,400,000 | JOHNLSCOTT.COM/46346

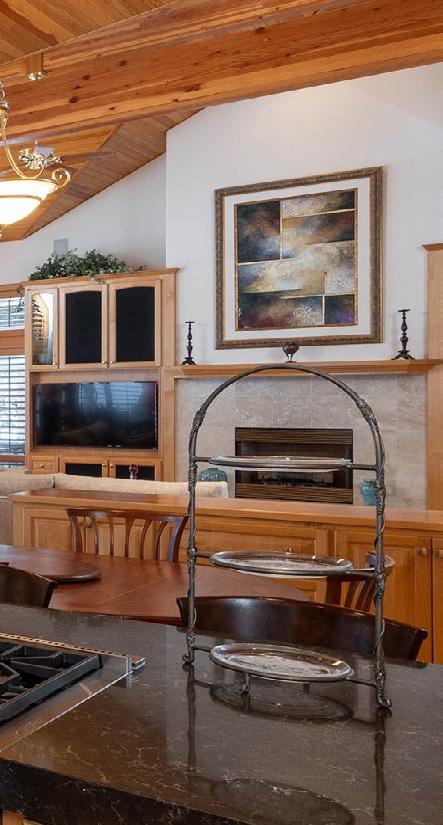
26721 S LAKE FENWICK RD, KENT, WA 98032

Built in 2019, this stunning home is custom crafted with modern details. The open concept floor plan is accentuated with vaulted ceilings and luxury vinyl flooring throughout. The striking floor-to-ceiling stone fireplace is the centerpiece of the great room, flowing into the gourmet kitchen with high-end appliances, quartz countertops, and sweeping quartz waterfall island. The main floor is complete with a light-and-bright office, perfect for working from home. This lavish home offers two primary suites, each with their own five-piece bath and walk-in closets. Sliding glass doors open to the expansive patio with a walkway to the gazebo for year-round entertaining, overlooking the lush yard. Lake Fenwick is just across the street with easement, featuring trails, fishing, and boating.

IGOR MAYSTER

253.267.2974

IgorM@johnlscott.com

SPOKANE, WA | $1,999,900 | JOHNLSCOTT.COM/13701

1835 S UPPER TERRACE RD, SPOKANE, WA 99203

Stunning, one-of-a-kind, Spanish eclectic home designed by C.F. Rider in 1936 and known as the Dee Riegel House. Fabulous Rockwood historic setting on a half-acre lush corner lot with terrific privacy and beautiful ambience. Entertainers delight with a two-tier patio system flanked with roses, lush garden, and a quaint gazebo for early morning coffee or a relaxing picnic in the summer. Striking interior design with complete top-quality restoration and renovation from 2012 to 2015 to maintain the historic charm and provide luxurious modern updates. A true gem within walking/biking distance to Rockwood Bakery, Manito Park, hospitals, restaurants, and downtown activities.

LISA THOME

509.389.2800

LisaThome@johnlscott.com

2023 Q1 LUXURY MARKET TRENDS

EASTERN WASHINGTON & IDAHO

2023 Q1 LUXURY MARKET TRENDS

COEUR D’ALENE, IDAHO

Q1 2023 Q1 2022 % Change Number of Sales 57 87 -34.8% Total Dollar Volume 94,714,996 150,272,126 -36.9% Average Sales Price 1,661,667 1,727,266 -3.8% Average Days On Market 55 59 -6.9% Sold / List Price % 89.80% 96.40% -6.9% Average Price per SQFT $23 $493 -95.3% Quarter-end inventory 162 77 110.3% The data is for single family residences over $1M in Kootenai County. Some John L. Scott offices are independently owned and operated. All reports presented are based on data supplied by the NWMLS, RMLS, Spokane MLS, and Central Oregon MLS. Neither the Associations nor the MLS guarantees or is in anyway responsible for its accuracy. Data maintained by the Associations or the MLS may not reflect all real estate activities in the market. Information deemed reliable but not guaranteed. OFFERED AT $4,395,000 | JOHNLSCOTT.COM/45627
THE AVERAGE SALES PRICE IN COEUR D’ALENE DECREASED 3.8%

SPOKANE COUNTY

THE AVERAGE SALES PRICE IN SPOKANE COUNTY DECREASED 8.6%

2023 Q1 LUXURY MARKET TRENDS
Q1 2023 Q1 2022 % Change Number of Sales 23 32 -28.1% Total Dollar Volume 29,241,296 44,514,033 -34.3% Average Sales Price 1,271,361 1,391,064 -8.6% Average Days On Market 91 48 89.8% Sold / List Price % 93.2% 94.2% -1.1% Average Price per SQFT $47 $316 -85.0% Quarter-end inventory 46 14 228.5% The data is for single family residences over $1M in Spokane County. Some John L. Scott offices are independently owned and operated. All reports presented are based on data supplied by the NWMLS, RMLS, Spokane MLS, and Central Oregon MLS. Neither the Associations nor the MLS guarantees or is in anyway responsible for its accuracy. Data maintained by the Associations or the MLS may not reflect all real estate activities in the market. Information deemed reliable but not guaranteed. SOLD | JOHNLSCOTT.COM/19882

OREGON & SOUTHWEST WASHINGTON

FIRST QUARTER HIGHLIGHTS

The first quarter of 2023 provided more inventory and options for buyers in the luxury price ranges. While sales were down from the first quarter of 2022 in Portland Metro, competition remains in many luxury price ranges as 47% of listings have sold in the first 30 days on the market.

PENDING | JOHNLSCOTT.COM/11384

OFFERED AT $5,200,000 | JOHNLSCOTT.COM/13308

In Lake Oswego, after the intensity adjustment which began last year, the strong demand for homes in this desirable community remains as we are seeing a shortage of inventory which is comparable to this time in 2022. Relief may come for buyers as inventory typically increases in the spring and summer months.

2023 Q1 LUXURY MARKET TRENDS Q1 2023 Q1 2022 % Change Number of Sales 72 130 -44.6% Total Dollar Volume 100,643,201 217,889,320 -53.8% Average Sales Price 1,397,822 1,676,072 -16.6% Average Days On Market 50 46 9.0% Sold / List Price % 96.6% 101.3% -4.6% Average Price per SQFT $469 $403 16.4% Quarter-end inventory 142 107 32.7%
in the
Information
reliable but not guaranteed.
The data is for single family residences over $1M in Clackamas, Multnomah, Washington and Columbia Counties. Some John L. Scott offices are independently owned and operated. All reports presented are based on data supplied by the NWMLS, RMLS, Spokane MLS, and Central Oregon
MLS. Neither the Associations nor the MLS guarantees or is in anyway responsible for its accuracy. Data maintained by the Associations or the MLS may not reflect all real estate activities
market.
deemed
Q1 2023 Q1 2022 % Change Number of Sales 50 79 -36.7% Total Dollar Volume 87,222,350 156,286,273 -44.1% Average Sales Price 1,744,447 1,978,307 -11.8% Average Days On Market 60 43 40.5% Sold / List Price % 96.8% 100.0% -3.2% Average Price per SQFT $672 $466 44.1% Quarter-end inventory 44 37 18.9%
PORTLAND METRO LAKE OSWEGO
The data is for single family residences over $1M in Bend Oregon. Some John L. Scott offices are independently owned and operated. All reports presented are based on data supplied by the NWMLS, RMLS, Spokane MLS, and the Central Oregon MLS. Neither the Associations nor the MLS guarantees or is in anyway responsible for its accuracy. Data maintained by the Associations or the MLS may not reflect all real estate activities in the market. Information deemed reliable but not guaranteed. Q1 2023 Q1 2022 % Change Number of Sales 107 214 -50.0% Total Dollar Volume 162,674,455 326,179,723 -50.1% Average Sales Price 1,520,322 1,524,204 -0.2% Average Days On Market 67 62 8.5% Sold / List Price % 96.3% 99.7% -3.4% Average Price per SQFT $496 $500 -0.8% Quarter-end inventory 176 68 158.8%
Q1,
BEND
BEND IN
THE AVERAGE SALES PRICE DECREASED BY 0.2% IN

After the annual winter clean-up activity in Bend, the listings and buyers are starting to appear out of hibernation. Inventory is currently at healthy levels, a refreshing change after the shortage we saw during this time in 2022.

Bend will continue to draw high-net-worth individuals who are seeking to relocate, retire or purchase a second home, due to the area’s appealing lifestyle for residents.

2023 Q1 LUXURY MARKET TRENDS
PENDING | JOHNLSCOTT.COM/37184
The data is for single family residences over $1M in Jackson County. Some John L. Scott offices are independently owned and operated. All reports presented are based on data supplied by the NWMLS, RMLS, Spokane MLS, and Central Oregon MLS. Neither the Associations nor the MLS guarantees or is in anyway responsible for its accuracy. Data maintained by the Associations or the MLS may not reflect all real estate activities in the market. Information deemed reliable but not guaranteed. Q1 2023 Q1 2022 % Change Number of Sales 8 28 -71.4% Total Dollar Volume 11,624,500 38,145,064 -69.5% Average Sales Price 1,453,063 1,362,324 6.6% Average Days On Market 131 64 105.2% Sold / List Price % 89.4% 97.6% -8.3% Average Price per SQFT $339 $371 -8.4% Quarter-end inventory 80 41 95.1% JACKSON COUNTY OFFERED AT $2,195,000 | JOHNLSCOTT.COM/23932 THE AVERAGE DAYS ON MARKET INCREASED BY 105.2% IN Q1 IN JACKSON COUNTY
2023 Q1 LUXURY MARKET TRENDS Q1 2023 Q1 2022 % Change Number of Sales 55 98 -43.8% Total Dollar Volume 73,831,725 137,477,162 -46.3% Average Sales Price 1,342,395 1,402,828 -4.3% Average Days On Market 75 41 82.9% Sold / List Price % 98.1% 97.0% 1.1% Average Price per SQFT $485 $358 35.5% Quarter-end inventory 110 46 139.1% CLARK COUNTY The data is for single family residences over $1M in Clark County. Some John L. Scott offices are independently owned and operated. All reports presented are based on data supplied by the NWMLS, RMLS, Spokane MLS, and the Central Oregon MLS. Neither the Associations nor the MLS guarantees or is in anyway responsible for its accuracy. Data maintained by the Associations or the MLS may not reflect all real estate activities in the market. Information deemed reliable but not guaranteed. OFFERED AT $1,650,000 | JOHNLSCOTT.COM/13697 IN Q1, THE AVERAGE SALES PRICE DECREASED 4.3% IN CLARK COUNTY

WHAT A WONDERFUL WORLD

Take a trip around the globe with seven sights springing straight from nature

The Earth is packed with awe-inspiring natural marvels created from nothing but the processes of geology and life. Yet many go underappreciated in favor of more modern, manmade achievements.

The Seven Natural Wonders Foundation teamed up with cable broadcaster CNN to change that, compiling a list of the “Seven Natural Wonders of the World” to inspire people to visit and preserve all of the wild and amazing natural places on the planet.

AURORA BOREALIS

Bright waves of blues, greens, purples and pinks dazzle across the pitch-black night sky each winter in the northern reaches of the globe. No, it is not a laser light show, but the natural phenomenon, aurora borealis, also known as the northern lights.

Geomagnetic storms on the sun shoot electrons out at high speeds, which collide with particles such as nitrogen and oxygen in Earth’s atmosphere, releasing light as they calm down.

The stunning displays, seen as a colored glow or waves, occur from September to April in northern- latitude places such as Alaska, northern Canada, Iceland, Greenland, Estonia, Finland, Sweden and Norway — the closer to the North Pole, the better.

The best locations to see the aurora may be frigidly cold, but they also have little-to-no light pollution and clear skies. They also have quite a dark backdrop, with only a few hours of sunlight during the season. In the far north, during Polar Night, the sun does not rise above the horizon for two months.

VICTORIA FALLS

Deep in southern Africa, the calm waters of the Zambezi River, the fourth longest in Africa, violently plunge into the depths of a 355-foot-deep gorge.

The largest waterfall curtain in the world, Victoria Falls flows at the border between Zimbabwe and Zambia. Victoria drops into a narrow chasm of just 80–240 feet wide and more than a mile long. At the bottom of the falls is a deep pool called the Boiling Pot, where the waters of the Zambezi churn among rocks and rapids.

Victoria Falls is known for not only its size and unique shape, but for the mist and rainbows created by its waters. Locals named the waterfall Mosi-oa-Tunya — “the smoke that thunders.”

The clouds of mist rising from the gorge can be seen from more than 30 miles away and the crashing water can be heard beyond 24 miles. The falls are surrounded by lush forests and grasslands populated by a menagerie of African animals such as hippopotamuses, antelopes, elephants, giraffes, zebras, lions and leopards.

MOUNT EVEREST

The bucket list climb to top them all, Mount Everest rises above everything else on Earth. The highest point on the planet’s surface, on the border of Nepal and Tibet, Everest towers 29,032 feet from base to peak.

Part of a massif in the Himalayas, it lies at a focal point of tectonic action between the Indian and Eurasian plates and continues to grow by a fraction of an inch every year — layers of granite, limestone and ancient sedimentary rock pushed up over millennia.

The peak of Everest is so high that oxygen levels are a third of those at sea level. That, combined with strong winds and extreme cold, means nothing lives near the summit.

Mountain climbers come to the area — which is so remote there were no roads until recently — for a fleeting chance to reach that summit, which was only first accomplished in 1953 by Sir Edmund Hillary and Tenzing Norgay. Since then, more than 6,000 people have made it to the top, while 300- plus have perished trying.

GUANABARA BAY

Rio de Janeiro, Brazil, is known for many things — its fun-loving Carioca culture, wild Carnival celebrations and colorful samba music. But one nature-made Rio icon embodies them all — Guanabara Bay.

Bays form when ocean water erodes softer materials on shore, stopping when it reaches harder ones. This picturesque and massive one on the Atlantic coast is surrounded by granite monoliths and mountains, such as Sugar Loaf Mountain, and dotted with more than 130 small islands, the shores loaded with beaches and the famed Christ the Redeemer statue towering in the distance.

Guanabara Bay, about 19 miles long and 18 miles wide, is the largest in the world by water volume. The bay holds not just water but the history of Brazil.

There is evidence of native peoples at the bay dating back to prehistoric times. When Portuguese explorers landed there on a 16th-century January day, they thought they were at the mouth of a giant river, naming the spot River of January — Rio de Janeiro.

PARICUTÍN VOLCANO

One of the youngest volcanoes in the world, Paricutín erupted for nine years in the Mexican state of Michoacán, 200 miles west of Mexico City.

A cinder cone volcano, which erupts from a single opening in the earth’s crust and ends up with a bowl-shaped crater and steep sides, Paricutín lies on the Trans-Mexican Volcanic Belt, which includes the Sierra Nevada Mountain range.

Until 1943, Paricutín was not there. After weeks of small earthquakes and loud rumblings, a fissure opened in a local farmer’s cornfield and within hours, a crater had formed. The volcano rose 1,475 feet in its first year, continuing to spew lava and ash until 1952 and burying the town that is its namesake.

Paricutín now stands at 9,210 feet with a 660-foot-wide crater and is considered to be dormant. Earthquakes are still common in the area and the volcano remains hot enough that rainwater creates steam when it falls on it, but visitors can climb all the way to the top.

GREAT BARRIER REEF

There is only one living thing on Earth that is visible from space, and it lies underwater. The world’s largest formation created by organisms, the Great Barrier Reef is also the largest “rainforest of the sea.”

The small, soft-bodied coral polyp is responsible for the many coral reefs in the oceans, constructing hard exoskeletons for themselves out of calcium carbonate secretions. When they congregate together, the results are watery ecosystems teeming with life — and must-visit locations for every avid scuba diver and snorkeler.

The Great Barrier Reef covers 134,000 square miles off the northeastern coast of Australia, consisting of more than 900 islands and 3,000 distinct reef formations.

Although spectacular from above, the real action is underneath the surface. One of the most diverse ecosystems in the world, 25 percent of all known marine species can be found in the reef: 600 types of coral, 1,600 species of fish, rays, dolphins, sharks, whales, sea turtles, giant clams and the endangered Dugong, among them.

GRAND CANYON

Standing out among the many canyons formed along rivers across the world is the Grand Canyon in Arizona, in the southwestern United States, thanks to its seemingly never-ending vistas.

The gorge was carved over millions of years by the meandering Colorado River and now hits about 6,000 feet at its deepest point. The canyon, known for its rust reds and sedimentary stripes that keep geologic time, cuts through 277 miles in the desert. Some rock deposits found at the bottom date back 2 billion years.

As seen from its rims, the canyon stretches as far as the eye can see. Hiking trails lead through the surrounding desert landscape. It is also possible to hike all the way to the bottom or take a white- water rafting trip through the towering canyon walls.

From above, the South Rim — the most popular viewpoint — is open all year long. The North Rim is much more remote and less crowded, but is only open from May to October due to weather.

2023 Q1 LUXURY MARKET TRENDS

PENDING | JOHNLSCOTT.COM/67473

@JLSexceptionalhomes @exceptional_homesjls Connect with us:
Issuu converts static files into: digital portfolios, online yearbooks, online catalogs, digital photo albums and more. Sign up and create your flipbook.