ProjectProminenceInformationMemorandum

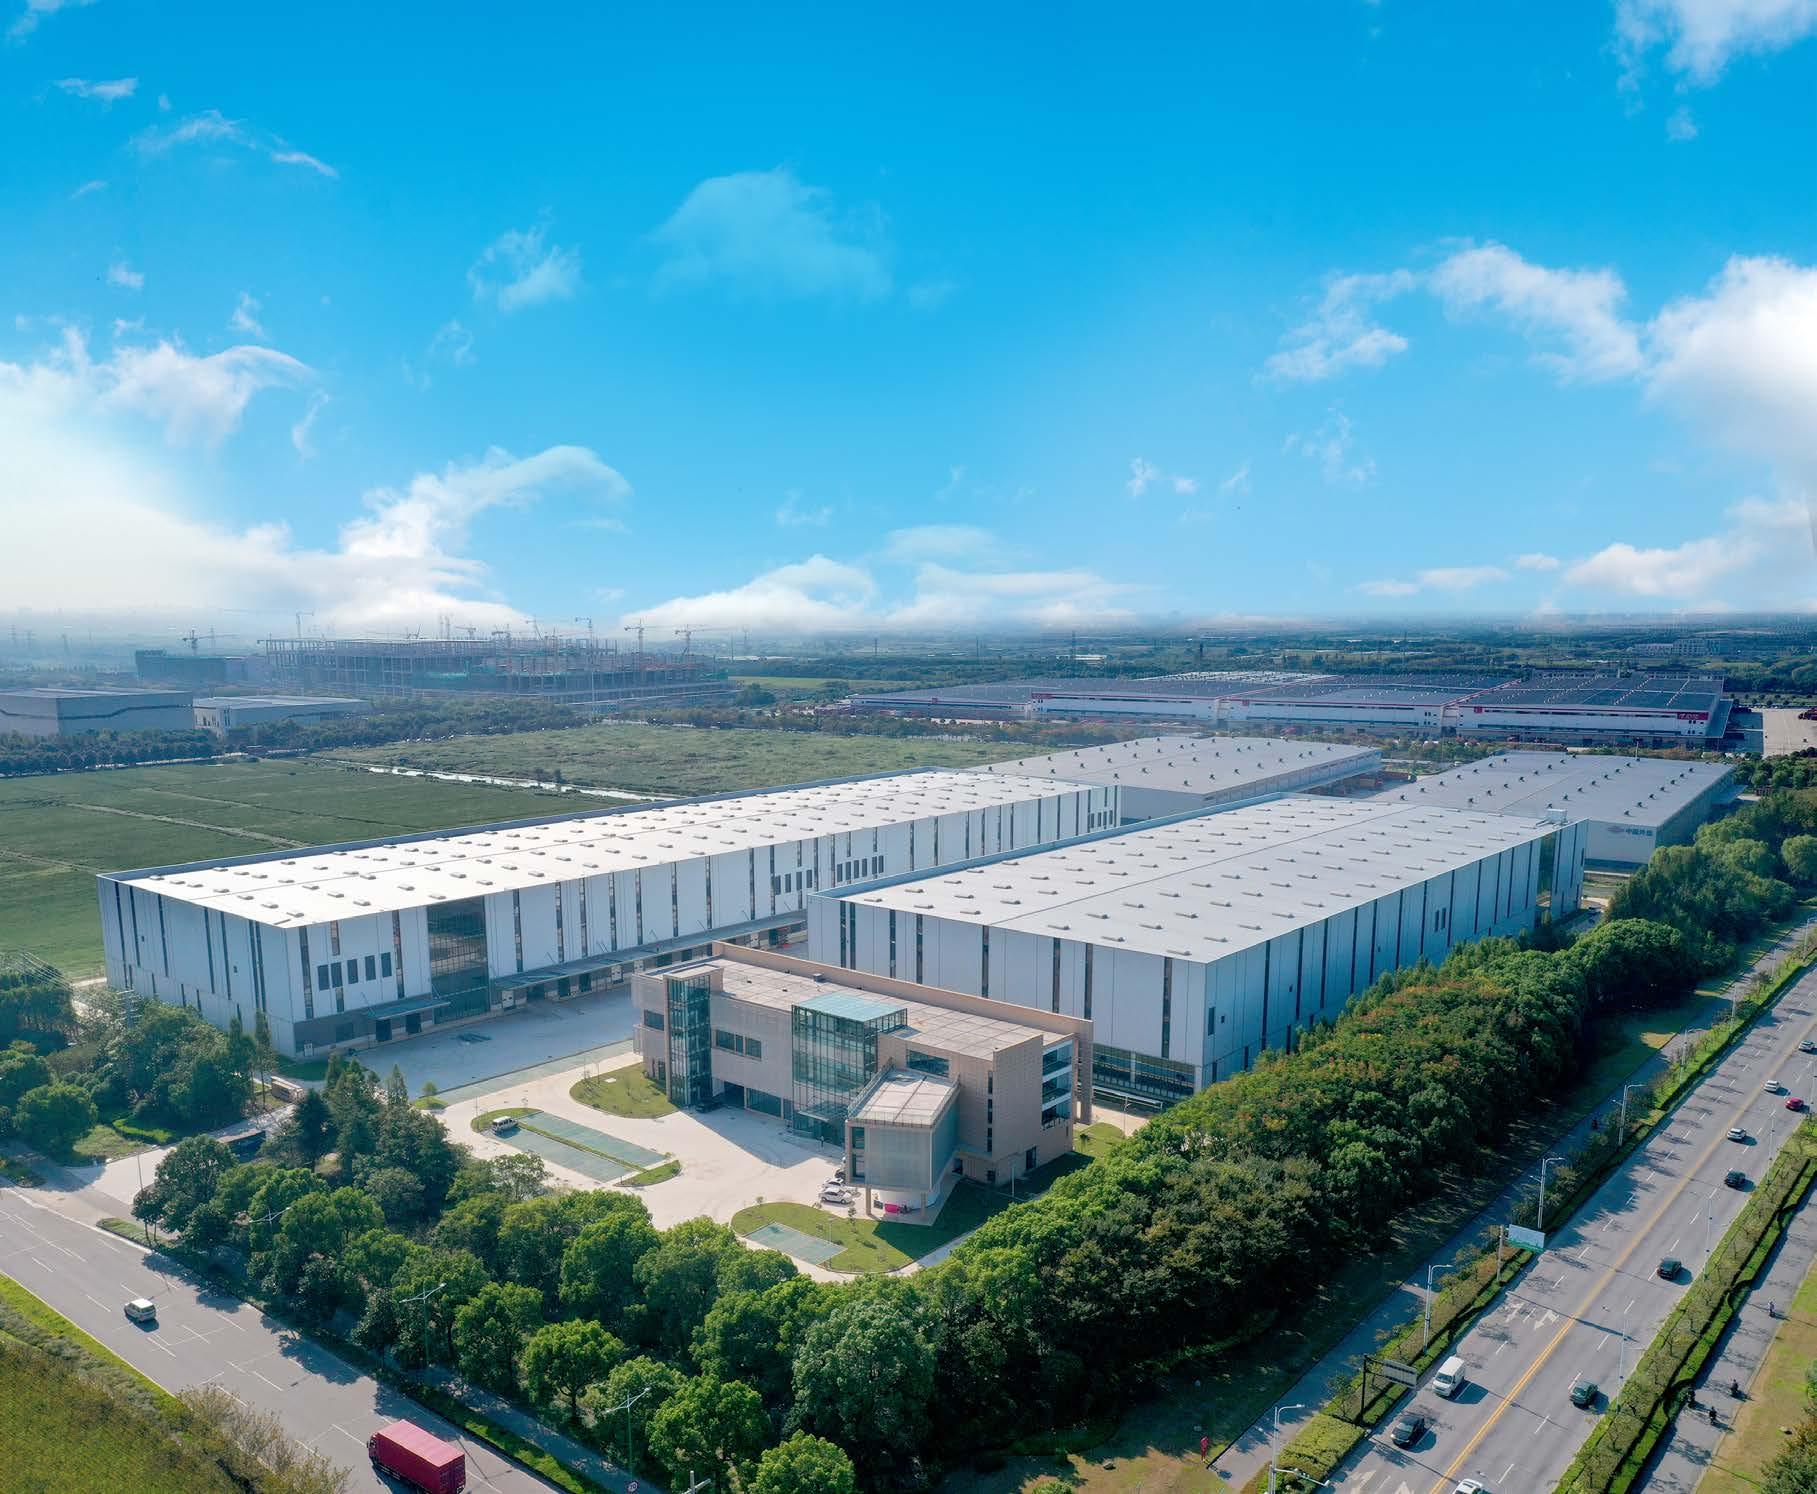
Table Contentsof 4 Introduction 6 The Opportunity 10 Key Investment Highlights 12 APAC Logistics Investment 14 Shanghai Leads China’s Transaction 16 YRD is the Largest & Most Significant 18 Recent Transactions in YRD 20 Strong Tenant Demand
Transaction Volume Significant 22 Portfolio Overview 24 Diversified Global & Domestic Blue Chip Tenants 26 Shanghai 34 Suzhou: Taicang 40 Suzhou: Kunshan and Wujiang 50 Hangzhou: Dajiangdong 54 Appendix 1: Development Opportunities Summary 56 Appendix 2: Development Opportunities Building Plan
Introduction 4
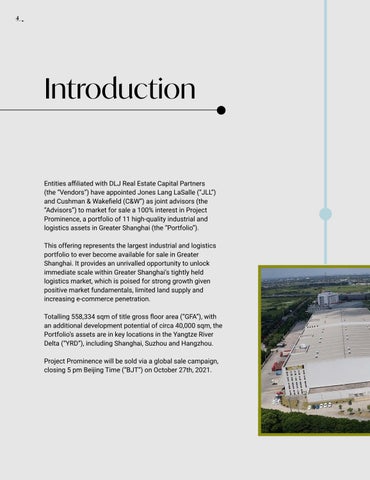
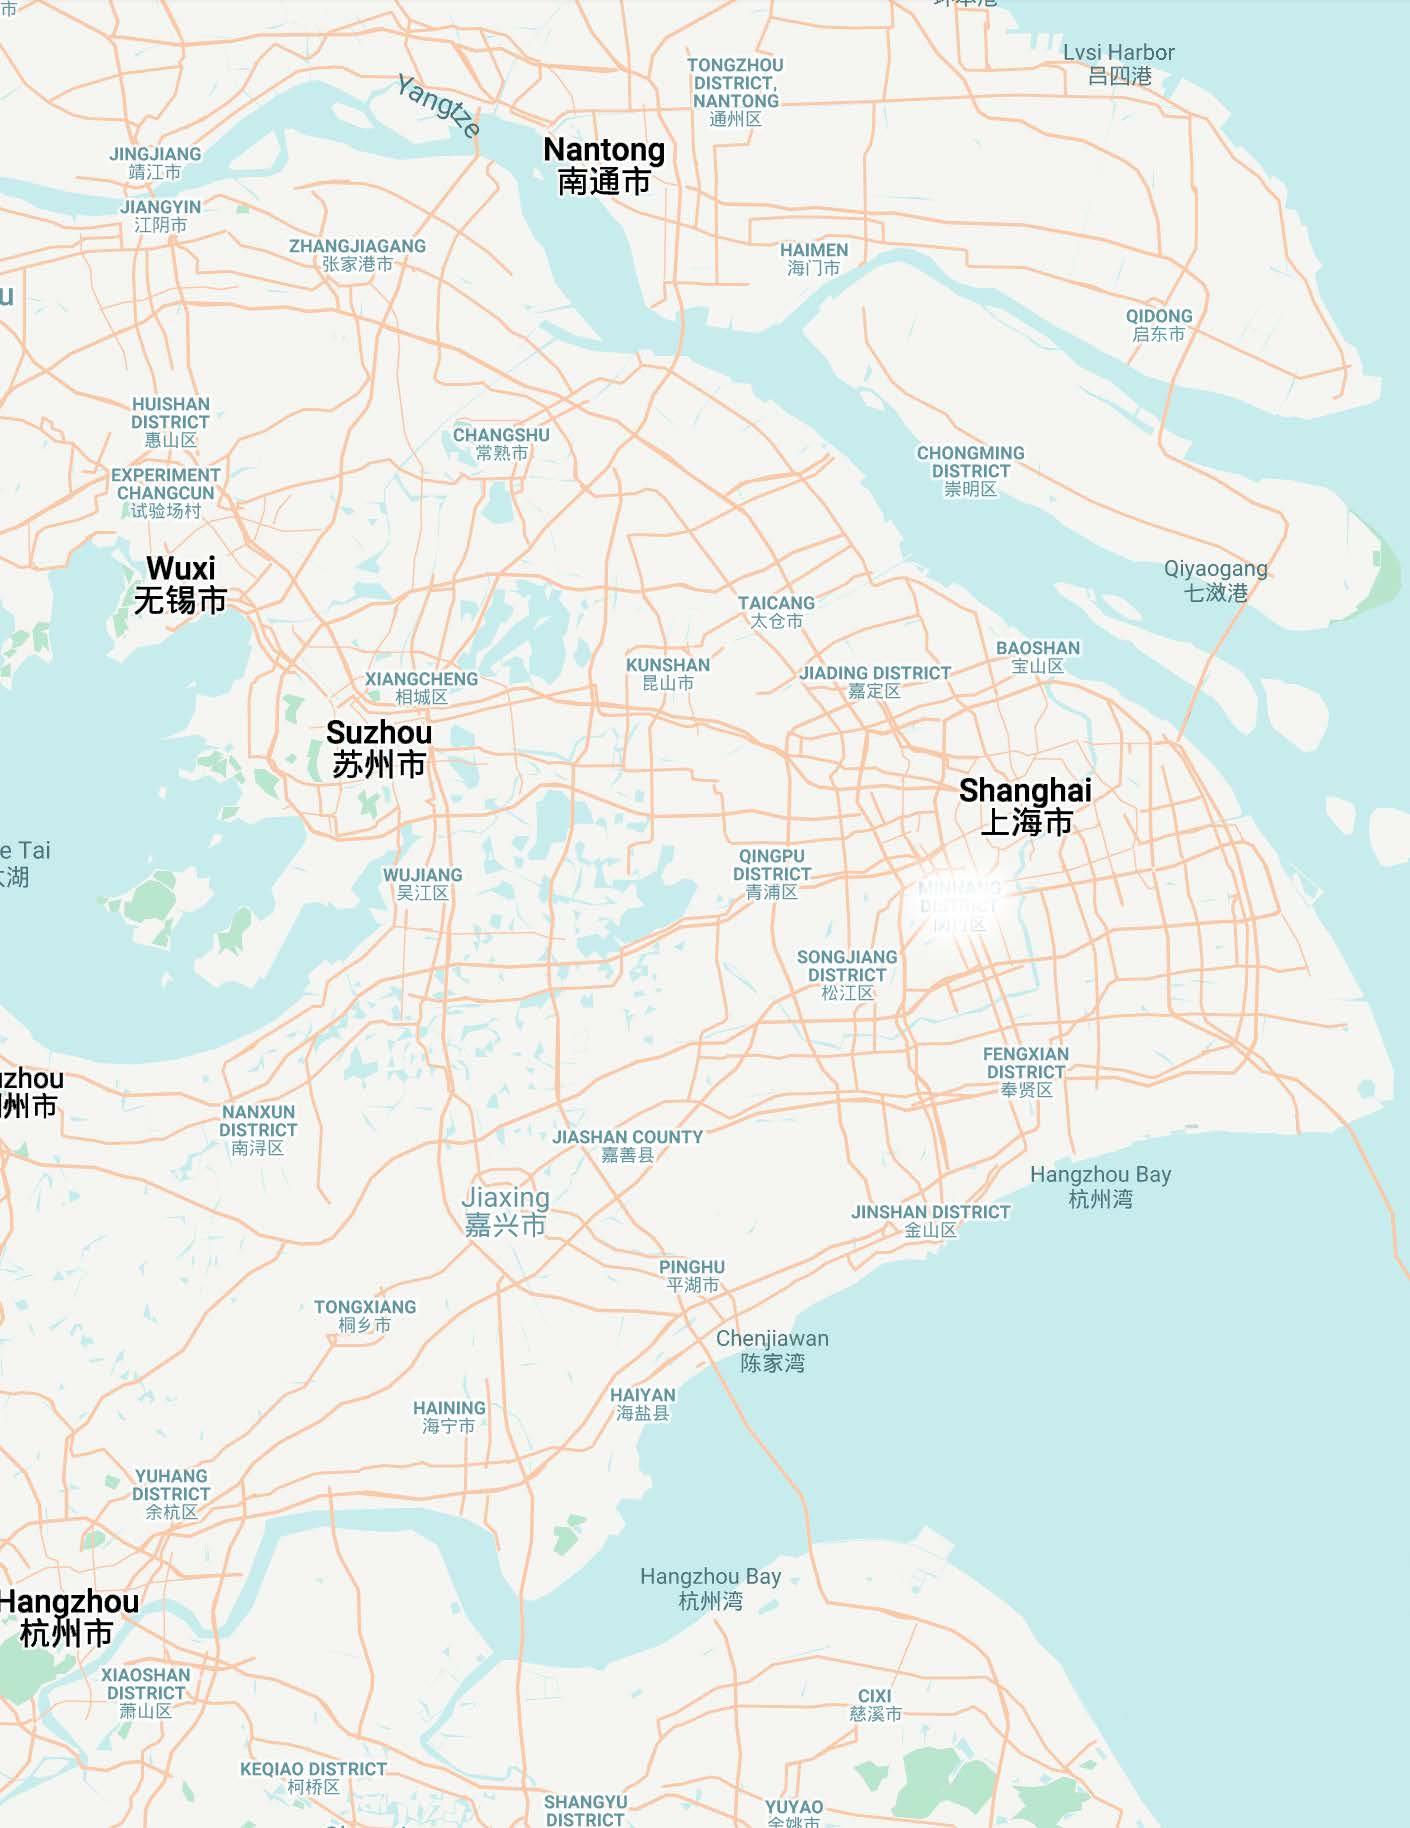
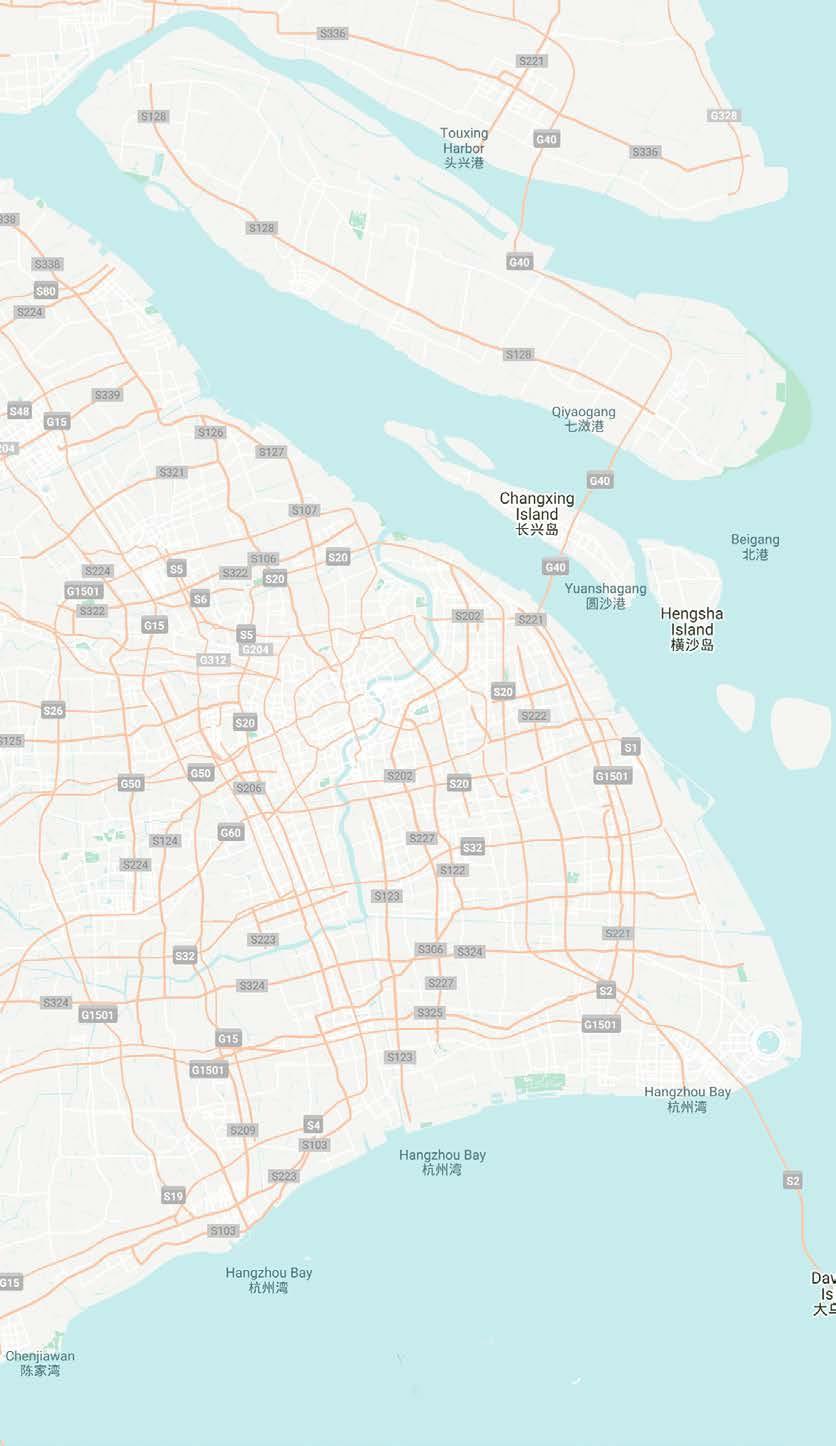
Totalling 558,334 sqm of title gross floor area (“GFA”), with an additional development potential of circa 40,000 sqm, the Portfolio’s assets are in key locations in the Yangtze River Delta (“YRD”), including Shanghai, Suzhou and Hangzhou. Project Prominence will be sold via a global sale campaign, closing 5 pm Beijing Time (“BJT”) on October 27th, 2021.
Entities affiliated with DLJ Real Estate Capital Partners (the “Vendors”) have appointed Jones Lang LaSalle (“JLL”) and Cushman & Wakefield (C&W”) as joint advisors (the “Advisors”) to market for sale a 100% interest in Project Prominence, a portfolio of 11 high-quality industrial and logistics assets in Greater Shanghai (the “Portfolio”). This offering represents the largest industrial and logistics portfolio to ever become available for sale in Greater Shanghai. It provides an unrivalled opportunity to unlock immediate scale within Greater Shanghai’s tightly held logistics market, which is poised for strong growth given positive market fundamentals, limited land supply and increasing e-commerce penetration.
5
OpportunityThe *Stabilized assets as at 2Q 2021 **Based on GFA Tenants 3211 Assets Est. NOI (2022) 204 millionRMB GFA (sqm) 558,334811,721 Land Area (sqm) Average Age** 4.7years WALE (NLA) 2.7 years Occupancy* 98 % Average Remaining Land Tenure** 38years 6
TaicangZeusNorthAndrew Fairway Fengxian Top Sumitomo Baba Wharf 9 7 6 Lear5 1 2 3 10 Minhang4 8 11 A B C D E F Shanghai Suzhou Legend: Hangzhou A Yangshan Deepwater Port (FTZ) B Pudong Airport (FTZ) C Zhangjing Hi-Tech Park D Waigaoqiao (FTZ) E Waigaoqiao Bonded Logistics Park (FTZ) F Hongqiao Airport 7
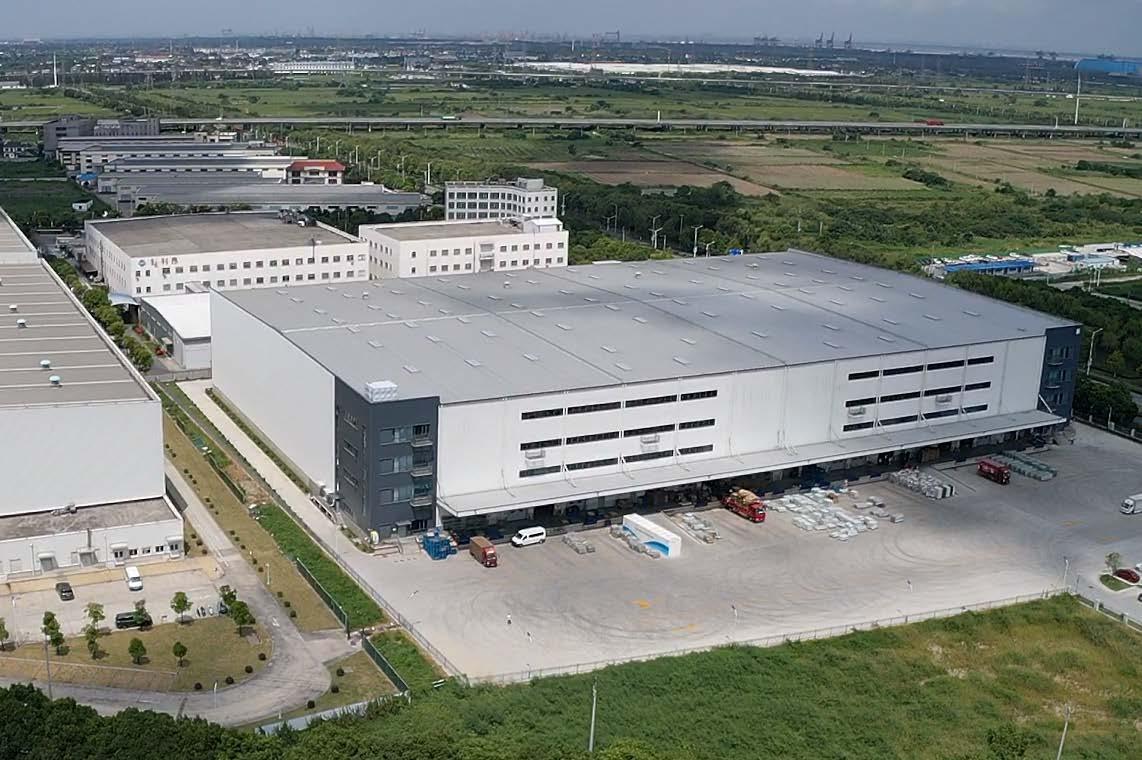
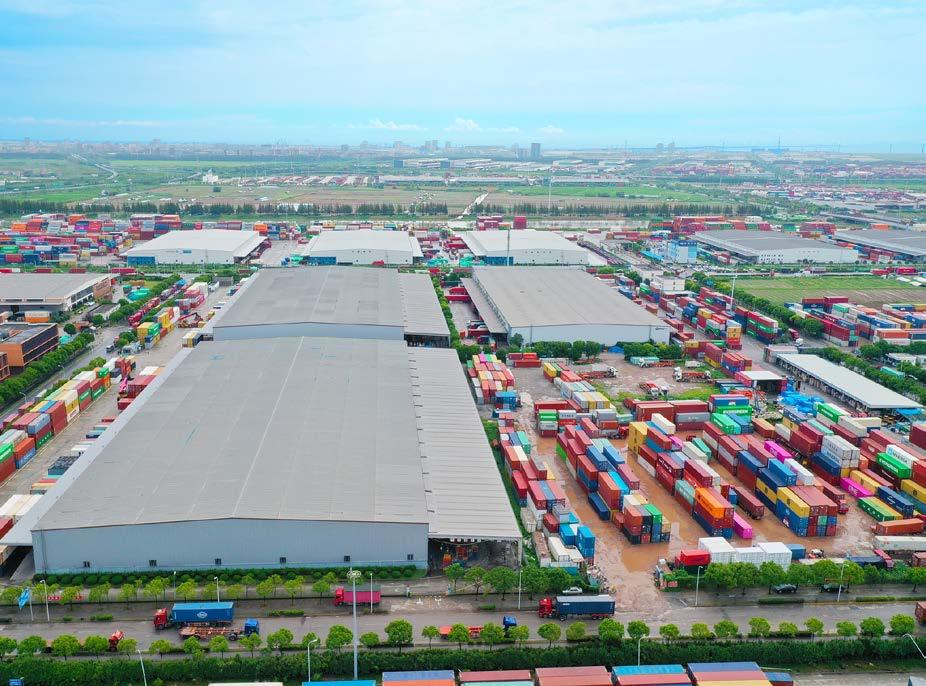
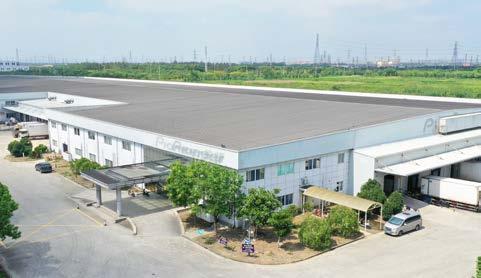
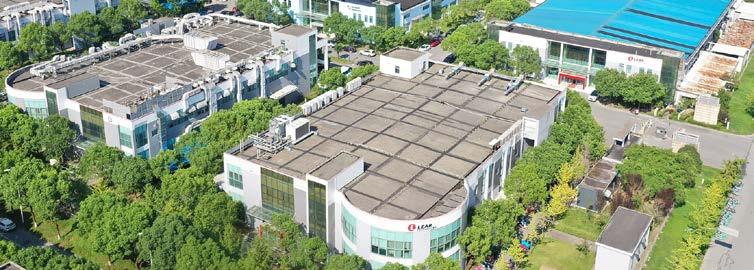
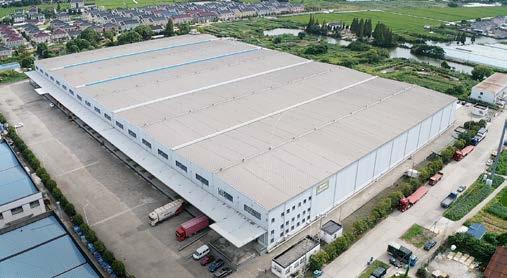
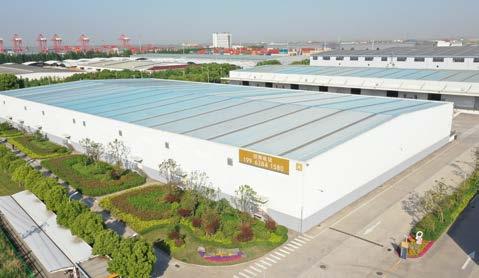
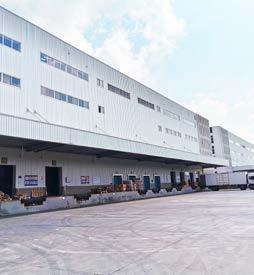
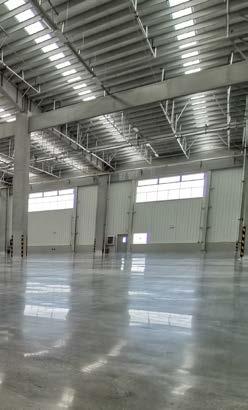
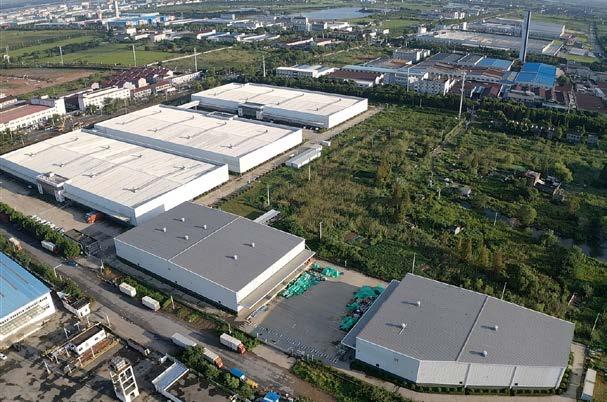
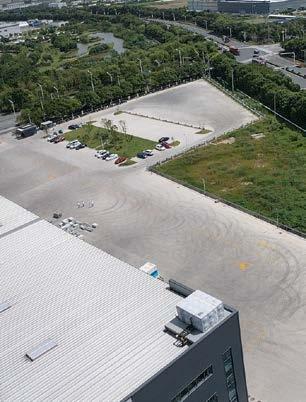
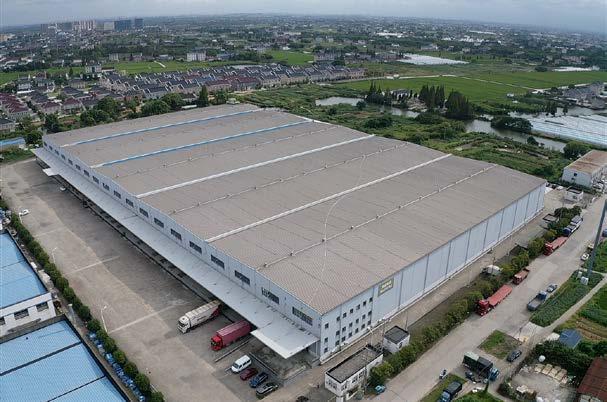
AssetsTheBABAANDREWFENGXIAN FAIRWAY WHARF SUMITOMO 8
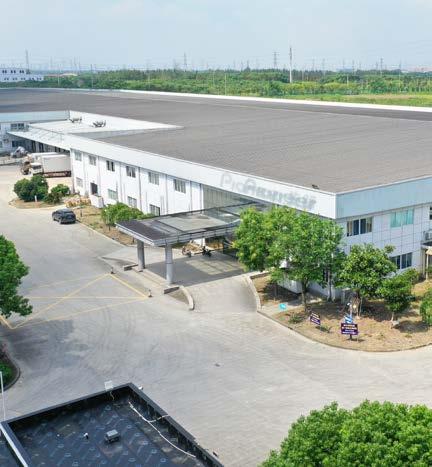
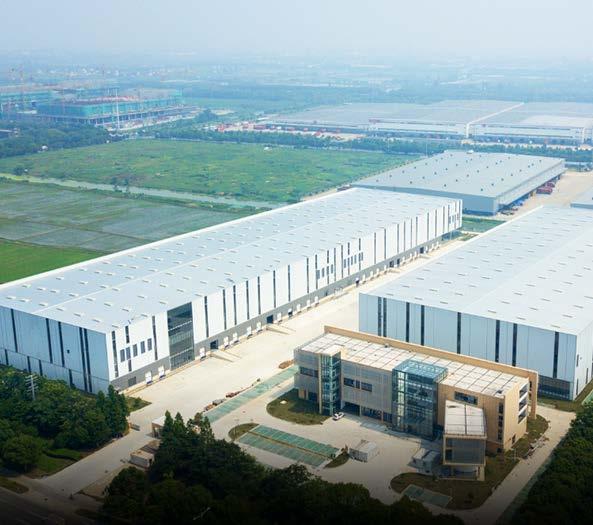
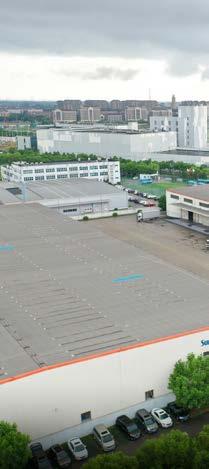
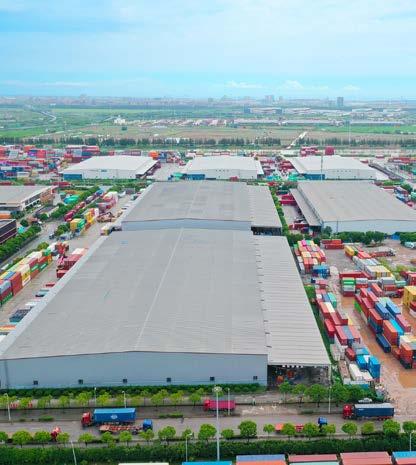
AssetsTheTOP TAICANG NORTH LEAR MINHANG ZEUS 9
Extremely OpportunityTransformativeRare,ofScale in the Tightly Held Greater Shanghai Logistics Market • Largest ever industrial and logistics portfolio offering in Greater Shanghai, where it is difficult to aggregate scale • Instantly becoming a significant logistics owner and/or enhancing assets under management in China’s most sought after market Key HighlightsInvestment Portfolio Composition with Strategically and High-quality Building Specifications • 11 assets in total, including 3 projects that build-able GFA of c.40,000 sqm • Assets are well-located in close proximity networks and key logistics hubs • Guaranteed portfolio premium delivered scarce availability • Substantial tax contributions to the various its tenant base China InvestmentLogisticsProposition • China’s real GDP at 8.4% compared • E-Commerce sales to reach USD 2.78 of all retail sales and 15.3% in the • China logistics is context and provides • Shanghai logistics are set to outpace • Recent supportstransactionsincreasing 10
Compelling PropositionGDPgrowthin
Logistics Presents a 2021 is estimated compared with 6.0% of the world* sales in China in 2021 is expected 2.78 trillion, accounting for 52.1% sales comparing with only 0.93 trillion the US, respectively is attractively priced in a global provides solid risk-adjusted returns logistics rental growth in 2022 and 2023 outpace almost all major APAC markets transactions surge in China and APAC increasing preference for YRD Logistics*Source:IMF
11
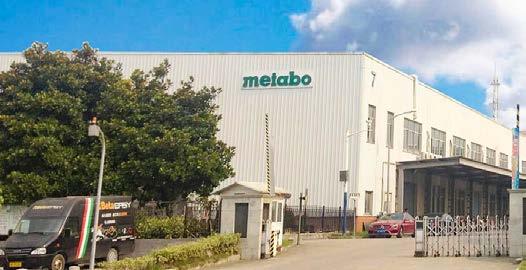
Strategically Located Assets Specificationsthatcandevelop an additional proximity to major infrastructure delivered through scale amongst various local governments through Diversified Global and Domestic Blue Chip Tenant Base Underpin Income Stability and Rental Growth • Sumitomo • Baozun • Mitsui • Staples • Metabo • Lear • Want Want group, and many more
• In 2Q21, logistics investments in Asia Pacific rose to USD 15bn, up 215% yoy. Total investments over the last four quarters reached USD 44 bn, compared to USD 25bn in 2019.
APAC Logistics Investment Volume has hit an all-time high, and shows no slowdown in momentum
• Larger deals are getting done. Logistics deals over USD 300mn quadrupled in the last two years. Three deals in Australia made up USD 5bn in the Q2 2021
• Expect logistics investments to double to USD 50-60bn a year, where logistics fund flows doubled in 2020 and accelerated in 1H21. JLL expect Asia Pacific investors to increase their exposure to logistics from 16% currently to 20-23%. If this reallocation is done over 4-5 years, expected logistics transactions to double to USD 50-60bn a year, from USD 25-30 bn in 2019-2020
• Currently, 66% of Asia Pacific investors’ portfolios are allocated to office and retail assets, much higher than 45-55% in Europe and US. We also expect funds to reduce their retail exposure and significantly increase their residential exposure in Asia Pacific, bringing a mix of residential and logistics to a third of portfolios, with logistics being more favoured
1H19 1H20 1H21 China Japan Australia South Korea Singapore Hong Kong Source:India JLL Estimates APAC Logistics Investment Expected to be More Active driven by allocation needs from global logistics funds 12
10% vs 1H19 23% 59% 3% 21% 42% 74% 80%60%40%20%0%-20%-40%-60%3025201510-5 China Japan Australia South Korea Singapore Hong Kong India BnUSD Asia Pacific Transaction Volumes in 1H2021 (All Sectors)
15% 30% 21% 15% 36% 36% 35% 31% 23% 16% 9% 20% 11% 6% 24% 22% 7% 8% 7% 5%100%90%80%70%60%50%40%30%20%10%0% Asia Pacific Asia Pacific Europe North America Target Current Asia Pacific Logistics Investment Volume Asia Pacific Logistics Funds Raised by Vintage Shifting allocation trend indicates more investments will be made into the Industrial and Logistics sector Source: ANREV, Preqin, JLL Estimates Retail Office Industrial/Logistics Residential Healthcare Student Accommodation Developement Other 1614121086420 1Q 19 2Q 19 3Q 19 4Q 19 1Q 20 2Q 20 3Q 20 4Q 20 1Q 21 2Q 21 bnUSD 20.018.016.014.012.010.08.06.04.02.02011 2012 2013 2014 2015 2016 2017 2018 2019 2020 2021E bnUSD AsiaTargetPacific PacificAsia CurrentEurope AmericaNorth 13
Shanghai Beijing Guangzhou Shenzhen Multipe/Others Office Retail Logistics Others • Total transactions in 2Q2021 reached RMB 78.2 billion, the most active 2Q on record • Shanghai is still the preferred investment destination, accounting for 48.6% of all China transactions in 2Q2021 • Strong demand for Shanghai logistics will drive yields lower Transaction Volume by Asset Type (Value) Historical Investment Destination (by Transaction Value) 100%90%80%70%60%50%40%30%20%10%0% 2008 2009 2010 2011 2012 2013 2014 2015 2016 2017 2018 2019 2020 2021Q2 Shanghai Leads China’s Transaction Volume during 2021 across sectors Source: JLL VAS, JLL Capital Markets 2019 2021 Q2 43% 53% 13%17% 16% 5% 28%25% 14
300250200150100500 2008 2009 2010 2011 2012 2013 2014 2015 2016 2017 2018 2019 2020 2021H1 RMBbn Historical China Transaction Volume Historical Shanghai Transaction Volume Source: JLL Research ¥120¥100¥80¥60¥40¥20¥0 2008 2009 2010 2011 2012 2013 2014 2015 2016 2017 2018 2019 2020 2021H1 RMBbn Q1 Q2 Q3 Q4 15
YRD is the Largest & Most Significant I&L Cluster in China Non-bonded Rents Supply and Vacancy, YRD Supply and Vacancy 1.51.00.5 -5%0%5%10%2.0 RMB/sqm/day (Y-oY)RateGrowth Shanghai Kunshan Suzhou Jiaxing ChangshuTaicang Hangzhou*Wuxi* Nanjing* Ningbo* (sqm)Millions RateVacancy4.03.53.02.52.01.51.00.50.0 40%35%30%25%20%15%10%5%0% 1234567 0%10%20%40%30%(sqm)Millions RateVacancy Shanghai Kunshan Jiaxing ChangshuTaicangSuzhou Hangzhou*Wuxi* Nanjing Y-o-y Growth Rate (RHS) Average Rents (LHS) Stock 1Q21 New Supply 2Q21 2Q21 Vacancy New Supply (LHS) Net Absorption (LHS) Vacancy Rate (RHS) Source: JLL Research, Logistics Intelligence Service, 2Q21*Wuxi and Hangzhou data are updated every 2Q and 4Q. Ningbo is updated every 4Q. Locations of the Underlying Assets in the Portfolio Locations of the Underlying Assets in the Portfolio 16
China Non-Bonded Grade A Logistics Stock
•
The total combined stock of Kunshan, Changshu, Taicang and Jiaxing is as large as that of Shanghai, accounting for 24% of the YRD.
Stocks (sqm)
Source: JLL VAS
• Some satellite locations are extremely well-positioned for regional distribution, such as Taicang, Wujiang and Kunshan, which are receiving growing investments
Xi’an Shenyang 9,969,001 – 21,650,000 3,003,001 – 9,969,000 1,066,001 – 3,003,000 117,000 – 1,066,000 2,574,001 – 6,209,000 1,016,001 – 2,574,000 520,001 – 1,016,000 176,000 – 520,000 Grade A Logistics
YRD is by far the largest cluster in China, in terms of population, GDP and logistics stock. According to JLL Valuation and Advisory Services’ research, the Yangtze River Delta is home to a concentration of 32% of China’s Non-bonded Grade-A logistics stock Limited land availability in Shanghai has resulted in development and tenant demand spilling over to satellite markets of the YRD
Hefei
•
Wuhan Chengdu-Chongqing Yangtze River Delta Pearl River Delta
Nanjing Changzhou ChangshuNantongTaicangJiaxing HangzhouShaoxingJinhua Ningbo Wuxi Suzhou*Kunshan Shanghai 17
*Excluding Kunshan, Taicang, Changshu
•
• Strong demand has resulted in persistently strong performance in Shanghai and its nearby satellite markets
Non-bonded
TransactionsRecent in YRD Demonstrate Continued Yield Compression Shenzhen Beijing Shanghai Kunshan Guangzhou Suzhou Langfang Taicang Jiaxing Tianjing Changshu Nanjing Wuhan Chengdu Shenyang Chongqing 12,00010,0008,0004,0002,00006,000 5.5%7.0%6.5%6.0%5.0%4.5%4.0%sqm/RMB 2Q2021 Logistics NOI Yields of major cities in China Recent portfolio transactions indicate yield ranges from 5.0%-5.5% dependent on the portfolio composition between Tier 1 & Tier 2 cities. 2Q21 Capital Values (LHS) 2Q21 NOI Yields (RHS) Locations of the Underlying Assets in the Portfolio 18
12%11%10%9%8%7%6%5%4%3%10,0009,0008,0007,0006,0005,0004,0003,000 2007 2008 2009 2010 2011 2012 2013 2014 2015 2016 2017 2018 2019 2020 2021* 2022* 2023* Yield Trend in Shanghai Logistics Transactions, 2012-2020 Source: JLL Research, Logistics Intelligence Service, 2Q21Capital Value NOI Yield * Forecasts 19
China is leading the growth of E-commerce sales and third-party logistics E-commerce sales have grown by a remarkable 27.5% from 2019 to 2020 reaching US$2.3 trillion. According to e-Marketer, e-commerce in China will account for more than 52% of retail sales in 2021; significantly higher than the USA (15%), UK (28.3%) and Korea (28.9%) To put into perspective, the forecast growth in e-commerce sales for China from 2020 to 2024 of circa US$ 1.2 trillion, is roughly equivalent to the entire e-commerce sales market of the USA by 2024 In 2020, China’s 3PL size was approximately US$ 331 million, achieving a CAGR of 16.6% over the 2013-2020 period. 3PL will continue to grow in line with consumer demand, in turn driving the demand for logistics real estate on the Back of Business
•
Strong DemandTenant
Expansion 2020 Global E-commerce Penetration Source: NAB, ABS, ONS, US Commerce Department and National Bureau of Statistics of China, JLL Research (January 2021) 29% 26% 19% 15% 12% China 30.0%25.0%20.0%15.0%10.0%5.0%0.0% UK USA Canada Australia 20
•
Successful
•
Growth of E-Commerce Sales (2019-2024), China Growth of E-Commerce Sales (2019-2024), USA Trillion USD and % of total retail sales 34.1% 44.8% 52.1% 55.6% 57.0% 58.1% $1.801 $2.297 $2.779 $3.085 $3.331 $3.565 2019 2020 2021 2022 2023 2024 $0.59811.0%2019 $0.79214.0%2020 $0.93315.3%2021 $1.08916.7%2022 $1.26215.9%2023 $1.44914.8%2024 Trillion USD and % of total retail sales % of Total Retail Sales Retail Ecommerce Sales % of Total Retail Sales Retail Ecommerce Sales Source: e-Marketer 21
PROJECT MARKETSUB- ADDRESS USAGELAND (SQM)LANDAREA (SQM)GFA (SQM)NLA 1 Wharf LingangShanghai 99 Jiehang Road, Lingang Warehouse 66,001 36,921 41,163 2 Fengxian FengxianShanghai 3111 HuanchengWest Road, Fengxian Industrial 56,665 29,854 30,069 3 Sumitomo SongjiangShanghai 301 Shuya Road, Songjiang Industrial* 51,982 27,080 27,393 4 Minhang MinhangShanghai 3585 Sanlu Gong lu, Minhang Industrial 9,725 20,583 18,892 5 Lear ZhangjiangShanghai 509 Road,RenqingPudong Industrial 83,683 13,058 13,058 6 Andrew TaicangSuzhou 7 Beihuan Road, Taicang Warehouse 181,968 134,089 138,302 7 Zeus TaicangSuzhou East Road,TonggangTaicnag Warehouse 89,679 82,817** 84,252 8 Top WujiangSuzhou 1799 WujiangRoad,KuxingLili, Warehouse 84,310 44,356** 44,992 9 Taicang North TaicangSuzhou 18 Town,Road,DianduchangHuangjingTaicang Warehouse 61,903 30,901** 31,933 10 Fairway KunshanSuzhou 399 Middle Yuxi Road, Kunshan Industrial* 66,241 75,635 76,691 11 Baba DajiangdongHangzhou 888 Jiangdong Yi Road, Hangzhou Industrial* 59,564 63,039 62,628 Total 811,721 558,334 569,373 Portfolio Overview *Industrial with warehouse usage permission **There is additional development potential on vacant lands in Projects Taicang North, Zeus, and Top, amounting to an additional 23,388 sqm, 9,180 sqm and 7,006 sqm buildable GFA respectively ***Weighted average based on NLA, excluding Project Fairway 22
(SQM)NLA OCCUPANCY(2Q2021) (ON(YEARS)WALENLA) PROJECTEDNOI2022 41,163 100% 4.50 19,113,766 30,069 100% 16.80 6,756,407 27,393 100% 2.30 13,615,036 18,892 100% 6.15 8,208,994 13,058 100% 2.10 8,988,987 138,302 100% 0.95 44,109,695 84,252 95% 1.40 27,285,702 44,992 100% 1.20 14,689,807 31,933 86% 2.50 9,721,625 76,691 0% - 32,136,879 62,628 96% 0.70 20,190,711 569,373 98%*** 2.70*** 204,817,607 9. Taicang North 1. Wharf 5. Lear 6. 2.10.AndrewFairwayFengxian 11. Baba 7. Zeus 3. Sumitomo 4. Minhang 8. Top 24% 15% 8% 5%14% 11% 7% 5% 22%5%4%2% 13% 5%7%16% 10% 9% 3% 7%4%4%CompositionGFA2022NOIContribution respectively 23
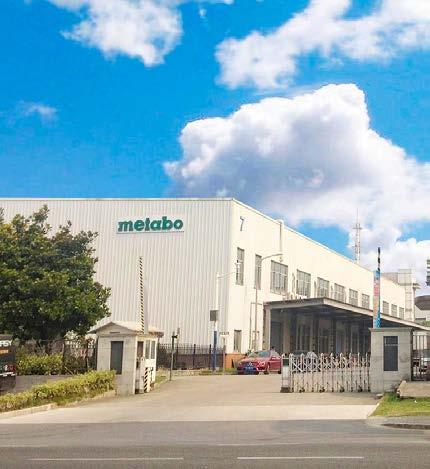
• Metabo ranks Germany’s second largest professional power tools manufacturer invested by KKR, it’s market share in making woodworking machinery in Europe ranks leading position
Notable Tenant Background
Diversified Global & Domestic Blue Chip Tenants Tenant Diversification 72% 3%6% 3% 6% 1% 8% FurniturePharmaceuticalFMCGFashionE-commerce & 3PL AutomobileLogisticsCold-ChainRobots
24
• Lear Corporation is an American Fortune 500 company that manufactures automotive seating and automotive electrical systems
• Want Want Group is a renowned Chinese manufacturer of snack foods and beverages listed in Hong Kong
• Baozun is a Chinese company listed in the US and HK that provides an E-commerce business platform. It is also a leading digital technology and solution company of China with the market cap over 1.5 billion USD
• Staples is a global leader in stationery supply and custom made stationery e-commerce platform. It is also listed in Fortune 500 companies
• Sumitomo Heavy Industrial is a global leader in heavy industrial machinery manufacture industry
Access to Select Key Tenant Relationships


Tenants
25


The city’s total population is estimated to be 27.8 million, with an annual population growth of 2.7% p.a. over the past 5 years. The city is expected to reach 30 million inhabitants by 2025. Per-capita disposable income of Shanghai’s permanent residents reached RMB72,200, a 4% increase year-on-year. Per capita disposable income climbed by 3.8% and 5.2% respectively amongst urban and rural residents. 1.71.61.51.41.31.21.11.00.90.8
Analysis SHANGHAI
Sub-market
Shanghai’s gross domestic product reached RMB3.87 trillion (US$597 billion) in 2020 in a 1.7% annual rise. Shanghai alone represented approximately 4% of China’s entire GDP.
-10%-15%-5%0%5%10%15%20%
2007 2008 2009 2010 2011 2012 2013 2014 2015 2016 2017 2018 2019 2020 2021* 2022* 2023* day)persqmperRMB(Rent Forecast Jiading Songjiang Qingpu Northwest Minhang Jinshan Baoshan 1.41.31.21.11.0 1.51 1.54 1.56 1.79 1.68 1.22 1.60 1.40 1.69 1.72 1.70 1.33 1.91.81.71.61.5 Fengxian Pudong PVG Waigaoqiao Lingang day)persqmperRMB(Rent Forecasted rents for Shanghai remains on an upward trend, with an average of RMB1.6/sqm/day expected daily rent level by 2023 2Q 2021 Shanghai Sub-Market Average Effective Rents Non-Bonded Rent (LHS) Chainlink* T-o_t Growth Rate (RHS) 26
Shanghai’s total supply remains at healthy levels, with upcoming new stock expected to be concentrated in Jinshan and Qingpu. With the exception of Jinshan and Waigaoqiao, Shanghai’s sub-markets at currently at historical lows in terms of vacancy, as tenants’ and occupiers’ demands continue to snap up well-located and modern spec properties 1,0001,2001,4001,6001,800800600400200 Jiading Songjiang Qingpu Northwest Minhang Jinshan Baoshan Fengxian Pudong PVG Waigaoqiao Lingang GFA (’000 sqm) 1,0009008007006005004003002001000 Jiading Songjiang Qingpu Northwest Minhang Jinshan Baoshan Fengxian Pudong PVG Waigaoqiao Lingang 3.1% 0.5% 0.0% 2.4% 1.8% 1.2% 39.6% 4.4% GFA (’000 sqm) Non-bonded Supply Through 2023 Vacancy Rates as at 2Q 2021 Songjiang902ksqm Northwest314ksqm813kQingpusqmJiading391ksqm 485kBaoshansqm Waigaoqiao177ksqm 543kPVGsqm 508kPudongsqm364kMinhangsqm 692kFengxiansqm543kJinshansqm 799kLingangsqm Stock as of 2Q21 2021 Forecast Occupied Vacant2022 Forecast 2023 Forecast ShanghaiWest51%ShanghaiEast31%Others18% 2Q21 New Supply 1Q21 Stock East OthersWestShanghaiShanghai 27
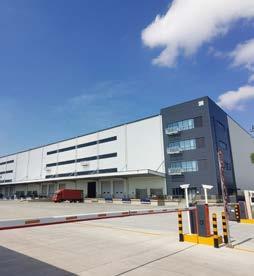
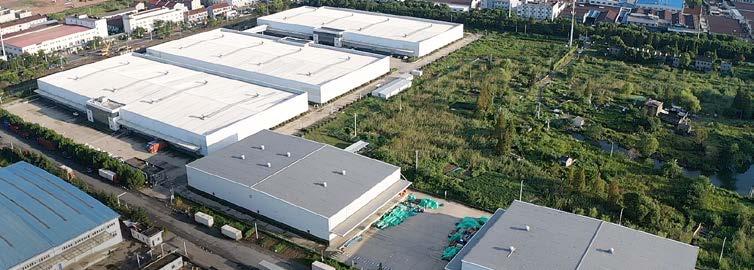
Location 上海浦东临港捷航路99弄1-3、5号 99 Jiehang Road, Lingang Current Occupancy 100% Land Zoning Warehouse Remaining Land Tenure 37 years (until 19/3/2058) Land Area (sqm) 66,001 Total GFA (sqm) 36,921 Total NLA (sqm) 41,163 Completion Date 2014 Clear Ceiling Height (m) 9.5m Building Design Specifications 2 Single-storey warehouses Floor Loading 3 tonnes/sqm In-place Rent (Incl VAT & PM fee) RMB/sqm/day 1.63 Major Tenant(s) 3PLs Commentary Extremely rare single-story cross-docking warehouse in Lingang FTZ, built on warehouse usage land. Strong potential of future cap rate compression due to lack of supply in the sub-market. Assets Summary SHANGHAI Wharf 28
上海奉贤区环城西路3111弄183号 3111 West Huancheng Road, Fengxian 上海松江区书崖路301号 301 Shuya Road, Songjiang 100% 100% Industrial Industrial 37 years (until 13/3/2058) 35 years (until 5/9/2056) 56,665 51,982 29,854 27,080 30,069 27,393 2008 2011 7.5m 10m Single-storey warehouse 2 Single-storey warehouses 1F: 5 tonnes/sqm 3 tonnes/sqm 1.00 1.77 A Cold-chain Operator Manufacturer and 3PLs An excellent opportunity for cold storage exposure. Cold-chain equipment and installations was invested by the tenant, with a stable income and long-term lease. Located in the best part of Songjiang, only 12 km to Hongqiao Airport. International tenants with strong tax contribution. Fengxian Sumitomo 29
Location 上海闵行区三鲁公路3585号 3585 Sanlu Gonglu, Minhang Current Occupancy 100% Land Zoning Industrial (Manufacturing) Remaining Land Tenure 36 years (until 9/9/2057) Land Area (sqm) 9,725 Total GFA (sqm) 20,583 Total NLA (sqm) 18,892 Completion Date 2004 Clear Ceiling Height (m) 1/F and 2/F: 4.2m Office: 2.7m Building Design Specifications 1 Double-storey Manufacturing Building Floor Loading 1/F: 3 tonnes/sqm 2/F: 0.25- 4 tonnes/sqm In-place Rent (Incl VAT & PM fee) RMB/sqm/day 1.62 Major Tenant(s) Power Tools Manufacturer Commentary 1.3km to closest subway station, stable income and with a single MNC tenant with strong business growth Assets Summary SHANGHAI Minhang 30
上海浦东新区仁庆路509号 509 Renqing Road, Pudong Industrial100% 33 years (untill13,05813,05883,6839/21/2054)2007 1/F:6 m 2/F:5 m Building 2 Double-storey Industrial Park Buildings, 1 Single-storey Industrial Park Building tonnes/sqm 1/F: 0.5 tonnes/sqm 2/F: 0.3 tonnes/sqm 1.95 Pharmaceutical company and automotive parts manufacturer long-term lease growth potential. A highly sought-after asset for blue-chip pharmaceutical and medical equipment tenants, the property has strong historical rental growth. Lear 31
SHANGHAI Recent ComparablesRental PROJECT LOCATION DEVELOPER/OWNER (SQM)GFA OCCUPANCY 1 ESR Songjiang East Logistics Park 松江区申港路与书慧路交叉口 ESR 47,509 100% 2 ESR Songjiang Xinqiao Logistics Park 上海松江民益路95号 ESR 85,678 3 GLP Songjiang Dongjing 上海松江洞薛路885号 ESR 110,242 100% 4 GLP Park Lingang 555,上海浦东新区临港新城同顺大道665,666,康祥路28,88号 GLP 746,386 5 GLP (Vailog) Lingang 浦东新区天高路1318号 Vailog 45,357 100% 6 Goodman InternationalFengxianLogistics Park 上海市奉贤区金海公路6671号 Goodman 125,750 100% 7 GLP Park Fengcheng 上海市大叶公路北150米 GLP 74,300 8 GLP Lingang Fengxian 上海市奉贤区平霄路500号 GLP 161,000 9 GLP Park Minhang 上海市闵行区莲花南路3000号 GLP 51,303 100% 10 Vailog Zhuanqiao Logistics Park 上海市闵行区向阳路1135号 Vailog 46,229 100% 11 Vailog Xinzhuang Logistics Park 上海市闵行区春康路 Vailog 38,000 100% 12 GLP Heqing Logistics Park 上海张江东胜路229号 GLP 117,000 100% 13 Zhongchu Logistics Park 上海张江仁庆路200号 CMST 30,000 100% 14 GLP Jinqiao Industrial Park 上海张江王桥路786号 GLP 155,000 Comparable Non-bonded Logistics Properties in Relevant Shanghai Submarkets 32
OCCUPANCY(%) FACE RENTS (INCL OF PM, EXCL [RMB/SQM/DAY]VAT) 100% 1.60-1.65 88% 1.65-1.70 100% 1.75-1.80 98% 1.55-1.60 100% 1.50-1.55 100% 1.60-1.65 95% 1.50-1.55 95% 1.50-1.55 100% 1.80-1.85 100% 1.90-1.95 100% 1.83-1.88 100% 1.9-2.0 100% 1.9-2.0 90% 1.8-1.9
MinhangLear
Fengxian Wharf Sumitomo 33
• As of the second quarter of 2021, the total stock of Grade-A non-bonded warehouses in Taicang is 1,098,159 square meters.
Sub-market Analysis
Total Stock and Future Supply
TAICANG
• Taicang Grade A rents expected to grow by approximately 4% -5% for the next several years. 12.0%10.0%8.0%6.0%4.0%2.0%0.0%1.51.41.31.21.11.00.90.80.70.60.5
• Due to the tight supply in the past two years, the face rent of Taicang market has increased from 1.26 RMB/sqm/day to 1.32 RMB/sqm/day from 2020 to 2021 (PM fee inclusive, VAT exclusive), with escalation of 4.8%.
• Due to the increasingly strong government interventions on tax contribution, investment intensity and assessment on industry types of occupiers, the actual new supply added in Taicang will be limited. As the supply of first-hand logistics land has been extremely limited, new logistics warehouse supply in Taicang will be mainly developed from second-hand industrial land with uncertainties from planning approval. Rent and Vacancy
• Taicang is a county-level city of Suzhou and is one of the satellite cities of Shanghai. Following the completion of the Shanghai-Nantong Railway, coupled with steadily improving highway networks, Taicang will form an “one-hour transportation circle” with Shanghai, Suzhou, Nantong and Hangzhou.
Market Face Rent and Escalation Face Rent Escalation
2015 2016 2017 2018 2019 2020 2021* 2022* 2023* Escalation(RMB/sqm/day)RentFace 34
Existing Total Stock and Future Supply Market Supply, Absorption and Vacancy Existing Stock at Beginning of the Year Yearly Supply Supply Net Absorbtion Vacancy (RHS) 187 381 737 786 884 936 1,066 1,330 1,500 195 356 49 99 52 130 264 170 1551,8001,6001,4001,2001,0008006004002000 2015 2016 2017 2018 2019* 2020* 2021* 2022* 2023* sqmThousand 40%35%30%25%20%15%10%5%0%400350300250200150100-50050 2015 2016 2017 2018 2019 2020 2021* 2022* 2023* sqmThousand 35
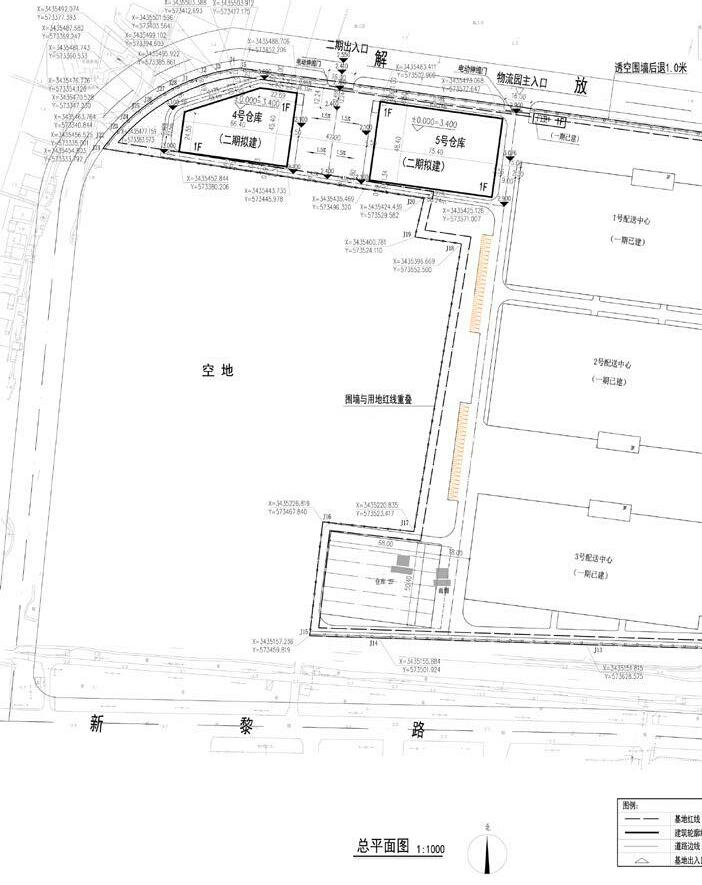
Location 苏州太仓璜泾镇横泾村 18 Dianduchang Road, Huangjing Town, Taicang Current Occupancy 86% Land Zoning Warehouse Remaining Land Tenure Phase 1: 40 years (until 9/11/2061) Phase 2: 42 years (until 2063) Land Area (sqm) 61,903 Total GFA (sqm) Phase 1 & 2: 30,901 (Phase 2: 1,519) Total NLA (sqm) Phase 1 & 2: 31,993 Completion Date 2013/2014 Clear Ceiling Height (m) 10.5m Building Design Specifications Single-storey warehouses, Double-storey office Floor Loading 3 tonnes/sqm In-place Rent (Incl VAT & PM fee) RMB/sqm/day 1.21 Major Tenant(s) 3PLs Commentary Phase 2 land can potentially be developed into a double storey ramp up warehouse entrance, Assets Summary TAICANG Taicang North 36
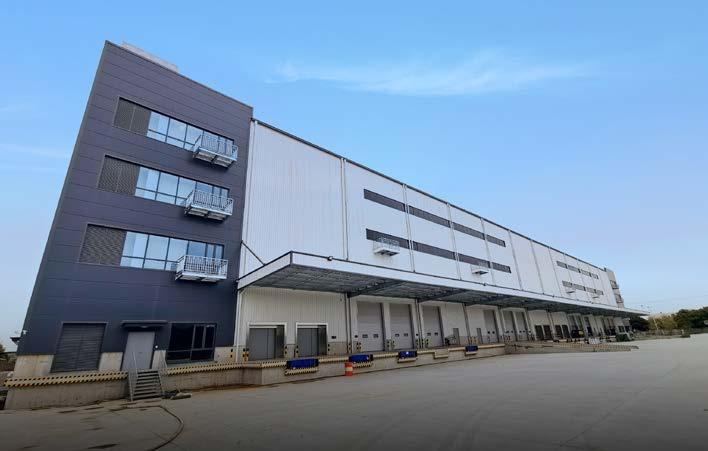
苏州太仓北环路7号 7 Beihuan Road, Taicang 苏州太仓申江路通港东路 East Tonggang Road, Taicang 100% 95% Warehouse Warehouse Phase 1: 36 years (until 24/9/2057) Phase 2: 37 years (until 14/2/2058) Phase 1: 44 years (until16/1/2065) Phase 2: 43 years (until15/8/2064) 181,968 89,679 134,089 82,817 138,302 84,252 Phase 1: 2012/2016 Phase 2: 2013/2019 Phase 1: 2018 Phase 2: 2021 Phase 1: 1F: 6.6m, 2F: 6.4m Phase 2: 1F: 9m, 2F: 9m Phase 1: 1F: 9m, 2F: 7.5m Phase 2: 1/F: 9m, 2/F: 9m 4 Single-storey warehouses, 4 Double-storey lift access warehouses 3 Double-storey lift access warehouse 1/F: 3 tonnes/sqm 2/F: 2 tonnes/sqm 1/F: 3 tonnes/sqm 2/F: 2 tonnes/sqm 1.25 1.21 3PLs 3PLs Located in a core part of Taicang Port, the project has a diversified tenant mix and exhibits strong rental growth potential. Blocks E & F (52,832 m2) of Phase 2 may be enclosed and connected to a new vehicle entrance, making a desirable exclusive sub-park inside the project Has a small parcel of vacant land that can be potentially developed. Phase 2 is a highly sought-after logistics facility with ample loading area and parking space and exclusive entrance Andrew Zeus 37
TAICANG Recent ComparablesRental PROJECT LOCATION DEVELOPER/OWNER (SQM)GFA OCCUPANCY 1 GLP Park Taicang 江苏省苏州市太仓市洋江路68号 GLP 101,000 100% 2 ESR Taicang Park 江苏省苏州市太仓市浮桥镇洋江路58号 ESR 85,127 100% 3 Ping'an Taicang Port Logistics Park 江苏省苏州市太仓市虹桥路15号 Ping’an 118,700 100% 4 LOGOS DistributionTaicangCentre 江苏省苏州市太仓市青岛西路18号 LOGOS 116,110 100% 5 Blackstone (Sin-sino) Taicang Logistics Park Phase I 江苏省苏州市太仓市永丰路 Sin-Sino 98, 854 100% Recent Comparable Non-bonded Logistics Properties Leases 38
OCCUPANCY(%) FACE RENTS (INCL OF PM, EXCL [RMB/SQM/DAY]VAT) 100% 1.20-1.25 100% 1.23-1.28 100% 1.25-1.30 100% 1.33-1.38 100% 1.28-1.33 Taicang North ZeusAndrew 39
below 10%
Market Face Rent and Escalation 10.0%9.0%8.0%7.0%6.0%5.0%4.0%3.0%2.0%1.0%0.0%1.51.41.31.21.11.00.90.80.70.60.5 2018 2019 2020 2021* 2022* 2023* Escalation(RMB/sqm/day)RentFace Face Rent Escalation 40
Sub-market
SUZHOU WUJIANG
keep vacancy
Analysis
• With current total stock of 2.15 million sqm by Q2 2021, Suzhou City (excluding Kunshan, Taicang, Changshu and Zhangjiagang) ranked as the fourth-largest logistics market in YRD, after Shanghai, Kunshan and Jiaxing
• Benefitting from its strategic location connecting Shanghai and other populous cities in YRD, as well as large population base, mature and expanding transportation networks, Suzhou is regarded as one of the best performing logistics markets in China. However, only limited supply (less than 450,000 sqm) added in the market from 2018 to 2020, owing to increasingly restricted 1st-hand industrial land supply for logistics use and strict government interventions on tax contribution and investment intensity requirements Rent and Vacancy
Total Stock and Future Supply
• As of the Q2 2021, the average face rent of Suzhou non-bonded Grade-A warehouse (PM fee inclusive, VAT exclusive, not consideration of rent-free period) has reached to 1.32 RMB/sqm/day. demand is expected to rate in spite of supply in 2022 2023
considerable
and
• Strong
Existing Total Stock and Future Supply of Suzhou Existing Stock at Beginning of the Year Yearly Supply 1,631 1,734 1,787 2,076 2,219 2,592 103 53 289 144 373 6343,5003,0002,5002,0001,5001,0005000 2018 2019 2020 2021* 2022* 2023* SqmThousand Existing stock at beginning of the year Yearly Supply Market Supply, Absorption and Vacancy Supply Net Absorbtion Vacancy (RHS) 20.0%18.0%16.0%14.0%12.0%10.0%8.0%6.0%4.0%2.0%0.0%680580480380280180-2080 2018 2019 2020 2021* 2022* 2023* sqmThousand 41
• Suzhou has five established logistics submarkets, namely SIP, SND, Wujiang, Wuzhong and Xiangcheng, among which, future supply will be mainly concentrated in Wujiang, making it the biggest logistics submarket in Suzhou by 2023
Baozun, the HK-listed leading e-commerce solutions provider, has established their RDC in Wujiang, taking over 200,000 sqm Grade-A warehouse space

Li&Fung, Baozun, Dyson and GAP have set their East China RDC in Wujiang


Wujiang Submarket Overview
Sub-market Analysis
SUZHOU WUJIANG
• Since most of the newly-developed logistics facilities in Wujiang have registration and tax requirements, some of the early projects without such restrictions have become extremely sought-after
42
• Situated at the intersection of Shanghai, Suzhou and Jiaxing, Wujiang is wellpositioned for regional distribution center, especially by e-commerce and retailers.
• The average face rent (PM fee inclusive, VAT exclusive, no consideration of rentfree period) of Grade-A warehouses in Wujiang, is around 1.28-1.30 RMB/day/sqm by 2Q2020, with annual escalation around 4%
• Strong demand has resulted in record low vacancy, at nearly 0%. Any space that becomes available is quickly absorbed, usually taken by existing tenants in the vicinity for expansion
Existing Total Stock and Future Supply of Wujiang Market Supply, Absorption and Vacancy Supply Net Absorbtion Vacancy (RHS) Existing Stock at Beginning of the Year Yearly Supply 245 293 293 396 464 68548 0 104 68 221 4151,2001,0008006004002000 2018 2019 2020 2021* 2022* 2023* sqmThousand Existing stock at beginning of the year Yearly Supply 20.0%18.0%16.0%14.0%12.0%10.0%8.0%6.0%4.0%2.0%0.0%480430380330280230180130-203080 2018 2019 2020 2021* 2022* 2023* sqmThousand 43
• Kunshan market is in short supply due to the increasingly stronger government interventions on logistics use approval and assessment on industry types of warehouse occupiers, only 790,000 sqm of Grade-A warehouse is anticipated by end of 2023. The reduction of tenure of industrial land and increasing difficulty in approving warehouse property use will further affect future supply Vacancy Since 2018 the average vacancy rate in Kunshan has remained below 5% As of 1H2021, average rent of Kunshan’s logistic market is at RMB 1.3/sqm/day. expected grow steadily in the coming years
• As a satellite city of Shanghai and a county level city of Suzhou, Kunshan has the closest proximity to downtown Shanghai. As of 1H 2021, Kunshan’s Grade A logistics warehouse supply has reached 2.88 million square meters, ranked the second among all cities in YRD
• With a sophisticated network of expressways and intercity railways connecting most developed cities in East China, Kunshan is positioned as an ideal location for CDC and RDC, covering a large number of consumer markets
to
Sub-market Analysis
Total Stock and Future Supply
Rent and
•
•
Rent is
KUNSHAN Market Face Rent and Escalation Face Rent Escalation 10.0%9.0%8.0%7.0%6.0%5.0%4.0%3.0%2.0%1.0%0.0%1.51.41.31.21.11.00.90.80.70.60.5 2018 2019 2020 2021* 2022* 2023* Escalation(RMB/sqm/day)RentFace 44
Existing Total Stock and Future Supply of Wujiang Market Supply, Absorption and Vacancy Supply Net Absorbtion Vacancy (RHS) Existing Stock at Beginning of the Year Yearly Supply 2,326 2,423 2,573 2,883 3,123 3,365 310 97 150 310 240 2424,0003,5003,0002,5002,0001,5001,0005000 2018 2019 2020 2021* 2022* 2023* sqmThousand 20.0%18.0%16.0%14.0%12.0%10.0%8.0%6.0%4.0%2.0%0.0%380330280230180130-203080 2018 2019 2020 2021* 2022* 2023* sqmThousand 45
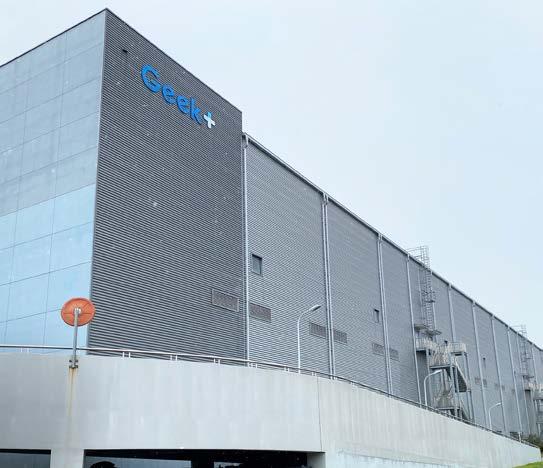
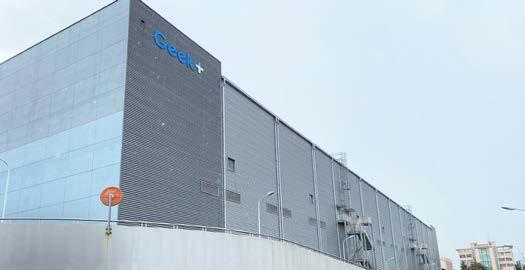
Assets Summary &KUNSHAN WUJIANG Location 苏州昆山千灯镇玉溪中路399号 399 Middle Yuxi Road, Kunshan Current Occupancy 0% (Newly Completed) Land Zoning Industrial Remaining Land Tenure 42 years (until 9/10/2063) Land Area (sqm) 66,241 Total GFA (sqm) 75,635 Total NLA (sqm) 76,691 Completion Date Aug 2021 Clear Ceiling Height (m) 9m Building Design Specifications 2 Double-storey Lift Access Warehouses, An Office Building Floor Loading 1F: 3 tonnes/sqm 2F: 2.5 tonnes/sqm In-place Rent (Incl VAT & PM fee) RMB/sqm/day NA Major Tenant(s) Vacant Commentary Brand new Grade-A logistics facility in extremely sought-after with clean warehouse use approval.5km to S26 Expressway 12km to Kunshan South Railway Station 40 km to Shanghai Hongqiao High-speed railway station/airport 5 minutes by car to Qingpu District, Shanghai Fairway 46
苏州吴江黎里镇汾湖开发区厍星路1799号 1799 Kuxing Road, Lili, Wujiang 42yearsWarehouse100%(until04/17/2063)84,31044,35644,9922015/20179m Building Complex 5 Single-storey Warehouses tonnes/sqm 3 tonnes/sqm1.093PLs sought-after StationExpresswaylocation,station/airportShanghai Rare single-storey modern facility in the core of e-commerce and high-end manufacturing clusters, it has potential to build 7,000 sqm warehouse space. Top 47
Recent ComparablesRental PROJECT LOCATION DEVELOPER/OWNER (SQM)GFA OCCUPANCY 1 GLP Qiandeng Logistics Park 苏州市昆山市玉溪中路225号 GLP 87,336 100% 2 GLP Park Qiandeng Shipu Logistics Park 苏州市昆山市千灯镇机场路 GLP 54,971 3 Goodman Lu Jia Project 苏州市昆山市昆山经济技术开发区杜鹃路188号 Goodman 64,756 100% 4 Goodman Wujiang East Park 苏州市吴江区黎里镇纬三路 Goodman 55,400 100% 5 ESR Fenhu Logistics Park 苏州市吴江区黎里镇联秋路66号 ESR 95,000 100% 6 LOGOS Wujiang Logistics Park 苏州市吴江区大同路 LOGOS 120,000 100% Recent Comparable Non-bonded Logistics Properties Leases in Kunshan and Wujiang &KUNSHAN WUJIANG 48
OCCUPANCY(%) FACE RENTS (INCL OF PM, EXCL [RMB/SQM/DAY]VAT) 100% 1.40-1.45 90% 1.35-1.40 100% 1.40-1.47 100% 1.28-1.33 100% 1.33-1.38 100% 1.32-1.37 Fairway Top 49
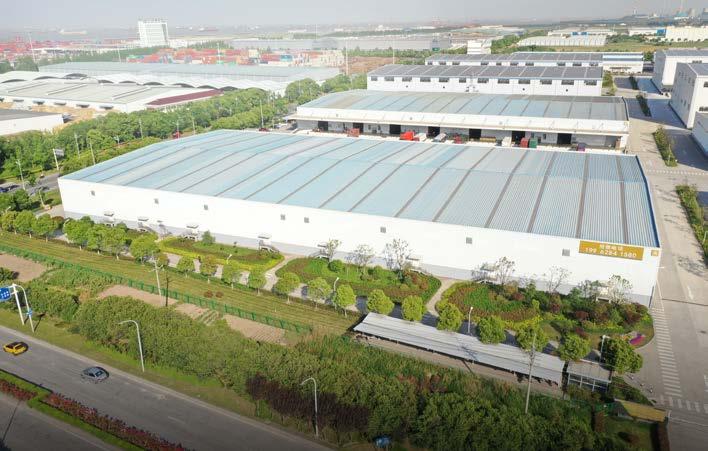
Assets Summary HANGZHOU DAJIANGDONG Location 杭州大江东区江东一路888号 888 Jiangdong Yi Road, Hangzhou Current Occupancy 96% Land Zoning Industrial Remaining Land Tenure 36 years (until 8/6/2057) Land Area (sqm) 59,564 Total GFA (sqm) 63,039 Total NLA (sqm) 62,628 Completion Date 2018 Clear Ceiling Height (m) 1/F: 9 m 2/F: 9 m Building Design Specifications 2 Double-storey Ramp Access Warehouses, An Office Building Complex Floor Loading 1F 3tonnes/sqm 2F 2 tonnes/sqm In-place Rent (Incl VAT & PM fee) RMB/sqm/day 1.17 Major Tenant(s) Logistics Robotics, Retailer and 3PLs Commentary Grade-A modern warehouse with premium specification in Dajiangdong, where warehouses are in short supply. Baba 50
• Hangzhou has set up a 3-year plan that aims to have its total retail sales of consumer goods achieve an annual growth of 8% to RMB800 billion, and its total online retail sales to achieve an annual growth of 10% to RMB1 trillion by the end of 2023.
• The Dajiangdong Industrial Cluster District is located in the centre of Xiaoshan district, and it has jurisdiction over the Hangzhou Xiaoshan International Airport. The area enjoys strong demand from auto-parts manufacturers and e-commerce companies and has attracted investments from range of logistics developers and tenants
PROJECT DEVELOPER/OWNER (SQM)GFA OCCUPANCY(%) FACE RENTS (INCL OF VAT AND (RMB/SQM/DAY)PM) 1 GLP LogisticsLinjiangPark 1999号杭州市大江东经七路 GLP 49,000 91% 1.32-1.37 2 Mapletree Linjiang Logistics Park 1717号江工业园区纬七路杭州市萧山区临 Mapletree 95,547 100% 1.30-1.35 3 HangzhouLOGOS Linjiang Logistics Park 新世纪大道交叉口杭州市萧山区纬二路 LOGOS 197,330 100% 1.35-1.40 4 GLP LogisticsWanhaoPark 德北5组1号杭州市萧山区党湾镇 GLP 62,606 100% 1.32-1.37 5 Blogis DajiangdongHangzhou 集区经六路1888号杭州市大江东产业聚 Blogis 55,000 100% 1.35-1.40 Recent Comparable Non-bonded Logistics Properties Leases Baba 51
• Hangzhou’s GDP reached RMB1.61 trillion (US$249.32 billion) in 2020, growing 3.9% year-onyear, 1.6 percent higher than the national average.
• The per capita disposable income of permanent residents in Hangzhou was RMB61,879 in 2020, with the average for urban residents being RMB68,666
Shanghai Fengxian
Shanghai Wharf Shanghai
Taicang AndrewHangzhou Baba Fengxian
52
Zeus 53
Kunshan FairwayTaicang
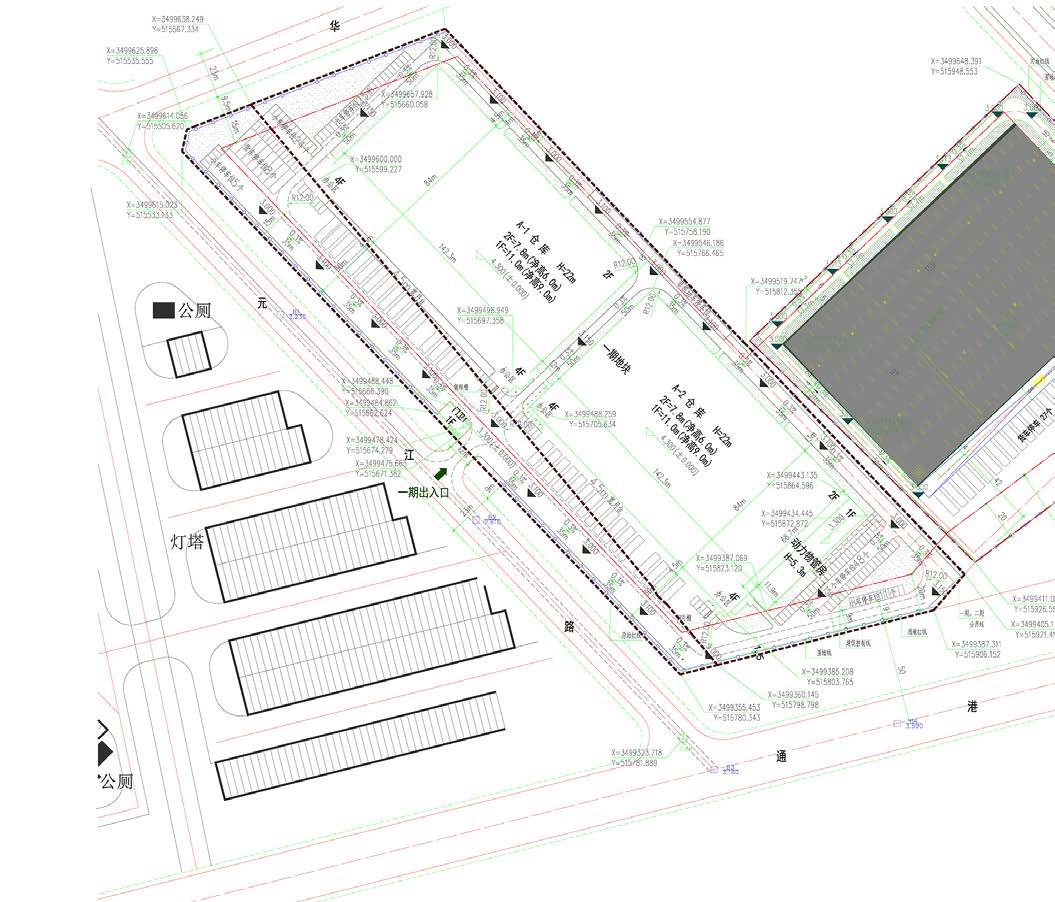
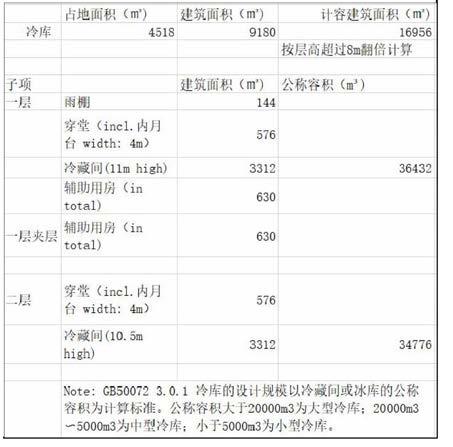
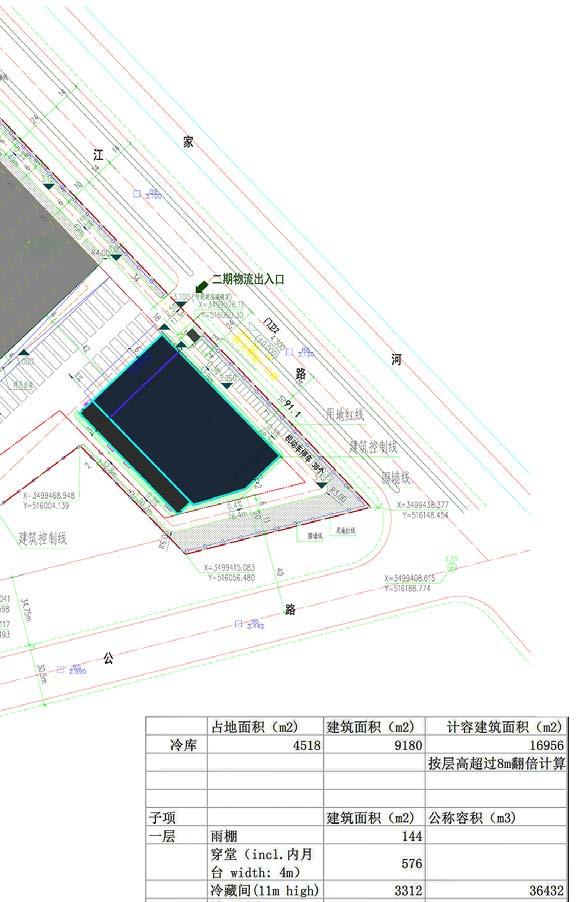
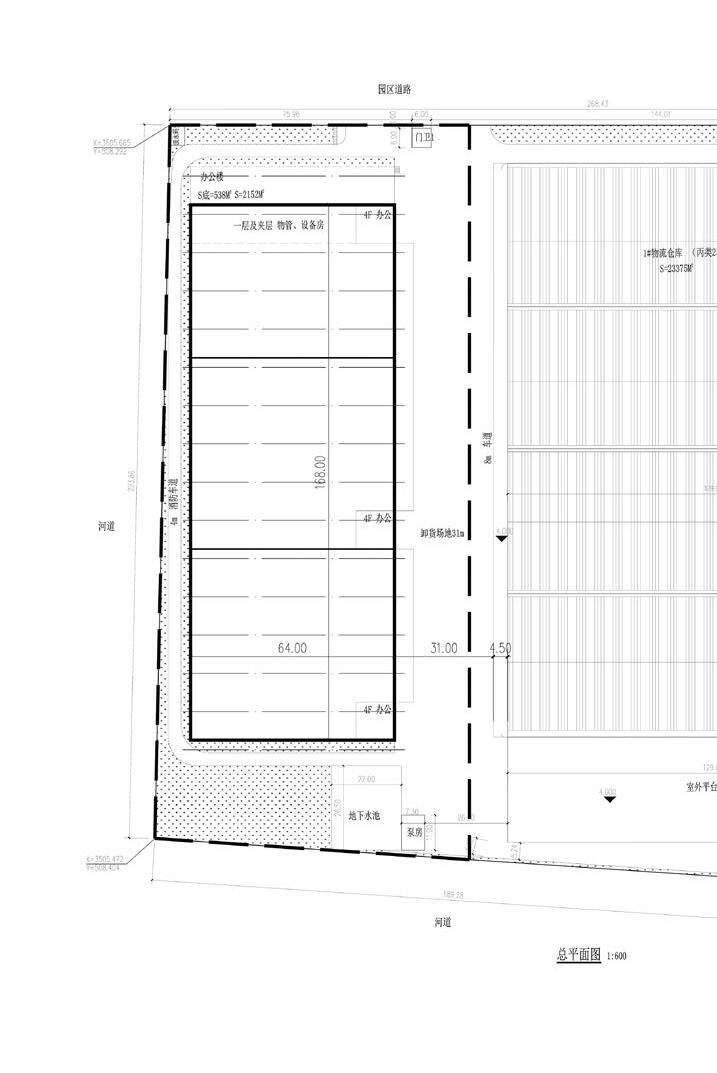
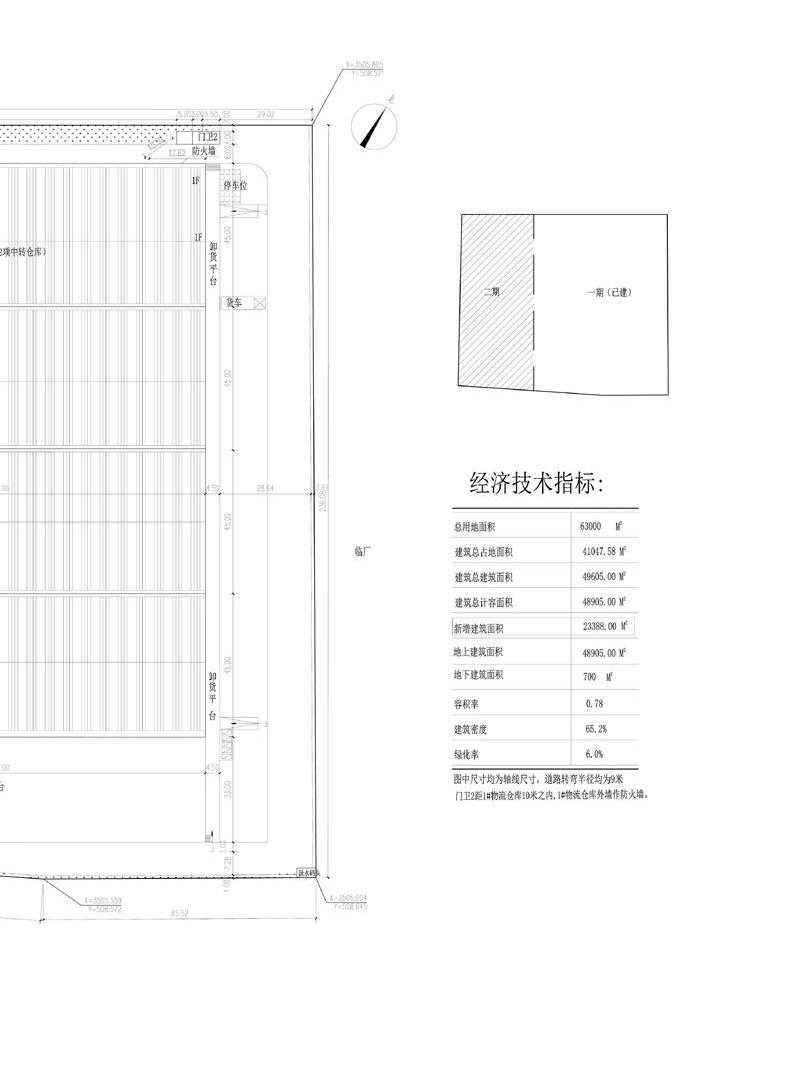
area. • Build-able area of 39,574 sqm GFA expects to generate extra NOI totaling RMB 13mn when fully commissioned Suzhou, Project Top Taicang, Project Zeus 7,006 sqm 9,180 sqm GFA to be built within subject title area GFA to be built beyond subject title area, but the government has agreed to a sale of this site 54
Appendix Development1: Opportunities title
Potential Development Opportunities • Project Top, Project Zeus and Project Taicang North reserve potentials to develop three doubledecker warehouses configured with elevator within the
Opportunities Summary Taicang, Taicang North site as logistics usage at RMB 450,000 per mu 23,388sqm 55
Appendix 2: Development Opportunities Project Top 56
Opportunities
Building Plan 57
58
ZeusProject
59
TaicangProject
North 60
61
4. Forecasts and projections contained in this IM must be read strictly in conjunction with the explanations, qualifications and are designed to assist investors in considering possible outcomes. They are not assurances that any particular result the time of issue of this IM, but no representation, warranty or assurance is given that they are accurate, reasonable nor exhaustive
5. Neither JLL and C&W nor any employee of either firms, has any authority to make or give any representation or warranty
2. This IM does not constitute, nor constitute part of, an offer or contract or any form of commitment from the Owner, JLL
6. This IM does not constitute an offer or solicitation in any jurisdiction in which such offer or solicitation is not permitted prospectus “equivalent” document. The securities described in this IM have not been and will not be registered under the ment or financial product advice.
1. The information in this Information Memorandum (IM) has been compiled based on information provided by the Owner exhaustive or that it will include all the data that a prospective investor may need.
10. By accepting this IM the recipient agrees to be bound by the foregoing limitations. Any person to whom this IM may not IM to us immediately.
Disclaimer
3. All information, descriptions, dimensions, references to condition and necessary permissions for use and occupation, and as statements or representations of fact, but should request their own professional, financial and legal advice, and should tions or warranties, expressed or implied, is or will be made by the Owner or JLL and C&W in relation to the accuracy or completeness
7. A copy of this IM has not been registered with the Registrar of Companies in Hong Kong. Copies of this IM will only be Companies (Winding Up and Miscellaneous Provisions) Ordinance (Chapter 32 of the Laws of Hong Kong), or (ii) to “professional and any rules made thereunder, or (iii) in other circumstances which do not result in the document being a “prospectus” within Hong Kong).
11. All currency amounts are in Chinese Renminbi (RMB) unless stated otherwise.
8. Further, JLL and C&W will not issue this IM, whether in Hong Kong or elsewhere, such that it is directed at, or the contents ties laws of Hong Kong) other than with respect to shares which are or are intended to be disposed of only to persons outside 571 of the Laws of Hong Kong) and any rules made thereunder.
9. Neither the issue of this IM nor any part of its contents is to be taken as any form of commitment on the part of the Owner Owner reserve the right to amend the proposed timetable and the sale procedure, to negotiate with one or more prospective dure and to terminate any discussions and negotiations with any prospective purchaser at any time, for any reason and without
12. References to percentages have been rounded to the nearest whole number, unless they represent single-digit percentages. 62
Owner and is set out as a general outline for the guidance of prospective investors. No guarantee can be provided that it is JLL and C&W to deal whether exclusively or otherwise, with the recipient or to proceed with any transaction. and other details are given in good faith and are believed to be correct. Prospective investors should not rely upon them should conduct their own investigation and independent evaluation. Notwithstanding anything contained herein, no representa completeness of the information provided. qualifications and assumptions set out in the text. All forecasts and projections involve a significant element of subjective judgement result or outcome will occur. The assumptions on which forecasts and projections are based on, are considered reasonable at exhaustive nor that they will be or will continue to be so in the future. warranty in relation to this portfolio. under applicable law. This IM has not been approved by any regulator in any jurisdiction and is not a prospectus or a securities laws of any jurisdiction. Neither this IM nor any part of it nor the fact of its availability or distribution is invest distributed by JLL and C&W (i) in circumstances which do not constitute an offer to the public within the meaning of the “professional investors” within the meaning of the Securities and Futures Ordinance (Chapter 571 of the Laws of Hong Kong) within the meaning of the Companies (Winding Up and Miscellaneous Provisions) Ordinance (Chapter 32 of the Laws of contents of which are likely to be accessed or read by, the public in Hong Kong (except if permitted to do so under the securi outside Hong Kong or only to “professional investors” within the meaning of the Securities and Futures Ordinance (Chapter Owner or JLL and C&W to proceed with any sale which may be envisaged by the issue of this IM. JLL and C&W and the prospective purchasers to the exclusion of one or more of any others without giving prior notice thereto, to terminate the proce without giving any reasons. not be lawfully distributed or who does not agree to the terms of this disclaimer should identify themselves and return this percentages. All other figures are shown to one decimal point, unless stated otherwise. 63
9172
Helen Han Director, LogisticsLogisticsProperties, China Capital Markets +86Helen.Han@ap.jll.com13641884210
Senior CapitalManagerMarkets, East +86Gerry.Zy.Weng@cushwake.comChina13162559505 Co. License No.: C-003464 Agency License No.: L3007326E Co. License No.: C-002429 Agency License No.: L3007333E

Stephen Qiu Deputy Managing Director Capital Markets, +852Stephen.H.Qiu@cushwake.comChina69184644/+861392383
COPYRIGHT © 2021 All rights reserved. The information contained in this document is proprietary to JLL and Cushman & Wakefield, and shall be used solely for the purposes of evaluating this proposal. All such documentation and information remains the property of JLL and Cushman & Wakefield and shall be kept confidential. Reproduction of any part of this document isauthorized only to the extent necessary for its evaluation. It is not to be shown to any third party without the prior written authorization of JLL or Cushman & Wakefield. All information contained herein is from sourc es deemed reliable; however, no representation or warranty is made as to the accuracy thereof.
3440
Theodore Novak Executive Director Asia Pacific Capital Markets Head of Institutional Capital, Greater China +852Theodore.Novak@ap.jll.com96868958
Mark Gladu Senior Director, Logistics Capital Markets, +86Mark.Gladu@ap.jll.comChina13816506805
7922
Alvin Yip President of Capital Markets, G. China Capital Markets, +852Alvin.Kp.Yip@cushwake.comChina90418907/+861360258 Christopher Young AsiaDirectorPacific Capital +852Chris.Younghk@ap.jll.comMarkets93872809/+861381879 Charli Chan Executive Director Capital Markets, +852Charli.Cl.Chan@cushwake.comChina95807220/+861392285
The Portfolio is offered for sale via an Expression of Interest process, more details can be provided upon the execution of a Confidentiality Agreement.
0294
Gerry Weng