N E W S
A N D
T R E N D S
Analytical tools and skilled people are key parts of Alberta’s strategy BY N O R M T O L L I N S KY
T
he COVID-19 pandemic has forced public health agencies and governments across Canada to make difficult decisions about social gatherings, mask use, testing, elective surgeries and lockdowns. Most if not all of them have some kind of analytics strategy to guide them, says Greg Horne, SAS Institute’s Global Principal for Healthcare. “It’s just a question of how sophisticated that strategy is and how it’s being used to drive change and patient outcomes.” Alberta Health, one of the most adept practitioners of health analytics, hit the ground running when the news of the virus began circulating around the world. “Once we heard about the first cases in Wuhan, we started thinking about what would happen if the virus appeared in Canada,” recalled Larry Svenson, provincial health analytics officer and executive director for analytics and performance reporting for Alberta Health. “We started putting things into play in late January, early February because anytime we see something of international concern, we ramp up very quickly.” The essentials, including the infrastructure, the partnerships and the data flows, were all in place. All that was required was to adapt them to accommodate the specific information needs related to COVID-19. Alberta Health relies on SAS Institute’s Viya platform and licenses a variety of other SAS visualization and statistical software, including SAS Grid Computing. It also uses R Studio and a variety of other software products. Modeling based on the early experience of Wuhan and Italy, said Svenson “painted a picture that was quite frightening if we had not acted at all,” prompting the province to impose the necessary public health measures to flatten the curve and prevent adverse impacts on the health-care system. “As we started having cases in Canada, we began using more local data, but in the absence of local data, our initial mod-
els were based on what we were seeing internationally.” The objective was to “understand at what point we would see a trigger that could cascade into overburdening the health-care system and require us to make adjustments such as slowing down elective surgeries and ramping up testing.” Models also tried to forecast what would happen when students returned to school and at what point lab testing would exceed the province’s daily testing capacity. “The models are mathematically quite intense with sophisticated differential
tem, the Discharge Abstract Database, physician claims data, and Alberta’s Pharmaceutical Information Network, along with feeds from Alberta Education about potential issues in the schools. “The overriding objective, said Svenson, “is to make sure that we have high-quality evidence to support the public health response and understand how the pandemic is affecting Albertans. We report on everything from how many new cases we have on a daily basis, how many people end up in hospital, the number of deaths, how many outbreaks we’re dealing with and
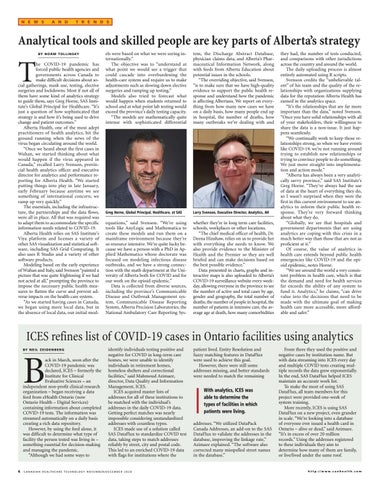
Greg Horne, Global Principal, Healthcare, at SAS
Larry Svenson, Executive Director, Analytics, AH
equations,” said Svenson. “We’re using tools like AnyLogic and Mathematica to create these models and run them on a mainframe environment because they’re so resource intensive. We’re quite lucky because we have a person with a PhD in Applied Mathematics whose doctorate was focused on modeling infectious disease outbreaks, and we have a strong connection with the math department at the University of Alberta both for COVID and for our work on the opioid epidemic.” Data is collected from diverse sources, including the province’s Communicable Disease and Outbreak Management system, Communicable Disease Reporting System, Alberta Precision Laboratories, the National Ambulatory Care Reporting Sys-
whether they’re in long term care facilities, schools, workplaces or other locations. “The chief medical officer of health, Dr. Deena Hinshaw, relies on us to provide her with everything she needs to know. We also provide evidence to the Minister of Health and the Premier so they are well briefed and can make decisions based on the best possible evidence.” Data presented in charts, graphs and interactive maps is also uploaded to Alberta’s COVID-19 surveillance website every weekday, allowing everyone in the province to see the number of active and total cases by age, gender and geography, the total number of deaths, the number of people in hospital, the number of patients in intensive care, the average age at death, how many comorbidities
they had, the number of tests conducted, and comparisons with other jurisdictions across the country and around the world. The daily uploading process is almost entirely automated using R scripts. Svenson credits the “unbelievable talent” of his team and the quality of the relationships with organizations supplying data for the reputation Alberta Health has earned in the analytics space. “It’s the relationships that are far more important than the data,” noted Svenson. “Once you have solid relationships with all of your stakeholders, their willingness to share the data is a non-issue. It just happens seamlessly. “We continually work to keep those relationships strong, so when we have events like COVID-19, we’re not running around trying to establish new relationships or trying to convince people to do something. We just move straight into implementation and action mode.” “Alberta has always been a very analytically savvy province,” said SAS Institute’s Greg Horne. “They’ve always had the use of data at the heart of everything they do, so I wasn’t surprised when they were the first in this current environment to use analytics to inform their public health response. They’re very forward thinking about what they do. “Globally, we see that hospitals and government departments that are using analytics are coping with this crisis in a much better way than those that are not as proficient at it.” Of course, the value of analytics in health care extends beyond public health emergencies like COVID-19 and the opioid epidemic, notes Horne. “We see around the world a very consistent problem in health care, which is that the demand and need for health services far exceeds the ability of any system to fund it. Analytics,” he claims, “can drive value into the decisions that need to be made with the ultimate goal of making health care more accessible, more affordable and safer.”
ICES refines list of COVID-19 cases in Ontario facilities using analytics BY N E I L Z E I D E N B E R G
B
ack in March, soon after the COVID-19 pandemic was declared, ICES – formerly the Institute for Clinical Evaluative Sciences – an independent non-profit clinical research organization – began receiving a data feed from eHealth Ontario (now Ontario Health – Digital Services) containing information about completed COVID-19 tests. The information was streamed automatically on a daily basis creating a rich data repository. However, by using the feed alone, it was difficult to determine what type of facility the person tested was living in – something essential for decision-making and managing the pandemic. “Although we had some ways to
6
identify individuals testing positive and negative for COVID in long-term care homes, we were unable to identify individuals in retirement homes, homeless shelters and correctional facilities,” said Mahmoud Azimaee, director, Data Quality and Information Management, ICES. ICES acquired master lists of addresses for all of these institutions to be matched with the individual’s addresses in the daily COVID-19 data. Getting perfect matches was nearly impossible considering unstandardized addresses with countless typos. ICES made use of a solution called SAS DataFlux to standardize COVID test data, taking steps to match addresses reliably by street, city and postal code. This led to an enriched COVID-19 data with flags for institutions where the
C A N A D I A N H E A LT H C A R E T E C H N O L O G Y N O V E M B E R / D E C E M B E R 2 0 2 0
patient lived. Entity Resolution and fuzzy matching features in DataFlux were used to achieve this goal. However, there were still some addresses missing, and better standards were needed to match the remaining
With analytics, ICES was able to determine the types of facilities in which patients were living. addresses. “We utilized DataPack Canada Addresses, an add-on to the SAS DataFlux to validate the addresses in the database, improving the linkage rate,” Azimaee explained. “The software also corrected many misspelled street names in the database.”
From there they used the positive and negative cases by institution name. But with data streaming into ICES every day and multiple COVID tests creating multiple records the data grew exponentially. In the end, SAS DataFlux helped ICES maintain an accurate work list. To make the most of using SAS DataFlux, all team members for this project were provided one-week of system training. More recently, ICES is using SAS DataFlux on a new project, even grander in scale. “We’re looking into a database of everyone ever issued a health card in Ontario – alive or dead,” said Azimaee. “It’s in excess of over 20 million records.” Using the addresses registered to these individuals they aim to determine how many of them are family, or live/lived under the same roof.
h t t p : / / w w w. c a n h e a l t h . c o m