168
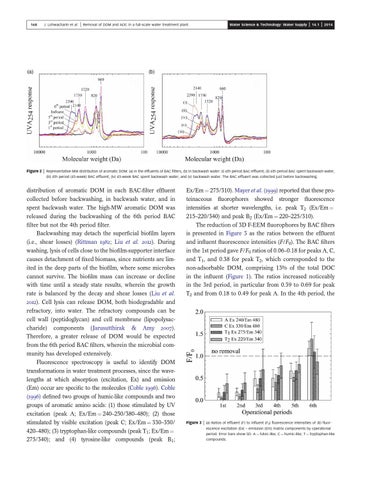
Figure 2
J. Lohwacharin et al.
|
|
Removal of DOM and AOC in a full-scale water treatment plant
Water Science & Technology: Water Supply
|
14.1
|
2014
Representative MW distribution of aromatic DOM: (a) in the effluents of BAC filters, (b) in backwash water: (i) 6th period BAC effluent, (ii) 6th period BAC spent backwash water, (iii) 4th period (45-week) BAC effluent, (iv) 45-week BAC spent backwash water, and (v) backwash water. The BAC effluent was collected just before backwashing.
distribution of aromatic DOM in each BAC-filter effluent
Ex/Em ¼ 275/310). Mayer et al. () reported that these pro-
collected before backwashing, in backwash water, and in
teinaceous
spent backwash water. The high-MW aromatic DOM was
intensities at shorter wavelengths, i.e. peak T2 (Ex/Em ¼
released during the backwashing of the 6th period BAC
215–220/340) and peak B2 (Ex/Em ¼ 220–225/310).
filter but not the 4th period filter.
fluorophores
showed
stronger
fluorescence
The reduction of 3D F-EEM fluorophores by BAC filters
Backwashing may detach the superficial biofilm layers
is presented in Figure 3 as the ratios between the effluent
(i.e., shear losses) (Rittman ; Liu et al. ). During
and influent fluorescence intensities (F/F0). The BAC filters
washing, lysis of cells close to the biofilm-supporter interface
in the 1st period gave F/F0 ratios of 0.06–0.18 for peaks A, C,
causes detachment of fixed biomass, since nutrients are lim-
and T1, and 0.38 for peak T2, which corresponded to the
ited in the deep parts of the biofilm, where some microbes
non-adsorbable DOM, comprising 13% of the total DOC
cannot survive. The biofilm mass can increase or decline
in the influent (Figure 1). The ratios increased noticeably
with time until a steady state results, wherein the growth
in the 3rd period, in particular from 0.39 to 0.69 for peak
rate is balanced by the decay and shear losses (Liu et al.
T2 and from 0.18 to 0.49 for peak A. In the 4th period, the
). Cell lysis can release DOM, both biodegradable and refractory, into water. The refractory compounds can be cell wall (peptidoglycan) and cell membrane (lipopolysaccharide)
components
( Jarusutthirak
&
Amy
).
Therefore, a greater release of DOM would be expected from the 6th period BAC filters, wherein the microbial community has developed extensively. Fluorescence spectroscopy is useful to identify DOM transformations in water treatment processes, since the wavelengths at which absorption (excitation, Ex) and emission (Em) occur are specific to the molecules (Coble ). Coble () defined two groups of humic-like compounds and two groups of aromatic amino acids: (1) those stimulated by UV excitation (peak A; Ex/Em ¼ 240–250/380–480); (2) those stimulated by visible excitation (peak C; Ex/Em ¼ 330–350/
Figure 3
|
(a) Ratios of effluent (F) to influent (F0) fluorescence intensities of 3D fluor-
420–480); (3) tryptophan-like compounds (peak T1; Ex/Em ¼
escence excitation (Ex) – emission (Em) matrix components by operational period. Error bars show SD. A ¼ fulvic-like; C ¼ humic-like; T ¼ tryptophan-like
275/340); and (4) tyrosine-like compounds (peak B1;
compounds.