13 minute read
Protecting the Environment


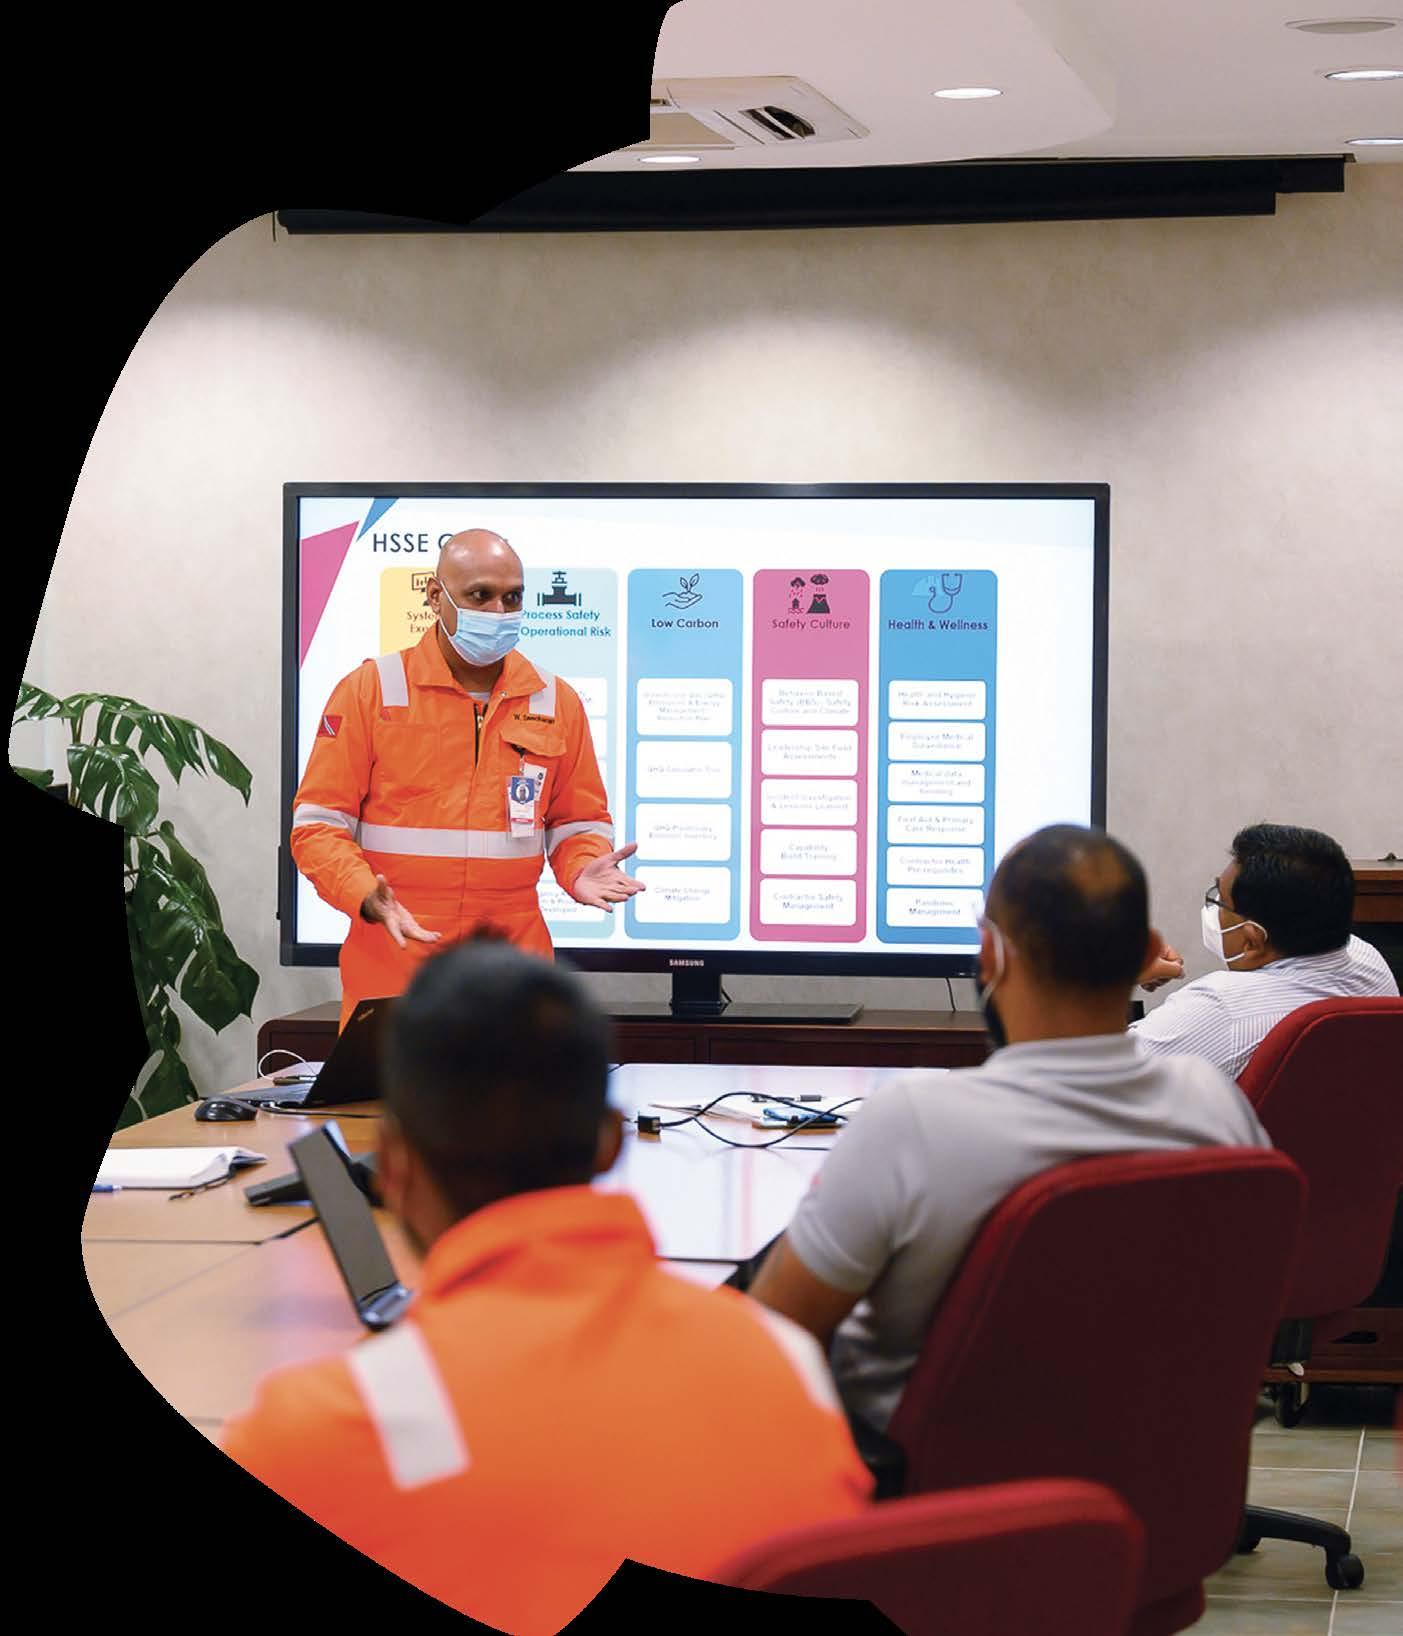
i) Creating a Safety Culture
In 2021, we successfully implemented our
Heritage Operating Management System
(OMS) to enable us to have a systematic and controlled approach to how we manage our business with respect to safety, risk management and operational integrity. 2022 will see us continue to build on this momentum and further embed OMS into our company as well as our supply chain.
As part of our OMS, we embedded robust HSSE policies, standards and procedures to drive compliance and support the building of a safety culture. A strong HSSE culture helps reduce our risks of accidents to people and the environment, while building resilience into our organisation. We made significant headway in 2021 with some key achievements across multiple areas, from an ISO 14001-compliant Environmental

Management System and control-ofwork programme to a Contractor HSSE Management and a Behaviour-Based Safety System.
To help build crisis management capability across the organisation, we implemented a Business Support Team (BST) and Incident Management Team (IMT) Roster that involves employee participation on a structured rotation system.
We also strongly encourage employees to report hazards and have a Stop Work Authority programme, which empowers any employee to stop work if they identify an unsafe condition. Employee reports of potential hazards are reviewed by the HSSE team and corrective action is taken, where applicable, to ensure the use of best management practices and a safe work environment.
Key Achievements
• Creation of a centralised HSSE Department; • Development of Key Process Safety
Procedures, namely Management of Change (MOC), Pre-Startup Safety Review (PSSR),
Hazard Operability (HAZOP), Process Safety
Fundamental; • Increased focus on Learning from Incidents and embedding the Investigation Process; • Developed the Control-of-Work Procedure; • GHG Calculator Tool and Emissions Inventory
Reporting achieved; • CO2 Emission Reduction Assessment achieved; • ESG and Sustainability Targets achieved; • Asset Integrity Results reduced; • Process Safety Incidents reduced; • Personal Safety Incidents and Severity reduced; and • Risk Management Standard approved and
Business Risk threshold measured; Controls
Audited; Risk Levels reduced.
The table below highlights some of the key HSSE performance metrics that we have focused on over the past two years as we implemented and embedded across the organisation.
HSSE Performance Metrics
FOCUS AREA LEADING INDICATORS
UNIT OF MEASUREMENT 2019-2020 20202021
HSSE Leadership Management Visits & Leadership Site Field Assessment NUM 74 104
Employee Participation Near Misses Employee Interventions (Behaviour-Based Safety Observations) NUM 87 11
NUM 699 564
Control of Work Self-Verifications
Contractor Management Monthly Contractor HSSE Meetings
FOCUS AREA LAGGING INDICATORS UNIT OF MEASUREMENT 2019-2020 20202021
NUM not yet implemented 709 NUM 15 68
OSHA Recordables - Restricted Work Case NUM 2 0
OSHA Recordables - Medical Treatment NUM 1 0
Health and Safety
Rate 0.66 0
NUM NUM 2 0 8 4
OSHA Recordables - Restricted Work Case NUM 0 0
OSHA Recordables – Medical Treatment NUM 2 3
Health and Safety
Rate 0.24 0.05
NUM NUM 4 1 6 6
ii) Managing Asset Integrity Risk
From 2020 to 2021 we set a clear priority risk reduction plan to support major integrity project execution across our entire business covering Land, Offshore and Midstream. We identified several areas as priorities in ensuring the reliability of our operations and safe delivery of production targets – that we will continue to address in 2022 to 2023:
• Field Rationalisation Studies; • New Technology; • Multiphase Pumps; • Instrumentation Upgrades; • Major Roadworks and Bridge
Upgrades; • Corrosion Repair; • Tank Upgrades; • Pipeline Repairs; • Fire Suppression System; and • Electrical Upgrade.
To help develop, define and approve our ‘Asset Integrity Standards and Procedures’, we implemented a multi-year integrity programme to reduce integrity-related operating risk. The purpose of our Work Management (Maintenance) Business Process is to develop and integrate business processes in order to support user adoption and system capability development. This includes:
• Task Workflow by Role; • System Status matched to Task
Workflow; • User Status matched to Task
Workflow; and • Transaction Type managed in Fiori and/or Graphical User Interface (GUI).
We therefore implemented a Computerised Maintenance Management System (CMMS) on an SAP platform to ensure that all maintenance and integrity work is managed and executed to achieve 90% work order compliance. In essence: if no work order is generated from SAP – no work is approved. This helps us to not only control workflow management, but have line of sight of all work activity sets that are active and in the pipeline.
Key Achievements
• Breakdowns reduced by 30%; • Maintenance execution of work at 85%; • Deferrals reduced to improve operational efficiency; • Reliability critical equipment at 85%; • Lower cost of maintenance; • Critical Equipment Engineering
Standards defined; and conformance established at 80%.
iii) Greenhouse Gas Emission Reporting
We play a role in supporting Trinidad & Tobago’s national low carbon future agenda.
In 2019, we took the first step toward developing a Greenhouse Gas (GHG) Emission Inventory Report (“Report”) and its GHG Calculator tool for monthly reporting.
This enabled us to have a deeper understanding of where we needed to focus in our strategic plan. In 2022 we published our third Report and are establishing a dedicated Green Agenda Team.
The table summarises the emission sources considered in our process and consequently in our inventory report. We categorise them by Scope due to a combination of materiality and priority.
Emissions sources included in Heritage’s GHG Emissions Inventory.
SCOPE EMISSION CATEGORY EMISSION SOURCE EMISSION COMPONENT
Scope 1 Combustion Stationary Natural gas compressors Natural gas generators Natural gas pumps Natural gas steam generator Diesel compressor Diesel generators Diesel pumps Mobile Vehicles fleet (diesel and gasoline) Security (diesel) Vessel (offshore) Trucks (land operations)
Fluorinated gases Fugitive emissions Vented emissions
Scope 2 Purchased electricity Power consumption
Scope 3 Wastewater treatment Employee commute (diesel, gasoline, cng) Purchase of goods and services
In general terms, Heritage’s GHG emissions decreased by 43.9% between 2019 and 2020 moving from 9,248,293 tCO2e to 5,181,043 tCO2e for Scope 1, 2 and 3 from January to December 2020, due to the improvement in calculations of the vented emissions (as explained in the Gas Venting section on page 33). The table below summarises the emission by scope and Business Unit (BU).
We can see from the table that methane is the main contributor as it represents 95.03% of total GHG emissions. As the main compound in natural gas, it is released during gas venting and directly emitted to the atmosphere. It is also emitted by fossil fuel combustion when the fuel is not burned completely. Methane is especially significant in Land Operations, where it represents 99.31% of total Land BU GHG emissions.
Carbon dioxide contributes 4.7% of Heritage’s overall GHG emissions. However, it represents 48.77% in Midstream BU (due to electricity consumption), and 23.41% in Corporate activities (due to fuel consumption in the vehicle fleet and employee commute). Nitrous oxide and HFC (hydrofluorocarbons) contribute 0.25% and 0.02% respectively to total GHG emissions, however, they represent 63.87% and 12.30% of Corporate emissions respectfully, due to fuel consumption in vehicle fleet and fluorinated gases.
GHG emissions by greenhouse gas (tCO2e) per Business Unit for Scope 1, 2 and 3 (2020)
OFFSHORE BU MIDSTREAM BU LAND BU CORPORATE TOTAL
% CONTRIBUTION
HFC
25.85 14.20 0.00 1,085.80 1,125.86 0.02%
Gas venting
Overall, offshore emissions decreased even with higher oil production, largely due to a change in vented emissions. The vented emissions calculated for 2019 utilised the Gas-to-Oil Ratio (GOR) for all its fields which could be interpreted that all the gas produced with the oil from the fields was being vented. This is not the case, as most of the gas produced is compressed and reinjected into the wells as ‘gaslift’ gas for lifting the oil from the wells. A small quantity of the gas produced is also used as fuel for offshore and on-land equipment.
After separation, the residual entrained gas in the oil is vented as ‘fugitive gas’ at the top of the production tanks, however this is not currently being measured.
Continuous measured venting only occurs on the Generator Platform (GP)1 location in the Soldado East Field. Otherwise venting occurs in emergency/upset situations when equipment or platforms shut down, the system blows down or when maintenance is required. Gas is also flared on the Mobile Offshore Production Unit in the Southwest Soldado Field during upset conditions or during maintenance work on compressors. The emissions from flaring was included into the calculator from 2020 onwards.
The GOR was revised from the 2020 calculation hence the volume vented in the 2019 report was significantly reduced due to this removal.
Scope 1, 2 and 3 emissions per year
TOTAL GHG EMISSIONS (tCO2e)
Scope 1
Scope 2
Scope 3
Total (Scope 1, 2 & 3) 2019
2020 2021
9,171,798.57* 5,150,088.20 5,002,925.70
24,634.04 26,682.26 30,842.47
51,860.68 4,272.44 4,203.42
9,248,293.29† 5,181,042.91 5,037,971.59
*The Scope 1 emissions for 2019 were updated to 4,719,014.35 tCO2e due to the improvement in calculations of vented emissions. †The Scope 1, 2 and 3 emissions for 2019 were updated to 4,795,509.07 tCO2e due to the improvement in calculations of vented emissions.
Year
2019
2020
2021 QUANTITY METHANE PER SCOPE 1, 2 & 3 (tCO2e) Scope 1 Scope 2
8,937,122.99* 62.65
4,920,898.80 211.80
4,767,425.92 349.90 2,238.94
Scope 3 451.86
2,238.09
EFFLUENT MANAGEMENT
Like all oil and gas companies, we use water in key aspects of our operations. Drawing from local water wells, we use it in waterflooding, steam flooding, fire systems and industrial use and we also supply to local communities for potable use. From 2020-2021, we withdrew 1,025,373m3 of water from wells in: Central Los Bajos, Coora/Quarry, Guapo, Forest Reserve/ Parrylands, Fyzabad and Palo Seco. We also consumed 592,496m3 of water for wider operations while supplying neighbouring communities with 725,105m3 of water for the same reporting period.
Heritage was issued the first water pollution permit in the country under the new Water Pollution Rules. In October 2019, following the revision of these Rules, we applied for our first two water pollution permits (for our Tank Farm facilities in Point Fortin and Point Ligoure). Since the issue of both permits, we successfully achieved the following: 1. Installation of two 24-hour continuous flow monitoring meters to accurately measure the volume of its produced water discharged; 2. Developed and received approval from the Environmental Management
Authority (EMA) for two quality assurance project plans for both facilities; 3. Commenced monthly sampling and analyses of the effluent to determine the concentration of pollutants and submission of these reports to the
EMA; and 4. Paid the first two annual permit fees and submitted two annual reports.
To ensure that we operate within the parameters of the Rules, we have begun the process of documenting our effluent processes across the organisation and testing all effluent discharges. This data will provide the required baseline information for evaluating our potential strategies for the treatment of produced water.
IDENTIFYING OPPORTUNITIES
Our Emissions Reduction Assessment Workshop was another key initiative that helped us to identify and prioritise 80 opportunities to help reduce our carbon footprint. They ranged from detailed engineering plans and improved data collection to dedicated roles, planning and even small-scale alternative energy infrastructure to replace fossil fuel generated power and offset carbon emissions.
We have activated our Energy Transition Framework which links our funding with our energy transition objectives, leveraging defined timelines to achieve performance goals that are relevant and material to our business.
HIGHLIGHT – OUR ESG JOURNEY TO DATE
Our first steps in our ESG journey were to develop a Greenhouse Gas (GHG) Emissions Inventory and a GHG Calculator tool for monthly emissions reporting.
This project started in July 2019, when Heritage utilised the most adequate technique for determining its impact on climate change – calculation of its carbon footprint. This process highlights the areas of the organisation where greenhouse gases are emitted and helps us to develop the measures that should be taken to reduce emissions. Our bespoke tool not only establishes a baseline for reducing GHG emissions based on quantifiable targets, but also sets the starting point for designing actions to reduce them over a specific period.
Data collection is a critical step in understanding our carbon footprint and directly impacts the accuracy of the results. This phase for us was supported by a cross functional team of 15 employees across our Land, Offshore and Midstream Business Units, as well employees from our Corporate Services such as Supply Chain, Facilities & Property Management and Finance. A continuous work in progress, our calculations were done based on 2020 source data.
Our first solution-driven focus was the measurement and quantification of vented emissions from the facilities of our Land, Offshore and Midstream Business Units. Our process involved using an Optical Gas Imaging (OGI) camera system to detect (visualise), acquire data and quantify vented GHG Emissions in selected Land and Offshore locations. This was chosen as the first data improvement strategy based on our calculations, emissions from vented sources was one of the main contributors to our carbon footprint.
We also identified key milestones for our Energy Transition Framework to reduce our GHG, developed by a cross-functional team of 30 people. These include:
1. Setting baseline Energy Transition
Performance Targets (ETPT) in 2022 on completion of the GHG studies, analysis, business case, investment decisions and agreements on the scope of the GHG Reduction
Initiatives. 2. Completion of 30% of our GHG studies after 2022 to further inform our GHG ETPT targets.
3. Setting the second ETPT target in 2023 on completion of the remaining
4. Communicating annually on the relevant Key Performance Indicators (KPIs) and ETPTs, ensuring that upto-date information and reporting are available on our website.
We will also continue to refine and improve our data collection process through:
1. Fugitive emissions: defining an inventory with the total number of components and type of components per Business Unit, as well as an internal record of the monthly operational hours of these components.
2. Vented emissions: an alternative approach to estimate the vented emissions is the direct measurement at the vent locations using innovative technologies.

3. Gas-to-Oil Ratio: it is necessary to develop new measures of the GOR in Land operations per area into the
Business Unit thereby ensuring that a more accurate figure of the emissions related to vented emissions will be obtained. It is recommended that this analysis is updated every year for
Land and Offshore Operations.
4. Waste: defining an inventory by
Business Unit to identify the quantity of waste generated.
In the spirit of continuous improvement, we are working toward anticipating future needs and developing solutions to meet them.