YEARS AFTER:
Where Things Stand After 24 Months of COVID A recent survey of i-SIGMA service providers indicates some have weathered the past two years of restrictions and lockdowns better than others, with more than half reporting their status is as good or even better than it was pre-pandemic.
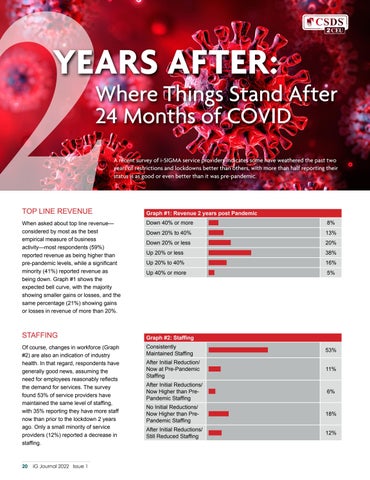
TOP LINE REVENUE When asked about top line revenue— considered by most as the best empirical measure of business activity—most respondents (59%) reported revenue as being higher than pre-pandemic levels, while a significant minority (41%) reported revenue as being down. Graph #1 shows the expected bell curve, with the majority showing smaller gains or losses, and the same percentage (21%) showing gains or losses in revenue of more than 20%.
STAFFING Of course, changes in workforce (Graph #2) are also an indication of industry health. In that regard, respondents have generally good news, assuming the need for employees reasonably reflects the demand for services. The survey found 53% of service providers have maintained the same level of staffing, with 35% reporting they have more staff now than prior to the lockdown 2 years ago. Only a small minority of service providers (12%) reported a decrease in staffing. _________________________ 20
iG Journal 2022 Issue 1
Graph #1: Revenue 2 years post Pandemic Down 40% or more
8%
Down 20% to 40%
13%
Down 20% or less
20%
Up 20% or less
38%
Up 20% to 40%
16%
Up 40% or more
5%
Graph #2: Staffing Consistently Maintained Staffing
53%
After Initial Reduction/ Now at Pre-Pandemic Staffing
11%
After Initial Reductions/ Now Higher than PrePandemic Staffing
6%
No Initial Reductions/ Now Higher than PrePandemic Staffing
18%
After Initial Reductions/ Still Reduced Staffing
12%


