7 minute read
Finding the key to perfect apples

Differences in fruit yield and quality among apple trees within an orchard is one of the biggest challenges for growers. Could more targeted water and nutrient application for trees on lighter soils reduce this variation? By Delwyn Dickey for Our Land and Water National Science Challenge (CC BY-4.0)
REDUCING VARIATION IN APPLE TREE YIELD THROUGH TARGETED WATER AND NUTRIENT APPLICATION Participants: 23 hectare (ha) apple orchard, Kono Horticulture, Motueka Project team: Greg Dryden (Fruition Horticulture), Mike Nelson (Fruition Horticulture) and Dr Ken Breen (Plant & Food Research) Report: What are the opportunities to reduce variability in apple tree productivity through targeted (subblock) water and nutrient application? (ourlandandwater/RPF2020)
Advertisement
TECHNICAL INFORMATION Project aim: To see if trees on different soil types on the same apple orchard blocks would benefit from a more targeted water and nutrient supply and reduce the difference in yield and fruit quality. • Sand made up about half of the
Riwaka silt loam between 35-45 percent. • Electromagnetic (EM) soil survey results showed differences in soil composition. • Chemical analysis found little difference in nutrient supply among the soil types and all samples. • Too much water and nutrients were being added to show any benefit from soil type variation, but benefits may arise if inputs are reduced.
Current orchard management sees a one-sizefits-all approach to irrigating the fruit trees without considering the different water- and nutrient-holding properties of the various soils across a block.
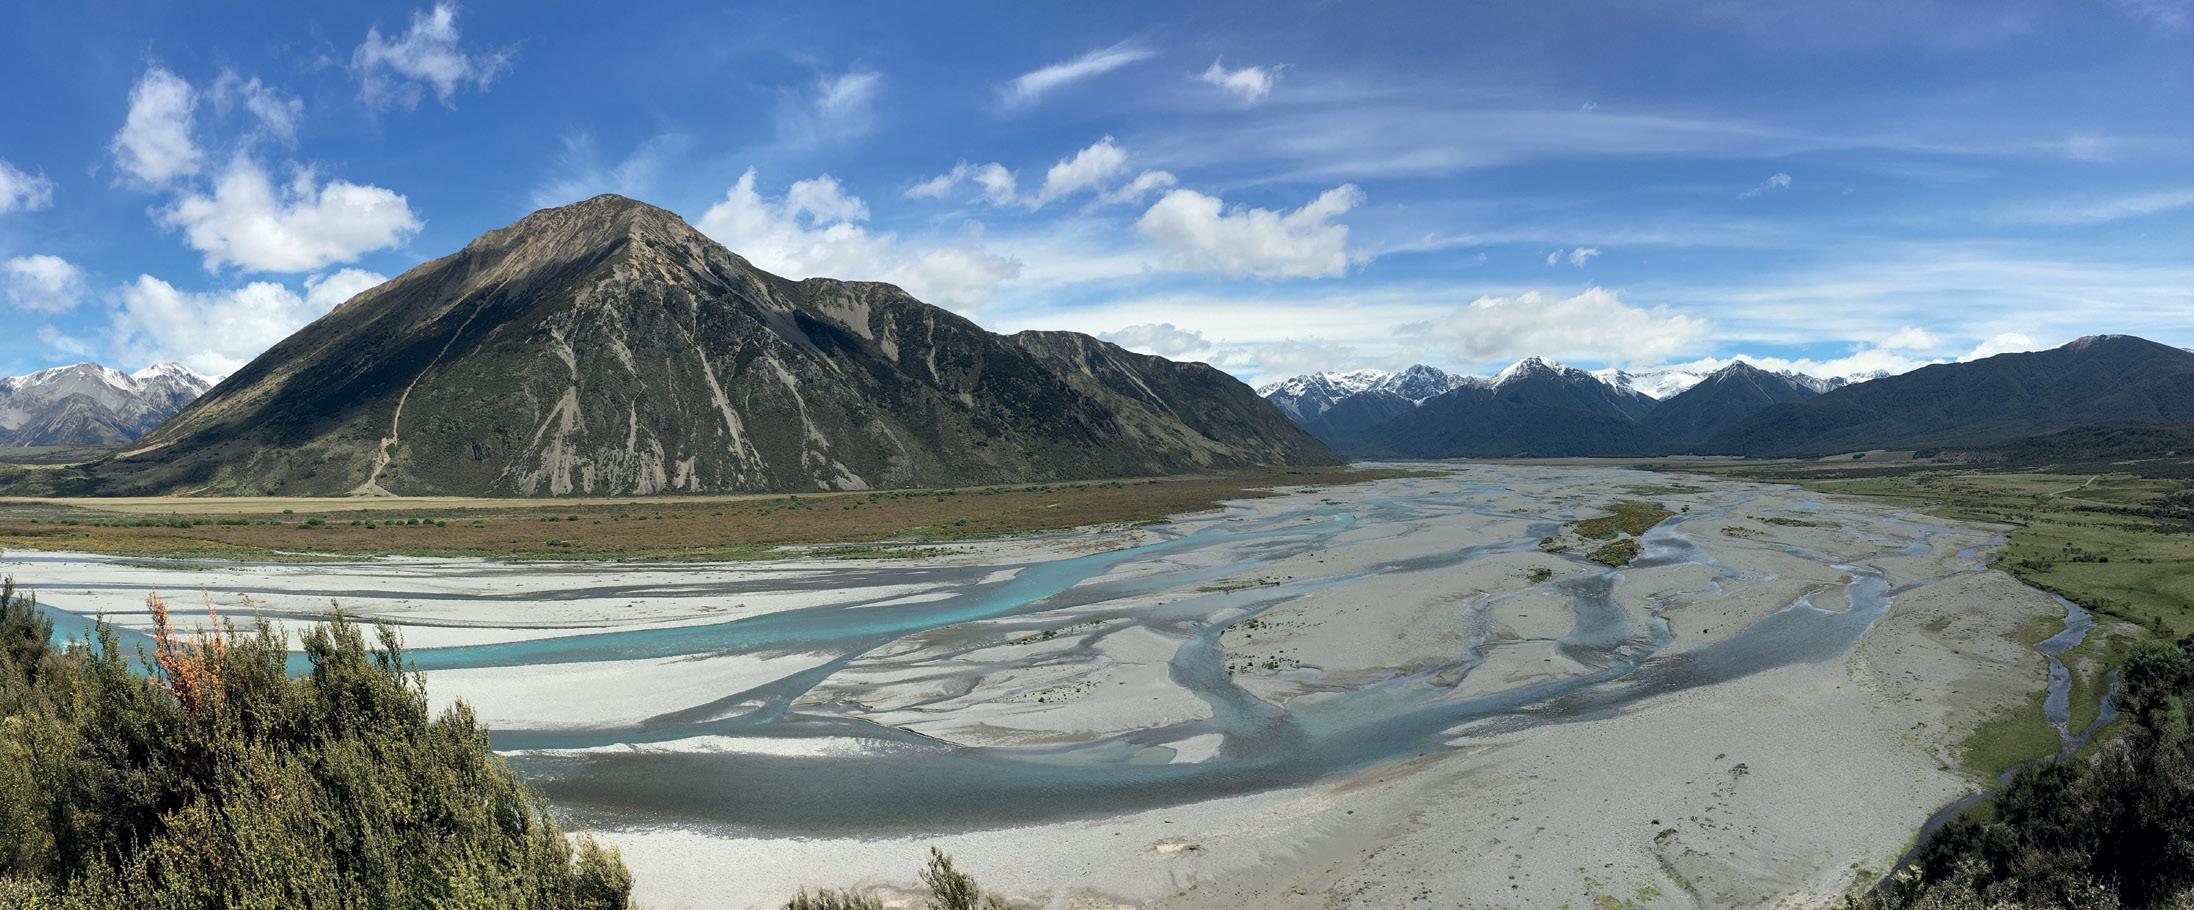
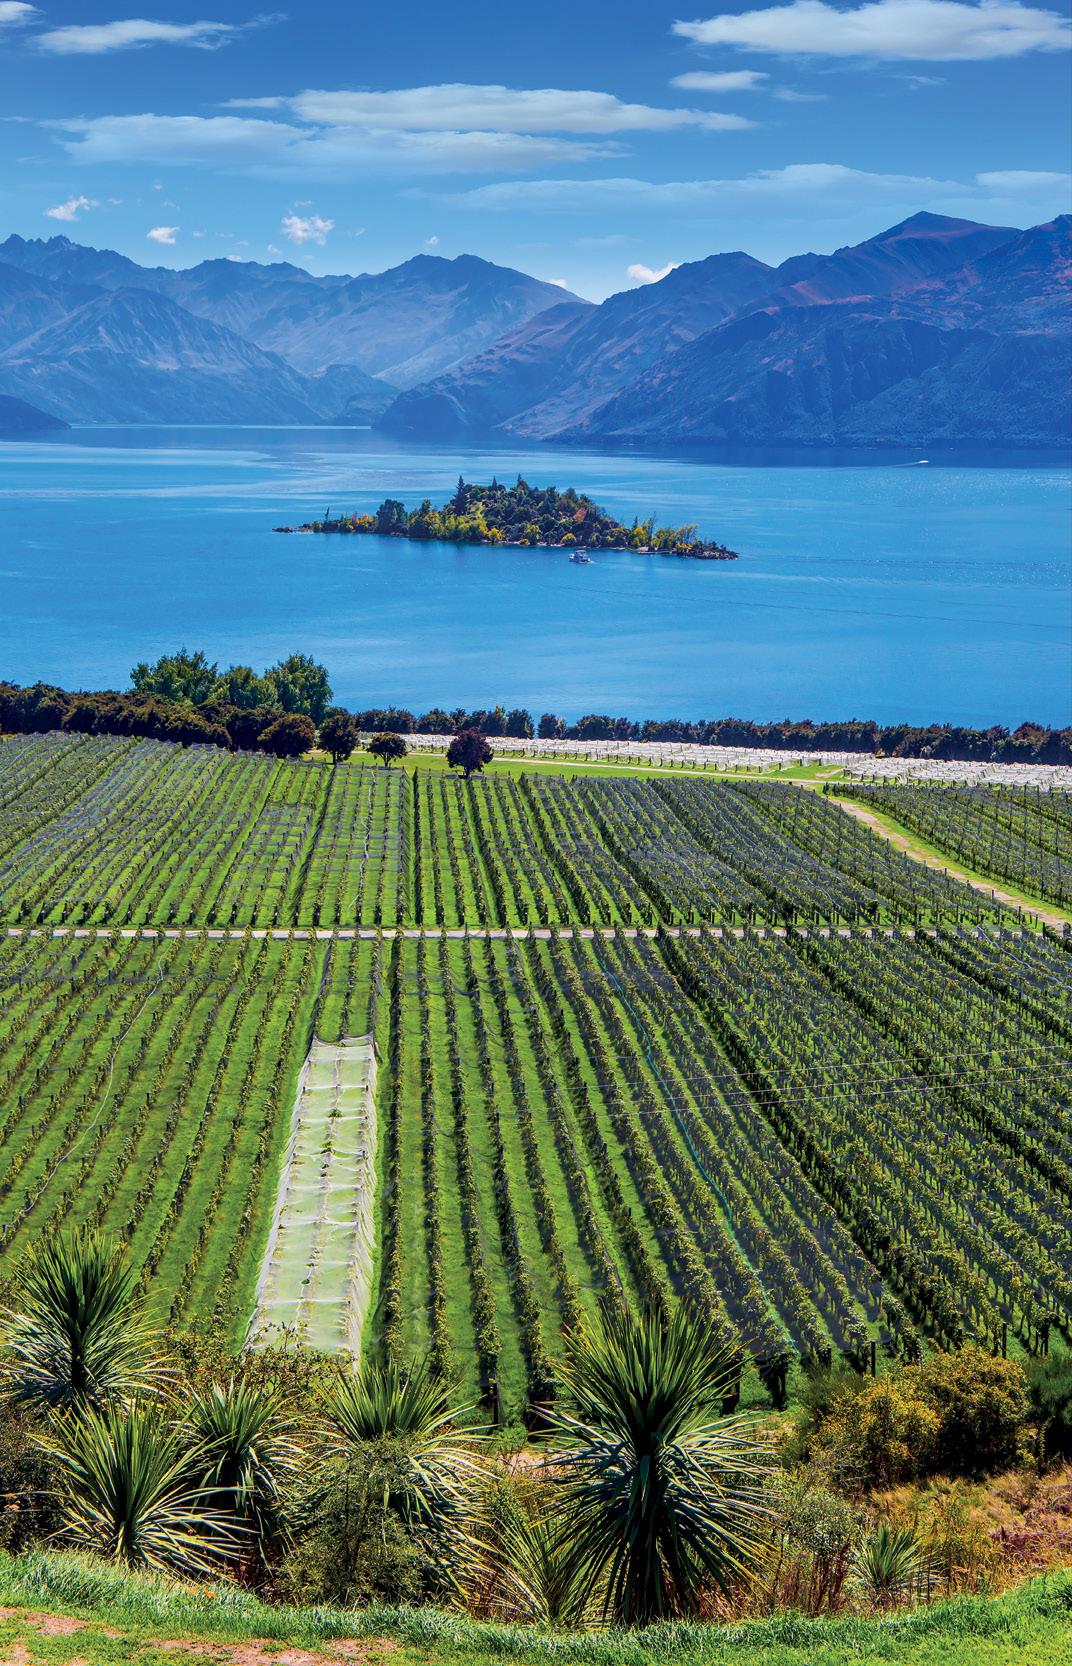
The vineyards and orchards that make up the horticultural food basket of the Nelson and Marlborough areas create a patchwork across the remains of huge river deltas. The rivers have meandered here over millennia on their way to the sea, distributing silt and clay, sand and gravel.
This makes for a complicated soil map in the area, where sweeping variations of soils can be found within the same orchard, hop or vineyard block.
For horticultural consultant and Fruition managing director Greg Dryden this can be challenging, as it leads to differences of yield and fruit quality in the various crops grown across the region. “Variation is probably one of the biggest limiting things in orcharding,” he says.
Greg could see the potential when fellow consultant Mike Nelson and plant physiologist Dr Ken Breen of Plant & Food Research were keen to run a research project through Our Land and Water with funding from the Rural Professionals Fund.
They wanted to look at the potential for reducing tree variability within an apple orchard using targeted water and nutrient application. Any insights from the project could be applied across the region.
New Zealand already has an enviable international reputation for apple production, with the highest productivity per hectare in the world. Averaging around 85 tonnes of fruit per hectare annually, 400,000 tonnes of these apples are exported fresh each year with a value of NZD$876 million.
Having more fruit across the orchard reach maturity at the same time, along with reducing the amount of low-quality fruit which attracts a lower value and often ends up processed, could mean significant gains for the industry.
DOES ONE SIZE FIT ALL?
Current orchard management sees a one-sizefits-all approach to irrigating the fruit trees without considering the different water-andnutrient-holding properties of the various soils across a block.
Was there a relationship between the various soil types and the health and productivity of trees growing across a block? If there was, could putting in an additional water/nutrient line through the orchard, to give more targeted supply, reduce the variability in fruit and justify the installation cost?
The more sand there is the less water the soil can hold, and the more frequently you should be irrigating, says Mike Nelson. He wondered if trees growing in an area of soil with a lighter texture could have suffered a wee bit every month, affecting their health and productivity compared to trees on more silt and clay soils which hold moisture better.
Kono Horticulture gave the team access to one of their apple orchards in the Motueka area and its production data. The 23 hectare block, planted up with 10-year-old ‘Scilate’ (Envy™) on ‘M9’ rootstock, had four soil types running through it. The lighter soils – Hau stony sandy loam, Riwaka medium sandy loam and a heavier Riwaka silt loam – were chosen to give a range of soil textures.
There were 20 plots within each soil type with about 21 trees per plot. The circumference of the trees’ trunks in each plot was measured 20cm above the graft union to find the trunk’s cross-sectional area (TCA), giving an idea of the historical vigour of the trees.
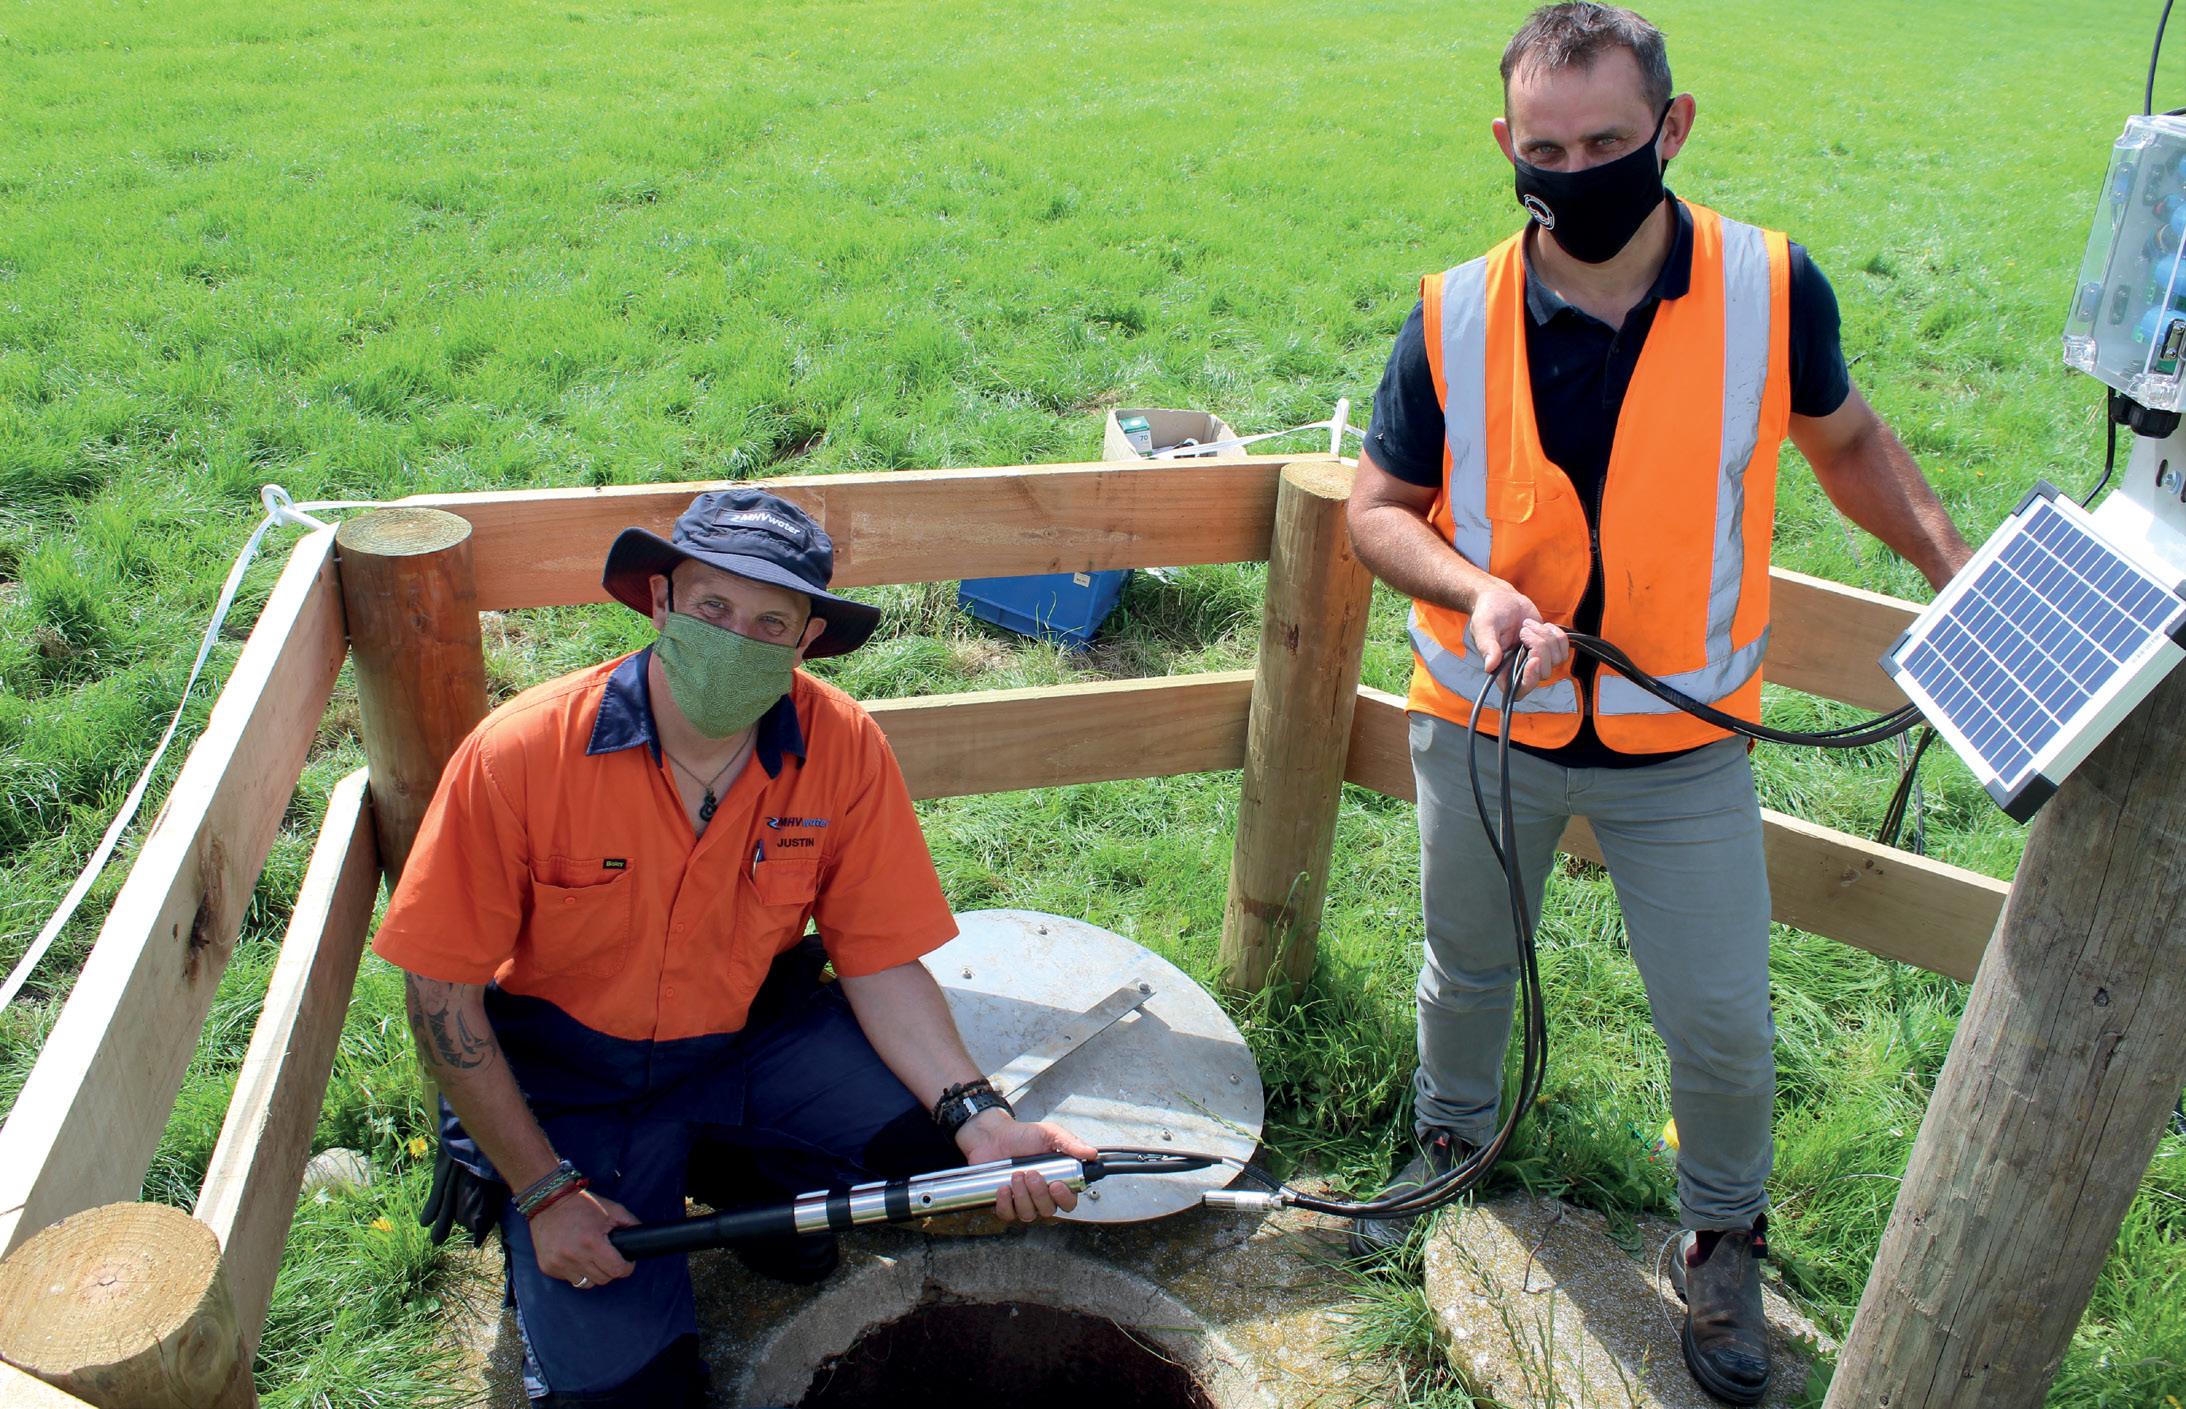
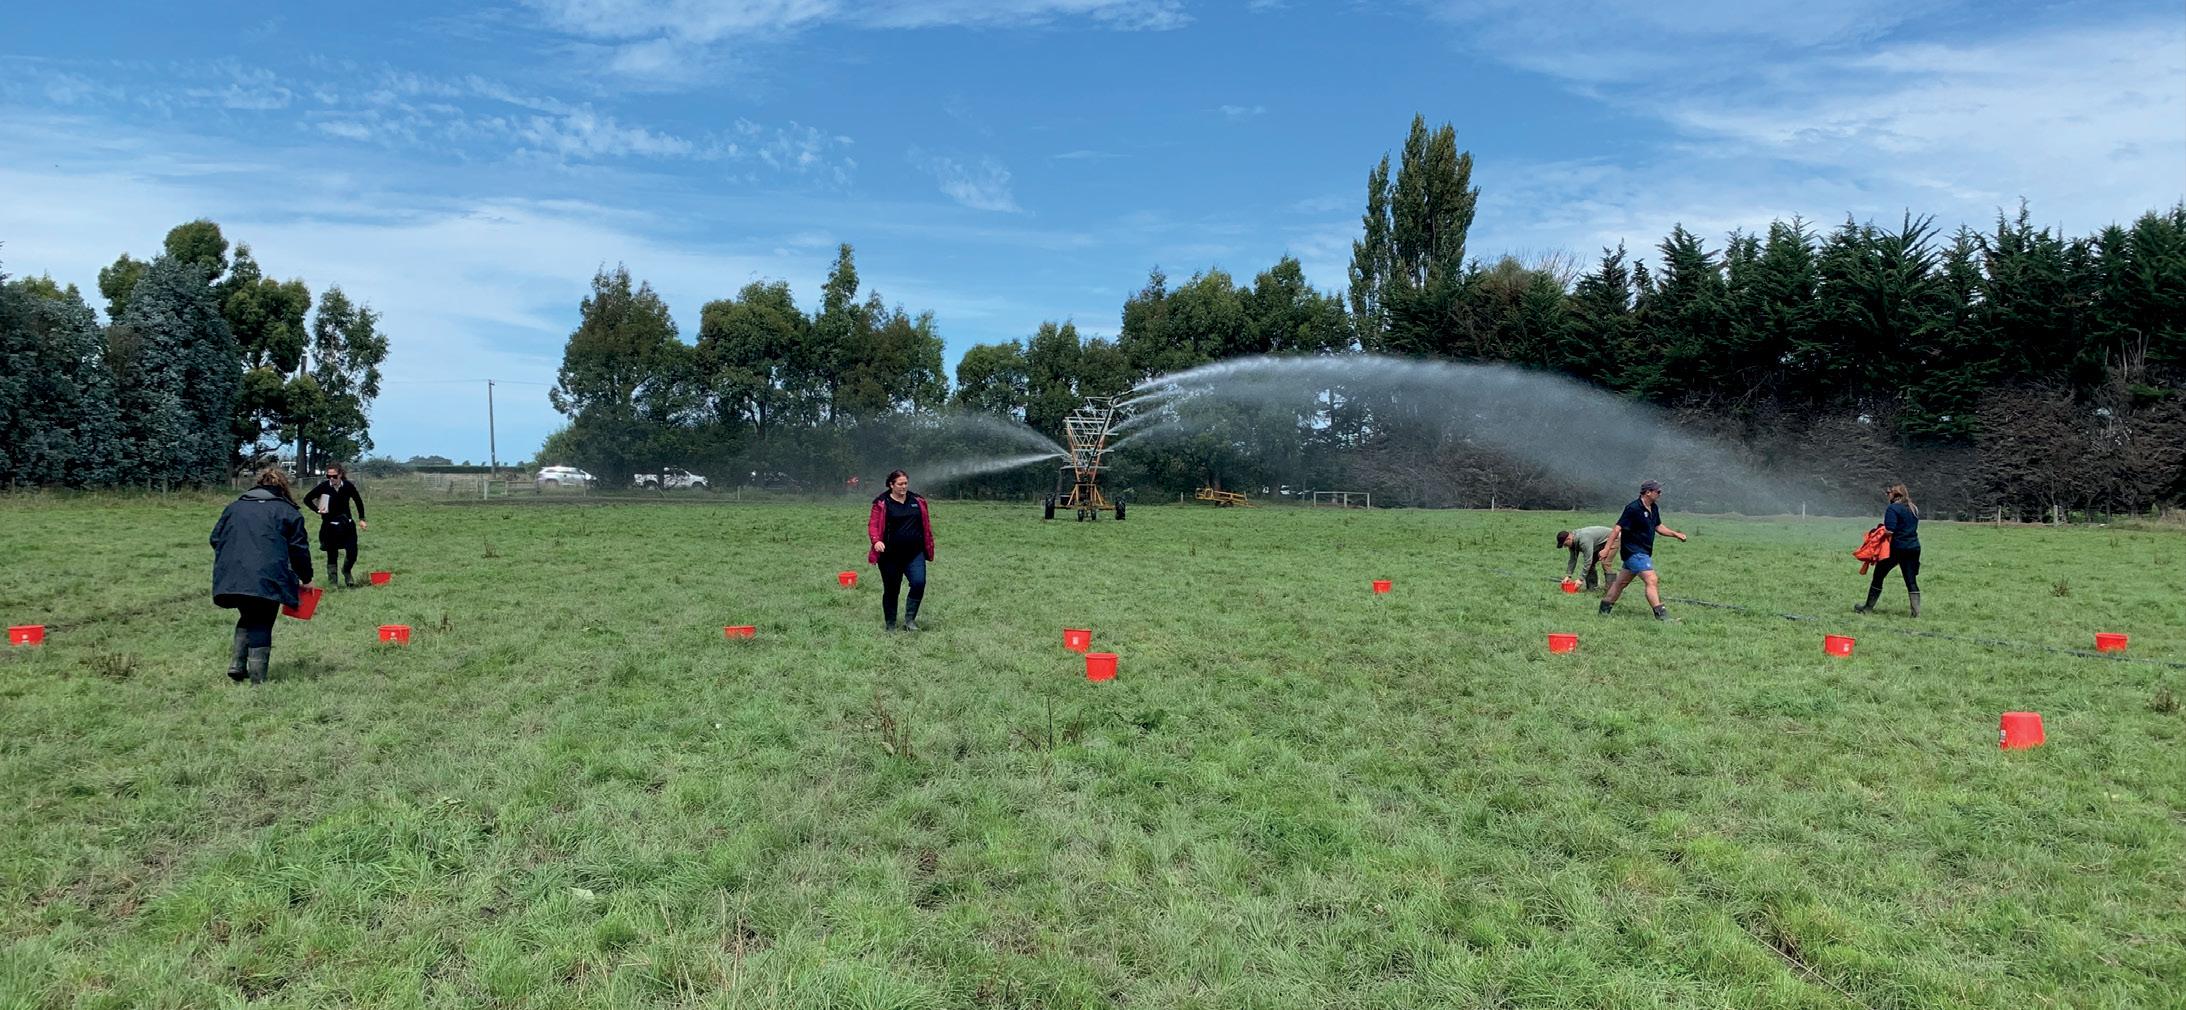
Soil moisture levels were monitored using Sentek continuous monitoring probes to 90cm on one site on each soil type.
Soil composition (texture) for each plot was found by mixing multiple samples taken in the top 15cm of soil, breaking particle bonds by vigorously shaking powdered detergent with water and letting the soil settle into its constituent particles of sand, silt and clay. Soil samples were also sent to Hill Laboratories for chemical analysis.
Next, an electromagnetic soil survey was undertaken (see Figure 1). Coarse soil texture like sand has low electrical conductivity, clay soils high, and silt soils medium conductivity. Measurements were taken at two depths (0.4m, 1.2–1.4m), with mean values for each plot derived from a 3m radius from the plot centre.
Plans to take yield data from the trees in the various plots were dashed after the area was pelted with hail in late December and management changed to help the trees recover. Fruit load was then estimated on 7–10 trees within each plot.
In February, when the trees were most likely to be struggling in the heat and dry of summer, a snapshot of the orchard block was taken by satellite using normalised difference vegetation index (NDVI) imaging (see Figure 2).
When plants are growing vigorously with lots of photosynthesis going on, they absorb visible light (especially red light) and reflect large amounts of near-infrared light. Stressed plants absorb very little red light.
In the images, lots of blue and green equates to vigorous growth while yellow, orange and red represent reduced photosynthesis, stressed trees and less vigorous growth.
VIGOUR ISN’T BETTER

Smaller trees growing in Hau stony sandy loam (left) produced more than larger trees growing in Riwaka silt loam (right).
Figure 2: NDVI satellite mapping measures nearinfrared light reflectance on the Motueka orchard.
The NDVI threw a bit of a curve ball. Instead of showing trees in stress on the sandier parts of the block, it actually showed little stress anywhere and a lot of unwelcome growth. There was likely an oversupply of water and nutrients to virtually the whole block, with management practises probably behind this. There is a tendency to oversupply to ensure there is no undersupply of water and nutrients.
The trees showing most vigour (blue) were those with the biggest trunks, indicating this oversupply had been going on for some time.
While big vigorous trees might sound ideal, they don’t produce the most fruit. Big trees put more energy into shoots, leaves and branches, diverting nutrients away from the fruit, which has a negative impact on its colour, flavour and looks. Only the leaves around the fruit do the work to size that fruit up.
Bulkier trees also shade their lower buds. Orchardists are after fruit over the entire height and breadth of the tree.
Over a three-year period, the smaller stony Hau trees produced about 33 percent more fruit than the bigger silt loam trees, but had about half the biomass.
NEXT STEPS
While the trial did not show a need for targeted watering, it did point to a need to investigate reducing inputs of water and nutrients.
112%

Hau stony sandy loam Riwaka medium sandy loam Riwaka silt loam

EC_Deep_dS
1.6748 – 2.2300 2.2301 – 3.1400 3.1401 – 3.7700 3.7701 – 4.9300 4.9301 – 8.0000 Figure 1: Electromagnetic (EM) survey mapping of the Motueka orchard showing variation in soil type as indicated by electrical conductivity (salt concentrations).
Hau stony sandy loam
– 0.8
– 0.6
– 0.4 NDVI
Riwaka medium sandy loam Riwaka silt loam