3 minute read
Advanced Land

from IRJET- Assessment of Impact on Simulated Watershed Rainfall-Runoff using Open Source Remote Sensing

Volume: 08 Issue: 04 | Apr 2021 www.irjet.net p-ISSN: 2395-0072
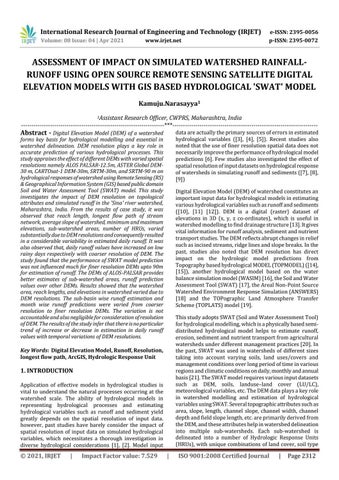
the water balance is simulated at this level before runoff is routed to the reaches of the sub-basins and then to the basin channel. Surface runoff volumes were estimated using the modified SCS curve number method [30], which uses an empirical relationship between rainfall and runoff that provides a consistent basis for estimating the amount of runoff under varying land-use, soil types and antecedent soil moisture conditions
Advertisement
2.1 Brief of Study Area
Sina river is a large tributary of the Bhima river which is starting near Ahmednagarcity, and it is one of the large left bank feeder of the Bhima rises 22 km West of Torna in Ahmadnagar district and runs south-east through Ahamdnagar and Solapur district to fall into the Bhima near Kudul about 25 km south of Solapur on the Maharashtra and Karnataka boundary. Sina river has two chief sources one near Jamgaon about 20 km west of the town of Ahmadnagar and the other near Jeur about 16 km to its north-east. The Sina is crossed by five ferries one in Madha at Kolgaon and four in Solapur at Lamboti, Tirha, Vaddukbai and Vangi. Of its entire length 180 km the river has a length of 17 km within the district. For a distance of 55 km roughly, the river forms boundary between Ahmadnagar district on the one hand and Beed district on the other. On the right, it receives the water of Mahekri, and ultimately joins the Bhima on the Karnataka state border. It has earth filled Sina Dam near Karjat in Ahmadnagar district.
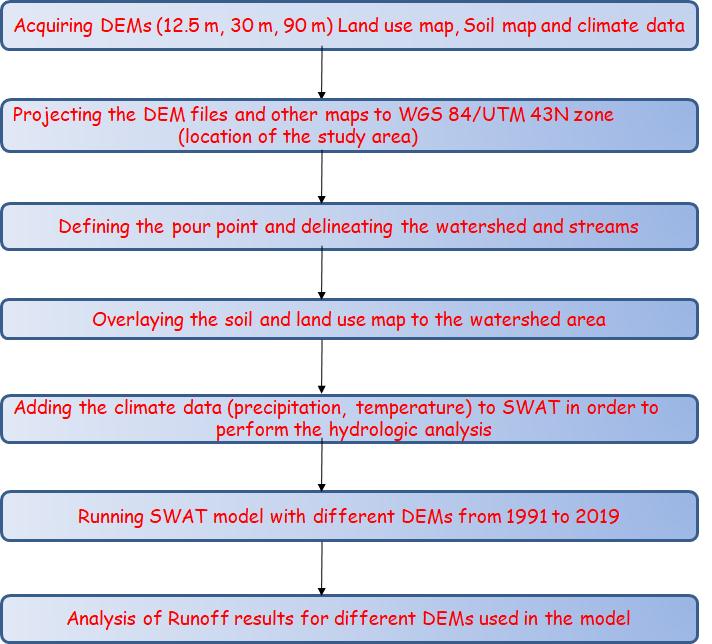
‘Sina’ watershed was selected as a case study for evaluating the effect of spatial resolutions of DEM on hydrological response of watershed specifically for runoff. The Sina river watershed lies between latitudes 17o25′ –19o15′N and longitudes 74o10′ –76o05′E. The location map of study area is shown Fig.2. The areal extent of the study area is 12,304 km2. The climate in the study area is semi-arid with an average annual rainfall of 715 mm and is a typical rain fed watershed characterized with dry land crops the average values of monthly minimum and maximum temperatures recorded in summer ranges from 26 to 42.5oC and the monthly average temperature recorded in winter ranges from 16 to 29oC. Fig-1: Flow chart of Methodapplied
2.2 Input Data utilized for SWAT Model
The input spatial data sets for the SWAT model are DEM, land use map, soil map and hydro-climatic data.The land use (2016) obtained from Bhuvan-ISRO web portal [31] and soil map from FAO-USGS [32]. Thirty-six years (1985-2020) of daily precipitation, maximum and minimum temperature data at 5 different locations were downloaded from NASAPOWER web portal [33]. Theweather data from 5 different locations downloaded in and around thecatchmentnamely (i)Solapur, (ii)Barshi, (iii)Karmala, (iv)Beed, (v)Ahamdnagar.
2.3 Digital Elevation Model
Digital Elevation Model (DEM) data plays an important role in SWAT modelling. The topographic attributes of the subbasin, including area, slope, and field slope length are all derived from the DEM. So are channel length, channel slope, channel width, and channel depth, if the channel is automatically generated based on DEM but not previously defined. Five freely available global DEM products including Advanced Land Observing Satellite–Phased Array type Lband Synthetic Aperture Radar (ALOS-PALSAR) 12.5m, Advanced Space borne Thermal Emission and Reflection Radiometer (ASTER) Global DEM 30m, CARTOgraphy and SATellite (CARTOSAT-1) launched and maintenance by Indian Space Research Organization (ISRO) 30m and Shuttle Radar Topography Mission (SRTM) 30 m and 90 m resolution DEMs were considered for this study and details of these DEMs are shown in Table-1.