2 minute read
Shuttle Radar

from IRJET- Assessment of Impact on Simulated Watershed Rainfall-Runoff using Open Source Remote Sensing

Volume: 08 Issue: 04 | Apr 2021 www.irjet.net p-ISSN: 2395-0072
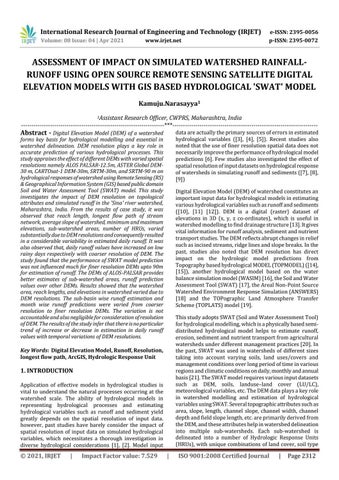
DEMs of CARTO-30m and SRTM-90m. The results indicated that there is a significant difference in the hierarchy order and segmentation of the stream networks in the watershed.
Advertisement
Fig-3: Stream network of ASTER& SRTM DEMs
Fig-3 Stream network of ASTER & SRTM Dems
Fig– 3 Stream Network fromCART-30m & SRTM-90mDEMs
Further, the results show that with decrease (coarser) in DEM resolution, it tends to overestimate the minimum altitude and underestimate the maximum altitude. This may be due to the loss of detailed topographic information at coarser resolution. In earlier studies by Lin et al (2010) [14] and Peipei et al (2014) [17] also noted that coarser DEM resolution increased the uncertainties of altitude and slope.
3.3 Simulation Results of all DEMs-Subbasin wise
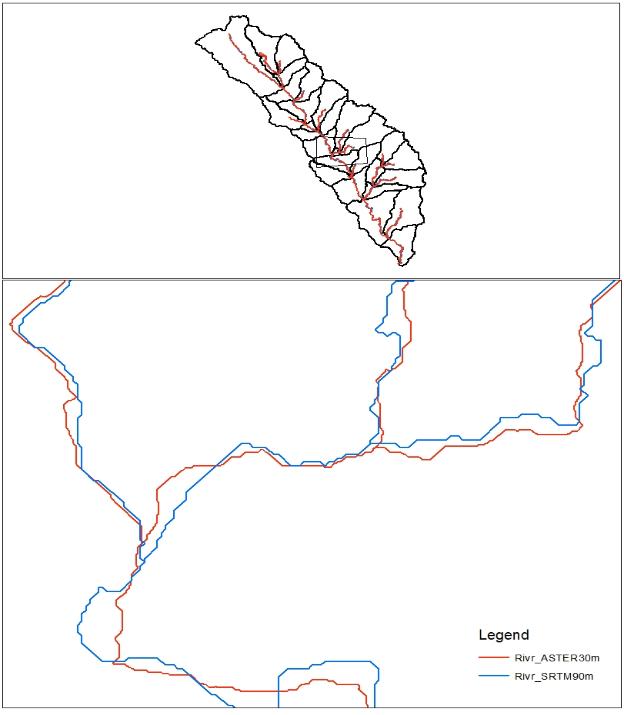
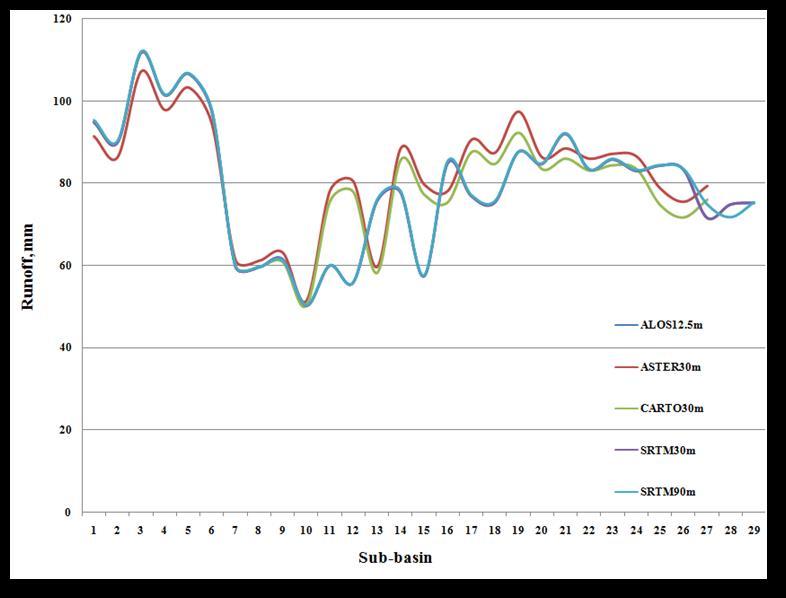
First, the SWAT model was applied with ALOS-12.5m DEM to simulate surface runoff in 'Sina' watershed for daily time scale. The corresponding results of SWAT simulated daily runoff during 1985-2020 are present in Fig.4.
The SWAT model predicted the runoff well during the high flow period, i.e in the months of June-August, but tends to over predict the runoff during September-October months. Further, the SWAT model was executed by inputting different DEM resolutions of ASTER-30m, CARTO-30m, SRTM-30m, and SRTM-90m. The results of SWAT simulated runoff for the period 1985-2020 for five DEM resolutions are presented in figure 4, which shows low variability of simulated values among the different DEMs. Also, from Table-3, it can be inferred that the estimated runoff varied with both coarser and finer resolution. The performance statistics also indicate that the accuracy of estimated daily runoff have decreased moderately with changes in DEM resolution. Results of SWAT simulated runoff according sub-basin wise for the period of 1985-2020 for five DEM resolutions are presented in Fig.4.The results show that the daily runoff values have increased (decreased) for low (high) rainfall days with coarser resolution DEM. Sina watershed divided into 29 and 27 sub-watersheds based on the DEM resolution. Accordingly,ASTER-30m DEM predicted higher runoff in 15 sub-basins, the coarser resolution SRTM-90m DEM predicts higher runoff in 11 subwatersheds. From ALOS-12.5 and SRTM-30m resolution DEMs predicts higher runoff in 2 and 1 number of subwatersheds respectively. This result reveals that, there was no particular trend of increase or decrease in runoff resulted from ‘Sina’ watershed based on their resolutions of DEM. The tabular results are represented in the form of graph as shown in Fig. 3. The runoff values in allfive DEMs not varied much and in the first 5 sub-basins the runoff predicted higher than the remaining sub-basins.
Fig-4 Runoff events for all DEMs, sub-basin wise
It is also noted that the SWAT model is very sensitive to SCS curve number values, which in turn very sensitive to land use. It is also observed that sub-watershed delineation varies with the DEM resolution and it directly affects the values of land use mapping areas within the watershed. The variation in runoff values for different resolutions can be attributed to the changes in sub-watershed areas and individual land use mapping units.
3.4 Simulation Results of all DEMs-Month wise
The Runoff predicted for all 5 categories of DEMs listed in table 4. The tabular values of runoff reveals that, ALOS12.5m DEM has finer or high resolution not shows any high runoff prediction. The other 30m resolution DEMs of ASTER, CARTO and SRTM not showing any trend of either increase or decrease of runoff. The total runoff obtained for the entire