20 minute read
Fig 1 Plan and section of Proposed Building
from IRJET- Analysis and Design of G+10 RCC and Steel Frame Structure in Different Seismic Zone using STA
Volume: 07 Issue: 12 | Dec 2020 www.irjet.net p-ISSN: 2395-0072
sudden increase in the expected load, the calculated loads are likewise combined to ensure the safety of the structure under different maximum expected load scenarios. These combinations are specified in different code books according to the type of load and structure.
Advertisement
2. LITERATURE REVIEW
Dinesh Dhanji Patel, Deviji Kuverji Patel, Khimji Lalji Pindoria. The authors listed the causes of the damage that occurred during the 2001 earthquake in Bhuj, Gujrat, India. The clear cause among all others is old structures older than modern building practices. Photographs are presented showing the relevant details in the various failure categories and are therefore very good documentation of this type as well as provide detailed guidance for the general public, owners and engineers on how to repair various types of structures as well as for new structures.
Kevadkar M.D., Kodag P.B. (IJMER). Lateral Load Analysis of RCC Buildings. (IJMER). The authors emphasized the need for "lateral load analysis" as these loads can cause high stresses, swaying motion or vibration. Therefore, it is important that such structures, as well as new structures, can withstand vertical and transverse forces. In addition, they discuss strengthening methods such as providing a shear wall, steel bracing. They compared the steel bracing with the shear wall method and concluded that the steel bracing is better than the shear wall.
Bhaiswar N.N., Shelke K.S., Mehere M.D, Dhapekar N.K., Awatade S.M. ( ANUL XIX, NR. 1,2012 ISSN 1452-7397). Principles of designing earthquake-resistant buildings and post-earthquake research, a structural engineering perspective. The authors emphasize the design principles of earthquake-resistant buildings and earthquake-proof effects from a structural point of view, which were compulsory during construction. They explained aspects of precautionary measures from structural aspects. Finally, summarize the need for the design engineer to follow the appropriate IS codes, which will reduce the death toll.
Tabish Izhar, Samreen Bano, Neha Mumtaz: Aimed at comparative studies, analysis and design of a reinforced concrete building under the influence of seismic forces for various code guidelines. The main purpose of the work is to conduct a detailed seismic analysis and structural design on the STAAD PRO simulation tool of a multi-storey building plan. This study focuses on exploring the advantages of multi-story building seismic design using different national standards with STAAD PRO on a global level with ease of use.
3. PROPOSED BUILDING DETAIL
Proposed framed structure is a 33m high 10 storied made up of RCC and Steel with overall plan dimension 28.0 m x 20.0 m. The RCC structure will be analyzed and designed as per each of the seismic zone and later will be compared with the result of it.Similarly, the Steel structure will be analyzed and designed as per each of the seismic zone and later will be compared with the result of it. For this the component of structure, type of material and required data is selected as per suitability.
Table -1: Details of Proposed Building frame
Description of Building Frame
1 Plan Dimension 28m*20m
2 Building height 3 Storey height 4 Number of storey 33m
3m
10nos.
5 Depth of foundation 3m 6 Grade of Steel Fe-415
7 Grade of concrete M-30
8 I-Section ISHB200
9 I-Section
10 I-Section
11 Tube(British) 12 Seismic zone ISHB400
ISHB150
TUB1501006.3
All four seismic zones
Fig -1: Plan and section of Proposed Building
4. METHODOLOGY
The selected model will be made of RCC and Steel as per proposed building material mentioned above for a 10 storied building with the building height of 33m. Through STAAD.Pro a 3-d model has been developed which is the frame of both RCC and Steel structure in which the dimension of beam, column and slab thickness is applied. All the members in the frame can be seen in the 3D model through which the visualization of frame is possible. Before the loads are applied the factors for seismic load and soil factor is decided, Also the foundation is designed but the foundation is notshown in the 3D model.
Volume: 07 Issue: 12 | Dec 2020 www.irjet.net p-ISSN: 2395-0072
4.1 Analysis and Design Procedure
At first step of modelling the geometric design of the structure is defined and the frame of structure is obtained with no dimensions of the members.As the members have no dimension so the property of the members of frame is assigned. Slab or surface elements other than frame is also created and their propertiesare assigned.Then the support to frame is assigned as per requirement. After assigning of the supports the load is applied by selecting the member on which load is affecting.Then the analysis is done to find the errors. After which we can design the structure. Then the result is obtained for design. And then the report for different zones can be compared.
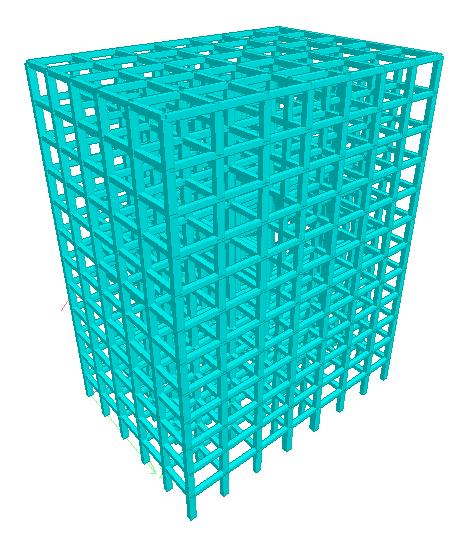
Fig -2: 3D Rendered RCC Frame Isometric View
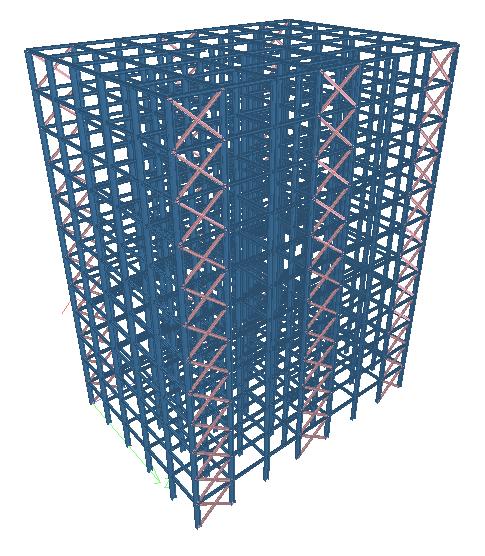
Fig -3: 3D Rendered STEEL Frame Isometric View
4.3 Points to be Compared
Through this analysis we’ll compare the Load behavior of members, Stress distribution, Moment on members, Area of reinforcement in beam and column, change in dimension of column and beam, providing shear wall if required in any zone, quantity takeoff, type of material and grade of material chosen, design parameters and Displacement of structure.
5. DESIGN RESULTS AND REPORTS
Beam numbers and the column number in the frame for each storey has to be provided so that the changes in dimension and reinforcement of members in structure for each zone can be recognised by their number.
Fig -4: Plan and section of Proposed Building
5.1 Zone 2 RCC Design Results
The design of RCC frame results in changing values of column dimension chosen earlier. Also on application of loads the value of maximum loads is to be analyzed for both nodes and beams. As it is difficult to show the design and changes in each and every beam and column so a few of the beams and columns experiencing maximum changes are shown through figures.
4.2 Design
STAAD is a software which has the capabilities of performing concrete design bylimit state method of IS-456 (2000).
RCC Frame design: Beams are design for flexure, shear, and torsion. If required the effect of axial forces may be
5
considered. For all these forces, all active beam loadings are pre-scanned to identify the critical load cases at different sections of beams. Columns are design for axial forces and biaxial moments at the ends. All tests are executed to calculate reinforcementwith active load cases.
Steel Frame design: For steel design the material selected will be steel and code selected will be IS 800. The design parameters include track and takeoff. Yield strength of steel selected is 550000 kN/m2.
Foundation Design: The type of foundation selected for design is mat foundation with properties and design parameters of Slab design thickness as 600 mm, Subgrade modulus as 10000 KN/m2/m, Soil density as 22 KN/m3, Depth of foundation as 3m, Mesh region with 1m offset to the column boundary, Fc as 30 KN/m2 and Fy as 415 KN/m2.
6 7 95 96 97 98
Volume: 07 Issue: 12 | Dec 2020 www.irjet.net p-ISSN: 2395-0072
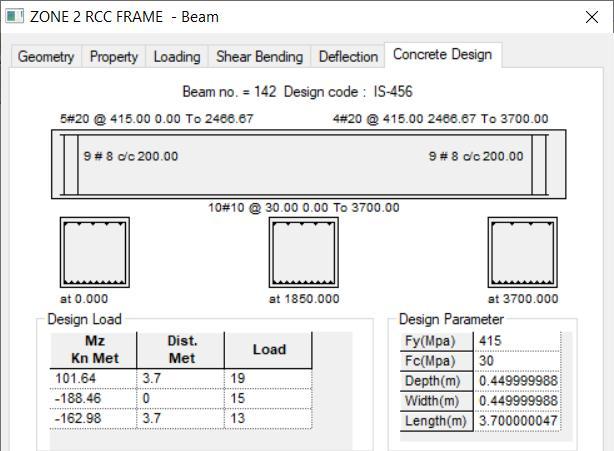
Fig -5: Beam design result in Zone 2
5.2 RCC Frame Material Quantity for Zone 2
Concrete quantity represents volume of concrete in beams, columns, and plates designed above. Steel quantity represents reinforcing steel in beams and columns designed above. In the reported quantityreinforcing steel in plates is not included.
Total volume of concrete = 1293.6 cu.meter Total volume of steel= 851730 Newton
5.3 Zone 2 Foundation Design Results
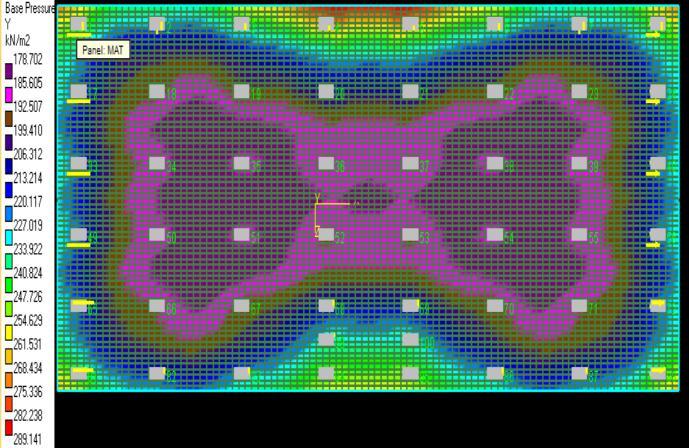
As for the RCC frame the loading variation is also supposed to be analysed for the foundation.Andit can be seen in the reaction load curve for the x direction the max load intensity is gradually increasing and the minimum load intensity is gradually decreasing as similar to the RCC frame.
Fig -6: Base pressure in Zone 2
5.4 Zone 2 Steel Frame Design Results
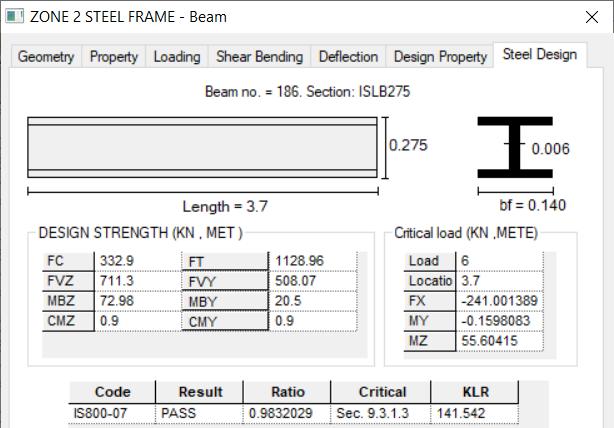
As for the design of the steel frame the selected members will be as per the selected assigned section but after the complete design and analysis the software changes the section with a suitable section to carry load without failure. So the dimension of the section is not specified in this and only the design report of selected membersand takeoff will be shown.As it is difficult to show the design and changes in each and every beam and column so a few of the beams and columns experiencing maximum changes are shown.
Fig -7: Steel section design result in Zone 2
5.5 Steel Frame Material Quantity for Zone 2
On analyzing the Steel Structure we’ll get the most suitable and most economical design in which the section provided or selected by the software itself will be the lightest but safest to carry the load without failure. Total volume of steel= 2250744.331 KN
6. COMPARISON OF RESULT
One of the Objective of this study is also to compare the quantity of structure so it became important to analyseboth the steel and RCC structure through it. The loads at each node and beam are analysed and compared with the data of each frame structure to obtain most feasible design factors.
6.1 Observations in RCC Frame
The maximum and minimum load and moment are both seen in the nodes at support (at the lowest nodes of the structure), So these loads are further countered in foundation design. All those nodes with maximum and minimum intensity are present in the central portion of the structure along X-axis or say center of the longer side. It is observed that there is a gradual increase in maximum loads and moment along each axis from zone 2 to zone 5 respectively. It seems that the minimum loads and moment keeps on gradually decreasing along each axis from zone 2 to zone 5 respectively. As the seismic loads are periodic it seems to be both positive and negative with almost similar type of curve shown in graph for maximum and minimum values.Through this it is clear that with the increasing loads and moment at the nodes the reinforcement or the crosssectional area of the member will be increased to avoid failure while moving from zone 2 to 3 and so to 4 and so to zone 5 respectively.
Volume: 07 Issue: 12 | Dec 2020 www.irjet.net p-ISSN: 2395-0072
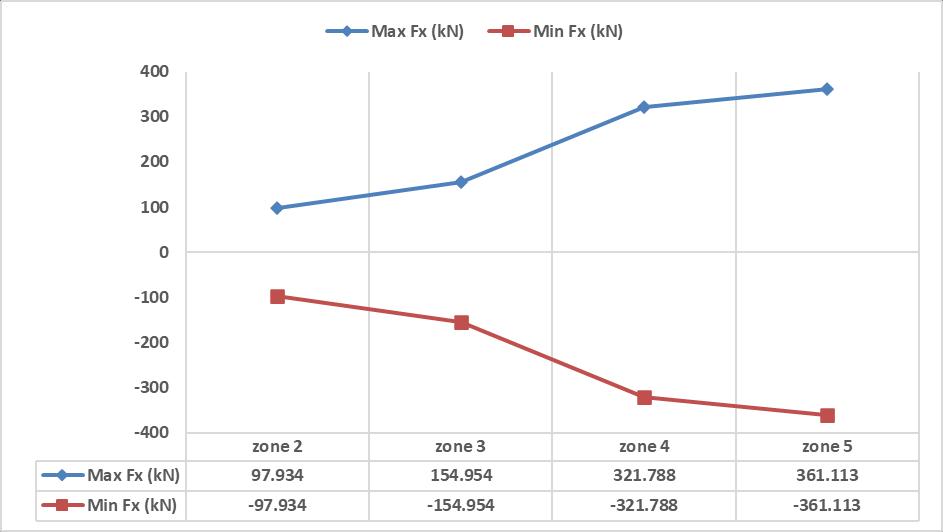
Chart -1: Loadalong X direction at node in RCC frame
The maximum and minimum loads and moments are experienced by the beam (both beams andcolumns) at the center of the structure along the x direction or to say at the center of the length. These members are either at stair case portion or at the lift portion opposite to staircases at front. The maximum and minimum load along X and Z direction and moments are only affecting the column of the structure upto zone 2 to zone 4.But at zone five due to high load both beams and columns cross section is redesigned to sustain failure.The maximum and minimum load along Y direction highly affecting the beams at zone 5. All these loads and moments at each zone increases gradually.It can be seen in the graph as the values go increasing with zone 2 to zone 5 in case of maximum and goes decreasing with zone 2 to zone 5 in case of minimum loads and moments.
Chart -2: Loadalong X direction at beamin RCC frame
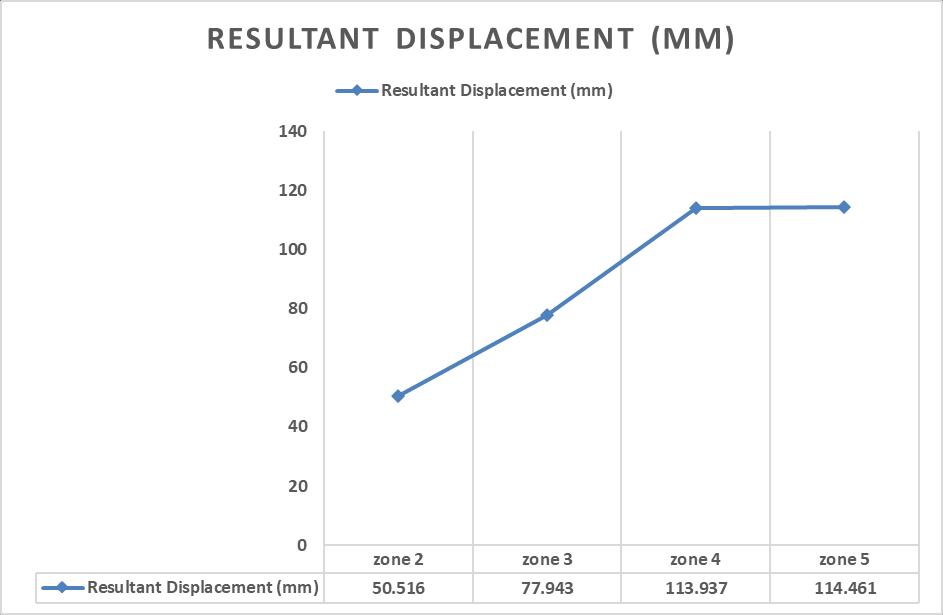
The gradual increase in displacement on moving from zone 2 to zone 4 can be clearly seen in this graph.It is observed that the node displacement in zone is quite lower than the displacement in zone 3. And there is a sudden rise in displacement at zone 3 and zone 4 from the previous zone. But at zone 5 the displacement graph shows no such high increment in displacement compared to the previous zone.It is quite similar to the graph of load and moment at both beam and node.It is also observed that the nodes or joints experiencing maximum displacement are all present at the top floor level in the frame.
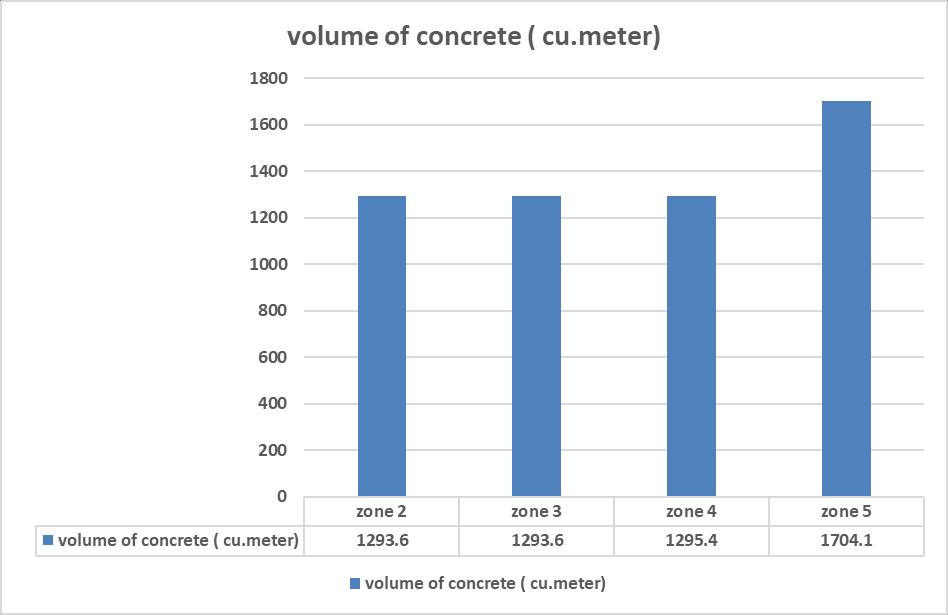
Chart -3: Resultant displacement at node in RCC frame Through the graph it is observed that there is no such difference in quantity of concrete in zone 2, 3 and 4. But the increase of quantity of concrete in zone 5 is comparatively very high as compared to another zones. As in zone 5 the beam dimension is also changed as the beam fails in large numbers. And to match the flexure, column dimension is also changed. As the reinforcement provided in other zone except zone 5 is not crossing the limit of reinforcement ratio or affecting the proper reinforcement arrangement. Due to increase in concrete the dead load of structure also increases which result in failure of foundation with previous zone dimensions.
Chart -4: Volume of concrete in RCC frame
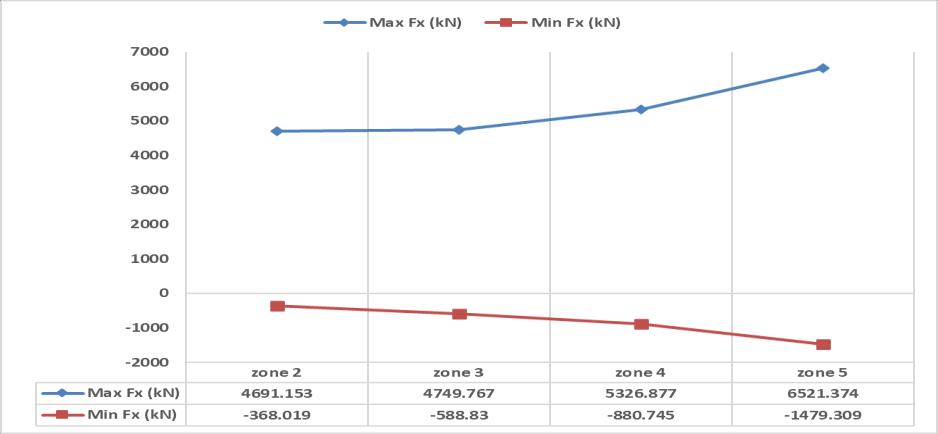
It is observed that apart from quantity of concrete the quantity of steel in structure increases gradually in each zone. Through the percentage increase graph the difference of steel quantity of z0ne 5 and zone 4 is still the maximum as compared to the differences in other zones. As it is clear now that due to the maximum load experienced by the structure in zone 5 it is necessary to keep a safe margin in reinforcement provided to the structure. As the reinforcement provided is observed maximum in the columns at edges and corners of the frame of structure. It should be kept mandatory to provide more reinforcement and increase the area of concrete by increasing the dimension of the column positioned at the corner and edges of the frame of the structure.
Volume: 07 Issue: 12 | Dec 2020 www.irjet.net p-ISSN: 2395-0072
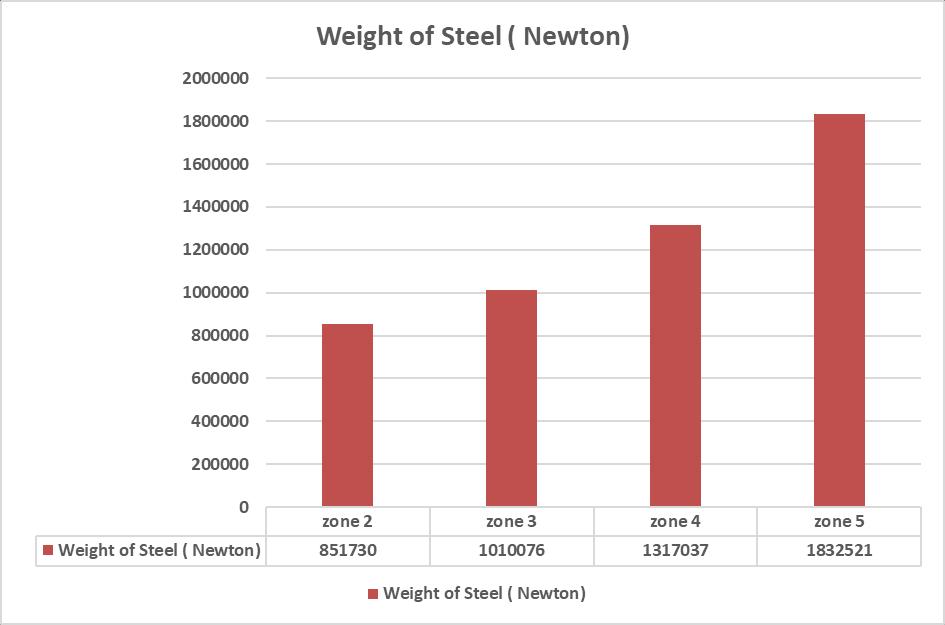
Chart -5: Weight of Steelin RCC frame
6.2 Observations in Foundation
As for the RCC frame the loading variation is also supposed to be analyzed for the foundation. As it can be seen in the reaction load curve for the x direction the max load intensity is gradually increasing and the minimum load intensity is gradually decreasing as similar to the RCC frame. At no certain zone the graph shows any uncertain change and the reaction is as per the increasing seismic loads. As observed for RCC frame the load at thevertical members is higher in the member positioned at the edge and outer faces of the whole frame. Similar kind of loading is seen in the foundation (mat footing type foundation) which is shown in the bearing capacity images in foundation design chapter. The data shown in the ultimate load intensity image represent the load distribution in the foundation exactly as per the observations in RCC frame for which certain changes seems mandatory in the foundation to avoid punching shear failure. As to make frame bearable to seismic loads the cross-sectional area of the members is increased and so for the foundation (particularly for the mat foundation) the offset of the mat from footing along with its thickness is to be increased. The reaction load along Y direction graph seems increasing at a normal rate for loads up to zone 4 but the change in it for zone 5 is higher than normal rate due to change in self weight that is increased by increasing the member dimension to sustain loads.
Chart -6: Load along X direction in Foundation
6.3 Observations in STEEL Frame
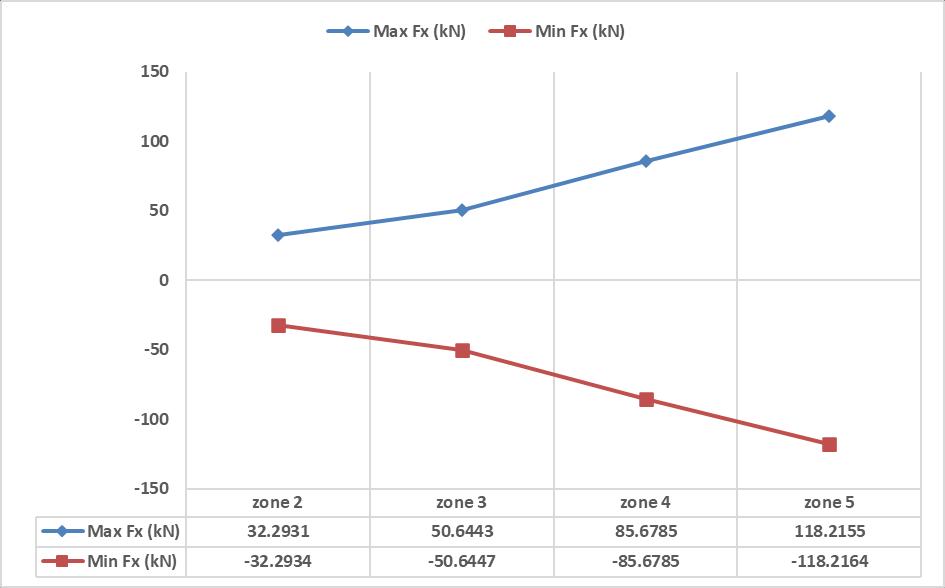
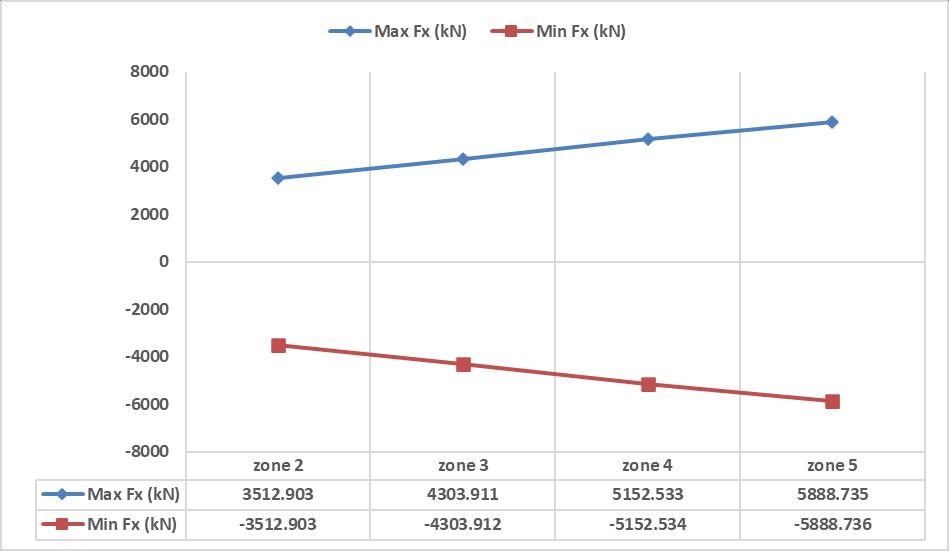
The graph for load and moment at node for steel structure is almost similar to the graph for RCC structure.The curve goes on increasing for maximum from zone 2 to 4 and decreasing in minimum for zone 2 to zone 4 along the three directions. The curve for load in steel frame shows no such extreme change and make it easy to understand the behavior of load in each zone.Just like the RCC frame the load at the vertical members located at the edge or corner of the frame and that too at the bottom experiences more load and their failure chances is high.And to avoid chances of failure of member the selected section is replaced with the suitable section that can easily bear the load with failure. The load at the connection of members seems maximum along Y direction.It is observed that the loads mainly affecting the structure and causing the failure are actually vertical loads as the loads along other two directions are very less on comparing it to the load along Y direction. But it is also observed that the loads along vertical direction are lesser than the minimum (negative) seismic loads along both the direction as here the minimum or negative loads means loads or force opposite to the direction it is applied. This signifies the design of connection as per both vertical and seismic loads together. On moving to the curve for moment at nodes it is seen that the both the maximum and minimum (negative and positive) moments are experienced by the structure along Z direction which is followed by the moment along X direction.
Chart -7: Loadalong X direction at node in STEELframe Through the graph obtained it is observed that the loads are maximum along X direction and minimum along Z direction in each zone. So the members designed will be as per the seismic loading. The mainly affected members are at the outer side or the edges and corners of the frame and with increase in the seismic loads all these members are redesigned resulting change in steel sections. It is also observed that the moment in members are maximum along Z direction and minimum along the x direction in each zone. There is no such sudden raise in the graph curve and the proportion of change in loading with changing zone can be easily determined. Rest other observations are quite similar to the RCC frame.
Volume: 07 Issue: 12 | Dec 2020 www.irjet.net p-ISSN: 2395-0072
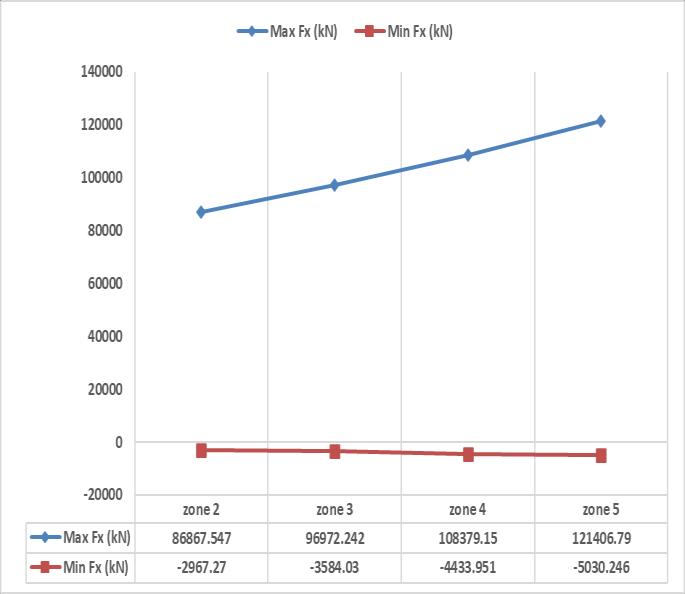
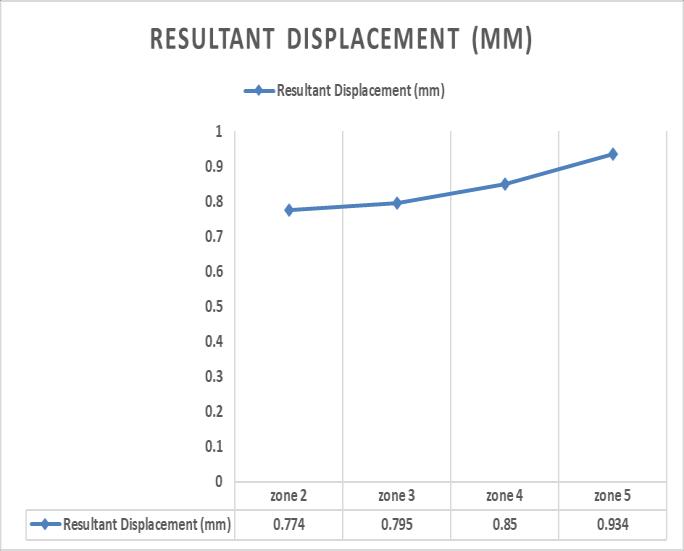
Chart -8: Loadalong X direction at beamin STEELframe It is observed that the resultant displacement in the steel frame is way too lower than the displacement in the RCC frame. Also the displacement observed in each zone is slightly changing and the factor of change can be easily denoted. The result displacement also increases with increase in seismic loads and it is similarly shown in the graph as well. The objective of this comparison is to find the rate of change and to verify it by comparing changes for both the RCC and Steel frames.
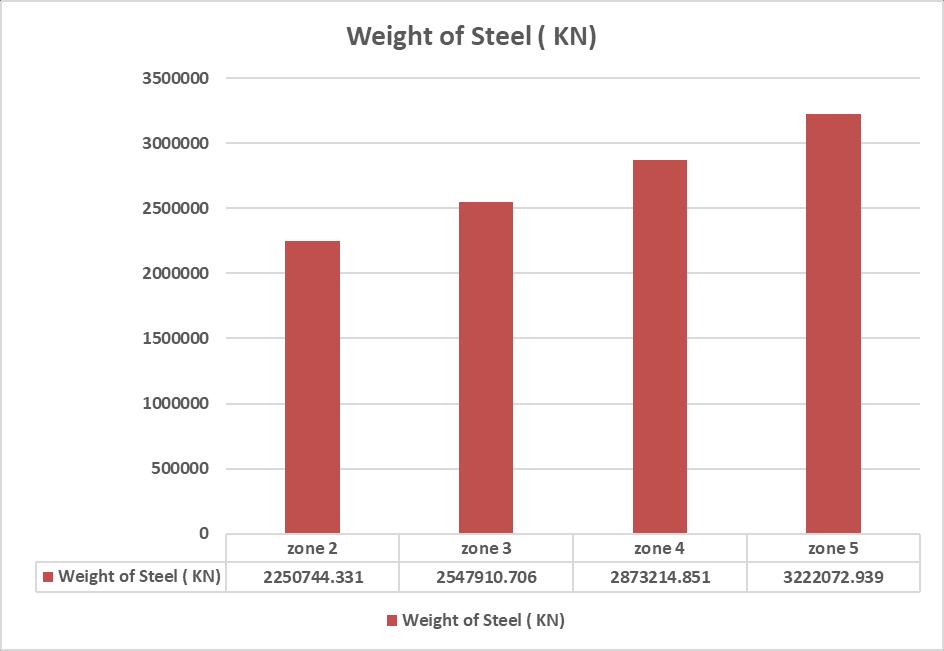
Chart -9: Resultant displacement at node in STEELframe The quantity of material is compared to check the rate of increase in the weight of steel in which the steel quantity required is denoted in the graph. And the percentage of change of the quantity of steel with respect to zone 2 is also shown in the graphnext to the quantity graph. Through the graph of percentage increase of steel quantity, it is observed that the quantity of material increaseswith increase in the seismic loads. The rate of change is quite normal in each zone cause the sections are defined by the software itself. The data of change in rate is more suitable economically for the steel frame. Chart -10: Weight of SteelinSTEELframe
7. CONCLUSIONS
The center of Torsion of the structure plays an important role for designing the frame of the structure especially for the vertical members. The distance of columns from the center of torsion is proportional to the torsional moment that creates shear in the column. So if the columns are placed at varied distances their behavior to the load will also be different. This can result in discontinuity of the periodic moment causing damage to the structure. It is important to maintain the symmetry in arrangement of structural and nonstructural elements in a building.
The slab in each floor is to be designed similar and there should be no excessively large separation between the columns to maintain the stiffness of whole frame. The whole frame is supposed to be homogeneous and symmetrical to maintain stiffness-flexibility. The periodic moment of the structure could be maintained cyclic and controlled during the application of the seismic loads by using shear reinforced walls or thick high resistance masonry walls. The seismic coefficient increases with increase in the building height. So it becomes more important to place the heavy portion or heavy equipment and movable machineries at the lower levels in a building for better seismic resistance.
The light weight structure up to certain limit shows better resistance to the seismic loads as compared to the heavy structure. The length of both vertical and horizontal load carrying members of the structure also plays an important role. The stiffness of shorter length members increases the case of shear failure on application of the seismic forces, so it should be avoided to provide such short length members.
The area of reinforcement of the beam at the lower level increases with increasing seismic forces from zone II to zone V. For the design perspective the analyzed proportion can be used for safe design of beam in RCC frame structure-
Volume: 07 Issue: 12 | Dec 2020 www.irjet.net p-ISSN: 2395-0072
Table -2: Analyzed Proportion of Beamin RCC Frame

The volume of concrete and area of steel reinforcement is majorly observed in the column at the edges and corners with increase in the seismic loads. So by the analysis, following proportions are obtained that be used for safe design in RCC frame structure -
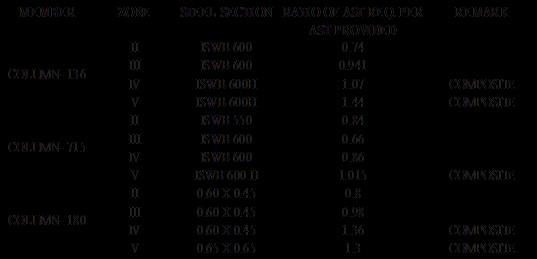
Table -3: Analyzed Proportion of Column in RCC Frame
The ratio of load and moment at node and beam of each zone with respect to zone 2 explains the variation of forces and the proportion of the severe load case for which the members and joints are to be designed in RCC frame structure-
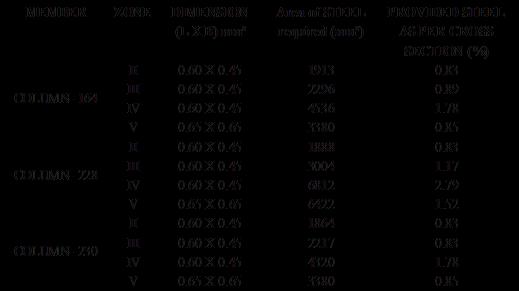
Table -4: Ratio of Load and Momentin RCC Frame


The ratio of maximum displacement of each zone with respect to zone II shows the increase in displacement with increasing seismic forces. The proportion can be used for designing a RCC frame structure-
Table -5: Ratio of Maximum Displacementin RCC Frame The ratio of quantity of concrete and steel of each zones with respect to Zone II also shows that there is an increase in the quantity of material with increasing seismic loads. The obtained proportions can be used for estimating the cost of construction at different zones of a RCC frame structure-
Table -6: Ratio of Quantity of Materialin RCC Frame
The ratio of reaction load at different zones with zone II explains that the reaction load at foundation also increases with increase in seismic forces in given proportion in RCC MAT Foundation –
Table -7: Ratio of Reaction Loadin Foundation

The base pressure in the foundation increases with increase in seismic forces. The given proportion used for the analysis or design in RCC MAT Foundation –
Table -8: Ratio of Base Pressurein Foundation

The beam in zone II requires section with lesser strength than the section required in zone III and similarly seen in other two zones as well. The change in sectional properties can be understood by the table below formed by the analysis data and can be used for designing as a factor or reference for other STEEL Structure –
Table -9: Analyzed Proportion of Beam in STEELFrame
The column at the edges and corner of the frame experiences higher loads as compared to the columns located at the center of the frame in steel structure as well. The data collected shows the proportion of area required in each zone for STEEL Structures –


