Critical Care 2011, Volume 15 Suppl 1 http://ccforum.com/supplements/15/S1
M E E T I N G A B S T R AC T S
31st International Symposium on Intensive Care and Emergency Medicine Brussels, Belgium, 22-25 March 2011 Published: 1 March 2011
P1 Effects of thyroid hormones on major cardiovascular risk in acute coronary syndromes A Bayrak1, A Bayır2, K Uçar Karabulut3 1 Selçuk University, Meram Faculty of Medicine, Konya, Turkey; 2Selçuk University, Selçuklu Faculty of Medicine, Emergency Department, Konya, Turkey; 3Emergency Sercice of Şırnak State Hospital, Şırnak, Turkey Critical Care 2011, 15(Suppl 1):P1 (doi: 10.1186/cc9421) Introduction In this study we aimed to investigate the relationship between thyroid hormone abnormalities and major cardiovascular events and sudden cardiac death at 3 and 6 months after discharge in patients who were admitted to the Emergency Department with acute coronary syndrome. Methods The study group included 110 patients without known thyroid dysfunction who were referred to the Emergency Department with acute coronary syndrome. FT3, FT4 and TSH levels were measured in all patients on admission. Patients were divided into STEMI, NSTEMI and UAP groups. Patient records were checked at 3 and 6 months of discharge in terms of sudden cardiac death and major cardiovascular events. The relationship between thyroid hormone levels and acute cardiac death and major cardiovascular disorders at 3 and 6 months of discharge was evaluated. Results The mean TSH, FT3 and FT4 levels of the study group versus control group were as follows: TSH levels of study group 1.87 ± 1.73 μIU/ ml, FT3 3.2 ± 1.34 pg/ml, FT4 1.45 ± 0.64 ng/dl. Abnormalities in the thyroid function tests were noted in 26 patients (23.6%). Of these seven patients (6.36%) had subclinical hypothyroidism, two patients (1.8%) had euthyroid sick syndrome and 10 patients (9%) had high serum FT4 levels despite normal FT3 and TSH values. Conclusions We noted subclinical hypothyroidism, less frequently euthyroid sick syndrome and hyperthyroidism. No relationship was noted between thyroid hormone levels and sudden cardiac death and major cardiovascular disorders at 3 and 6 months follow-up. However, studies including larger patient groups are needed to clarify if there is a relationship between thyroid hormone levels on admission and sudden death and major cardiovascular events in patients with acute coronary syndrome. References 1. 2.
Paulou HN, et al.: Angiology 2002, 53:699-707. Pingitore A, et al.: Am J Med 2005, 118:132-136.
P2 Effect of reperfusion therapy on QTd and QTcd in patients with acute STEMI D Ragab, H Elghawaby, M Eldesouky, T Elsayed Cairo University, Cairo, Egypt Critical Care 2011, 15(Suppl 1):P2 (doi: 10.1186/cc9422) Introduction Acute ischemia alters action potentials and affects myocardial repolarization. Dispersion of repolarization is arrhythmogenic.
© 2010 BioMed Central Ltd
© 2011 BioMed Central Ltd
QT dispersion has been suggested to give information about the heterogeneity of myocardial repolarization. Methods Our study included 60 patients presented with acute STEMI, the study populations were divided into two groups: Group I: 30 patients who underwent primary PCI. Group II: 15 patients who received streptokinase. Group III: 15 patients who did not receive reperfusion therapy. QTd and QTcd were measured and compared in the three groups on admission, after 24 hours and after 5 days. Results QTd and QTcd were significantly higher in patients with anterior compared with inferior MI (79.16 ± 25.67 ms vs. 62 ± 18.17 ms, P = 0.004 regarding QTd and 91.95 ± 28.76 ms vs. 68.33 ± 23.52 ms, P <0.001 regarding QTcd). After 24 hours, QTd and QTcd were significantly lower in group I than groups II and III (34.33 ± 13.56 ms vs. 48 ± 18.2 ms vs. 66 ± 24.43 ms respectively, P <0.05 as regards QTd and 39.33 ± 11.72 ms vs. 56 ± 23.84 ms vs. 74.60 ± 26.7 ms respectively, P <0.05 as regards QTcd). On the 5th day reduction in QTd and QTcd was statistically significantly lower in group I than groups II and III (23 ± 9.52 ms vs. 45.33 ± 15.97 ms vs. 58.66 ± 23.25 ms respectively, P <0.05 for QTd and 26 ± 11.63 ms vs. 52.66 ± 21.2 ms vs. 60.66 ± 23.25 ms respectively, P <0.05 for QTcd). QT and QTcd on admission were higher in patients who developed ventricular arrhythmias than patients who did not (90 ± 11.55 ms vs. 70 ± 24.54 ms; P = 0.05 regarding QTd and 110 ± 8.61 ms vs. 80.53 ± 28.78 ms with P = 0.028 regarding QTcd). Patients with early peaking of enzymes had more reduction in QTd and QTcd early after reperfusion (43.2 ± 11.44 vs. 60.5 ± 13.16, P <0.001 regarding QTd and 49.60 ± 15.93 vs. 68.5 ± 17.55, P <0.001 regarding QTcd). Conclusions QTd is higher in patients with acute MI (AMI) who developed ventricular arrhythmias. So QTd and QTcd on admission may be a helpful parameter that can detect patients with AMI who are at risk for development of ventricular arrhythmias. Reperfusion therapy with primary PCI or thrombolytic agents reduces QTd and QTcd in patients with AMI, however; QTd and QTcd are shorter with primary PCI compared with thrombolytic therapy. P3 Biochemical studies of some diagnostic enzymes in myocardial infarction M Samir, H Khaled Nagi, D Ragab, M Refaie Cairo University, Cairo, Egypt Critical Care 2011, 15(Suppl 1):P3 (doi: 10.1186/cc9423) Introduction Myocardial infarction (MI) is a key component of the burden of cardiovascular disease (CVD). The main causal and treatable risk factors for MI include hypertension, hypercholesterolemia or dyslipidemia, diabetes mellitus, and smoking. Acute MI results in cellular necrosis with release of constituent proteins into the circulation. Measurement of specific enzymes has become an important clinical tool for the diagnosis and management of MI. The aim of this study was to demonstrate the role of arginase and adenosine deaminase (ADA) in patients suffering from MI, and in a group of patients with chronic renal failure (CRF) with cardiovascular diseases (CVD). Methods In this prospective study including 90 consecutive subjects were included the MI group (GI) consisting of 30 patients with mean age = 51.7 admitted to critical care medicine (CCM) in Cairo University
Critical Care 2011, Volume 15 Suppl 1 http://ccforum.com/supplements/15/S1
Hospital, Egypt. (GII) included 30 patients of the CRF with CVD group with mean age = 49.1 undergoing periodic hemodialysis three times per week, compared with 30 normal volunteers included as the control group. Results The mean value of serum arginase enzyme activity in the control group was 27.9 ± 4.59 U/l. In (GI) the mean value was 70.42 ± 11.9 U/l. On the other hand, the activity of serum arginase enzyme in patients with CRF with CVD has mean value 32.43 ± 6.5 U/l, P <0.05 compared with the control group. ADA in the control group was 20.1 ± 2.39 U/l. But in (GI) the mean value was 44.99 ± 9.4 U/l, indicating a highly significantly increase was observed as compared with the control group (P <0.001). The activity of ADA in CRF (GII) was also high (59.83 ± 9.8 U/l; P <0.001). Conclusions ADA may be considered good diagnostic enzymes in patients suffering from MI, and ADA for patients with CRF with CVD. P4 Pharmacological CCR1 blockade limits infarct size and preserves cardiac function in a chronic model of myocardial ischemia/reperfusion A Van de Sandt, S Zander, S Becher, R Ercan, C Quast, J Ohlig, T Lauer, T Rassaf, M Kelm, MW Merx Department of Cardiology, Pulmonary Diseases and Vascular Medicine, University Hospital, Düsseldorf, Germany Critical Care 2011, 15(Suppl 1):P4 (doi: 10.1186/cc9424) Introduction This study sought to determine the chronic effects of pharmacological blockade of the chemokine receptor CCR1 via application of the potent, selective antagonist BX471 in a murine model of myocardial ischemia/reperfusion (I/R). CCR1 is a prominent receptor in mediating inflammatory leukocyte recruitment. The intense inflammatory response is considered to be a key component of cardiac remodelling. Thus, limiting the post-reperfusion inflammatory pattern seems to be a promising therapeutic approach in limiting reperfusion injury. Previously, we demonstrated that CCR1–/– mice exhibit attenuated infarct expansion and preserved LV function in a chronic model of myocardial no-reflow infarction due to an abrogated inflammatory response. Methods C57/B6 mice underwent a 60-minute coronary occlusion in a closed-chest model of myocardial I/R. Mice were treated with the specific CCR1 antagonist, BX471 (50 mg/ kg BW, s.c.), or placebo, for 96 hours at 8-hour intervals starting 15 minutes prior to reperfusion. At 21 days of reperfusion, cardiac function was assessed using a pressure– volume catheter (Millar) inserted in the left ventricle. Infarct size was analysed and cardiac content for collagen was elucidated. Results Infarct size was significantly smaller in the BX471-treated group (placebo: 20.7 ± 2.8% vs. BX471: 11.6 ± 4.2%, P <0.05; area at risk did no differ between the groups). At 21 days of reperfusion BX471treated mice exhibited a tendency towards improved cardiac function. Significantly improved diastolic function was documented in BX471treated mice (dP/dtmin placebo: –7,635 ± 1,090 vs. BX471: –9,845 ± 657, P <0.01). In histochemical analysis, collagen content was elevated in the hearts of BX471-treated mice. Conclusions Pharmacological CCR1 antagonism leads to improved diastolic function and attenuated infarct size in a chronic model of ischemia/reperfusion, suggesting that CCR1 antagonism might provide a promising therapeutic approach in myocardial infarction. The increased cardiac collagen documented in the treated group of our study might point towards a beneficial effect in the restructuring of the extracellular collagen matrix. Further studies of the underlying mechanisms and a detailed analysis of structural remodelling after pharmacological CCR1 blockade are warranted. P5 Metabolic syndrome and coronary artery bypass graft surgery M Brouard, JJ Jimenez, JL Iribarren, N Perez, L Lorente, P Machado, JM Raya, R Perez, JM Borreguero, R Martinez, ML Mora Hospital Universitario de Canarias, La Laguna, Spain Critical Care 2011, 15(Suppl 1):P5 (doi: 10.1186/cc9425) Introduction Metabolic syndrome (MS) is a constellation of disorders that increases the risk for coronary heart disease. This study was conducted to examine the incidence of metabolic syndrome in coronary artery bypass
S2
graft (CABG) patients and to determine if metabolic syndrome affects clinical outcomes in the perioperative setting. Methods A cohort study of elective CABG surgery patients. Metabolic syndrome was defined using recent established criteria [1]. Demographic variables, comorbid conditions, surgical procedures and postoperative variables were collected. SPSS 15 was used. Results We studied 508 patients. MS was defined in 333 (66%) patients, 241 (72%) males and 92 (28%) females, mean age 66 ± 9 years. MS had greater glucose levels at all postoperative time points (F: 41.6, P <0.001), higher leptins levels (F: 4.7, P <0.044), higher thrombomodulin at 0 hours and 4 hours after surgery (F: 6, P = 0.016), and lower 24-hourpostoperative blood loss after adjusting by tranexamic acid (F: 4.6, P = 0.032). MS had higher incidence of renal dysfunction (RIFLE: I) 13 (4%) versus 1 (0.6%) (P = 0.027). Conclusions MS was associated with a procoagulant state that may decrease postoperative blood loss. Nevertheless MS was associated with worse adverse events as renal dysfunction. Reference 1.
Alberti RH, et al.: Circulation 2009, 120:1640-1645.
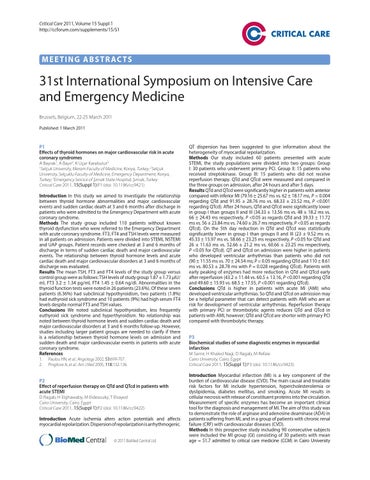
P6 Perioperative risk factors for serious gastrointestinal complications treated by laparotomy after cardiac surgery using cardiopulmonary bypass P Soos1, B Schmack2, A Weymann2, G Veres1, B Merkely1, M Karck2, G Szabó2 1 Semmelweis University, Budapest, Hungary; 2University of Heidelberg, Germany Critical Care 2011, 15(Suppl 1):P6 (doi: 10.1186/cc9426) Introduction Gastrointestinal (GI) complications are rare but often fatal consequences of cardiac surgery, especially after cardiopulmonary bypass (CPB) operations. The therapy can be conservative or – in critical cases – surgical; however, an early and safe diagnosis may prevent the development of life-threatening GI complications. The aim of our study was to characterize the risk factors and perioperative predictors for GI complications treated by laparotomy after CPB operations. Methods In a retrospective analysis of 12 years of CPB operations, 13,553 consecutive patients were involved in the study. Laparotomy was performed after CPB in 277 (2.01%) cases, the mean follow-up time was 63.9 months. Results Logistic regression analysis of the preoperative data demonstrated RR = 1.585 (OR: 1.340 to 1.876, P <0.001) for heart failure according to the NYHA classification. The postoperative data analysis showed an RR = 12.257 (OR: 9.604 to 15.643, P <0.001) for the need of an IABP implantation and an RR = 13.455 (OR: 10.516 to 17.215, P <0.001) of low output syndrome in the GI complications group. In contrast, GI disease in the patient history seemed not to be a significant risk factor. Preoperative renal failure had an RR = 2.181 (OR: 1.686 to 2.821, P <0.001) until postoperative renal failure had an RR = 29.145 (OR: 21.322 to 39.839, P <0.001). Conclusions A failing heart may play a significant role in critical GI complications after CPB, whereas history of GI disease does not seem to determine its incidence. P7 Endotoxemia related to cardiopulmonary bypass is associated with increased risk of infection after cardiac surgery DJ Klein, F Briet, R Nisenbaum, A Romaschin, C Mazer St Michael’s Hospital, Toronto, Canada Critical Care 2011, 15(Suppl 1):P7 (doi: 10.1186/cc9427) Introduction The purpose of this study was to examine the prevalence of endotoxemia-supported aortocoronary bypass grafting surgery (ACB), using the endotoxin activity assay (EAA), and to explore the association between endotoxemia and postoperative infection. Methods The study was a single-center prospective observational study measuring EAA during the perioperative period for elective ACB. Blood samples were drawn at induction of anesthesia (T1), immediately prior to release of the aortic cross-clamp (T2), and on
Critical Care 2011, Volume 15 Suppl 1 http://ccforum.com/supplements/15/S1
Figure 1 (abstract P7). Endotoxin levels in subjects with and without postoperative infections.
the first postoperative morning (T3). The primary outcome was the prevalence of endotoxemia. The secondary outcome was rate of postoperative infection. An EAA of <0.40 was interpreted as low, 0.41 to 0.59 as intermediate, and >0.60 as high. Results Fifty-seven patients were enrolled and 54 patients were analyzable. The mean EAA at T1 was 0.38 ± 0.14, at T2 0.39 ± 0.18, and at T3 0.33 ± 0.18. At T2 only 13.5% of patients had an EAA in the high range. There was a positive correlation between EAA and the duration of cross-clamp (P = 0.02). Eight patients developed postoperative infections (14.6%). EAA at T2 was strongly correlated with the risk of postoperative infection (P = 0.02) as was the maximum EAA over the first 24 hours (P = 0.02). See Figure 1. Conclusions High levels of endotoxin occurred less frequently during ACB than previously documented. However, endotoxemia is associated with a significantly increased risk of the development of postoperative infection – a complication associated with an over doubling of risk of death. Measuring endotoxin levels may provide a mechanism to identify and target a high-risk population. P8 Manual hyperinflation attenuates reduction of functional residual capacity in cardiac surgical patients: a randomized controlled trial F Paulus, DP Veelo, SB De Nijs, P Bresser, BA De Mol, LF Beenen, JM Binnekade, MJ Schultz Academic Medical Center, Amsterdam, the Netherlands Critical Care 2011, 15(Suppl 1):P8 (doi: 10.1186/cc9428) Introduction Cardiac surgical patients show deterioration of functional residual capacity (FRC) after surgery. Manual hyperinflation (MH) aims at preventing airway plugging, and as such could prevent the reduction of FRC after surgery. The purpose of this study was to determine the effect of MH on FRC in cardiac surgical patients. Methods This was a randomized controlled trial of patients after elective coronary artery bypass graft and/or valve surgery admitted to the ICU of a university hospital. Patients were randomly allocated to routine MH strategy (MH within 30 minutes after arrival in the ICU and every 6 hours until tracheal extubation) or on-demand MH (MH only in cases of perceptible (audible) sputum in the larger airways or in case of a drop in SpO2) during mechanical ventilation. The primary endpoint was the change of FRC from the day before cardiac surgery to 1, 3, and 5 days after tracheal extubation. Secondary endpoints were SpO2, on the same time points, and chest radiograph abnormalities at day 3. Results One hundred patients were enrolled. In the routine MH group FRC decreased to 72% of the preoperative measurement, versus 59%
S3
Figure 1 (abstract P8). Pulmonary function measurements. Preoperative functional residual capacity (FRC (l); mean, 95% CI) and FRC at 1, 3, and 5 days after extubation in the routine MH group (closed circles) and in the on-demand MH group (open circles).
in the on-demand MH group (P = 0.002). Differences in FRC were not longer statistically significant at day 5 (Figure 1). There were no differences in SpO2 between the two groups. Chest radiographs showed more abnormalities in the on-demand MH group compared with patients in the routine MH group (P = 0.002). Conclusions MH attenuates the reduction of FRC in the first three postoperative days after cardiac surgery. P9 Incidence of cerebral desaturation events in the ICU following cardiac surgery S Greenberg, A Garcia, L Howard, R Fasanella, J Vender North Shore University Health System, Evanston, IL, USA Critical Care 2011, 15(Suppl 1):P9 (doi: 10.1186/cc9429) Introduction We hypothesize that there is a high incidence of cerebral desaturation events (CDE – an absolute decrease in SctO2 to <55% for ≥15 seconds) during the first 6 hours of ICU admission following cardiac surgery. Clinical trials have validated transcranial cerebral oximetry, a non-invasive tool that uses near-infrared spectroscopy to measure cerebral oxygen saturation, as a way to detect cerebral ischemia [1]. Cerebral oximetry is frequently used in the intraoperative setting, but rarely utilized postoperatively [2]. We attempted to identify if CDEs occur in the ICU. Methods This IRB-approved, prospective, observational study captures the CDE incidence from 40 ASA IV patients in the ICU period following elective cardiac surgery. Exclusion criteria were: age <18, patients presenting for emergency surgery, and patients undergoing off-pump procedures. The FORE-SIGHT (CAS Medical Systems Inc., Branford, CT, USA) absolute cerebral oximeter monitor remained on patients for the first 6 hours in the ICU. All patients were managed according to the usual ICU standard of care. All care providers were blinded to CDEs during the 6-hour study period. During this time, a portable computer was attached to the cerebral oximeter, bedside physiologic monitor and mechanical ventilator, which recorded all data at 1-minute intervals and allowed data to be stored on a computer database. Results Complete data were collected on 40 high-risk patients (mean age of patients = 71 (36 to 86), mean duration of intubation (hours) = 22.8 (6 to 240), mean duration of ICU stay (days) = 3.3 (1 to 20)). A majority of the patients underwent coronary bypass grafting only or valve only procedures. A high incidence, 13/40 (32.5%), of CDEs was observed in our study cohort, with some episodes exceeding 2 hours. A higher incidence of postoperative nausea/vomiting (PONV) was observed in patients with CDEs (3/13 vs. 0/27).
Critical Care 2011, Volume 15 Suppl 1 http://ccforum.com/supplements/15/S1
Conclusions This observational trial is the first to demonstrate a high incidence of CDEs in the immediate postoperative period (32.5%) among cardiac surgical patients. Our ongoing observational study will attempt to demonstrate correlations between physiologic parameters and these postoperative CDEs. References 1. 2.
Fischer G.: Semin Cardiothorac Vasc Anesth 2008, 12:60-69. Hirsch J, et al.: Semin Thorac Cardiovasc Surg Pediatr Card Surg Annu 2010, 13:51-54.
P10 A nonrandomized comparison of off-pump versus on-pump coronary bypass surgery in Egyptian patients H El-Abd1, S Salah2 1 Cairo University Hospitals, Cairo, Egypt; 2Police Authority Hospital, Cairo, Egypt Critical Care 2011, 15(Suppl 1):P10 (doi: 10.1186/cc9430) Introduction Coronary artery bypass grafting (CABG) has traditionally been performed with the use of cardiopulmonary bypass (ONCAB). CABG without cardiopulmonary bypass (OPCAB) might reduce the number of complications. Thus, this study aims to compare between on-pump and off-pump surgery concerning postoperative morbidity and mortality, also to evaluate 6-month graft patency in Egyptian patients. Methods This is a nonrandomized single-centre control trial prospectively conducted on 65 patients who were subjected to coronary artery bypass surgery followed by stay in the Open Heart Intensive Care Center of the Police Authority Hospital, in the period from July 2009 to January 2010. Patients were divided into two groups; group A: 25 patients underwent ONCAP, and group B: 40 patients underwent OPCAB. All of the demographic, operative and postoperative data were prospectively collected and analyzed statistically. Six months later, the patients underwent coronary angiography. Results There was no significant difference between both groups intraoperatively concerning arrhythmias, blood transfusion, and hemodynamic support. Off-pump patients had a significantly higher mean number of constructed grafts than in the ONCAB group (mean, 3.30 ± 0.88 vs. 2.84 ± 0.80, P = 0.02). There were no significant differences between off-pump and on-pump regarding postoperative blood loss, blood transfusion, length of the ICU and the hospital stay, the ventilation time, the use of IABP, renal complications, respiratory complications, and reopening. However, graft occlusion, MI, ventricular tachycardia, cardiogenic shock, and disturbed conscious level significantly occurred in the OPCAB group. Postoperative mortality rate was significantly higher in the OPCAB group than in the ONCAB group (15% vs. 0%, P = 0.046). Follow-up angiograms in 40 patients (61.5%) who underwent 124 grafts revealed no significant difference between off-pump and on-pump groups regarding overall rate of graft patency (83.5% vs. 84.4%, P = 0.84). No mortality was reported in both groups at 6-month follow-up. Conclusions There was a higher incidence in postoperative complications and mortality in off-pump procedure than the onpump. At 6-month follow-up, no significant differences between both techniques were found in graft patency and mortality. Reference 1.
S4
IABP). The role of ECMO in this scenario is far from clear and factors predicting a poor outcome are lacking. However, such indices would be helpful to find a reasonable approach. Methods Analysis of a prospective evaluated dataset in a surgical ICU of a university teaching hospital. Results In 19 patients (mean age 58 years) with postcardiotomy cardiogenic shock despite high-dose medication with inotropes and normal filling pressures, separation from CPB was not possible. These patients were scheduled for ECMO. The mean preoperative EF was 20.8% and in 47.3% of the patients cardiopulmonary resuscitation (CPR) had to be performed already before CPB. Eleven patients (57.8%) received an IABP before ECMO. The most frequent complications in the ICU were: arrhythmia (63.1%), bleeding (78.9%), renal failure with CRRT (47.3%) and respiratory failure (paO2/FiO2 <250 mmHg) (100%). The mean duration on ECMO was 6.8 days, mean stay in the ICU was 13.1 days and mean hospital stay was 44.5 days. Only 6/19 patients survived (31.5%) and were discharged from hospital. These patients except one had no CPR in the preoperative period. Conclusions ECMO in acute heart failure after adult open heart surgery in this series had an enormous high mortality of 68.5%. However, these results are in line with other series with a reported mortality of 67 to 75.2% [1,2]. CPR in the preoperative setting seems to be a grave sign for survival and in these patients ECMO is not recommended since mortality reaches an unacceptable high rate. This statement needs to be confirmed by an adequate powered trial. References 1. 2.
Hsu: Eur J Cardiothorac Surg 2010, 37:328. Rastan: J Thorac cardiovasc Surg 2010, 139:302.
P12 Quality of life after cardiac surgery in an octogenarian population M Nydegger, A Boltres, K Graves, A Zollinger, CK Hofer Triemli City Hospital, Zurich, Switzerland Critical Care 2011, 15(Suppl 1):P12 (doi: 10.1186/cc9432) Introduction An increasing number of cardiac surgery procedures are performed today in patients >80 years [1]. However, only limited data are available regarding the postoperative outcome in this patient group. The aim of this study was to assess quality of life in patients >80 years after elective cardiac surgery (CS80) compared with younger patients (60 to 70 years; CS60). Methods Consecutive CS80/CS60 patients during a 1-year period were contacted 12 months after cardiac surgery. A structured interview was performed and quality of life was assessed (SF-36 health survey). Norm-based scoring (transformed to mean = 50 ± 10) was analysed. Sociodemographic and procedure-related data were obtained from the hospital database. Student’s t-test and the chi-square test were used to compare both groups. Results Fifty-three and 52 datasets for CS80 and CS60, respectively, were available for statistical analysis: mean age was 82.2 ± 2.7 years (CS80) and 64.7 ± 2.7 years (CS60, P <0.001). There was no significant difference of preoperative cardiac function or risk score (ejection
Shroyer AL, et al.: On-pump versus off-pump coronary-artery bypass surgery. N Engl J Med 2009, 361:1827-1837.
P11 Extracorporal membrane oxygenation for cardiopulmonary support after open heart surgery UJ Jaschinski, G Kierschke, H Forst, M Beyer Klinikum Augsburg, Germany Critical Care 2011, 15(Suppl 1):P11 (doi: 10.1186/cc9431) Introduction Arterial–venous extracorporal membrane oxygenation (ECMO) is a rescue tool in acute heart failure after cardiopulmonary bypass (CPB) when separation from CPB cannot be achieved by conventional means (volume, inotropes, intra-aortic counterpulsation
Figure 1 (abstract P12). Norm-based SF-36 scoring profile: (a) single components and (b) component summaries.
Critical Care 2011, Volume 15 Suppl 1 http://ccforum.com/supplements/15/S1
fraction: CS80: 54 ± 14%, CS60: 54 ± 13%; P = 0.78. Euroscore: CS80: 9.3 ± 0.24, CS60: 6.9 ± 3.7, P = 0.09). ICU length of stay was 5.3 ± 9.1 days (CS80) and 2.6 ± 2.7 days (CS60, P <0.04); hospital length of stay was 15.6 ± 10.1 days (CS80) and 15.1 ± 8.5 days (CS60, P = 0.79). The 30-day mortality rate was 11.5% (CS80) and 5.6% (CS60, P = 0.27), and 1-year mortality was 16.3% (CS80) and 7.6% (CS60, P = 0.13). SF-36 physical and mental health components ranged from 44.8 ± 10.8 to 54.2 ± 7.6 (CS80) and from 48.7 ± 13.5 to 52.7 ± 7.9 (CS60; Figure 1); physical function (PF) was significantly lower for CS80 (P = 0.002). Physical component summary (PCS) was 46.9 ± 9.9 (CS80) and 51.3 ± 8.8 CS60; P = 0.03); mental component summary (MCS) was 54.7 ± 7.9 (CS80) and 50.8 ± 12.0 (CS60; P = 0.75; Figure 1). Conclusions Quality of physical health with only minor limitations was observed in patients after cardiac surgery aged >80 years as compared with younger patients (60 to 70 years). There was no difference of mental health quality between both patient groups. These results could only be achieved with increased ICU length of stay for patients >80 years. Reference 1.
J Heart Valve Dis 2010, 19:615-622.
P13 Peripartum cardiomyopathy: a KKH case series MK Shah, S Leo, CE Ocampo, CF Yim, S Tagore Kandang Kerbau Women’s and Children’s Hospital, Singapore Critical Care 2011, 15(Suppl 1):P13 (doi: 10.1186/cc9433) Introduction The incidence, presentation and risk factors of peripartum cardiomyopathy in Singapore are not known. Methods Seven patients’ case notes were reviewed following IRB approval. Results Incidence was 1:2,285 deliveries. Symptoms appeared 1 hour post-LSCS delivery intraoperatively to postpartum day 5, with diagnosis within a few days. Dyspnoea, desaturation, frusemideinduced diuresis, and CXR evidence of pulmonary congestion/ oedema occurred in all. Troponin I (measured in 6/7 cases) and CKMB (measured in 5/7) were raised, and then (troponin I repeated in 4/6 and CKMB repeated in 3/5) showed a declining trend. BNP and CRP (measured in Case 6 only) were raised. 2D-ECHO showed worst LVEF 25 (19 to 35)%, median (range), at time of diagnosis, <25% (Cases 1 and 3), valvular abnormalities (4/7), LV diastolic dysfunction (2/7), two-chamber enlargement (3/7), one-chamber enlargement (1/7), and follow-up 2D-ECHO (done in 5/7) showed last LVEF 55 (35 to 65)%, median (range) (Cases 1 and 6, <45%), and valvular abnormalities (3/7). All were Asian (except for one German, typical of our hospital’s ethnic mix), mean age was 29.7 years (with only one older: 38 years), mean parity was 1.67 (6/7), all had singleton pregnancy, mean BMI was 28.2 (6/7, one with BMI: 36.1), and preterm labour (3/7, two of which had failed tocolysis with oral adalat and i.v. salbutamol), prostin induction of labour (3/7), caesarean delivery (3/7), and postpartum haemorrhage (3/7) were also noted. They were all managed aggressively without delay. Treatment included oxygen therapy (all), intubation, sedation and ventilation (6/7), BiPAP (3/7), pleural drainage (2/7), frusemide, digoxin and ACE inhibitors (for example, perindopril, enalapril) (all), antibiotic(s) for pneumonia (for example, tazocin, coamoxiclav, ceftriaxone, clarithromycin, doxycycline, gentamicin, metronidazole) (6/7), anticoagulant/antiplatelet prophylaxis (for example, fraxiparine, clexane, aspirin, warfarin) (6/7), beta-blockers (for example, carvedilol, bisoprolol, labetalol) (5/7), other inotropes, namely dobutamine (2/7, in one patient with noradrenaline) and milrinone (1/7), and vasodilators, namely GTN and hydralazine (1/7). Total hospitalisation from time of diagnosis was 5 to 9 days. Following 4 (1 to 8) months, median (range), follow-up, 4/7 made full recovery, 1/7 partial recovery, 1/7 temporary recovery, and 1/7 defaulted. Case 2 resulted in a neonatal death. Conclusions Possible risk factors are multiparity, preterm labour requiring tocolysis, prostin induction of labour, and postpartum haemorrhage.
S5
P14 Levels of serum B12, folic acid and homocysteine in thromboembolic diseases on admission to the Emergency Department A Bayır1, K Uçar Karabulut2, A Ak1 1 Selçuk University, Selçuklu Faculty of Medicine, Emergency Department, Konya, Turkey; 2Şırnak State Hospital, Şırnak, Turkey Critical Care 2011, 15(Suppl 1):P14 (doi: 10.1186/cc9434) Introduction The aim of this study was to compare with control and each other the levels of serum B12, folic acid and homocysteine at admission in the cases with thromboembolic diseases. Methods This study included 100 subjects with acute myocardial infarctus (AMI), acute pulmonary embolism, deep vein thrombosis, ischemic cerebrovascular disease (ICD), acute mesentery embolism, and peripheric artery embolism (PAE), and 110 healthy voluntary subjects were included in the control group. Vitamin B12, folic acid and homocysteine levels were examined in the blood samples obtained at admission, The data were loaded onto SPSS 16 for Windows program. P ≤0.05 was considered significant. Results Mean serum homocysteine and plasma vitamin B12 levels were significantly higher in the patient group than the control group (P = 0.002 and 0.000 respectively). There was no significant difference in the levels of folic acid between the patient and control groups. Mean serum B12 values of the AMI and ICD groups in the patient group were significantly lower than those of the control group (P <0.05). Serum folic acid values of the PAE and AMI groups were considerably lower than the control group (P <0.05). Plasma homocysteine levels were significantly higher in all patient groups according to their diagnosis than the control group (P <0.05). Conclusions Mean serum homocysteine and plasma vitamin B12 levels were significantly higher in the patient group than the control group (P = 0.002 and 0.000 respectively). There was no significant difference in the levels of folic acid between the patient and control groups. Mean serum B12 values of the AMI and ICD groups in the patient group were significantly lower than those of the control group (P <0.05). Serum folic acid values of the PAE and AMI groups were considerably lower than the control group (P <0.05). Plasma homocysteine levels were significantly higher in all patient groups according to their diagnosis than the control group (P <0.05). References 1. 2.
Cattaneo M: Semin Thromb Hemost 2006, 32:716-723. Ho CH, et al.: J Chin Med Assoc 2005, 68:560-565.
P15 Deep venous thrombosis Doppler screening in critically ill patients: is it justified? I Vlachou1, G Petrocheilou1, E Evodia2, M Pappa2, L Livieratos1, P Myrianthefs2, L Gregorakos2, G Baltopoulos2 1 St Paul Hospital, Athens, Greece; 2Agioi Anargyroi Hospital, Athens, Greece Critical Care 2011, 15(Suppl 1):P15 (doi: 10.1186/cc9435) Introduction The purpose of this study was to determine the incidence of asymptomatic deep venous thrombosis (DVT) in long-stay critically ill patients. Methods Over an 8-month period, 53 patients were admitted and anticipated to stay in the ICU for >48 hours. DVT prophylaxis was provided using low molecular weight heparin (LMWH) or a sequential leg compression device as medically indicated. Patients had a baseline Duplex Ultrasound Screening (DUS) examination on admission and screening on a weekly basis regardless of clinical or laboratory evidence for DVT. Demographics and ultrasound data were also collected. Results We studied 53 patients (42 males, mean age (SEM) 57.6 (2.8) years, illness severity scores APACHE II 21.3 (0.9); SAPS II 53.3 (2.3); SOFA 10.2 (0.2); and ICU stay 35.9 (4.8) days). Eleven (20.8%) of them developed DVT on day 7.4 (1.8), on DUS. Six patients had lower limb DVT, five upper limb DVT. Another one had DVT on admission. In group A (Table 1), six patients (37.5%) developed DVT on day 7.0 (2.4) without receiving LMWH due to underlying disease (hemorrhagic stroke, brain injury), but only pneumatic compression. In group B (Table 1), five patients (13.5%) developed DVT on day 7.7 (2.9) despite timely and appropriate LMWH administration since ICU admission.
Critical Care 2011, Volume 15 Suppl 1 http://ccforum.com/supplements/15/S1
S6
Table 1 (abstract P15) Group A
Group B
P value
n (patients)
6/16
5/37
0.042
APACHE II
25.8 (3.3)
21.8 (2.1)
0.49
SAPS II
55.5 (6.3)
66.4 (9.8)
0.55
SOFA
10.5 (1.2)
11 (2.19)
1.0
Day DVT
7.0 (2.4)
7.7 (2.4)
0.36
LOS ICU
60.2 (37)
71.2 (39)
0.53
None of the patients in both groups developed pulmonary embolism. The difference regarding the incidence between the two groups was statistically significant (P = 0.042, RR: 2.847 (CI: 1.050 to 7.721), OR: 4.167 (CI: 0.989 to 17.55)). Conclusions According to our results the application of DUS screening in ICU patients seems to be justified for early, accurate diagnosis of silent DVT and appropriate therapy. P16 Pulmonary embolism in the ICU: clinical and prognostic signification – can we predict mortality? A Aller, M Mourelo, P Vidal University Hospital A Coruña, Spain Critical Care 2011, 15(Suppl 1):P16 (doi: 10.1186/cc9436) Introduction This study was to define characteristics of patients with pulmonary embolism (PE) admitted to the ICU, and to determine the usefulness of predictive models of empirical prognostic stratification. Methods Retrospective study of patients who developed PE during the ICU stay or were admitted to the ICU for PE for 5 years (2005 to 2010). We analyzed: age, sex, history, diagnosis, complications and mortality. Univariate analysis using Student t and chi-square tests, and multivariate using logistic regression. Results We found 64 patients. Mean age was 64 years (SD 16.2); 51.6% were women, 18.8% had a neoplasia, 65.5% were admitted for PE from the emergency room. The rest were: medical (18.8%), surgical (7.8%) or traumatic (6.3%). In total, 79.7% dyspnea, 34.4% chest pain, 14.1% cardiorespiratory arrest. The diagnosis was mainly by CT (71.4%), echocardiography (15.9%) and clinical (12.7%). Of patients, 92.1% had higher D-dimer, 33.3% had elevated troponin I; 66.7% had right ventricular dysfunction (RVD), 86.1% had pulmonary arterial hypertension (PAH); 57.8% metabolic acidosis; 42.2% hemodynamic instability; 44.4% catecholamines, 50% volume administration, 30% developed ARDS. Of the patients, 31.3% received systemic thrombolysis, 3.1% endovascular treatment. In 4.7% a vena cava filter was placed. In univariate analysis with regard to mortality we find significant: ARDS (P <0.00), catecholamines (P = 0.00), acidosis (P = 0.01), hemodynamic instability (P = 0.02). In multivariate analysis: predictor of mortality SAPS II scale (P = 0.04, OR 0.06 (CI 0.99 to 1.12)). ROC curves for scales (Geneva, Wells, PESI), finding an area of 0.55, 0.65, 0.47, respectively. In a univariate analysis with regard to PESI (III to V), we found significant: SAPS II (P = 0.01), age (P = 0.005), PAH (P = 0.03), volume (P = 0.01), catecholamines (P = 0.00), hemodynamic instability (P = 0.00). In the multivariate analysis: SAPS II (P = 0.046, OR 0.071 (CI 0.86 to 0.99)). In the univariate analysis with regard to fibrinolysis: SAPS II (P = 0.00), PESI (P = 0.00), hemodynamic instability (P = 0.00). The median stay in ICU was 4 days, ICU mortality was 14.1%. Conclusions Diagnosis of PE is primarily radiological. The majority of patients requiring ICU admission have RVD. Troponin has little sensitivity for the diagnosis of PE. Prognostic stratification scales do not seem to be reliable predictors of mortality; however, high PESI grades correlates with high severity illness. Fibrinolysis was not significantly associated with reduced mortality. Hemodynamic instability, metabolic acidosis and ARDS were independent predictors of mortality. Reference 1.
Guidelines on diagnosis and management of acute pulmonary embolism. Eur Heart J 2008, 29:2276-2315.
P17 Model-based cardiovascular monitoring of acute pulmonary embolism in porcine trials JA Revie1, DJ Stevenson1, JG Chase1, CE Hann1, BC Lambermont2, A Ghuysen2, P Kolh2, GM Shaw3, T Desaive2 1 University of Canterbury, Christchurch, New Zealand; 2University of Liege, Belgium; 3Christchurch Hospital, Christchurch, New Zealand Critical Care 2011, 15(Suppl 1):P17 (doi: 10.1186/cc9437) Introduction Diagnosis and treatment of cardiac and circulatory dysfunction can be error-prone and relies heavily on clinical intuition and experience. Model-based approaches utilising measurements available in the ICU can provide a clearer physiological picture of a patient’s cardiovascular status to assist medical staff with diagnosis and therapy decisions. This research tests a subject-specific cardiovascular system (CVS) modelling technique on measurements from a porcine model of acute pulmonary embolism (APE). Methods Measurements were recorded in five pig trials, where autologous blood clots were inserted every 2 hours into the jugular vein to simulate pulmonary emboli. Of these measurements only a minimal set of clinically available or inferable data were used in the identification process (aortic and pulmonary artery pressure, stroke volume, heart rate, global end diastolic volume, and mitral and tricuspid valve closure times). The CVS model was fitted to 46 sets of data taken at 30-minute intervals (t = 0, 30, 60, …, 270) during the induction of APE to identify physiological model parameters and their change over time in APE. Model parameters and outputs were compared with experimentally derived metrics and measurements not used in the identification method to validate the accuracy of the model and assess its diagnostic capability. Results Modelled mean ventricular volumes and maximum ventricular pressures matched measured values with median absolute errors of 4.3% and 4.4%, which are less than experimental measurement noise (~10%). An increase in pulmonary vascular resistance, the main hemodynamic consequence of APE, was identified in all the pigs and related well to experimental values (R = 0.68). Detrimental changes in reflex responses, such as decreased right ventricular contractility, were noticed in two pigs that died during the trial, diagnosing the loss of autonomous control. Increases in the ratio of the modelled right to left ventricular end diastolic volumes, signifying the leftward shift of the intraventricular septum seen in APE, compared well with the clinically measured index (R = 0.88). Conclusions Subject-specific CVS models can accurately and continuously diagnose and track acute disease-dependent cardiovascular changes resulting from APE using readily available measurements. Human trials are underway to clinically validate these animal trial results. P18 Pulmonary embolism diagnostics from the driver function DJ Stevenson1, J Revie1, JG Chase1, CE Hann1, A Le Compte1, GM Shaw2, B Lambermont3, P Kolh3, T Desaive3 1 University of Canterbury, Christchurch, New Zealand; 2Christchurch Hospital, Christchurch, New Zealand; 3University of Liege, Belgium Critical Care 2011, 15(Suppl 1):P18 (doi: 10.1186/cc9438) Introduction Ventricular driver functions are not readily measured in the ICU, but can clearly indicate the development of pulmonary embolism (PE) otherwise difficult to diagnose. Recent work has developed accurate methods of measuring these driver functions from readily available ICU measurements. This research tests those methods by assessing the ability of these driver functions to diagnose the evolution of PE. Methods PE was induced in five pigs with cardiac measurements taken every 30 minutes. Pig-specific driver functions are estimated at each time point from aortic artery pressure waveforms. Increases over time in two validated model-based metrics indicate PE: pulmonary artery resistance (Rpul); and the Right Ventricle Expansion Index (RVEI). Rpul and RVEI at each time point were paired to specific points on the right driver function that change as PE is induced. The significant points of interest are: (1) left-shoulder (LS) of the right driver function
Critical Care 2011, Volume 15 Suppl 1 http://ccforum.com/supplements/15/S1
(correlated with the dead-space volume); (2) maximum pressure gradient (MPG) of the right driver function (related to compliance); and (3) the total area (TA) of the right driver function (analogous to work done by the ventricle). Correlations are calculated for each pig, and for measurements and driver functions averaged across all five pigs to see a general trend. Results Pig-specific correlations were median (range): (1) RVEI to LS: 0.56 (range: 0.33 to 0.99); (2) RVEI to MPG: 0.59 (range: 0.25 to 0.99); and (3) Rpul to TA: 0.53 (range: 0.04 to 0.85). Correlation levels were not consistent across pigs or metrics with the maximum for each pig across the three metrics of (0.99, 0.85, 0.56, 0.54, 0.59), indicating interpig variability in the experimental response to PE and its impact on the identified driver functions. Averaging the data and driver functions over the five-pig cohort yielded excellent correlations between Rpul, RVEI and the estimated right driver function of: (1) RVEI to LS: R = 0.98, (2) RVEI to MPG: R = 0.98; and (3) Rpul to TA: R = 0.96. These results show the potential diagnostic capability of this approach in this limited animal trial. Conclusions This research suggests that PE can be diagnosed and tracked from knowledge of a model-based driver function developed from readily available ICU measurements. Further animal and human validation is required to confirm these results.
P19 Pulmonary embolism in medical–surgical ICU patients D Heels-Ansdell1, N Zytaruk1, M Meade1, S Mehta2, R Hall3, R Zarychanski4, M Rocha1, W Lim1, F Lamontagne5, L McIntyre6, P Dodek7, S Vallance8, A Davies8, DJ Cooper8, DJ Cook1 1 McMaster University, Hamilton, Canada; 2Mount Sinai Hospital, Toronto, Canada; 3Capital Health – QEII, Halifax, Canada; 4Cancer Care Manatoba, Winnipeg, Canada; 5Sherbrooke Hospital, Quebec, Canada; 6Ottawa Health Research Institute, Ottawa, Canada; 7St Paul’s Hospital, Vancouver, Canada; 8 Alfred Hospital, Melbourne, Australia Critical Care 2011, 15(Suppl 1):P19 (doi: 10.1186/cc9439) Introduction Pulmonary embolism (PE) is a feared complication of critical illness. PE is difficult to diagnose during critical illness due to the nonspecificity of signs and symptoms and low index of suspicion in practice. Our objective was to examine the antecedent characteristics and hospital course of patients who were diagnosed with PE during critical illness in the context of an international trial of thromboprophylaxis (NCT00182143). Methods Research coordinators documented all clinical, laboratory, radiologic and autopsy criteria relevant to PE, which was a secondary outcome for this multicenter trial. Patients with a possible PE were adjudicated in quadruplicate; those considered possible, probable or definite PE were considered in this analysis. PEs were considered clinically suspected if the ICU team conducted tests seeking a diagnosis; otherwise, they were incidental. Results In 3,659 patients, PE was clinically suspected in most patients who were diagnosed with a prevalent PE at ICU admission (12/14, 85.7%) or incident over the course of the ICU stay (57/64, 89.1%). Among 64 patients who developed a PE, only three (4.7%) had prehospital DVT or PE. Within the index hospitalization, before or after the PE diagnosis, additional acute deep venous thromboses occurred at any site in 27 (42.2%) patients with PE. Patients without PE compared with those with PE appear to have a shorter duration of ventilation (median, interquartile range) (5 (2, 11) days vs. 12 days (5.5, 20.5), P <0.001), duration of ICU stay (9 (6, 16) days vs. 20.5 (13, 35), P <0.001), and hospital stay (21 (13, 40) days vs. 35 (21.5, 58.5), P <0.001), and a lower ICU mortality (15.2% vs. 31.8%, P = 0.005) and hospital mortality (22.8% vs. 31.3%, P = 0.13). Conclusions The majority of PEs in these medical–surgical ICU patients were clinically suspected rather than incidental findings. More than one-half of the PEs developed in the absence of leg or other venous thromboses; in some cases, additional venous thromboses post-dated rather than pre-dated the PE. PE was associated with significantly increased morbidity and mortality in this ICU population. Acknowledgements For the PROTECT Investigators, CCCTG and ANZICS-CTG.
S7
P20 Deep venous thrombosis in ICU patients: exploring the submerged part of the iceberg by an expanded intra-ICU ultrasound surveillance program A Cecchi, M Boddi, M Ciapetti, F Barbani, M Bonizzoli, J Parodo, L Perretta, G Zagli, E Spinelli, A Peris Careggi Teaching Hospital, Florence, Italy Critical Care 2011, 15(Suppl 1):P20 (doi: 10.1186/cc9440) Introduction Deep venous thrombosis (DVT) of lower extremities is a well-known complication in critically ill patients, but data for DVT prevalence in upper venous districts are rare. To explore the real prevalence of DVT in ICU patients, intensivists’ routine ultrasound (US) surveillance was extended to include upper vein districts. Methods This before-and-after intervention study included patients admitted to our ICU of a tertiary referral center for trauma and ECMO assistance (Careggi Teaching Hospital, Florence, Italy). The level I vascular US consists of evaluation of the lumen, and complete compressibility of the vein compression: it is performed by the intensivist on duty within the first 24 hours after ICU admission, every 7 days of the ICU stay or in cases of suspected DVT. A level II US examination is performed by a vascular specialist as a second opinion in cases of unclear or positive level I examinations. In 2010, the DVT surveillance protocol was extended to assess from lower extremities to include also the proximal upper extremities (axillary, brachial, cephalic veins) and internal jugular veins. DVTs already present at ICU admission were not included in the study, as well as central venous catheter (CVC)-related thrombosis less than 3 mm of thickness. Results In 2009, 436 patients were admitted to our ICU (male sex 44%, mean age 57 years, mean SAPS II 36.6). Among the 436 patients admitted, a total of 466 level I examinations: eight cases of lower extremities DVT were diagnosed (1.8% of patients admitted) at level I examination. After introduction of expanding level I US surveillance (January to October 2010), 321 patients were admitted to our ICU (male sex 64%, mean age 55 years, mean SAPS II 37.6). A total of 358 level I examinations were performed. Expanding surveillance to upper venous districts, a significantly higher DVT rate (25 cases, 7.8%; P <0.0001) at level I examination was found, all confirmed by the level II examination. In details, lower extremities DVTs were nine (2.8%), upper extremities DVTs 16 (5%), 11 of which were CVC-related at internal jugular vein. Mean time between admission and DVT diagnosis was 9.1 days. Conclusions The lower extremities DVT represent only the tip of the DVT iceberg in critically ill patients. Our results suggest that routine intra-ICU US surveillance should include all venous districts, with particular care of those in which intravascular devices are positioned.
P21 Antiembolic stockings and pneumatic compression devices in a medical–surgical thromboprophylaxis trial N Zytaruk1, D Heels-Ansdell1, S Vallance2, J Marshall3, Y Skrobik4, DJ Cooper2, S Finfer5, I Seppelt6, M Ostermann7, I Qushmaq8, M Alsultan9, Y Arabi9, J Alhashemi10, M Al-Hazmi11, A Alzem11, N Shaikh12, Y Mandourah12, DJ Cook1 1 McMaster University, Hamilton, Canada; 2Alfred Hospital, Melbourne, Australia; 3St Michael’s Hospital, Toronto, Canada; 4Maisonneuve Rosemont, Montreal, Canada; 5The George Institute, Sydney, Australia; 6Nepean Hospital, Sydney, Australia; 7Guy’s & St Thomas’ Hospital, London, UK; 8King Faisal Hospital, Jeddah, Saudi Arabia; 9King Abdulaziz Hospital, Ryiadh, Saudi Arabia; 10King Abdulaziz Hospital, Jeddah, Saudi Arabia; 11King Fahad Hospital, Ryiadh, Saudi Arabia; 12Riyadh Military Hospital, Riyadh, Saudi Arabia Critical Care 2011, 15(Suppl 1):P21 (doi: 10.1186/cc9441) Introduction A recent randomized trial (CLOTS-1) has called into question the utility of antiembolic stockings (AESs); another trial (CLOTS-2) suggested harm with below-knee compared with aboveknee AESs. AESs and pneumatic compression devices (PCD)s could represent important co-interventions in a heparin thromboprophylaxis trial if exposure was lengthy and frequent. Our objective was to document the use of AESs and PCDs applied per protocol and by
Critical Care 2011, Volume 15 Suppl 1 http://ccforum.com/supplements/15/S1
protocol violation in a trial comparing UFH versus LMWH in medical– surgical ICU patients (NCT00182143). Methods A total of 3,659 patients were recruited internationally. The blinded study drug was administered daily in the ICU. Mechanical prophylaxis was only protocolized for use if anticoagulant prophylaxis was contraindicated (major bleeding, high risk for major bleeding, or suspected or proven heparin-associated thrombocytopenia). Research coordinators prospectively documented daily exposure to study drugs and mechanical prophylaxis. Results A total of 3,659 patients were enrolled for a median (IQR) ICU stay of 9 (5, 16) days. AESs were used per protocol in 17.1% of patients for 1 (1, 1) day; 14.1% of the patients had knee-length stockings. AESs used in violation of the protocol occurred in only 2.6% of patients (1.9% of the patients had knee-length stockings), for which the duration of exposure was 1.5 (1, 4) days. PCDs were used per protocol in 11.1% of patients for 1 (1, 3) days, and in 1.8% of patients for 2 (1, 3) days in violation of protocol. Conclusions In keeping with uncertain effectiveness of mechanical thromboprophylaxis, and emerging evidence about harm with knee-length stockings, the co-intervention of mechanical thromboprophylaxis on the results of the PROTECT testing anticoagulant thromboprophylaxis trial will be minimal. AES and PCD use was brief, and largely reserved for days when heparin was contraindicated, as per clinical practice. Acknowledgements For the PROTECT Investigators, CCCTG and ANZICS-CTG. References 1.
2.
CLOTS Trials Collaboration: Effectiveness of thigh-length graduated compression stockings to reduce the risk of deep vein thrombosis after stroke (CLOTS trial 1): a multicenter randomized controlled trial. Lancet 2009, 373:1958-1965. CLOTS Trial Collaboration: Thigh-length versus below-knee stockings for deep venous thrombosis prophylaxis after stroke: a randomized trial. Ann Intern Med 2010, 153:553-562.
P22 Upper extremity thromboses in medical–surgical critically ill patients N Zytaruk1, F Lamontagne2, L McIntyre3, P Dodek4, N Vlahakis5, B Lewis5, D Schiff1, A Moody6, M Ostermann7, S Padayachee7, D Heels-Ansdell1, S Vallance8, A Davies8, JD Cooper8, DJ Cook1 1 McMaster University, Hamilton, Canada; 2Sherbrooke Hospital, Quebec, Canada; 3Ottawa Health Research Institute, Ottawa, Canada; 4St Paul’s Hospital, Vancouver, Canada; 5Mayo Clinic, Rochester, MN, USA; 6Sunnybrook Health Science Center, Toronto, Canada; 7Guy’s & St Thomas’ Hospital, London, UK; 8Alfred Hospital, Melbourne, Australia Critical Care 2011, 15(Suppl 1):P22 (doi: 10.1186/cc9442) Introduction Venous thrombosis of the upper extremity is a recognized complication of critical illness. The objective of this study was to describe the incidence and characteristics of upper-extremity thromboses in patients who were enrolled in an international trial that compared UFH versus LMWH as prophylaxis for VTE (NCT00182143). Methods We recorded the location, extent and prior catheterization of all patients who had upper-extremity venous thromboses confirmed by compression ultrasonography or computed tomography. No patients were routinely screened for upper-extremity thromboses. We excluded prevalent thromboses found within 72 hours of ICU admission. If a patient had both deep and superficial thromboses, we categorized as deep; if a patient had both proximal and distal thromboses, we categorized as proximal. We defined catheter-related thromboses as partial or complete noncompressibility of the same or a contiguous segment in which a catheter had been inserted within the previous 72 hours. Events were adjudicated in duplicate by physicians blinded to study drug and each others’ assessments. Results Among 3,659 patients, 72 (2.0%) developed upper extremity thrombosis involving 129 unique venous segments. Of 72 patients, 35 (48.6%) patients had thromboses in more than one segment. Most thromboses (86, 66.7%) were on the right side. Most of these were deep (56, 77.8%), but a few were superficial (16, 22.2%). Most had proximal thromboses (65, 90.3%), but a few had distal (7, 9.7%). The
S8
three commonest sites of thrombosis were the internal jugular (29.5%), subclavian (18.6%) and cephalic (17.8%) veins. Less commonly affected were the brachial (12.4%), axillary (8.5%), basilic (8.5%), innominate (3.9%) and external jugular (0.8%) veins. Overall, 69 (53.5%) thromboses were catheter-related. Conclusions In medical–surgical patients who are receiving heparin prophylaxis, upper extremity DVT was uncommon, occurring in 2% of patients. These thromboses may be clinically important, because the majority is proximal and three-quarters are deep. Revisiting the need for central vascular access daily is underscored by the finding that half were catheter-related. Acknowledgements On behalf of the PROTECT Investigators, CCCTG and ANZICS-CTG. P23 Real-time ultrasound guidance for internal jugular vein catheterization in neonates: preliminary experience M Di Nardo, F Stoppa, C Tomasello, C Cecchetti, M Marano, D Perrotta, E Pasotti, N Pirozzi Ospedale Pediatrico Bambino Gesù, Roma, Italy Critical Care 2011, 15(Suppl 1):P23 (doi: 10.1186/cc9443) Introduction Recent studies reported that real-time ultrasound guidance for internal jugular vein catheterization is useful in infants. However, this technique is sometimes difficult even for skilled physicians. The aim of our study is therefore to evaluate the success rate and the complication rate of this technique performed by ultrasoundtrained pediatric intensivists in neonates. Methods Fifteen consecutive term neonates (mean weight 3.9 ± 1.1 kg) needing a central venous access for intensive care treatment were prospectively studied for ultrasound-guided internal jugular vein cannulation. Patients’ age, weight, time for cannulation, catheter size, central venous time permanence, success rate and complications rate were recorded. Results Cannulation was successful in all 15 infants. The right internal jugular vein was used in 90% of the patients enrolled, while in the remaining 10% the left internal jugular vein was used. The overall complication rate was 22%. We had only one major complication (2%): lung pneumothorax. Minor complications were: multiple skin and vein punctures (9%), Seldinger wire kinking (7%) and venous hematomas (4%). Time required for complete cannulation was 8 ± 4.3 minutes, while the mean duration of the central venous catheter was 5 ± 5 days. Conclusions Our results suggest that ultrasound assistance for central vein cannulation can be easily performed by well-trained physicians in neonates. Particular solutions (increase of the tilting angle of the bed, use of soft nitilon tip guide wire and the transfixation technique) can be sometimes requested to increase the success rate of our procedures. In accordance to these considerations, US-guided CVC placement should be probably considered as the first choice method for catheterization in infants. References 1. 2.
Verghese S, McGill W, Patel R, Norden J, Ruttiman U: Internal jugular vein cannulation in infants: palpation vs imaging. Anestesiology 1996, 85:1078. Leyvi G, Taylor D, Reith E, Wasnick J: Utility of ultrasound-guided central venous cannulation in pediatric surgical patients: a clinical series. Pediatr Anesth 2005, 15:953-958.
P24 Is routine ultrasound examination of the gallbladder justified in ICU patients? E Evodia1, I Vlachou2, G Petrocheilou2, A Gavala1, M Pappa1, L Livieratos2, P Myrianthefs1, L Gregorakos1, G Baltopoulos1 1 Agioi Anargyroi Hospital, Athens, Greece; 2St Paul Hospital, Athens, Greece Critical Care 2011, 15(Suppl 1):P24 (doi: 10.1186/cc9444) Introduction Gallbladder (GB) abnormalities are frequently seen in critically ill ICU patients. The purpose of the study was to evaluate protocolized GB US examination in medical decision-making. Methods In this prospective study a twice per week GB US examination was performed in critically ill patients under mechanical ventilation
Critical Care 2011, Volume 15 Suppl 1 http://ccforum.com/supplements/15/S1
(MV) for a period of 8 months independently of liver biochemistry to identify GB abnormalities. Hepatic dysfunction was defined as bilirubin >2 mg/dl and/or alkaline phosphatase >200 IU/l [1]. US findings that were evaluated included: gallbladder wall thickening, gallbladder distention, striated gallbladder wall, pericholecystic fluid and gallbladder sludge. We also recorded associated clinical and laboratory parameters: fever, WBC, MV status, liver function and administration of parenteral nutrition, analgesics, pressor agents, and predisposing factors that were associated with high incidence of acute acalculous cholecystitis (AAC). Results We included 53 consecutive patients (42 males, mean age 57.6 ± 2.8 years, illness severity scores APACHE II 21.3 ± 0.9; SAPS II 53.3 ± 2.3; SOFA 10.2 ± 0.2; and mean ICU stay 35.9 ± 4.8 days) of which 25 (47.2%) had at least one US findings. Sixteen patients (30.2%) had two or more US findings. Only six patients (24%) with ultrasound findings had also concomitant hepatic dysfunction while 19 (76%) with positive ultrasound findings did not have; difference statistically significant (c2, P = 0.03). Of the remaining 19 patients, three patients had increased γ-GT only (≥150 IU/l, 415.3 ± 50.2), and two patients had increased SGPT only (≥150 IU/l, 217.5 ± 31.2). Three patients having US findings compatible with AAC underwent open cholecystectomy. Only one of them had concomitant hepatic dysfunction, as defined. Patients experiencing two or more US findings and/or liver dysfunction but not ACC were medically managed including gastric drainage, modulation of antibiotic therapy and/or interruption of nutrition until resolution of US findings or improvement in laboratory findings. In nine patients with US findings without hepatic dysfunction or increased γ-GT /SGPT, enteral or parenteral nutrition was stopped and were monitored, until improvement. Conclusions Routine GB US examination was able to guide surgical therapy for AAC despite the absence of liver dysfunction. Also, it was useful to guide the medical therapy and the administration of nutrition during the ICU stay. Reference 1.
Limdi JK, Hyde GM: Evaluation of abnormal liver function tests. Postgrad Med J 2003, 79:307-312.
P25 Transthoracic echocardiography performed by intensive care fellows: is minimal focused training enough? M Almaani, M Alabdrab Alnabi, D Bainbridge, R Taneja University of Western Ontario, London, Canada Critical Care 2011, 15(Suppl 1):P25 (doi: 10.1186/cc9445) Introduction Transthoracic echocardiography (TTE) has an important role in the diagnosis of shock in the ICU. There is evidence that noncardiologist residents can address simple clinical questions in the ICU with TTE [1]. We conducted this study to evaluate whether ICU fellows, with minimal focused training in TTE, could reliably acquire good-quality images in critically ill patients. Methods After research ethics board approval, 19 adult patients requiring echocardiography as per the attending physician were enrolled. Patients were enrolled if they were hemodynamically unstable and were adapted on the ventilator. Each patient underwent TTE by one of the certified echocardiographers and then subsequently by a blinded ICU fellow with minimal training in TTE (3-day ultrasound course, 7 hours hands-on training). All images were reviewed offline independently and graded [2] by two blinded reviewers. Interobserver agreement was measured using the intraclass correlation (ICC). Image quality was graded on a scale from 1 (excellent) to 4 (very poor) and the composite image score (total score out of a possible 20 for five views: parasternal short and long axis, apical, subcostal and IVC views) was compared between groups using the Wilcoxin paired test. Each patient’s images were further analysed to assess whether the images of LV, RV and IVC had been acquired. Results Nine patients were diagnosed with cardiogenic, eight with distributive and two patients with hypovolemic shock at the time of enrollment in the study. A total of 169 images were analysed. The ICC for interobserver agreement was good (0.8). There was no statistical difference between the composite image scores acquired by ICU fellows
S9
(12.3 ± 0.7) (mean ± SE) in comparison with certified echocardiographers (11 ± 0.6, P = 0.08). However, the ICU fellows could not acquire images of the RV or LV in five out of 19 patients (26%) in comparison with corresponding images by certified echocardiographers. Conclusions ICU fellows, with minimal focused training in TTE, can acquire images that are comparable in quality with certified echocardiographers in our institution. However, they are not able to acquire images of the LV or RV in over 25% patients as compared with certified echocardiographers. Minimal focused training in TTE may not be enough when managing critically ill patients. References 1. 2.
Vignon et al.: Intensive Care Med 2007, 33:1795–1799. Perk G, et al.: J Am Soc Echocardiogr 2007, 20:281-284.
P26 Survey of echocardiography provision and practice in ICUs in the United Kingdom A Cooke1, S Bruemmer-Smith2, J McLoughlin3, J McCaffrey1 1 Belfast City Hospital, Belfast, UK; 2Brighton and Sussex University Hospital, Brighton, UK; 3Sir Charles Gairdner Hospital, Perth, Australia Critical Care 2011, 15(Suppl 1):P26 (doi: 10.1186/cc9446) Introduction Echocardiography in the intensive care unit (ITU) has been shown to be a valuable aid to clinical decision-making [1-3]. Currently, there is no formal training process for intensivists wishing to learn echocardiography in the United Kingdom, and there is little information on the current state of clinical practice. Methods A structured questionnaire was sent to each intensive care unit in the United Kingdom. The questionnaire detailed information regarding the availability of echocardiography and the frequency that echocardiograms are performed in the ITU. We enquired after the level of training in echocardiography by intensivists, the reporting process and availability of currently provided training. Opinions on the necessity of formalised training and the level of that training were also sought. Results Responses were obtained from 32 units ranging in size from five to 35 critical care beds. A total of 53.13% have their own dedicated echo machine. Only 15.6% have a transoesophageal probe. In 28% of ITUs echocardiograms are performed by intensivists; however, only 25% of ITUs currently offer echocardiography training to intensive care trainees. Seventy-eight per cent of respondents believed that ITU physicians should have at least intermediate echocardiography skills; 97% respondents believed that a national training programme should be established for echocardiography practice by ITU physicians. Conclusions Echocardiography is currently widely used in ITUs throughout the United Kingdom but is often being performed by physicians with little or no formal training. There is almost unanimous support for a national structure and a formalised curriculum to achieve safe widespread training. References 1. 2. 3.
Orme RM, et al.: Br J Anaesth 2009, 102:340-344. Breitkreutz R, et al.: Minerva Anesth 2009, 75:285-292. Price S, et al.: Intensive Care Med 2006, 32:48-59.
P27 Clinical and economic impact of a TEE monitoring system in intensive care HM Hastings, SL Roth ImaCor, Garden City, NY, USA Critical Care 2011, 15(Suppl 1):P27 (doi: 10.1186/cc9447) Introduction The purpose of this study was to determine the clinical and economic impact of hemodynamic monitoring in intensive care with the ImaCor TEE monitoring system, including a miniaturized, detachable, single-use probe (the ImaCor ClariTEE™). TEE has been cited as especially appropriate for hemodynamic monitoring because abnormalities are multifactorial; or example, hypovolemia, LV and RV dysfunction, tamponade. Unlike conventional probes, the ClariTEE™ was designed and cleared by the FDA to remain indwelling for 72 hours of episodic hemodynamic monitoring.
Critical Care 2011, Volume 15 Suppl 1 http://ccforum.com/supplements/15/S1
Methods The ImaCor system was used to monitor 46 postcardiac surgery patients at two institutions and 68 general ICU patients at eight institutions. Effects on management were recorded and analyzed retrospectively. Economic impact was estimated from [1-4]. Results In 46 postcardiac surgery patients, surgical re-exploration was avoided in five patients (11%), and fluid and pressor administration changed in 23 patients (50%). TEE monitoring also detected tamponade requiring reoperation and helped optimize the LVAD flow rate. Even without including likely reductions in acute kidney injury, a common complication [5], estimated hospital charges (see [1-4]) were reduced by $12,000 per patient. In 68 general ICU patients, fluid and pressor administration was changed in 28 patients (41%), reducing estimated hospital charges by $7,400 per patient. Conclusions TEE monitoring demonstrated the potential to improve hemodynamic management; expected to reduce hospital stay [6,7]: even small amounts of mild instability significantly increase hospital stay and charges [4]. TEE monitoring also demonstrated the potential to avoid reoperation postcardiac surgery. Reoperation significantly increases morbidity (low cardiac output, acute renal failure, sepsis), vent time, ICU stay and mortality [8]; also cost [1]. Although further study is needed, TEE monitoring has shown potential for significant clinical and economic impact. References 1. 2. 3. 4. 5. 6. 7. 8.
Speir AM, et al.: Ann Thorac Surg 2009, 88:40-45. Trzeciak S, et al.: Chest 2006, 129:225-232. Shorr AF, et al.: Crit Care Med 2007, 35:1257-1262. Hravnak M, et al.: Intensive Care Med 2010, 36:S163. Hein OV, et al.: Ann Thorac Surg 2006, 81:880-885. Pölönen P, et al.: Anesth Analg 2000, 90:1052-1059. Charron C, et al.: Curr Opin Crit Care 2006, 12:249-254. Ranucci M, et al.: Ann Thorac Surg 2008, 86:1557-1562.
P28 Usefulness of chest ultrasonography in the management of acute respiratory failure in the emergency room S Silva, M Dao, C Biendel, B Riu, J Ruiz, B Bataille, J Bedel, M Genestal, O Fourcade CHU Toulouse Purpan, Toulouse, France Critical Care 2011, 15(Suppl 1):P28 (doi: 10.1186/cc9448) Introduction Acute respiratory failure does not always present in conditions that are ideal for immediate diagnosis, which sometimes compromises outcome. Physical examination and bedside radiography are imperfect, resulting in a need for sophisticated test results that delay management. Recently, a decision tree utilizing bedside ultrasonography has been proposed to guide diagnosis of severe dyspnoea. This study examines the relevance of this approach to diagnose acute respiratory failure in the emergency room (ER). Methods This prospective study was conducted in university teaching hospitals over 1 year investigating 59 consecutive adults patients admitted to the ER with acute respiratory failure. At arrival, two diagnosis approaches have been performed: Standard (established using standardized tests and not including ultrasound data), and Ultrasound (derived from the ultrasound decision tree). Investigators did not participate in patient management, and were blinded to the data from the other group. We compared diagnosis results from both approaches (Standard and Ultrasound) with the official diagnosis established at the end of the hospitalization by the ER staff. The internal review board of the hospital approved this study. The MacNemar test was used to analyse the error rate. The means were compared using Student’s t test. Results The error rates were 30% and 10% in the Standard and Ultrasound groups, respectively (MacNemar test, P <0.02). The number of erroneous initial diagnoses was significantly greater using conventional tools in patients with pneumonia and pulmonary oedema (Standard vs. Ultrasound, P <0.05). More patients received inappropriate therapy in the Standard than in the Ultrasound group (35% vs. 15%, P <0.05). Conclusions Ultrasound generates standardized and reproducible patterns, which have been proposed to help bedside diagnosis in patients admitted to the ER with acute respiratory failure. Our data highlight a significant improvement of initial diagnosis accuracy using
S10
this tool. Chest ultrasound performed by physicians in charge of ERs appears to be one of the most promising techniques for management of patients admitted to the ER with acute respiratory failure and should rapidly expand in the near future. References 1. 2. 3.
Lichtenstein D, et al.: Anesthesiology 2004, 100:9-15. Lichtenstein D, et al.: Chest 2008, 134:117-125. Wasserman K, et al.: JAMA 1982, 248:2039-2043.
P29 Training in focused echocardiography for intensive care specialists: can delivery meet perceived need? G McNeill1, A Whiteside2, A Tridente2, D Bryden2 1 Sheffield Teaching Hospitals, Sheffield, UK; 2Sheffield Teaching Hospitals NHS Trust, Sheffield, UK Critical Care 2011, 15(Suppl 1):P29 (doi: 10.1186/cc9449) Introduction There is increasing recognition of the utility of focused echocardiography in critically ill patients and a need for suitable training programmes to be developed to meet the specific needs of critical care. Critical care communities across Europe have struggled to implement focused echocardiography into everyday clinical practice. We aim to determine whether a training programme could be implemented during a year of advanced intensive care training in a region where none of the critical care consultant body had accreditation in echocardiography, and to establish the perceived training requirements in critical care echocardiography in our region and to evaluate what information clinicians wished to obtain from a focused echocardiography examination. Methods Trainees attended a course designed for echocardiography in a peri-arrest situation. Local cardiac anaesthetists with experience in transthoracic echocardiography were recruited as mentors. Data archiving protocols were established. Trainees performed an initial 10 scans directly supervised on the cardiac ICU. A further 40 scans were completed independently on the general ICU. A logbook was maintained and the scans reviewed with a mentor prior to final sign off. This process was supported by a regional educational meeting where personnel interested in echocardiography reviewed the types of training provided and how this matched local needs and resources. This included trainees and trainers in intensive care medicine, anaesthesia and acute medicine. Results Although 91% of doctors wished to incorporate focused echocardiography into their clinical practice, only 36% had undergone any focused echocardiography training and only 5% had focused echocardiography accreditation. The majority of respondents wished only to incorporate eyeball assessments of ventricular function but did not wish to perform more complex examinations such as Doppler assessment. Conclusions It is possible to implement a simple training programme in echocardiography in an intensive care medicine department with no prior experience in critical care echocardiography. Within our region there is strong demand for simple training in focused echocardiography rather than a higher level of accreditation currently offered by many courses. References 1. 2.
Price S: Critical care echocardiography training. JICS 2010, 11:86-87. Vieillard-Baron A, et al.: Echocardiography in the intensive care unit: from evolution to revolution? Intensive Care Med 2008, 34:243-249.
P30 Concordance analysis of left ventricular mass by transthoracic echocardiography versus 64-slice multidetector computed tomography JJ Jimenez, JL Iribarren, J Lacalzada, A Barragan, M Brouard, I Laynez Hospital Universitario de Canarias, La Laguna, Spain Critical Care 2011, 15(Suppl 1):P30 (doi: 10.1186/cc9450) Introduction Left ventricular mass (LVM) is considered an independent cardiovascular risk factor. Today we have new cardiac imaging methods for its calculation, which are incorporated into the already established
Critical Care 2011, Volume 15 Suppl 1 http://ccforum.com/supplements/15/S1
classic. The aim of the study was to assess a comprehensive analysis of the correlation of LVM between two different diagnostic techniques, transthoracic echocardiography (TTE) and 64-slice multidetector computed tomography (MDCT). Methods A prospective cohort of 102 patients’ LVM was quantified by TTE and MDCT in a row and blind study. We used the following test: intraclass correlation coefficient absolute agreement (ICCA) as a mixed model, concordance correlation coefficient of Lin (CCCL) to evaluate the accuracy, Passing–Bablock regression (PBR) to detect systematic errors and finally the range of Bland–Altman agreement. Results There were 57 (55.8%) males, mean age 65 ± 13 years. ICCA was 0.67 (95% CI: 0.30 to 0.84), P <0.001; the CCCL was 0.67. The PBR (Y = A + B * X) was: A = –29 (95% CI: –170 to 64), B = 0.70 (95% CI: 0.51 to 0.98). The range of agreement of Bland–Altman showed a mean of X (TTE) – Y (MDCT) = –37.8 (95% CI: –47 to 72) g, there were two cases below the lower limit. Conclusions Both methods show a level of consistency and acceptable accuracy, showing no systematic error constant rate (interval A contains 0) but there seems to be a discrete proportional error (interval B does not contain 1). As shown, the Bland–Altman range seems to slightly overestimate the TTE value against the MDCT, probably related to the quality of the echocardiography window.
P31 Coronary artery disease and differential analysis of a valve calcium score by transthoracic echocardiography JL Iribarren, JJ Jimenez, J Lacalzada, A Barragan, M Brouard, I Laynez Hospital Universitario de Canarias, La Laguna, Spain Critical Care 2011, 15(Suppl 1):P31 (doi: 10.1186/cc9451) Introduction Valvular calcification represents a form of atherosclerosis similar to that produced in the wall of the coronary arteries, so that the presence of mitral annular calcification (MAC), aortic valvular sclerosis and aortic root (AVRS) detected by transthoracic echocardiography (TTE) is associated with an increased risk for developing coronary artery disease (CAD). Coronary calcification and intracoronary lesions can be assessed by non-invasive coronary multidetector computed tomography (MDCT). The aim of this study was to determine whether a global valvular calcium score (GVCS) and/or partial (MAC and AVRS) assessed by TTE can predict critical values of calcium at the level of the coronary wall, the Agatston score (AS) and/or the presence of significant coronary lesions detected using MDCT. Methods A prospective cohort of 82 patients with intermediate probability of CAD was referred for MDCT and then a TTE was performed in a blind way to calculate the GVCS and partial (range 0 to 15). Results Mean age 65 ± 13 years, 46 (56.1%) males. The area under the curve (AUC) of AS was 0.69 (95% CI: 0.5 to 0.82), P = 0.05. The cut-off value of AS for a higher predictive value to identify the presence of CAD was ≥350 with a sensitivity (S) of 46%, specificity (E) of 86% and a positive predictive value (PPV) and negative predictive value (NPV) of 60% and 78%, respectively. The GVCS value for an AS ≥350 with a higher predictive value was 9. The AUC of GVCS was 0.73 (95% CI: 0.57 to 0.90), P = 0.01 so that a GVCS ≥9 predicts the presence of CAD with S = 36%, E = 97%, PPV = 83% and NPV = 79%. Spearman’s rho correlation coefficient showed a direct association between AS and GVCS (r = 0.29, P = 0.03), between AS and MAC (r = 0.30, P = 0.03) as well as between AS and AVRS (r = 0.42, P = 0.004). The same coefficient was used to calculate the association between the presence of significant CAD (≥50% stenosis) detected by MDCT and GVCS (r = 0.32, P = 0.005), MAC (r = 0.06, P >0.05) and AVRS (r = 0.26, P = 0.03). When studying the relationship between single-vessel, double-vessel or triple-vessel CAD and GVCS, MAC and AVRS the following results were obtained respectively: r = 0.33 (P = 0.004), r = 0.06 (P >0.05) and r = 0.26 (P = 0.03). Conclusions The quantification of valvular calcification using a GVCS by TTE correlates well with the presence of CAD detected by MDCT. This association was stronger when AVRS was used compared with MAC.
S11
P32 National survey of the use of cardiac output monitoring tool in general adult ICUs in the United Kingdom O Couppis, S Saha, E Makings Broomfield Hospital, Chelmsford, UK Critical Care 2011, 15(Suppl 1):P32 (doi: 10.1186/cc9452) Introduction Haemodynamic monitoring is essential for the management of critically ill patients. Currently there are various techniques available in clinical practice to measure cardiac output (CO) in ICUs including pulmonary artery catheter (PAC), oesophageal Doppler, lithium dilution cardiac output (LiDCO) and pulse-induced contour cardiac output (PiCCO) studies. In recent times PAC has been used less with less invasive methods becoming more popular. We conducted a telephone survey of the current CO monitoring practices in adult ICUs in the United Kingdom. Methods All general adult ICUs in the United Kingdom were surveyed via telephone. The nurse-in-charge or the senior physician for the shift was consulted to ascertain which cardiac output monitors (COMs) were available for use, which was their first choice and if they used PAC in the past 12 months. Results A total of 225 adult ICUs were surveyed and all the replies were recorded on paper (98% response). Two hundred and eleven (96%) units used at least one form of COM while the rest of the 14 units did not use any COM tool. One hundred and two (48%) use more than one form of cardiac output monitoring. Oesphageal Doppler was most popular (86/211, 41%), followed by LiDCO and PICCO both used in 73/211 (35%) of the units, and pulse contour analysis (14/109, 7%). Seven out of 211 (3%) units still use PAC as the preferred method of COM, of these two had other COM devices available and five used PAC only. Forty-six out of 211 (22%) units were using PAC at least occasionally. In contrast, a similar survey performed in 2005 [1] found PAC (76%) and oesophageal Doppler (53%) devices to be most commonly available. Among the other techniques. 33% of the ICUs use PiCCO and a further 19% use LiDCO systems for CO monitoring (Table 1). Table 1 (abstract P32). Frequency of cardiac output monitoring across the United Kingdom 2005 [1]
2010
PAC
76%
22% (46)
Doppler
53%
41% (86)
LiDCO
19%
35% (73)
PICCO
n/a
35% (73)
WC analysis
33%
7% (14)
Other
8%
n/a
Conclusions The results show the changes in COM over the past 5 years in comparison with a previous survey in 2005 [1]. There appears to be a steady decline in the use of PACs, with oesophageal Doppler becoming the most popular method of COM. LiDCO and PiCCO are used equally throughout the United Kingdom, with pulse contour analysis becoming less popular. Reference 1.
Esdaile B, Raobaikady R: Survey of cardiac output monitoring in intensive care units in England and Wales. Crit Care 2005, 9(Suppl 1):P68. doi:10.1186/ cc3131.
P33 Hemodynamic monitoring in Swiss ICUs: results from a Web-based survey N Siegenthaler, R Giraud, T Saxer, JA Romand, K Bendjelid Hôpital Cantonal Universitaire, Genève, Switzerland Critical Care 2011, 15(Suppl 1):P33 (doi: 10.1186/cc9453) Introduction Adequate and prompt implementation of hemodynamic monitoring is an essential component in the management of critically
Critical Care 2011, Volume 15 Suppl 1 http://ccforum.com/supplements/15/S1
ill patients. The goal of the present survey is to assess hemodynamic monitoring strategies in Swiss ICUs. Methods A self-reported Web-based questionnaire (36 multiplechoice questions) was sent by email to available physicians in charge of adult critically ill patients in Swiss ICUs. The survey examined two subjects: the monitoring tool used and how the clinicians address fluid responsiveness. Results where expressed as frequency (% of all replies) and/or presented as a mean rate. Results We obtained 130 replies from 71% of selected Swiss ICUs (general, surgical, medical, etc.). Devices available were: echocardiography (Echo): 94.5%, PiCCO: 87.3%, Swan–Ganz: 80%, FloTrac™: 21.8%, oesophageal Doppler: 16.4%, LiDCO: 10.9%. The most often device used was: PiCCO: 56.7%, Swan–Ganz: 30.7%, Echo: 8.7%, FloTrac™: 3.1%, LiDCO: 0.8% respectively. Clinicians classified (from 1 to 5) the available devices in various situations as follows: during cardiogenic shock: Swan–Ganz (4.27), Echo (4.26), PiCCO (3.62), FloTrac™ (2.43); during septic shock: PiCCO (4.32), Swan–Ganz (3.76), Echo (3.32), FloTrac™ (2.59); during ARDS: PiCCO (4.09), Swan–Ganz (4.01), Echo (3.39), FloTrac™ (2.4). For most of the clinicians, the targeted arterial blood pressure was: 60 to 65 mmHg for 56.2%, 65 to 70 mmHg: 26.9%, 55 to 60 mmHg: 7.7%, 70 to 75 mmHg: 4.6% respectively. The parameters used to predict fluid responsiveness were: PPV: by 58.5% of clinicians, Echo parameters: 55.8%, passive leg rising (PLR) test: 53.8%, SVV: 50.0%, GEDV: 45.5%, CO: 45.4%, ScVO2: 43.1%, systemic arterial pressure: 41.5%, pulmonary artery occlusion pressure (PAOP): 34.6%, EVLW: 33.3%, SVO2: 31.9%, central venous pressure: 30.8%, variation of inferior vena cava diameter: 27.5%, ITBV: 21.4%, fluid balance: 14.6%, inferior vena cava diameter: 12.5%. Parameters used to stop the vascular filling were: high EVLW: by 51.8% of clinicians, high PAOP: 50.9%, low PPV: 42.6%, high GEDV: 42.0%, disappearance of lactates: 41.9%, Echo parameters: 39.5%, negative PLR test: 38.0%, high ITBV: 30.4%, increase in oxygen requirement: 25.6%, normal CO: 23.3%, elevated CO: 6.2%, high ScVO2: 18.6%, high SVO2: 13.3%. Conclusions This study suggests that clinicians use diverse monitoring methods. Moreover, regarding the parameters used for the fluid management strategy, several parameters are used without a clear predominance for one of them. Furthermore, static indices remain used. P34 Prediction of cardiac index by body surface temperatures, ScvO2, central venous–arterial CO2 difference and lactate W Huber, B Haase, B Saugel, V Phillip, C Schultheiss, J Hoellthaler, R Schmid Klinikum Rechts der Isar der Technischen Universität München, Germany Critical Care 2011, 15(Suppl 1):P34 (doi: 10.1186/cc9454) Introduction Monitoring of the cardiac index (CI) is a cornerstone of intensive care. Nevertheless, most of the techniques based on indicator dilution and/or pulse contour analysis require central venous and/or arterial catheters. Several surrogate markers have been suggested to estimate CI including ScvO2, central venous–arterial CO2 difference (CVACO2D) as well as body surface temperatures and their differences to body core temperature (BCT). It was the aim of our prospective study to evaluate the predictive capabilities of CVACO2D, ScvO2, surface temperatures and lactate regarding CI. Methods In 53 patients (33 male; 20 female) with PiCCO monitoring, 106 datasets including surface temperatures of great toe, finger pad, forearm and forehead using an infrared noncontact thermometer (Thermofocus; Tecnimed) as well as lactate, ScvO2, CVACO2D and pulse pressure (PP) were measured immediately before PiCCO thermodilution providing CI and SVRI. Statistics: SPSS 18.0. Results Patients: 17/53 (32%) ARDS; 14/53 (26%) liver cirrhosis; 13/53 (25%) sepsis; 4/53 (8%) cardiogenic shock; 5/53(9%) various aetiologies. Thermodilution-derived CI significantly correlated to the temperatures of the forearm (r = 0.465; P <0.001), great toe (r = 0.454; P <0.001), finger pad (r = 0.447; P <0.001) and forehead (r = 0.392; P <0.001) as well as to ScvO2 (r = 0.355; P <0.001), SCVACO2D (r = –0.244; P = 0.011) and pulse pressure (r = 0.226; P = 0.019), but not to lactate (r = –0.067; P = 0.496). ROC analysis regarding the critical threshold of CI <2.5 l/minute*sqm demonstrated the highest predictive capabilities for the differences
S12
(BCT – T-forearm) (ROC-AUC 0.835; P = 0.002; cut-off 4.6°; sensitivity 89%; specificity 71%) and (BCT – T-finger pad) (ROC-AUC 0.757; P = 0.017) as well as ScvO2 (ROC-AUC 0.744; P = 0.024). SCVACO2D (ROCAUC 0.706; P = 0.056) and lactate (ROC-AUC 0.539; P = 0.718) were not predictive. Multiple regression analysis (R = 0.725) demonstrated that age (P <0.001), PP (P <0.001), T-forearm (P = 0.024) and the difference (BCT – T-toe; P = 0.035) were independently associated with CI. Conclusions Body surface temperatures and their differences to BCT are useful to estimate CI. The difference (BCT – T-forearm) provided the largest ROC-AUC (0.835; P = 0.002) regarding CI <2.5 l/minute*sqm. SCVACO2D does not provide information in addition to body surface temperatures and ScvO2. P35 Impact of hepatic venous oxygen efflux and carotid blood flow on the difference between mixed and central venous oxygen saturation T Correa1, R Kindler1, S Brandt1, J Gorrasi1, T Regueira1, H Bracht1, F Porta1, J Takala1, R Pearse2, S Mathias Jakob1 1 University Hospital Bern – Inselspital and University of Bern, Switzerland; 2 Royal London Hospital, London, UK Critical Care 2011, 15(Suppl 1):P35 (doi: 10.1186/cc9455) Introduction The difference between central venous (ScvO2) and mixed venous oxygen saturation (SvO2) may vary widely. The objective of this study was to evaluate the impact of hepatic and renal venous oxygen efflux, femoral oxygen saturation and carotid artery blood flow on the difference between ScvO2 and SvO2 (Δ[ScvO2 – SvO2]). Methods Nineteen sedated and mechanically ventilated pigs (weight: 41.0 ± 3.6 kg) were subjected to sepsis (n = 8), hypoxic hypoxia (n = 3) and cardiac tamponade (n = 3) or served as controls (n = 5). Mixed, central and regional venous oxygen saturations (spectrophotometry), and carotid, hepatic and renal blood flows (ultrasound Doppler flow) were measured at baseline and 3 hourly, up to 24 hours. Hepatic venous oxygen efflux was determined as hepatic arterial + portal venous blood flow times hepatic venous oxygen content, and renal venous oxygen efflux as twice renal artery blood flow times renal venous oxygen content. A multiple linear regression analysis with backward elimination procedure was undertaken to define contributions of the variables to Δ[ScvO2 – SvO2]. Results Ninety-eight assessments were obtained (one to seven/ animal). The backward elimination procedure yielded a best model containing hepatic venous oxygen efflux (r = –0.46, P <0.01) and carotid artery blood flow (r = 0.56, P <0.01; Figure 1). This final model accounted for 49.8% of variation in Δ[ScvO2 – SvO2] (R2 = 0.498). Conclusions Carotid artery blood flow and hepatic but not renal venous oxygen efflux predict some of the differences between mixed
Figure 1 (abstract P35). Scatterplot of standardized predicted values versus ScvO2 – SvO2.
Critical Care 2011, Volume 15 Suppl 1 http://ccforum.com/supplements/15/S1
S13
and central venous oxygen saturation. As a consequence, SvO2 cannot be predicted by ScvO2 alone.
Table 1 (abstract P37). Hemodynamic parameters within the first 8 hours in the ICU Survivors
Nonsurvivors
P value
P36 Goal-directed fluid management based on stroke volume variation and stroke volume optimization during high-risk surgery: a pilot multicentre randomized controlled trial TW Scheeren1, C Wiesenack2, H Gerlach3, G Marx4 1 University Medical Center Groningen, the Netherlands; 2Marienhospital, Gelsenkirchen, Germany; 3Vivantes – Klinikum Neukoelln, Berlin, Germany; 4 University Hospital RWTH, Aachen, Germany Critical Care 2011, 15(Suppl 1):P36 (doi: 10.1186/cc9456)
MAP
85
70
0.08
CI
2.4
2.3
1
ScvO2
65
57
0.45
Lactate
4.4
8
0.47
StO2
77
81
0.35
Introduction Perioperative hemodynamic optimization has been shown to be useful to improve the postoperative outcome of patients undergoing major surgery. We designed a pilot study in patients undergoing major abdominal, urologic or vascular surgery to investigate the effects of a goal-directed (GD) fluid management based on continuous stroke volume variation (SVV) and stroke volume (SV) monitoring on postoperative outcomes. Methods Fifty-two high-risk-surgical patients (ASA 3 or 4, arterial and central venous catheter in place, postoperative admission in ICU) were randomized either to a control group (Group C, n = 26) or to a goaldirected group (Group G, n = 26). Patients with cardiac arrhythmia or ventilated with a tidal volume <7 ml/kg were excluded. In Group G, SVV and SV were continuously monitored with the FloTrac™/Vigileo™ system (Edwards Lifesciences, USA) and patients were brought to and maintained on the plateau of the Frank–Starling curve (SVV <10% and SV increase <10% in response to fluid loading). During the ICU stay, organ dysfunction was assessed using the SOFA score and resource utilization using the TISS score. Patients were followed up to 28 days after surgery for infectious, cardiac, respiratory, renal, hematologic and abdominal complications. Results Group G and Group C were comparable for ASA score, comorbidities, type and duration of surgery (275 vs. 280 minutes), heart rate, MAP and CVP at the start of surgery. However, Group G was younger than Group C (68 vs. 73 years, P <0.05). During surgery, Group G received more colloids than Group C (1,589 vs. 927 ml, P <0.05) and SVV decreased in Group G (from 9.0 to 8.0%, P <0.05) but not in Group C. The number of postoperative wound infections was lower in Group G (0 vs. 7, P <0.01). Although not statistically significant, the proportion of patients with at least one complication (46 vs. 62%), the number of postoperative complications per patient (0.65 vs. 1.40), the maximum ICU SOFA score (5.9 vs. 7.2), and the cumulative ICU TISS score (69 vs. 83) were also lower in Group G. ICU and hospital length of stay were similar in both groups. Conclusions Although the two groups were not perfectly matched, this pilot shows that fluid management based on SVV and SV optimization decreases wound infections. It also suggests that such a GD strategy may decrease postoperative organ dysfunction and resource utilization. However, this remains to be confirmed by a larger study.
P37 Prognosis value of dynamic variation of tissue oxygen saturation during severe cardiogenic shock P Gaudard, J Eliet, O Attard, P Colson CHRU, Montpellier, France Critical Care 2011, 15(Suppl 1):P37 (doi: 10.1186/cc9457) Introduction To evaluate the prognosis value of dynamic thenar O2 saturation (StO2) response using a vascular occlusion test (VOT) during cardiogenic shock. Methods A retrospective clinical observational analysis was performed on adult patients treated for severe cardiogenic shock in a surgical ICU. The non-invasive InSpectra near-infrared spectrometer was used to assess the effect of VOT on thenar eminence StO2. The VOT manoeuvre was repeated within the first 24 hours of admission. StO2 VOT-induced changes were compared between surviving and nonsurviving patients between the first 8 hours and the next 16 hours.
Figure 1 (abstract P37). StO2 recovery slope (mean).
Results Ten patients suffering from cardiogenic shock (age 59.8 ± 13.8 years; APACHE score 21.3 ± 5.9) were treated with inotropes (n = 7) and/ or circulatory mechanical assistance (four IABP, three ELS, one LVAD) and vasopressors (n = 9). Mortality in the ICU was 50%. Hemodynamic and metabolic parameters were not different between survivors and nonsurvivors (Table 1). The post-VOT StO2 recovery slope tended to be faster within the first 8 hours in survivors than in nonsurvivors (2.8 ± 1.1 vs. 1.7 ± 0.4%/s, P = 0.09) and improved significantly in the H8 to H24 period (4.5 ± 1.2 vs. 2 ± 1.1%/s, P = 0.007). The post-VOT StO2 recovery slope increased significantly within the first 24 hours in all survivors (Figure 1). Conclusions Our results suggest that, in patients treated for cardiogenic shock, rapid improvement in the post-VOT StO2 recovery slope is associated with a better prognosis. P38 Prognostic value of the central venous-to-arterial carbon dioxide difference for postoperative complications in high-risk surgical patients E Robin1, E Futier2, O Pires1, G Lebuffe1, B Vallet1 1 University Hospital of Lille, Université Nord de France, Lille, France; 2University Hospital of Clermont-Ferrand, France Critical Care 2011, 15(Suppl 1):P38 (doi: 10.1186/cc9458) Introduction Tissue hypoperfusion is a key trigger of postoperative organ dysfunction. Our objective was to evaluate the prognostic value of the central venous-to-arterial carbon dioxide difference (PCO2) gap, a global index of tissue perfusion, in patients after major abdominal surgery. Methods A prospective and observational study of 115 patients admitted to the ICU following major abdominal surgery. In all patients, measurements of the PCO2 gap, central venous oxygen saturation (ScvO2), serum lactate and conventional hemodynamic and biological parameters were performed on admission (H0), and over 6 hours until 12 hours after admission. Postoperative complications, the duration of mechanical ventilation, and the hospital length of stay and mortality up to 28 days were characterized using standard definitions. Area under the ROC curves for PCO2 gap, ScvO2 and lactate were calculated and compared to discriminate between patients with and without complications. Results A total of 78 patients developed at least one complication including 57 (50%) patients with postoperative septic complications.
Critical Care 2011, Volume 15 Suppl 1 http://ccforum.com/supplements/15/S1
S14
At T0 there was no significant difference in demographic and hemodynamic data, type and duration of surgical procedures between patients with and without complications. There were nine deaths (7.8%). There was a significant difference for PCO2 gap (8.1 ± 3.2 mmHg vs. 5.5 ± 2.8 mmHg, P <0.001), ScvO2 (76.5 ± 6.4% vs. 78.9 ± 5.8%) and serum lactate (P <0.001) between patients with and without complications. After multivariate analysis, PCO2 gap and lactate level, but not ScvO2, were associated with postoperative complications (P <0.001 and P = 0.018, respectively). Areas under the ROC curves were 0.66 (95% CI = 0.55 to 0.76) for lactate, 0.57 (95% CI = 0.46 to 0.68) for ScvO2 and 0.85 (95% CI = 0.77 to 0.93) for PCO2 gap, with 6 mmHg as the best threshold value for discriminating patients with and without complications. Patients with a PCO2 gap >6 mmHg (68%) had a longer duration of mechanical ventilation (4.1 ± 3.4 days vs. 5.6 ± 3.8 days, P = 0.047), and a longer hospital stay. Patients who died all had an enlarged PCO2 gap (P = 0.056). Conclusions Both low and supranormal values of ScvO2 were found to be warning signals of impaired tissue oxygenation. A PCO2 gap larger than 6 mmHg could be a useful prognostic factor to identify patients at risk of postoperative complications following major abdominal surgery, especially when ScvO2 exceeds 75%. P39 Continuous central venous saturation monitoring in critically ill patients D Chiumello1, M Cressoni1, A Marino2, E Gallazzi2, C Mietto2, V Berto2, M Chierichetti2 1 Fondazione IRCCS Ca’ Granda-Ospedale Maggiore Policlinico, Milan, Italy; 2 Università degli Studi di Milano, Milan, Italy Critical Care 2011, 15(Suppl 1):P39 (doi: 10.1186/cc9459) Introduction Central venous oxygen saturation (ScvO2) is a useful therapeutic target in septic shock. ScvO2 is an indirect index of the balance between oxygen supply and demand, thus in critically ill patients a fall in ScvO2 reflects a decrease in tissue oxygenation. ScvO2 depends on arterial oxygen saturation, oxygen consumption, cardiac output and hemoglobin. The aim of the study was to evaluate events of tissue oxygenation impairment that could be unrecognized by simple blood gas analysis, by continuously monitoring ScvO2 and to establish whether peripheral oxygen saturation (SpO2), mean arterial pressure (MAP), heart rate (HR), and central venous pressure (CVP) could predict LowScvO2 events. Methods Ventilated critically ill patients requiring a central venous catheter (CVC) for clinical use were enrolled. Continuous ScvO2 monitoring was obtained by a fiberoptic sensor inserted in the CVC and recorded for 72 hours with SpO2, HR, MAP and CVP. LowScvO2 events were defined as ScvO2 <65% maintained for at least 5 minutes. Results Thirty-seven patients (24 males) were enrolled. The mean clinical characteristics at admission to intensive care were: age 59 ± 16 years, BMI 26.1 ± 4.5 kg/m2, SAPS II 40 ± 13 (on 33 patients), PaO2/FiO2 206 ± 79, MAP 80 ± 13 mmHg, HR 92 ± 21 bpm, CVP 12 ± 3 mmHg, Hb 10.6 ± 1.9 g/dl. Continuous monitoring analysis detected 147 LowScvO2 events in 15 patients; while central venous blood gas analysis identified only nine LowScvO2 events in eight patients (6%). Table 1 summarizes patients’ variables according to three ScvO2 ranges. SpO2, HR, MAP and CVP were not correlated with LowScvO2 events. Most patients had long periods of ScvO2 >75 (supranormal ScvO2). Conclusions Continuous ScvO2 monitoring showed that most events of poor tissue oxygenation are relatively common, are not recognized by extemporary central venous blood gas analysis and are not mirrored by changes in SpO2, HR, MAP or CVP. Table 1 (abstract P39). Patients’ variables according to ScvO2 range
Patients
ScvO2 <65
ScvO2 65 to 75
ScvO2 >75
15/37
36/37
36/37
SpO2 (%)
95.8 ± 3.0
95.0 ± 3.3
96.4 ± 2.3
HR (bpm)
90.6 ± 16.1
90.5 ± 18.1
90.7 ± 16.5
MAP (mmHg)
82.5 ± 10.6
83.4 ± 12.7
82.2 ± 11.7
CVP (mmHg)
18.3 ± 4.6
20.2 ± 8.2
19.2 ± 5.5
P40 Femoral venous oxygen saturation is no surrogate for central venous oxygen saturation A Van der Schors1, P Van Beest2, H Liefers1, L Coenen1, R Braam1, P Spronk1 1 Gelre Hospitals, Apeldoorn, the Netherlands; 2University Medical Center, Groningen, the Netherlands Critical Care 2011, 15(Suppl 1):P40 (doi: 10.1186/cc9460) Introduction Shock is defined as global tissue hypoxia secondary to an imbalance between systemic oxygen delivery (DO2) and oxygen demand (VO2), reflected by mixed venous oxygen saturation (SvO2). Intervention based on markers of tissue hypoperfusion may improve outcome. Central venous oxygen saturation (ScvO2) has been used as a surrogate marker for SvO2. In order to monitor ScvO2 during resuscitation, an internal jugular or subclavian line must be inserted. However, sometimes the femoral vein is the preferred or only possible site for access. The purpose of our study is to determine whether ScvO2 and femoral venous oxygen saturation (SfvO2) can be used interchangeably. Methods A single-center, prospective, controlled, observational study was conducted at the Gelre Hospitals Apeldoorn. One hundred stable cardiac patients who underwent elective right heart catherization in daycare served as a control group. In the study group (high-risk surgery, ASA >2, n = 30) we determined SfvO2 and ScvO2 simultaneously at the start (T = 0) and at the end (T = 1) of the procedure. For each time point we calculated the agreement and difference between both values. Results Control group: ScvO2 and SfvO2 correlated significantly (r = 0.67, 95% CI = 0.50 to 0.80; P <0.0001) with large limits of agreement (bias 2.0 ± 7.1; –11.8 to 15.9). In the surgical patients at T = 0, mean values were similar (SfvO2 82.5 ± 6.6% vs. ScvO2 81.1 ± 8.1; P = 0.28). According to Bland–Altman analysis, the mean bias between ScvO2 and SfvO2 was 2.7 ± 7.9% and 95% limits of agreement were large (–12.9% to 18.2%), while correlation between ScvO2 and SfvO2 was significant (r2 = 0.35; P <0.01). At both time points SfvO2 and ScvO2 did not correlate significantly (P = 0.26 and P = 0.66 respectively) with similar negligible r2. Univariate analysis did not show any parameter (including dosages of dopamine or norepinephrine, total infusion, fluid balance, FiO2, type of surgery, lactate, and haemoglobin level) affecting either SfvO2 or ScvO2. Results were similar for changes in SfvO2 and changes in ScvO2. Conclusions Absolute values of SfvO2 are unsuitable as surrogate for absolute values of ScvO2. Also, the trends of both values are not interchangeable. Further studies should investigate the effects of treatment on SfvO2. P41 Predictive value of tissue oxygen saturation upon mortality in Emergency Department patients with sepsis C Vorwerk, T Coats University Hospitals of Leicester, UK Critical Care 2011, 15(Suppl 1):P41 (doi: 10.1186/cc9461) Introduction Microvascular dysfunction and inadequate delivery of oxygen to the tissues is a feature of septic shock. The degree of this microcirculatory impairment has not been assessed in the early phases of Emergency Department (ED) sepsis management. The purpose of this study was to assess the relationship between tissue oxygen saturation (StO2) and conventional vital signs and in-hospital mortality for ED patients with severe sepsis or septic shock. Methods Prospective cohort study of adult ED patients with severe sepsis or septic shock. Standard vital signs were monitored in all patients. StO2 measurements using near-infrared spectroscopy were commenced as soon as possible after the patients’ arrival in the ED. The measurements were continued throughout the stay in the ED whilst receiving normal treatment. StO2 readings were repeated after 24 hours of sepsis management. All patients were followed up for 30 days. Results Forty-nine patients were included in this study, of which 24 (49%) died. Nonsurvivors were significantly older than survivors (79 vs. 64, P = 0.008) but there were no significant differences in comorbidities or conventional vital signs. On arrival in the ED there was no difference in mean StO2 between survivors and nonsurvivors (72% vs. 72%, P = 0.97). With treatment, StO2 improved significantly to 78%
Critical Care 2011, Volume 15 Suppl 1 http://ccforum.com/supplements/15/S1
(P = 0.006) in survivors but remained persistently low in nonsurvivors. The AUROC for StO2 was 0.63 on ED departure and 0.71 after 24 hours of treatment, performing far better than heart rate (0.53), SpO2 (0.50) and systolic blood pressure (0.51). There was no correlation between StO2 and any of the routine vital signs. Conclusions Our results demonstrate that a consistently low tissue oxygen saturation despite initial sepsis resuscitation is associated with an increased in-hospital mortality. We have further shown that tissue oxygen saturation is a better prognostic indicator than conventional vital signs in severely septic ED patients. P42 Positive central-mixed venous oxygen saturation gradients: high oxygen saturation in the inferior vena cava confirms high splanchnic oxygen extraction A Reintam Blaser1, T Correa2, S Djafarzadeh2, M Vuda2, J Takala2, MW Dünser2, SM Jakob2 1 University of Tartu, Estonia; 2Inselspital, University of Bern, Switzerland Critical Care 2011, 15(Suppl 1):P42 (doi: 10.1186/cc9462) Introduction Central venous oxygen saturation (ScvO2) is increasingly used as a surrogate for mixed venous oxygen saturation (SvO2). On average, there is a positive gradient between ScvO2 and SvO2 that has been explained by the low inferior vena cava saturation (SivcO2). We aimed to clarify the dynamics and associations between different venous saturations in an experimental setting of porcine peritonitis. Methods Thirty-two anaesthetized pigs (40.3 ± 3.8 kg (mean ± SD)) were randomly assigned (n = 8 per group) to a nonseptic control group or one of three septic groups in which the pigs were observed for 6, 12 or 24 hours. Thereafter, resuscitation was performed for 48 hours. The pulmonary artery, superior vena cava and inferior vena cava (IVC) were catheterized. The catheter for IVC measurements was placed 5 cm below the diaphragm. SvO2, ScvO2 and SivcO2 were measured at 12-hour intervals starting at study baseline. Differences between saturations at different time points were tested with a t test for paired measurements. Results One hundred and ninety-two (136 in septic and 56 in control animals) simultaneous measurements of SvO2, ScvO2 and SivcO2 were analysed. Mean SvO2 was 58.7 ± 7.2%, ScvO2 61.5 ± 8.3% and SivcO2 66.7 ± 8.5%. Dynamics of the saturations throughout the study are presented in Figure 1. ScvO2 was numerically higher than SvO2 in 133 (69.3%) of all measurements. In 122 of these 133 measurements (91.7%), SivcO2 exceeded SvO2 as well. Conclusions In most of the measurements, both ScvO2 and SivcO2 were higher than SvO2. Our results suggest a high oxygen extraction of splanchnic organs as the reason for positive ScvO2–SvO2 gradients.
Figure 1 (abstract P42). Dynamics of mixed venous, superior and inferior vena cava saturations. §Difference between SvO2 and ScvO2, P <0.05. *Difference between SvO2 and SivcO2, P <0.005.
S15
P43 Lactate index and survival in hospital-acquired septic shock S Omar1, Mathivha1, J Dulhunty2, A Lundgren1 1 University of Witwatersrand, Johannesburg, South Africa; 2University of Queensland, Brisbane, Australia Critical Care 2011, 15(Suppl 1):P43 (doi: 10.1186/cc9463) Introduction Severe sepsis is characterised by profound metabolic and inflammatory derangement, which can lead to multiorgan failure and death. During septic shock, oxygen delivery may fail to meet tissue demand resulting in increased oxygen extraction. Once tissue needs are no longer met, an oxygen debt with global tissue hypoxia and associated hyperlactataemia ensues. Several studies have shown that blood lactate may be used as a marker of global tissue hypoxia and prognosis in shock states. Methods Forty patients requiring adrenaline therapy for a first episode of septic shock acquired >24 hours after admission to the ICU had blood lactate levels measured 2-hourly over a 24-hour period. Adrenaline therapy was escalated until the target mean arterial pressure was reached. The lactate index was calculated as the ratio of maximum lactate increase to the adrenaline increase. Results Lactate increased from 2.3 to 2.9 mmol/l (P = 0.024) and the mean adrenaline increase was 0.14 μg/kg/minute. Peak lactate correlated with peak adrenaline (rho = 0.34, P = 0.032). Lactate index was the only independent predictor of survival after controlling for age and APACHE II score (OR = 1.14, 95% CI = 1.03 to 1.26, P = 0.009). Conclusions A high lactate following adrenaline administration may be a beneficial and appropriate response. References 1. 2. 3.
4.
5. 6.
Huckabee WE: Abnormal resting blood lactate. I. The significance of hyperlactatemia in hospitalized patients. Am J Med 1961, 30:840-848. Vitek V, Cowley RA: Blood lactate in the prognosis of various forms of shock. Ann Surg 1971, 173:308-313. Cowan BN, Burns HJ, Boyle P, Ledingham IM: The relative prognostic value of lactate and haemodynamic measurements in early shock. Anaesthesia 1984, 39:750-755. Levy B, Gibot S, Franck P, Cravoisy A, Bollaert PE: Relation between muscle Na+K+ ATPase activity and raised lactate concentrations in septic shock: a prospective study. Lancet 2005, 365:871-875. Leverve XM, Mustafa I: Lactate: a key metabolite in the intercellular metabolic interplay. Crit Care 2002, 6:284-285. Bassi G, Radermacher P, Calzia E: Catecholamines and vasopressin during critical illness. Endocrinol Metab Clin North Am 2006, 35:839-857.
P44 Effect of minute ventilation on central venous-to-arterial carbon dioxide difference S Saengngammongkhol, A Wattanathum, A Wongsa Phramongkutklao Hospital, Bangkok, Thailand Critical Care 2011, 15(Suppl 1):P44 (doi: 10.1186/cc9464) Introduction The central venous-to-arterial carbon dioxide difference (P(cv-a)CO2, dPCO2) is a global index of tissue perfusion. A normal dPCO2 indicates cardiac output (CO) is high enough to wash out CO2 production from peripheral tissues. An increased dPCO2 suggests that CO is not high enough with respect to global metabolic conditions. PCO2 depends on alveolar ventilation. We hypothesized that minute ventilation (MV) has an effect on dPCO2. Methods A prospective experimental, pilot study was performed on 19 patients admitted to a medical ICU with septic shock between August 2010 and November 2010. All patients were intubated and on a mechanical ventilator with continuously monitoring end-tidal CO2, central venous pressure (CVP), blood pressure (BP), and CO. Mechanical ventilator was set consecutively in three steps every 30 minutes (T0, T30, T60) by increasing the respiratory rate (RR) for MV of 8 l, 15 l, and 8 l, respectively. Tidal volume, RR, MV, auto-PEEP, CO and dPCO2 were recorded at each step of MV changed for all patients. Results Patients’ age and APACHE II scores were 67.3 ± 13.2 years and 24.4 ± 6.6, respectively. There was a significant difference between the dPCO2 between T0 and T30 (3.5 ± 3.5 vs. 5.9 ± 2.0, P = 0.04) (Table 1). Moreover, there was significantly decreased CO from T0 to T30 (5.1 ± 1.4
Critical Care 2011, Volume 15 Suppl 1 http://ccforum.com/supplements/15/S1
S16
Table 1 (abstract P44) P value Variable
T0
T30
T60
dPCO2
3.5 ± 3.5
5.9 ± 2.0
4.8 ± 2.1
T0 vs. T30 T30 vs. T60 T0 vs. T60 0.040
0.15
0.49
CO
5.1 ± 1.4
4.5 ± 1.1
5 ± 1.3
0.002
0.009
0.97
vs. 4.5 ± 1.11, P = 0.002) and, also, T30 and T60 (4.5 ± 1.1 vs. 5.0 ± 1.3, P = 0.009). Auto-PEEP values were inversely correlated with decreased CO (P <0.001) at T30. Conclusions Minute ventilation had an effect on dPCO2 by reduced CO due to development of auto-PEEP. The dPCO2 should be measured during normal minute ventilation without auto-PEEP. References 1. 2.
Mecher CE, et al.: Crit Care Med 1990, 18:585. Teboul JL, et al.: Minerva Anestesiol 2006, 72:597-604.
P45 A pulmonary artery catheter-based treatment algorithm changes therapeutic behaviour in septic patients C Bethlehem1, FM Groenwold2, MA Kuiper1, M Koopmans1, EC Boerma1 1 Medical Centre Leeuwarden, the Netherlands; 2University Medical Centre Groningen, the Netherlands Critical Care 2011, 15(Suppl 1):P45 (doi: 10.1186/cc9465) Introduction For years the role of the pulmonary artery catheter (PAC) in ICU patients has been a topic of discussion. The use of PAC itself is not associated with improved outcome, and might contribute to increased morbidity [1]. However, the influence of a therapeutic strategy, based on dynamic PAC-derived variables, has never been investigated. The aim of this study is to evaluate whether such PAC-based strategy influences therapeutic behaviour in septic patients. Methods We performed a single-centre retrospective case–control study in a 22-bed mixed ICU. Seventy patients with severe sepsis or septic shock, treated after introduction of a strict PAC-based resuscitation protocol, were compared with 70 matched controls, treated at the discretion of the attending physician. Continuous PAC measurements (Vigilance®) were started within 4 hours of admission. In short, the treatment algorithm only allowed infusion of fluids in cases of a 10% rise in left ventricular stroke volume; administration of dopamine was titrated on cardiac index in combination with central venous oxygen saturation. Norepinephrine was administered in cases of persistent hypotension despite the first two steps [2]. Primary outcomes were cumulative fluid balance and maximum dose of dopamine and norepinephrine in the first 24 hours. Statistical comparison between groups was performed with applicable tests; data are expressed as median (IQR). Results At ICU admission there were no differences in severity of disease or predicted mortality using the APACHE IV model. The cumulative fluid balance in the first 24 hours was significantly higher in the PAC group, in comparison with controls (6.0 (4.3 to 7.5) l vs. 3.6 (1.8 to 5.0) l, P = 0.00). However, after 7 days cumulative fluid balance was significantly lower in the PAC group (7.5 (4.6 to 13.1) l vs. 13.0 (6.7 to 17.7) l, P = 0.002). Maximum dose of norepinephrine in the first 24 hours was significantly higher in the PAC group (0.12 (0.03 to 0.19) μg/kg/minute vs. 0.02 (0 to 0.07) μg/kg/minute, P = 0.00). No difference in use of dopamine was found. There was a significant difference in days on mechanical ventilation in favour of the PAC group (7 (5.0 to 11.3) days vs. 10 (5.8 to 18.3) days, P = 0.01). Conclusions A treatment strategy, based on dynamic PAC-derived parameters in septic patients, significantly alters fluid administration, use of norepinephrine and days on mechanical ventilation, in comparison with historic controls. References 1. 2.
Ospina-Tascon et al.: Intensive Care Med 2008, 34:800-820. Boerma et al.: Crit Care Med 2010, 38:93-100.
P46 Performance of thermodilution catheters under control and extreme circulatory conditions in a pig model XX Yang, LA Critchley, F Zhu, Q Tian The Chinese University of Hong Kong Critical Care 2011, 15(Suppl 1):P46 (doi: 10.1186/cc9466) Introduction When validating new methods of cardiac output, measurement comparisons are made using Bland–Altman and percentage errors are generated that rely on a precision error for thermodilution of ±20% [1]; data collected 30 years ago [2]. We have re-evaluated this precision against an aortic flow probe. Methods Four domestic pigs, weight 30 to 32 kg, were anaesthetized. An aortic flow probe was placed via a left thoracotomy. Both Arrow (n = 6) and Edwards (n = 6) 7F pulmonary artery catheters and a Siemens SC9000 monitor were used. Sets of cardiac output readings were taken (three to six pairs). Catheters were changed frequently and cardiac output increased (for example, dopamine and adrenaline) and decreased (for example, trinitrate and beta-blocker) using drug infusions. Baseline and drug treatment data were compared. Results Forty-five sets (259 pairs) of averaged data (21 baseline and 24 following treatment) were collected. Baseline cardiac outputs (mean (SD)) were 1.9 (0.4) and 1.8 (0.3) l/minute for flow meter and thermodilution readings, respectively. MAP (mean (range)) was 82 (69 to 95) mmHg. Following circulatory treatment, cardiac output ranged from 0.5 to 3.4 l/minute and from 0.7 to 3.5 l/minute, respectively. MAP ranged from 44 to 118 mmHg. For baseline data, bias was 0.0 l/minute, limits of agreement ± 0.45 l/minute and percentage error ±24.3%. Following treatment, the bias was unchanged at 0.0 l/minute, but the limits of agreement widened to ±0.78 l/minute and percentage error widened to 42.0% (Figure 1).
Figure 1 (abstract P46). Plots showing widening distribution.
Conclusions The flow probe has a relatively low (1 to 2%) precision error, thus the baseline percentage error of 24.3% is in keeping the quoted precision error for thermodilution of ±20%. However, under more extreme circulatory conditions thermodilution behaved less reliably with widened limits of agreement and precision errors (42.0%). Thermodilution is less accurate than originally thought in haemodynamically unstable patients. References 1. 2.
Critchley et al.: J Clin Monit 1999, 15:85-91. Stetz et al.: Am Rev Respir Dis 1982, 126:1001-1004.
P47 Measurement of cardiac output using the transpulmonary thermodilution method in the presence of high extravascular lung water in a pediatric animal model A Nusmeier, S Vrancken, JG Van der Hoeven, J Lemson Radboud University Nijmegen Medical Centre, Nijmegen, the Netherlands Critical Care 2011, 15(Suppl 1):P47 (doi: 10.1186/cc9467) Introduction Cardiac output (CO) can be measured using the transpulmonary thermodilution (TPTD) technique. TPTD is considered to be the gold standard in pediatric patients. We studied the influence of high levels of EVLW on the reliability of CO measurement using the TPTD technique in a pediatric animal model.
Critical Care 2011, Volume 15 Suppl 1 http://ccforum.com/supplements/15/S1
S17
group H+L, MPAP was significantly above TB in all timepoints, but was highest at T20 and T40 (36 ± 13 and 34 ± 7 mmHg, respectively), decreasing significantly at T60 and T80 (to 26 ± 5 mmHg). PPV increased significantly in groups HEM and H+L (both P <0.001) from T20 to T80. There was, however, a statistical difference between HEM and H+L at T20 (27 ± 13% vs. 20 ± 8%, respectively; P = 0.044) and T40 (27 ± 7% vs. 18 ± 7%; P = 0.006), which disappeared at T60, when PPV in group H+L increased further. Conclusions Even though PPV was affected by the magnitude of MPAP during the peak hemodynamic effects of early endotoxemia, its ability to detect acute decreases in preload was not entirely compromised, in the conditions of the present study. Additional research should help determine possible associated factors that interfere with PPV in related conditions. Acknowledgements Grants received from FAPESP 08/50063-0, 08/50062-4, and LIM08/FMUSP. References 1. 2. 3. 4.
Michard F: Anesthesiology 2005, 103:419-428. Westphal G, et al.: Artif Organs 2007, 31:284-289. Daudel F, et al.: Crit Care 2010, 14:R122. Wanecek M, et al.: Eur J Pharmacol 2000, 407:1-15.
Figure 1 (abstract P47). Bland–Altman analysis of COtptd and COmpa.
Methods Anesthetized, mechanically ventilated lambs were instrumented with a COLD® (Pulsion Medical Systems, Munich, Germany) catheter and underwent repetitive saline lavage (10 to 30 ml/kg) of the lung. CO was measured using the single indicator TPTD method (COTPTD) and compared with simultaneous measurement of CO using an ultrasound perivascular flowprobe (Transonic Systems, USA) around the main pulmonary artery (COMPA). EVLW was assessed by the transpulmonary double indicator technique with intravenous injections of ice-cold indocyanine green (ICG). Results A total of 62 simultaneous measurements in 11 lambs were analyzed. The mean body weight was 8.6 (range 4.1 to 12.3) kg. The initial EVLWI was 13.8 (range 9.3 to 21.5) ml/kg. After lung injury this increased to 38.3 (range 16.2 to 60.9) ml/kg. The mean COMPA was 1.52 (range 0.40 to 3.05) l/minute. The correlation coefficient between the COMPA and COTPTD was 0.93. The Bland–Altman analysis showed a mean bias of –0.09 l/minute (limits of agreement ± 0.37 l/minute) (Figure 1). The percentage error was 25%. Conclusions In circumstances of largely increased extravascular lung water, CO can reliably be measured using the TPTD technique. P48 Hemodynamic effects of early endotoxemia on pulse pressure variation during experimental hemorrhagic shock J Noel-Morgan, DT Fantoni, DA Otsuki, JO Auler Jr Faculdade de Medicina da Universidade de São Paulo, Brazil Critical Care 2011, 15(Suppl 1):P48 (doi: 10.1186/cc9468) Introduction Although pulse pressure variation (PPV) is essentially proposed as a predictor of fluid responsiveness [1], it has also been appointed as an early detector of hypovolemia [2]. Still, caution has been recommended for its employment in certain conditions, as during pulmonary hypertension (PH) [2,3]. Endotoxin-induced PH produces biphasic increase in mean pulmonary artery pressure (MPAP) in several animal models, in which the early phase is acute and transient [4]. The objective of this study was to analyze the early hemodynamic effects of endotoxemia on PPV, during severe hypovolemic shock. Methods Fifty-one anesthetized, mechanically ventilated pigs were randomly allocated to four groups: control (n = 8), intravenous endotoxin (n = 8), hemorrhagic shock (50% blood volume in 20 minutes; HEM, n = 8) or hemorrhagic shock with endotoxin (H+L, n = 27). Hemodynamic parameters, measured by pulmonary artery and femoral arterial catheters, were assessed at baseline (TB) and at 20 (T20), 40 (T40), 60 (T60) and 80 (T80) minutes. Groups and times were compared with two-way ANOVA followed by Tukey test (P <0.05). Results At T20, the systolic volume index in groups HEM and H+L dropped significantly (P <0.001), with no difference between groups. MPAP was significantly higher in group H+L than in HEM at T20 (P <0.001), T40 (P <0.001), T60 (P = 0.009) and T80 (P = 0.013). Within
P49 Delta central venous pressure and dynamic indices of preload in postsurgical ICU patients M Cecconi, F Caliandro, E Barbon, V Elliott, A Dewhurst, A Rhodes Saint George’s Hospital, London, UK Critical Care 2011, 15(Suppl 1):P49 (doi: 10.1186/cc9469) Introduction Pulse pressure variation (PPV) and stroke volume variation (SVV) are indices of fluid responsiveness. We tested whether delta central venous pressure (δCVP) could be used to see if enough volume has been given in order to produce a response in SV and therefore improve the accuracy of PPV and SVV [1]. Methods Forty-nine fully ventilated patients in sinus rhythm were admitted postoperatively to the ICU monitored with pulse power analysis (PulseCO; LIDCO, Cambridge, UK). Fluid challenge (FC) consisted of 250 ml colloid over 5 minutes. Responder: SV increase >10%. δCVP was used to define two groups of patients: A (δCVP 0 to 1 mmHg) and B (δCVP >2). Results Eighty-two FCs were performed. There were 33% responders in A versus 36% in B (not significant). For A + B, SVV and PPV AUCs were 0.81 and 0.78. There was no statistically significant difference in the AUC for SVV and PPV between A and B, but there were different best cut-off values (Table 1). Table 1 (abstract P49) All patients
AUC groups A + B, best cut-off groups A + B
AUC group A, best cut-off group A
SVV
0.81 (SE 0.06), 11.5% (77%/76%)
0.89 (SE 0.07), 15.5% (88%/88%)
PPV
0.78 (SE 0.06), 13.5% (75%/76%)
0.84 (SE 0.09), 15.5% (81%/75%)
Conclusions Our data suggest that SVV/PPV efficacy in predicting a fluid response cannot be improved by looking at δCVP. More patients are needed to investigate the relationship between δCVP and best cutoff values for SVV and PPV. Reference 1.
Lakhal K, et al.: Central venous pressure measurements improve the accuracy of leg raising-induced change in pulse pressure to predict fluid responsiveness. Intensive Care Med 2010, 36:940-948.
P50 Comparison between pulse pressure variation and conventional parameters as guides to resuscitation in a pig model of acute hemorrhagic shock with endotoxemia J Noel-Morgan, DT Fantoni, DA Otsuki, JO Auler Jr Faculdade de Medicina da Universidade de São Paulo, Brazil Critical Care 2011, 15(Suppl 1):P50 (doi: 10.1186/cc9470) Introduction Volume expansion is often used in anesthesia and critical care to improve oxygen delivery and, in mechanically ventilated
Critical Care 2011, Volume 15 Suppl 1 http://ccforum.com/supplements/15/S1
patients, pulse pressure variation (PPV) has been proposed as an index to aid in the assessment of the appropriate amount of fluids to be administered to this end [1]. The objective of this study was to compare PPV with conventional parameters as guides to resuscitation, in an experimental model of severe hemorrhagic shock with endotoxemia. Methods Twenty-seven anesthetized, mechanically ventilated pigs were submitted to acute hemorrhagic shock with infusion of endotoxin. Animals were randomly allocated to three groups: control (n = 9); conventional treatment with lactated Ringer’s (LR) to achieve and maintain central venous pressure (CVP) ≥12 mmHg, mean arterial pressure (MAP) ≥65 mmHg and SvO2 ≥65% (CNV, n = 9); or LR to achieve and maintain PPV ≤13% and MAP ≥65 mmHg (dPP, n = 9). Hemodynamic parameters, measured by pulmonary artery catheter and femoral arterial catheter, and blood gases were assessed at baseline (TB), 1 hour after hemorrhage (TS), and hourly during the treatment period (T1 to T3). Groups and times were compared with two-way ANOVA followed by Tukey test and t test was used for comparisons of treatment times and LR amounts (P <0.05). Results At TS all groups presented equivalent, significant decreases in cardiac index (CI), MAP, CVP, SvO2 and oxygen delivery index (DO2I) and an increase in PPV (all P <0.001). At T3, both treated groups presented hemodynamic recovery, with no statistical difference from TB or each other for CI, MAP, SvO2, DO2I or PPV. Statistically, there were no differences in times or amounts of LR to achieve endpoints, for maintenance or in total amounts of LR given. The only statistical difference between treatment groups involved CVP, which was higher in group CNV than in group dPP at T2 (P = 0.009) and T3 (P <0.001). CVP was also higher at T3, in group CNV, when compared with TB (P = 0.006). Conclusions Although early fluid management guided by PPV yielded similar hemodynamic results to those achieved by management through conventional parameters, a difference could be noted regarding CVP, which was maintained higher in group CNV, but was restored to baseline values by PPV-guided therapy. The clinical impacts of such occurrences remain to be determined. Acknowledgements Grants received from FAPESP 08/50063-0, 08/50062-4, and LIM08/FMUSP. Reference 1.
Cannesson M: J Cardiothorac Vasc Anesth 2010, 24:487-497.
P51 Fluid resuscitation based on dynamic predictors of fluid responsiveness: closed loop algorithm versus anesthesiologists J Rinehart, B Alexander, L Meng, M Cannesson University of California Irvine, Orange, CA, USA Critical Care 2011, 15(Suppl 1):P51 (doi: 10.1186/cc9471) Introduction Closed-loop management of fluid resuscitation has historically been difficult. Given the dynamic predictors of fluid responsiveness, automated management is now feasible. We present simulation data for a novel patient-adaptive closed-loop fluid management algorithm using pulse pressure variation (PPV) as the input variable. Methods Using a simulator that includes physiologic PPV output, 20 practicing anesthesiology residents and faculty were asked to manage fluids and pressors for a 1-hour simulated hemorrhage case of 2 l blood loss over 20 minutes (group 1). One week later, they repeated the simulation, but this time fluids were secretly managed by the closedloop system while practitioner fluid administrations were ignored and only the pressors were entered (group 2). The simulation was also run 20 times with only the closed-loop (group 3) and 20 times with no management (group 4). Results Conditions across all groups were similar at baseline for simulated patient weight, height, heart rate (HR), mean arterial pressure (MAP), and cardiac output (CO). Once the hemorrhage began, the closed loop groups (2 and 3) intervened significantly earlier than the practitioners (group 1) and gave more fluid. The mean and final CO was higher in both closed-loop groups than in the practitioner group, and the coefficient of variance was lower. There was no difference in MAP between intervention groups, but all were significantly higher than the unmanaged group. See Figure 1.
S18
Figure 1 (abstract P51). Data are mean ± SD. *P <0.05 versus groups 2, 3, 4; **P <0.05 versus groups 1 and 4.
Conclusions Our data demonstrate that closed-loop management of fluid resuscitation is feasible using our novel dynamic-parameter based algorithm and that this approach can be used to optimize cardiac output. P52 A strong relationship between respiratory variations in pulse pressure (PPV) and airway pressure in fluid nonresponders: a potential explanation for false positive PPV values LO Hoiseth Oslo University Hospital, Oslo, Norway Critical Care 2011, 15(Suppl 1):P52 (doi: 10.1186/cc9472) Introduction Respiratory variations in pulse pressure (PPV) during mechanical ventilation predict fluid responsiveness when the tidal volume is >8 ml/kg [1]. The effect of airway pressure on the ability of PPV to predict fluid responsiveness is less explored. In patients undergoing major abdominal surgery, we found low specificity of PPV and therefore explored the relation between peak airway pressure (Paw) and PPV in fluid challenge nonresponders. Methods Twenty-five patients scheduled for open abdominal surgery with volume controlled ventilation 8 ml/kg, I:E ratio 1:2 and PEEP 5 cmH2O were included. Fluid challenges of 250 ml colloid were administered at the discretion of the anesthesiologist. PPV, hemodynamic variables, Paw and stroke volume (SV) measured by oesophageal Doppler were recorded before and after fluid challenges. Responders were defined by an increase in SV >15%. Results Thirty-four fluid challenges were performed. Further data are from analysis of nonresponders; 12 fluid challenges in 11 patients.
Figure 1 (abstract P52). PPV versus peak airway pressure before fluid challenge in nonresponders.
Critical Care 2011, Volume 15 Suppl 1 http://ccforum.com/supplements/15/S1
Specificity of PPV was 0.67. By fluid challenge, PPV was reduced from 7.4 (6.2 to 15.2)% to 6.0 (4.4 to 9.8)% (median, 25th to 75th percentiles), whereas Paw and SV were unchanged. Before fluid challenge, Paw was significantly correlated with PPV (r = 0.91, P <0.001) (Figure 1). Conclusions In this study on patients undergoing open abdominal surgery ventilated with 8 ml/kg, specificity of PPV was low. Paw and PPV were strongly correlated and false positive PPVs were associated with high Paw. This finding indicates that not only tidal volume, but also airway pressures may affect the ability of PPV to predict fluid responsiveness. Reference 1.
De Backer et al.: Intensive Care Med 2005, 31:517-523.
P53 Prediction of fluid responsiveness in septic shock patients: comparing automated pulse pressure variation by IntelliVue MP monitor and stroke volume variation by FloTrac™/Vigileo™ B Khwannimit1, R Bhurayanontachai2 1 Songklanagarind Hospital, Songkhla, Thailand; 2Division of Critical Care Medicine, Hat Yai, Thailand Critical Care 2011, 15(Suppl 1):P53 (doi: 10.1186/cc9473) Introduction The aim of this study was to assess and compare the ability of the automatically and continuously measured pulse pressure variation (PPV) obtained by an IntelliVue MP monitor and stroke volume variation (SVV) measured by FloTrac™/Vigileo™ to predict fluid responsiveness in septic shock patients. Methods We conducted a prospective study on 42 mechanically ventilated septic shock patients. SVV, PPV and other hemodynamic data were recorded before and after fluid administration with 500 ml of 6% tetrastarch. Responders were defined as patients with an increase in cardiac index ≥15% after fluid loading. Results The agreement (mean bias ± SD) between PPV and SVV was –0.59 ± 1.72% (Figure 1). The baseline PPV correlated with the baseline SVV (r = 0.96, P <0.001). Twenty-seven (64.3%) patients were classified as fluid responders. PPV and SVV were significantly higher in responders than in nonresponders (16.2 ± 4.9 vs. 7.1 ± 2% and 15.3 ± 4.3 vs. 6.9 ± 1.9%, respectively, P <0.001 for both). There was no difference between the area under the receiver operating characteristic curves of PPV (0.983) and SVV (0.99). The optimal threshold values to predicting fluid responsiveness were 10% for PPV (sensitivity 92.6%, specificity 86.7%) and 10% for SVV (sensitivity 92.6%, specificity 100%). Conclusions The automated PPV, obtained by the Intellivue MP monitor, and the SVV, obtained by FloTrac™/Vigileo™, showed comparable performance in terms of predicting fluid responsiveness in mechanically ventilated patients with septic shock.
S19
References 1. 2.
Cannesson M, et al.: Anesth Analg 2008, 106:1195-1200. Derichard A, et al.: Br J Anaesth 2009, 103:678-684.
P54 Dynamic indices of preload in postcardiac surgery patients by pulse power analysis E Barbon, F Caliandro, J Kamdar, M Puntis, H Meeran, A Rhodes, A Dewhurst, M Cecconi St Georges Hospital, London, UK Critical Care 2011, 15(Suppl 1):P54 (doi: 10.1186/cc9474) Introduction The ability to predict fluid responsiveness during the perioperative period is important in order to minimize the risk of hypovolemia and fluid overload. We studied the ability of dynamic indices [1] such as pulse pressure variation (PPV) and stroke volume variation (SVV) measured with the LiDCO™rapid to predict the response in stroke volume (SV) after a fluid challenge (FC). Methods This was a prospective observational study of FCs (250 ml colloid given in less than 5 minutes) in the immediate postoperative period in cardiac surgery patients. A positive response to a FC was defined as an increase in SV >10% measured with LiDCO™rapid. FCs were repeated according to the unit protocol. PPV and SVV were recorded before FC, together with static haemodynamic measurements: mean arterial pressure (MAP), central venous pressure (CVP) and heart rate (HR). Receiving operator characteristic (ROC) analysis was performed in order to identify haemodynamic variables suitable to predict fluid responsiveness. Results Sixteen patients were enrolled; five females, 11 males, age 70 (±11) years, weight 82 (±13) kg, height 167 (±10) cm. Of the 16 patients, seven (44%) were fluid responders to the first FC. A total number of 47 FCs were given. There were no differences in HR, CVP and MAP between responders and nonresponders. PPV and SVV were significantly different between responders and nonresponders. Areas under the curve for ROC curves were: for PPV 0.76 (0.61 to 0.92), P = 0.003, and for SVV 0.80 (0.67 to 0.93), P = 0.0006. The best cut-off values (sensitivity and specificity) to predict a SV increase >10% after FC were: PPV >13.5% (79%, 72%), and SVV >10.5% (84%, 68%). Conclusions Dynamic indices measured by LiDCO™rapid have a high sensitivity and specificity in predicting fluid responsiveness in fully sedated and mechanically ventilated patients postcardiac surgery. Reference 1.
Marik PE, et al.: Dynamic changes in arterial waveform derived variables and fluid responsiveness in mechanically ventilated patients: a systematic review of the literature. Crit Care Med 2009, 37:2642-2647.
P55 Cardiac cycle efficiency as prognostic index in ICUs A Donati, S Loggi, C Scorcella, MR Lombrano, L Botticelli, MC Melia, A Carsetti, R Domizi, S Tondi, P Pelaia Università Politecnica delle Marche, Ancona, Italy Critical Care 2011, 15(Suppl 1):P55 (doi: 10.1186/cc9475)
Figure 1 (abstract P53). Bland–Altman analysis for the agreement between SVV and PPV.
Introduction Cardiac cycle efficiency (CCE) can be calculated by the pressure recording analytical method (PRAM), a mini-invasive pulsecontour system that can provide beat-to-beat monitoring of cardiac output [1]. CCE is a new parameter that ranges from –1 to +1, with –1 being the worse and +1 the best possible performance of the cardiac cycle in terms of hemodynamic balance maintenance [2]. These characteristics make CCE a possible prognostic index, especially in critical patients who often present hemodynamic instability. Methods We recruited 157 consecutive patients admitted to the ICU undergoing hemodynamic monitoring, and the following parameters were registered in the first 24 hours from the admission: hemodynamic parameters (cardiac index, dp/dtmax and CCE) detected from the MostCare monitor (based on the PRAM algorithm), PaO2/FiO2 ratio, arterial lactates, SAPS II. We also divided the patients into seven diagnostic categories and take note of the outcome. Results We inserted all data into the logistic regression analysis model. The significant variables that take place in the regression equation
Critical Care 2011, Volume 15 Suppl 1 http://ccforum.com/supplements/15/S1
S20
Table 1 (abstract P55). Results of logistic regression analysis Variable
Significance
Odds ratio
dp/dtmax
0.032
0.191
SAPS II
0.0001
1.174
Diagnostic category
0.020
Lactates
0.033
1.018
included: SAPS II (P <0.0001), lactates (P = 0.033), dp/dtmax (P = 0.032) and the diagnostic category (P = 0.020). CCE was not significant and was not included in the model. See Table 1. Conclusions We demonstrate that CCE registered in the first 24 hours from admission is not a good prognostic index. The differences of CCE value between patients with good and negative outcome was not statistically significant. This result may suggest that a low CCE value in 24 hours from admission does not necessarily mean a bad outcome but, on the contrary, can be successfully improved by a therapeutic approach. It will be interesting to study whether there are some correspondences between CCE variations and modifications of the clinical conditions of the patients that may predict a positive or negative outcome. References 1. 2.
Romano SM, et al.: Crit Care Med 2002, 30:1834-1841. Scolletta S, et al.: Crit Care 2008, 12(Suppl 2):P249.
P56 Evaluation of pulse pressure variation with different inhaled concentrations of desfluorane, sevofluorane and isofluorane in pigs AH Oshiro, DT Fantoni, DA Otsuki, KT Rosa, JO Auler Jr Faculdade de Medicina da universidade de São Paulo, Brazil Critical Care 2011, 15(Suppl 1):P56 (doi: 10.1186/cc9476) Introduction Pulse pressure variation (PPV) has been shown to predict preload fluid responsiveness in mechanically ventilated patients [1]. Inhalant anesthetic agents have dose-dependent hemodynamic and direct myocardial contractility effects. The aim of this study was to compare the behavior of PPV under desfluorane, sevofluorane and isofluorane anesthesia. Methods Twenty-four anesthetized and mechanically ventilated pigs were randomly assigned into three groups of eight animals: desfluorane (DESF), sevofluorane (SEVO) and isofluorane (ISO). Static hemodynamic parameters and PPV, measured by pulmonary artery and femoral arterial catheters, were assessed at baseline (T1) using 1 MAC of the volatile agent; T2 (1.25 MAC); T3 (1 MAC) and T4 (1.0 MAC associated with a 30% hemorrhage of estimated average volemia). Twoway ANOVA and Tukey test were used for statistical analysis (P <0.05). Results At T2 there was an increase in PPV in all groups but not statistically significant compared with T1 or among groups. At T4 the increase in PPV was significant compared with basal values in the three groups: DESF (11 ± 4 vs. 7 ± 2%, P <0.001); SEVO (15 ± 5 vs. 6 ± 2%, P <0.001) and ISO (14 ± 5 vs. 7 ± 3%, P <0.001). No statistical difference between groups was found for PPV. Mean arterial pressure (MAP) decreased after 25% increment of MAC (T2) and after hemorrhage. At T4, MAP decreased significantly lower than basal values (T1) in groups DESF (P <0.001), SEVO (P <0.001) and ISO (P <0.001). Cardiac index (CI) decreased in T2 compared with T1: DESF (3.6 ± 0.6 vs. 2.9 ± 0.5 l/min/ m2, P <0.001), SEVO (4.0 ± 0.1 vs. 3.1 ± 0.4 l/min/m2, P <0.001) and ISO (4.2 ± 0.1 vs. 3.6 ± 0.9, P <0.001). The CI drop after hemorrhage showed no statistical difference when compared with T1. Conclusions PPV behaved similarly with different inhaled anesthetics. Although PPV did not reflect the hemodynamic depression of incrementing MAC values, it increased after bleeding 30% of estimated volemia. Acknowledgements Grants received were FAPESP 08/57247-0 and 08/57248-6. Reference 1.
Michard F: Anesthesiology 2005, 103:419-428.
P57 E/Ea ratio could not predict fluid response in ICU mechanically ventilated patients J Cousty1, A Mari2, P Marty1, B Riu1, P Sanchez1, O Mathe1, J Ruiz1, S Silva1, F Vallée1, M Génestal1, O Fourcade1 1 Reanimation polyvalente CHU Purpan, Toulouse, France; 2CHU Purpan, Toulouse, France Critical Care 2011, 15(Suppl 1):P57 (doi: 10.1186/cc9477) Introduction Transthoracic echocardiography (TTE) is now widely used in the ICU to assess hemodynamic status. Combined mitral index measured by TTE, as the mitral Doppler inflow E wave velocity to annular tissue Doppler Ea wave velocity ratio (E/Ea), is a reliable diastolic indicator in cardiologic patients. In ICU, E/Ea has only been investigated as a pulmonary arterial occlusion pressure surrogate which poorly reflects fluid responsiveness (FR). Therefore, the aim of this study was to evaluate the reliability of E/Ea to FR in the setting of ICU ventilated patients. Methods We carried out a TTE prospective observational study in mechanically ventilated patients receiving fluid challenge for circulatory failure. Complete TTE examination involving stroke volume (SV) estimation, mitral and tissue Doppler measurements (E, A, Ea, Aa velocities) were performed at end-expiratory time, before and after a 500 ml saline solution over 15 minutes of fluid challenge. A positive hemodynamic response was defined as a 15% minimal increment of SV. General characteristics, mitral parameters and combined index (E/A and E/Ea) were compared between responders (R) and nonresponders (NR) (using Student t test or chi-square test, ROC analysis and LHR method). Results Ninety-four case-mix patients were enrolled: 43 R and 51 NR, with similar baseline characteristics. LV ejection fraction was: altered (<50%) n = 24, or preserved (>50%) n = 69, with no difference (R vs. NR). E/Ea values before fluid loading were not statistically different between R and non-NR for which we observed a huge overlap (7.4 ± 2.4 vs. 8.4 ± 3.1 R vs. NR; P = 0.09). The results were similar when considering the population with baseline under the median value; that is, E/Ea <8: 28 R versus 24 NR, E/Ea = 6.0 ± 1.5 versus 5.6 ± 1.5 R versus NR, P = 0.28. The E/A index was significantly lower in R (1.1 ± 0.4 vs. 1.3 ± 0.4; P <0.01) but poorly predicted FR: ROC curve AUC = 0.64 (0.54 to 0.74), best cutoff : 0.8 (LHR+ 3.1; LHR– 0.7). Extreme values were predictive in our population: R was likely with E/A <0.6 (Sp 100%, LHR+ >5) and unlikely with E/A >1.8 (Se 100%, LHR– <0.2). Conclusions The E/Ea ratio is not statistically different between responders and nonresponders in the ICU and no low discriminant threshold value of E/Ea could identify patients likely to respond to fluid expansion. While E/A is statistically significant, only extreme values could be clinically relevant (<0.6 or >1.8).
P58 Comparison between MostCare and echocardiography for cardiac output estimation in trauma patients E Falciani, F Franchi, R Silvestri, L Cubattoli, P Mongelli, E Casadei, P Giomarelli, S Scolletta University of Siena, Italy Critical Care 2011, 15(Suppl 1):P58 (doi: 10.1186/cc9478) Introduction The reliability of the pulse contour methods (PCMs) in cardiac output (CO) monitoring has been questioned when changes in arterial tone occur spontaneously (for example, pain, hypovolemia) or after a therapeutic intervention (for example, nitroglycerin, norepinephrine). The purpose of this study was to compare the CO values assessed with the MostCare system (Vygon, Padova, Italy) (MC-CO) with those obtained with transthoracic echocardiography (Esaote Mylab 70, Genova, Italy) (TTE-CO) in trauma patients treated with norepinephrine. Methods Twenty-seven adult trauma patients admitted to a sevenbed ICU and requiring norepinephrine infusion were enrolled in the study. Inclusion criteria were: age >18, no aortic valve pathologies, sinus rhythm. TTE-CO and MC-CO were evaluated simultaneously
Critical Care 2011, Volume 15 Suppl 1 http://ccforum.com/supplements/15/S1
at two different stable hemodynamic states: baseline (T1), and after raising mean arterial pressure to 90 mmHg by starting norepinephrine infusion (T2). The MostCare system, an uncalibrated PCM, was connected directly to the main monitor of the patient for the analysis of the radial artery pressure wave. Bland–Altman and linear regression analyses were performed. Results Fifty-four paired CO values were obtained; TTE-CO values ranged from 2.9 to 6.8 l/minute and MC-CO from 2.8 to 6.9 l/minute. At T1 the mean bias between the techniques was –0.07 l/minute (2SD = 0.69 l/minute), with a percentage of error (PE) of 15% and R = 0.9; at T2 the mean bias between the techniques was –0.13 l/minute (2SD = 0.83 l/ minute), PE was 17% and R = 0.88. Overall, a good correlation between TTE-CO and MC-CO was observed (R = 0.9, P <0.01), with a mean bias of –0.10 l/minute (2SD ± 0.76 l/minute), 95% limits of agreement of –0.86 to 0.66 l/minute, and a PE of 16%. Mean arterial pressure was 82.2 ± 11.6 mmHg at T1 and 94.1 ± 3.8 mmHg at T2 (P <0.05). Heart rate did not change significantly from T1 to T2 (78.9 ± 13.6 bpm vs. 78.3 ± 18.7 bpm, respectively, P >0.05). Mean dosage of norepinephrine was 0.22 ± 0.1 μg/kg/minute (range 0.1 to 0.65 μg/kg/minute). Conclusions MC-CO values showed a good agreement with TTE-CO at the two different hemodynamic states of trauma patients. Under the studied conditions, the reliability of the MostCare system seemed not to be affected by the changes in vascular tone induced by norepinephrine infusion.
S21
P60 A clinical pilot study to evaluate the correlation between pulse wave velocity and cardiac output during elective surgery D Cain, S Harris University College Hospital, London, UK Critical Care 2011, 15(Suppl 1):P60 (doi: 10.1186/cc9480) Introduction Pulse wave velocity (PWV) is defined as the speed of conduction of a pressure wave generated by cardiac systole through the arterial tree. It may be non-invasively estimated from the pulse transit time that is measured as the interval between the R wave on an electrocardiogram and first inflexion point of the paired plethysmographic wave recorded from a finger pulse oximeter [1]. Within a simple two-component Windkessel model of the arterial system, PWV is proportional to the square root of arterial elastance [2]. Elastance is defined as the ratio of pulse pressure (PP) to stroke volume (SV). PWV might therefore provide a non-invasive estimate of cardiac output. Methods Adult patients undergoing major elective surgery were eligible. PWV was recorded using HypnoPTT (Nelco Puritan-Bennet). Invasive arterial blood pressure measurements were preferred when available. Stroke volume was measured via ODM (Deltex Ohmeda). Values were recorded every 5 minutes, smoothed (median of five consecutive values) and converted to the centimetre gram second system. SV was derived from PWV: SVPWV PWV2 x PP–1. Results Eleven patients (aged 45 to 74 years; five men, six women) were enrolled. Data are presented as (mean, SD). PWV was successfully measured on 287 occasions (324 cm/second, 48.5). SVPWV was calculated (62.4 ml, 18.3). SVODM values were (88.7, 4.86). Individual plots of SVPWV and paired SVODM were generated for each patient (Figure 1).
P59 Comparison of stroke volume changes of LiDCO™plus and Flotrac™ during postoperative hemodynamic optimization MG Costa, T Cecconet, P Chiarandini, S Buttera, L Pompei, G Della Rocca University of Udine, Italy Critical Care 2011, 15(Suppl 1):P59 (doi: 10.1186/cc9479) Introduction Postoperative hemodynamic optimization (PHO) [1] can be performed with mini invasive devices that showed different level of agreement when compared with the pulmonary artery catheter [2]. The aim of the study was to evaluate the concordance on stroke volume index changes (ΔSVI) obtained from calibrated (LiDCO™plus) and uncalibrated pulse contour (Vigileo™) devices in a surgical patient cohort during early PHO. Methods The setting was a prospective study in the ICU of a university hospital. Twenty-seven patients undergoing abdominal surgery and a PHO protocol were enrolled. We compared the paired SVI values obtained by the two devices 30 seconds before and 2 minutes after ending a volume challenge (VC) of HES 130/0.4 (3 ml/kg). In the protocol a SVI increase >5% after volume expansion defined a responder patient. Concordance of the response in terms of SVI direction of changes detected by each monitor (Vigileo-SVI and LiDCO-SVI) was analysed as proposed by Critchley and colleagues [3]. A Bland–Altman plot was used to define bias and accuracy between SVI obtained from the studied devices. Results The mean bias between LiDCO-SVI and Vigileo-SVI was 1.16 ml/m2 with SD of 12.51 ml/m2. The 95% limit of agreement was from –23.36 to 25.68 ml/m2. During all of the study period 47 VCs were administered. In eight out of 27 patients also 13 dobutamine tests were performed. The two devices showed the same direction of changes in 78% of the cases. In detail, they showed the same direction in 83% of cases after VC and in 62% of cases after dobutamine administration. Among the concordant data pairs, the devices agreed in 81% of cases to define responder and nonresponder and in 82% and 75% of cases after VC and dobutamine tests, respectively. Conclusions LiDCO™plus and Vigileo™ tests during a PHO protocol identified the same direction of changes in 78% of cases. Among this 78%, the devices agreed both in 81% of cases to define responder and nonresponder. References 1. 2. 3.
Pearse R, et al.: Crit Care 2005, 9:687-693. Hadiani M, et al.: Crit Care 2010, 14:R212. doi:10.1186/cc9335. Critchley LA, et al.: Anesth Analg 2010, 111:1180-1192.
Figure 1 (abstract P60). Stroke volume during the first 90 minutes of surgery.
Conclusions Estimated SVPWV values were within a clinically expected range; however, visual inspection of the plots demonstrated no relationship between SVPWV and gold standard SVODM. Furthermore there was no relationship between raw PWV data and SVODM. It is possible that PWV recordings were unreliable. The limited range of SVODM will have compressed our data, making any relationship less evident. We conclude SVPWV is not an accurate estimate of SVODM. References 1. 2.
Ishihara et al.: J Clin Monit Comput 2004, 18:313-320. Bramwell J, et al.: Velocity of transmission of the pulse wave. Lancet 1922, 891-893.
Critical Care 2011, Volume 15 Suppl 1 http://ccforum.com/supplements/15/S1
P61 LiDCOrapid and PiCCOplus preload response parameter validation study P Brass1, E Mills2, J Latza3, J Peters3, E Berendes1 1 Helios Klinikum, Krefeld, Germany; 2LiDCO Ltd, London, UK; 3Klinikum Duisburg, Germany Critical Care 2011, 15(Suppl 1):P61 (doi: 10.1186/cc9481) Introduction This study compares the ability of two arterial waveform monitors, the calibrated PiCCOplus and the nomogram scaled LiDCOrapid, to detect fluid responsiveness using the functional hemodynamic parameters stroke volume variation (SVV) and pulse pressure variation (PPV) in a surgical ICU population (ventilated, closed chest). The passive leg raising test (PLRT) is an alternative reversible test that can be carried out before administering volume. Methods We recruited 20 patients who had undergone major abdominal or neurosurgery and 10 patients in the SICU with progressive circulatory instability. The femoral artery was cannulated to obtain the arterial blood pressure waveform. Simultaneous measurements were made at four time points, M1 to M4: (M1) baseline, (M2) after PLRT, (M3) baseline (M4), after 500 ml Tetraspan® 6% over 10 minutes via pressure infusion. The PiCCO was calibrated via transpulmonary thermodilution at each time point. A change in SV >10% was considered as volume responsive. Results Data were collected from 30 patients, age 31 to 90, ASA 2 (2), ASA 3 (24) or ASA 4 (4), BSA 1.54 to 2.52 m2. Patients were ventilated with at least 6 ml/kg (IBW), and RR of 10 to 15/minute. PiCCO identified 15 patients as responders (50%) and LiDCO identified 18 patients as responders (60%) to the fluid challenge, both within the normal range of established studies. ROC curve analysis results are shown in Figure 1. Bland–Altman analysis comparing the PPVL with SVVL and SVVP give a bias of 0.3% and 0%, and limits of agreement of ±3.8% and ±4.4%, respectively.
Figure 1 (abstract P61).
Conclusions This study has demonstrated that SVV, PPV, and PLRT to a lesser extent, are effective for predicting volume response and can be used perioperatively for fluid management as part of goal-directed therapy. The sensitivity and specificity of the SVVL and PPVL were both greater than the SVVP. This is probably due to the difference in each algorithm’s ability to identify responders to the fluid challenge.
S22
infusion. The PiCCO was calibrated via transpulmonary thermodilution at each time point. Results Data were collected from 30 patients, age 31 to 90, ASA 2 (2), ASA 3 (24) or ASA 4 (4), BSA 1.54 to 2.52 m2. CI ranged from 1.5 to 7.2 l/ minute/m2 for PiCCO and from 1.5 to 7.1 l/min/m2 for LiDCO. Regression plots were made at each time point and show good agreement across the full range of CI values (r2 = 0.89 to 0.95). Bland–Altman analysis at each time point found low bias (10 to 50 ml/min/m2) and acceptable limits of agreement (16 to 30%), with the greatest difference occurring after the PLRT. Trending analysis was conducted by four-quadrant plot concordance assessment using an optimised exclusion zone of <5% ΔCI on changes at timepoints M2 to M4 relative to baseline (M1). Concordance was calculated as 97.8% overall agreement (44/45) for ΔCI >5%. Regression analysis found a high degree of correlation (r2 = 0.86 to 0.92) and all intercepts equal to 0. Conclusions In a heterogeneous patient population, LiDCOrapid CI values are in agreement with PiCCO CI values according to the accepted standard of ±30% with minimal bias. Trending analysis showed excellent concordance of 97.8%, which meets the recently proposed standard of >90% [1]. The LiDCOrapid is a valid measure of CI and trends in CI. It is easier to set up, does not require central venous access, is independent of the arterial site and can be used both intraoperatively in the OR and in the ICU. Reference 1.
Critchley LA, et al.: Anesth Analg 2010, 111:1180-1192.
P63 Pressure recording analytical method versus PiCCO in hemodynamic unstable patients A Donati, S Loggi, A Carsetti, MR Lombrano, L Botticelli, A Valentini, V Fiori, R Domizi, C Scorcella, P Pelaia Università Politecnica delle Marche, Ancona, Italy Critical Care 2011, 15(Suppl 1):P63 (doi: 10.1186/cc9483) Introduction Hemodynamic monitoring is important for diagnosis and therapy of critically ill patients. Thermodilution is now the gold standard method; however, it cannot be used routinely since it is very invasive. We investigated the agreement between the cardiac index (CI) obtained by mini-invasive monitor MostCare, based on the pressure recording analytical method (PRAM), and by PiCCO thermodilution in hemodynamic unstable patients. Methods We performed a prospective clinical study at our university hospital ICU. Twenty adult patients with hemodynamic instability were enrolled. All patients were sedated and mechanically ventilated with intermittent positive pressure ventilation. The MostCare and PiCCO systems were connected to each patient by a catheter inserted into the femoral artery. For each patient three measurements of CI were simultaneously carried out and the mean was considered for statistical analysis. Results We enrolled 10 severe sepsis/septic shock, four interstitial pneumonia, three COPD, one subarachnoid hemorrhage, one abdominal compartment syndrome, and one polytrauma. The age range
P62 Comparison of cardiac index: LiDCOrapid and PiCCOplus in the ICU P Brass1, E Mills2, J Latza3, J Peters3, E Berendes1 1 Helios Klinikum, Krefeld, Germany; 2LiDCO Ltd, London, UK; 3Klinikum Duisburg, Germany Critical Care 2011, 15(Suppl 1):P62 (doi: 10.1186/cc9482) Introduction This study aims to compare two arterial pressure waveform monitors: the nomogram scaled LiDCOrapid (LiDCO Ltd, London, UK) with the calibrated PiCCOPlus, (Pulsion, Munich, Germany), to determine agreement for cardiac index (CI) measurement and trending during positional changes of passive leg raise test (PLRT) and volume expansion in the SICU. Methods We recruited 20 patients who had undergone major abdominal or neurosurgery and 10 patients in the SICU with progressive circulatory instability. The femoral artery was cannulated to obtain the arterial blood pressure waveform. Simultaneous measurements were made at four time points, M1 to M4: (M1) baseline, (M2) after PLRT, (M3) baseline (M4) after 500 ml Tetraspan® 6% over 10 minutes via pressure
Figure 1 (abstract P63). Linear regression analysis between PRAM-CI and PiCCO-CI.
Critical Care 2011, Volume 15 Suppl 1 http://ccforum.com/supplements/15/S1
S23
different in responders and nonresponders (26.9 vs. 1.9, P <0.001). Three indices, ΔSVI-PLR, ΔCO-PLR and ΔCI-PLR, were significantly correlated with increase in SVI after fluids (rho = 0.854 (P <0.001), 0.727 (P = 0.002), 0.710 (P = 0.003)). ΔSVI-PLR correctly predicted responders state in all cases with a threshold of 9.1%, (sensitivity 100%, specificity 100%, area under the ROC curve (AUC) 1.00 (P <0.001 95% CI = 1.00 to 1.00)). The other indices had values of AUC not significantly different from 0.5. Conclusions The ΔSVI-PLR, measured with the LiDCO system, is a very reliable predictor of fluid responsiveness in a population of ICU patients in shock, including patients with spontaneous breathing activity and arrhythmias. Reference 1.
Figure 2 (abstract P63). Bland–Altman plot for comparison between PRAM-CI and thermodilution CI.
was 34 to 84 years (65 ± 13), the APACHE II score range was 13 to 38 (25 ± 6) and SAPS II score range was 22 to 81 (50 ± 16). The correlation coefficient between PRAM-CI and PiCCO-CI was 0.95 (95% CI = 0.89 to 0.99; P <0.001) (Figure 1). The Bland–Altman analysis showed a mean difference between the two methods (bias) of 0.67 ± 0.38 l/minute/ m2 with lower and upper 95% limits of confidence of –0.07 and 1.41 l/ minute/m2, respectively (Figure 2). The percentage of error was 22%. Conclusions This study showed a sufficient agreement between the two techniques. MostCare could be a useful first-level monitoring system, particularly in the first phase of critically ill patients’ care or when more invasive systems are not advisable. References 1. 2. 3.
Romano SM, et al.: Crit Care Med 2002, 30:1834-1841. Scolletta S, et al.: Br J Anaesth 2005, 95:159-165. Zangrillo A, et al.: Cardiothorac Vasc Anesth 2010, 24:265-269.
P64 Prediction of fluid responsiveness with the LiDCO system P De Santis, C Marano, F Cavallaro, A Dell’Anna, P De Santis, C Bonarrigo, C Falcone, C Sandroni Catholic University School of Medicine, Rome, Italy Critical Care 2011, 15(Suppl 1):P64 (doi: 10.1186/cc9484) Introduction Variation in stroke volume (SV) or related parameters induced by passive leg raising (PLR) measured by several noninvasive methods has been demonstrated to reliably predict fluid responsiveness [1]. The aim of this study was to assess whether variation in SV measured by LiDCO can predict fluid responsiveness in shock states. Methods ICU patients with signs of shock were enrolled. History, clinical information and echocardiogram were obtained. After calibration, hemodynamic evaluation was performed by LiDCO in four subsequent steps: T1 in semi-recumbent position; T2 during PLR; T3 in baseline position; T4 after infusion of 500 ml NaCl 0.9% in 15 minutes. On each step, the heart rate (HR), mean arterial pressure (MAP), absolute and indexed cardiac output and stroke volume (CO/CI, SV/SVI) were measured by LiDCO and the aortic velocity time integral (VTI) by transthoracic echocardiography. Patients whose SVI increased at least 10% after volume load were classified as responders. The ability to predict responder state was assessed for four potential fluid responsiveness indices: variation in SVI, CO, CI and VTI induced by PLR (ΔSVI-PLR, ΔCO-PLR, ΔCI-PLR, ΔVTI-PLR) by means of three statistical methods: comparison (Mann–Whitney) between the mean value of index in responders and nonresponders, correlation (Spearman) between the baseline value of index and increase in SVI after fluids, and the receiver operator characteristic (ROC) curve. Results Fifteen determinations were collected in 13 patients in septic, cardiogenic and hypovolemic shock (males 9/13, age 73.2 ± 5.8, ejection fraction 54% ± 8). Ten patients had spontaneous breathing activity, five had arrhythmias, 11 were under inotropes. The responder rate was 46.7%. Among the studied indices, only ΔSVI-PLR was significantly
Cavallaro et al.: Intensive Care Med 2010, 36:1475-1483.
P65 Predictors of fluid responsiveness in patients with acute liver failure VK Audimoolam, M McPhail, W Bernal, C Willars, JA Wendon, G Auzinger King’s College Hospital, London, UK Critical Care 2011, 15(Suppl 1):P65 (doi: 10.1186/cc9485) Introduction Profound hemodynamic changes seen in acute liver failure (ALF) resemble those found in later stages of septic shock. Vasopressor support is frequently required and indiscriminate fluid resuscitation can worsen intracranial hypertension (ICH) and lung injury. Markers of preload dependency have thus far not been studied in this patient group and response to dynamic manoeuvres such as passive leg raising or end expiratory hold cannot be considered safe due to the high incidence of ICH. Methods ALF patients admitted to a tertiary specialist ICU in vasoplegic shock, requiring multiorgan support including controlled mechanical ventilation, had their cardiac output monitored via transpulmonary thermodilution and pulse contour analysis (PiCCO). Markers of fluid responsiveness were compared between responders (CI ≥15%) and nonresponders to a colloid fluid challenge (5 ml/kg IBW). All patients had a transthoracic echocardiogram performed before and after fluid administration. The predictive capacity of stroke volume, pulse pressure variation (SVV, PPV) and respiratory change in peak aortic velocity ΔV peak for preload dependency was analyzed. Results Twenty-six patients (mean age 40 (13), 15 male:11 female) were assessed, mean APACHE II 23 (4) and SOFA 15 (2). Changes in CI and SVI were closely correlated (R = 0.726, P <0.001). There was no difference between those defined as responders using a cut-off value of CI or SVI of 10%. When using 15%, seven patients would have been classified differently. The intraclass correlation coefficient for CI and SVI change was 0.83 (0.62 to 0.92), confirmed using Pasing and Blakock regression (A = –0.278, –0.88 to 0.16, B = 1.26, 0.88 to 1.72), suggesting hemodynamic changes in both measures are interchangeable. Using a cut-off value of a change in CI of 15%, only PPV predicted fluid responsiveness (AUROC 0.79, 0.58 to 0.93, P = 0.005, cut-off >9%, sensitivity 75%, specificity 62%). SVV weakly predicted fluid responsiveness in this cohort (AUROC 0.73, 0.52 to 0.87, P = 0.005, cut-off >11%). While there was a trend toward reduction in ΔV peak (mean difference –3%, P = 0.080) this was not different between those defined as fluid responders by CI (repeatedmeasures ANOVA P = 0.124) and ΔV peak prior to fluid bolus did not predict a CI response (AUROC 0.637, 0.413 to 0.825, P = 0.322). Conclusions Baseline PiCCO parameters predict fluid responsiveness but the respiratory variability in ΔV peak did not predict a CI response to fluid bolus in this cohort. PPV may be a more suitable PiCCO index for assessing fluid requirements in patients with ALF than SVV. P66 Functional haemodynamic monitoring: the relative merits of SVV, SPV and PPV as measured by the LiDCOrapid in predicting fluid responsiveness in high-risk surgical patients C Willars, A Dada, D Green Kings College Hospital, London, UK Critical Care 2011, 15(Suppl 1):P66 (doi: 10.1186/cc9486) Introduction Standard anaesthetic practice in the high-risk surgical patient is to insert invasive arterial and central venous catheters and then
Critical Care 2011, Volume 15 Suppl 1 http://ccforum.com/supplements/15/S1
to use ΔCVP and ΔMAP to guide fluid therapy, despite an accumulation of evidence to suggest that filling pressures are inadequate predictors of fluid status and responsiveness. Recent interest has been directed towards dynamic measures of cardiac filling such as SVV, SPV, PPV and Δdown and ΔVpeak. A number of large multicentre trials are underway using the LiDCOrapid. There is, however, little information about the utility of this device or, indeed, any other minimally-invasive cardiac output monitor in the prediction of fluid responsiveness. Methods The haemodynamic parameters of 70 high-risk patients (mean age 71 ± 11.3, median ASA 3) undergoing major vascular surgery (mean duration 4.2 ± 1.1 hours) were evaluated retrospectively using LiDCOviewPro. All patients underwent standard induction and maintenance of anaesthesia, with propofol/remifentanil TIVA and IPPV (tidal volume ≥7 ml/kg) via a supraglottic airway. Monitoring included BIS, NICO and LiDCOrapid. Fluids were administered according to clinical assessment of need and available haemodynamic parameters. Only fluid boluses given in the absence of HRV >10%, brisk ongoing blood loss and of volume ≥250 ml were included in the evaluation. Positive response to a fluid challenge was defined as ΔSVI ≥10%. Statistical analysis was performed using SPSS 17.0. Results Thirty-two out of 43 valid fluid challenges were positive (74.4%). The correlation coefficients between the baseline SVV, SPV and PPV with ΔSVI were 0.27 (P = 0.08), –0.01 and 0.18 (nonsignificant). The AUROCs were 0.75 (95% CI = 0.57 to 0.93), 0.587 (0.36 to 0.82) and 0.67 (0.48 to 0.86), respectively. The best cut-off value for SVV using Youden’s index was 13.5%, with J = 0.48. The positive likelihood ratio was 2.74 and the negative likelihood ratio 0.34, with diagnostic odds ratio 8.06 at this level. Conclusions It has been reported that only 50% of critically unwell patients respond to fluid challenge, compared with 74.4% in this intraoperative study of noncardiac surgical patients. The SVV was an adequate predictor of fluid responsiveness. The diagnostic threshold of 13.5% was consistent with previous studies. P67 Pressure recording analytical method for cardiac output monitoring in children with congenital heart disease Z Ricci Bambino Gesù Hospital, Rome, Italy Critical Care 2011, 15(Suppl 1):P67 (doi: 10.1186/cc9487) Introduction The Swan–Ganz catheter cannot be considered the gold standard in the pediatric setting for cardiac output (CO) monitoring, due to the unavailability of pulmonary artery catheters (PACs) of adequate size for children of all ages and weights and due to peculiar cardiovascular anatomies of some children with congenital heart disease (CHD). The pressure recording analytical method (PRAM) is designed for arterial pressure-derived continuous CO measurement and it does not need any starting calibration, central venous catheterization, or adjustments based on experimental data. The aim of this study was to validate PRAM in a cohort of children with CHD. Methods An observational study was conducted on 25 children with CHD who underwent diagnostic cardiac catheterization (seven corrected tetralogy of Fallot, three corrected complete atrioventricular canal, 10 corrected transposition of great arteries and five dilative cardiomyopathy), aiming to compare CO measurement by PRAM and by PAC. Enrollment criteria were: biventricular anatomy in the absence of intracardiac shunts, weight <20 kg, prescheduled need for Swan– Ganz measurement of CO and arterial cannulation. The Swan–Ganz CO value considered in our study was the average measure deriving from three thermodilution boluses. The corresponding PRAM CO value was the average measure of those picked simultaneously with the three thermodilution boluses. All patients were anesthetized (2% inhaled sevoflurane and intravenous remifentanil at 0.1 μg/kg/minute) and mechanically ventilated. Results The median patient age was 4 years (IQR 2.5 to 6) and median weight was 13 kg (IQR 9 to 17). A significant linear correlation between PRAM and Swan–Ganz measurements was found (P <0.0001). In particular, Bland–Altman analysis showed a bias of 0.2 l/minute (SD 0.47) and 95% limits of agreement from –0.7 to 0.9 l/minute: the performance of this method seemed optimally coupled with PAC
S24
measurements when CO ranged from 1 to 2 l/minute whereas for higher COs the difference between the two methods increased. However, only three measurements fell out of the limits of agreement and all were at CO levels over 2.5 l/minute (more rarely observed in pediatric patients with CHD). Age, weight, heart rate and cardiac diagnosis were not significantly correlated with PRAM to Swan–Ganz difference. Conclusions PRAM may be considered an accurate method in pediatric patients with CHD: these results should be validated in the pediatric ICU, also verifying PRAM’s impact on clinical decision-making. P68 Accuracy of stroke volume variation as a predictor of volume responsiveness in patients with raised intra-abdominal pressure WO Bauer1, M Cecconi2, A Rhodes2, W Bernal1, J Wendon1, G Auzinger1 1 King’s College Hospital, London, UK; 2St George’s Hospital, London, UK Critical Care 2011, 15(Suppl 1):P68 (doi: 10.1186/cc9488) Introduction Dynamic predictors of fluid responsiveness such as stroke volume variation (SVV) are gaining popularity. Intra-abdominal hypertension (IAH) affects heart–lung interactions and may invalidate SVV as a preload indicator, as indeed suggested in a recent animal study [1]. We studied SVV in liver patients, who have a high incidence of raised intra-abdominal pressure (IAP). Methods Patients admitted to a specialist liver ICU with acute or decompensated chronic liver disease were studied. All were in shock and received controlled mechanical ventilation. Cardiac output monitoring via transpulmonary thermodilution (PiCCO; Pulsion Medical Systems) and pulmonary artery catheterisation (CCombo; Edwards Lifesciences) was performed. Measurements before and after a 300 ml colloid bolus (Voluven; Fresenius Kabi) were recorded; fluid responsiveness was defined as an increase in stroke volume (SV) >10%. IAP was monitored via a Foley manometer and patients were divided into two groups: none/mild versus clinically significant IAH, cut-off value 15 mmHg. Volume responsiveness according to SVV and severity of IAH was analysed via receiver operating characteristic. Demographic parameters are displayed as the median and range. Results Twenty-three measurements were made in 18 patients (in five patients, two fluid boluses were given on separate days). Median age was 45 years (47), 11 were females. Diagnoses were acetaminophen-induced acute liver failure (ALF, n = 6), acute decompensation of alcoholic liver disease (n = 4), Budd–Chiari syndrome (n = 3), seronegative ALF (n = 2), post-transplant septic shock (n = 2) and leptospirosis (n = 1). The median SOFA score was 18 (12), norepinephrine dose 0.26 μg/kg/minute (1.25). Clinically significant IAH was present in 15 measurements (IAP 17 to 27). Ten fluid boluses resulted in an increase in SV >10%. As a whole SVV failed to predict fluid responsiveness (area under curve (AUC) 0.53, P = 0.82). The subgroup with IAP <15 showed a trend towards significance (AUC 0.91, P = 0.06). In the latter group a SVV of 13.5% had 75% sensitivity and specificity in predicting fluid responders. Conclusions SVV does not predict fluid responsiveness in patients with significant intra-abdominal hypertension. If IAP is mildly raised, higher cut-off levels for SVV may need to be considered. Reference 1.
Renner J, et al.: Crit Care Med 2009, 37:650-658.
P69 Perfusion index as a predictor for central hypovolemia in humans A Lima, M Van Genderen, E Klijn, S Bartels, J Van Bommel, J Bakker Erasmus MC University Medical Centre Rotterdam, the Netherlands Critical Care 2011, 15(Suppl 1):P69 (doi: 10.1186/cc9489) Introduction In low flow shock, almost 30% of the circulating volume may be lost before hypotension occurs. Thus, shock should be early recognized prior to the development of hypotension. An earlier sign to look for is vasoconstriction in peripheral tissues due to neurohumoral response to the low circulating volume. The perfusion index (PI) derived from the pulse oximetry signal permits a quantitative analysis of variations of peripheral circulation. However, its ability to detect peripheral vasoconstriction due to neurohumoral response in central
Critical Care 2011, Volume 15 Suppl 1 http://ccforum.com/supplements/15/S1
S25
Figure 1 (abstract P70). Correlation between CBFI and CI.
Figure 1 (abstract P69). Correlation between HR, SV and PI.
hypovolemia induced by lower body negative pressure (LBNP) has never been studied. Methods The PI was measured in 24 healthy volunteers during the LBNP test using the pulse oximetry Masimo SET Perfusion Index. The LBNP protocol consisted of 5-minute baseline measurements in the supine position followed by stepwise increases of negative pressure from 0 to –20, –40, –60, –80 and 0 mmHg. HR, BP, and cardiac output were recorded during all of the procedure using a Finometer Blood Pressure Monitor. Results Subjects were all male (age mean: 23 ± 6). Figure 1 shows that in all subjects the PI decreased significantly by 40% (P = 0.03) during the first –20 mmHg, and kept in this range during the whole experiment. SV decreased significantly by 20% at –40 mmHg. The HR increased significantly by 15% at –40 mmHg. SV and HR changes were proportional to the level of negative pressure in the chamber. No significant changes in BP and CO were observed. Conclusions PI is a sensitive indicator of acute hemodynamic responses to the LBNP-induced central hypovolemia. In addition, it could detect hypovolemia earlier than the 20% decrease in stroke volume. P70 Carotid blood flow is correlated with cardiac output but not with arterial blood pressure in porcine fecal peritonitis T Correa, A Reintam Blaser, J Takala, S Djafarzadeh, M Vuda, M Dünser, S Mathias Jakob University Hospital Bern – Inselspital and University of Bern, Switzerland Critical Care 2011, 15(Suppl 1):P70 (doi: 10.1186/cc9490)
Figure 2 (abstract P70). Correlation between CBFI and MAP.
and MAP correlated weakly and inversely (r = –0.246, P = 0.005; data not shown). Conclusions Under the experimental conditions, increasing systemic blood flow but not blood pressure has the potential to improve CBF. Reference 1.
Introduction Cerebral blood flow may be impaired in sepsis [1]. The objective of this study is to evaluate whether and how carotid blood flow (CBF) depends on cardiac output and mean arterial blood pressure in abdominal sepsis. Methods Thirty-two anesthetized pigs (weight: 40.3 ± 3.7 kg (mean ± SD)) were randomly assigned (n = 8 per group) to a nonseptic control group (CG) or one of three groups in which resuscitation was initiated 6, 12 or 24 hours after induction of fecal peritonitis (instillation of 2 g/kg autologous feces). In the treatment groups, resuscitation was performed for 48 hours according to the Surviving Sepsis Campaign. The CG was observed for 72 hours. CBF (carotid artery; ultrasound Doppler flow), cardiac output (intermittent thermodilution) and arterial blood pressure (MAP) were measured at 6-hour intervals. Pearson correlation were performed between CBF index (CBFI) and cardiac index (CI) and MAP, respectively, both in individual animals and in pooled septic and control groups. Results Altogether 227 measurements were obtained during sepsis and 128 in controls. In septic animals, CBFI and CI (r = 0.53, P <0.001; Figure 1) but not CBFI and MAP correlated (Figure 2). In controls, CBFI
Taccone FS: Cerebral microcirculation is impaired during sepsis: an experimental study. Crit Care 2010, 14:R140.
P71 Afterload-related cardiac performance: a hemodynamic parameter with prognostic relevance in patients with sepsis in the Emergency Department J Wilhelm, S Hettwer, M Schürmann, S Bagger, F Gerhardt, S Mundt, S Muschick, J Zimmermann, H Ebelt, K Werdan Martin-Luther-University, Halle (Saale), Germany Critical Care 2011, 15(Suppl 1):P71 (doi: 10.1186/cc9491) Introduction Afterload-related cardiac performance (ACP) was developed to describe cardiac function in patients with sepsis, when cardiac output (CO) is increased due to a decline in systemic vascular resistance (SVR). We now studied the prognostic relevance of ACP in comparison with the cardiac index (CI) and cardiac power index (CPI) in patients at a very early stage of community-acquired sepsis (CAS) in the Emergency Department.
Critical Care 2011, Volume 15 Suppl 1 http://ccforum.com/supplements/15/S1
S26
Figure 1 (abstract P71). (A) Frequency of impairment of cardiac function defined by ACP. (B) Time course of ACP patients with CAS.
Methods In patients ≥18 years admitted to our Emergency Department with CAS (infection and ≥2 SIRS criteria), CI, CPI, and ACP were measured either non-invasively (TaskForce-Monitor; CNSystems, Austria) or invasively. ACP was calculated as ACP = 100 x CO / (560.68 x SVR–0.64). Cardiac function was graded into normal (>80%), slightly (61 to 80%), moderately (41 to 60%) or severely impaired (≤40%). Results Of 137 patients studied, 48.2% had sepsis, 33.6% severe sepsis, and 18.2% septic shock. Overall 30-day mortality was 10.9%. On admission ACP was 86.7 ± 27.7% in severe sepsis and 85.5 ± 25.8% in septic shock, significantly lower than in patients with sepsis without signs of organ dysfunctions (98.6 ± 22.3%, P <0.01), whereas no differences were observed for CI or CPI, respectively. In severe sepsis or septic shock, impairment of ACP was observed more often than in sepsis (Figure 1A). Nonsurvivors showed a significantly depressed ACP already on admission and after 72 hours (Figure 1B), whereas CPI differed only after 72 hours between survivors and nonsurvivors (0.52 ± 0.18 vs. 0.32 ± 0.17, P <0.05) and CI showed no differences in this regard. ACP correlated better with APACHE II score (r = –0.371, P <0.001) than CPI (r = –0.330, P <0.001) or CI (r = –0.220, P <0.001). Only ACP correlated with serum levels of procalcitonin (r = 0.224, P <0.01) and IL-6 (r = –0.173, P <0.05). Conclusions Taken together, only the parameter ACP but not CI nor CPI is able to detect an early impairment of cardiac function in patients with CAS and provides prognostic information on admission.
fingers of the hand contralateral to the invasive arterial blood pressure catheter in the A. radialis. All measurements were digitally recorded with a sample frequency of 100 Hz, every pulse beat was automatically identified by an algorithm [2] and subsequently artefacts were removed from the datasets. The average recording time in each patient was 163 minutes (±37 minutes/patient). Results In total we analysed 500,000 beats. Overall we observed a bias in mean pressure of –7.49 mmHg with a standard deviation of 10.90 mmHg. The Bland–Altman plot (Figure 1) showed a uniform distribution of the variances over all measured blood pressure values and a good agreement of the mean blood pressure between CNAP and IBP. When analysing the data of each individual patient, larger differences were found. The bias ranged from 0.28 to 23.9 mmHg (median = –6.6 mmHg), with a standard deviation between 2.0 and 14.9 mmHg (median = 5.8 mmHg). Conclusions In our study we detected a good overall agreement between CNAP and IBP. The future perspective of this study is to investigate whether the continuous non-invasive blood pressure waveform is suitable for deriving further hemodynamic parameters of fluid responsiveness. References 1. 2.
Jeleazcov et al.: Br J Anaesth 2010, 105:264-272. Zong et al.: Comput Cardiol 2003, 30:259-262.
P72 Evaluation of a continuous non-invasive arterial blood pressure monitoring device in comparison with an arterial blood pressure measurement in the ICU K Smolle1, M Schmid2 1 University Hospital, Graz, Austria; 2Department of Internal Medicine, Graz, Austria Critical Care 2011, 15(Suppl 1):P72 (doi: 10.1186/cc9492) Introduction Due to a lower risk of complications, non-invasive monitoring methods gain importance. Measuring arterial blood pressure belongs to the standard hemodynamic monitoring. A newly developed continuous non-invasive arterial blood pressure (CNAP) measurement method is available and has been validated perioperatively [1].We compared the CNAP monitoring device with invasive arterial blood pressure measurement (IBP) as the gold standard in critically ill patients. Methods We performed a prospective study on 49 critically ill patients at a medical ICU. All patients were sedated and mechanically ventilated (BIPAP, tidal volume 7 to 8 ml/kg ideal body weight). Furthermore, all patients were under vasopressor therapy. CNAP was applied on two
Figure 1 (abstract P72). Comparison between IBP and CNAP in 46 patients (50 beats per patient).
Critical Care 2011, Volume 15 Suppl 1 http://ccforum.com/supplements/15/S1
P73 Brachial cuff measurements for fluid responsiveness prediction in the critically ill K Lakhal1, S Ehrmann2, D Benzekri-Lefèvre3, I Runge3, A Legras2, E Mercier2, PF Dequin2, M Wolff4, B Régnier4, T Boulain3 1 CHU, Montpellier, France; 2CHRU, Tours, France; 3CHR, Orléans, France; 4 Hopital Bichat-C.Bernard, Paris, France Critical Care 2011, 15(Suppl 1):P73 (doi: 10.1186/cc9493) Introduction The passive leg raising maneuver (PLR) with concomitant measurement of invasive arterial pressure (AP) or cardiac output (CO) changes are used to test volume responsiveness. The initial hemodynamic evaluation of shocked patients often relies on the sole non-invasive measurement of AP. We assessed the performance of PLRinduced changes in oscillometric measurements of systolic, mean and pulse AP (ΔplrSAP, ΔplrMAP and ΔplrPP). Methods CO and AP measurements were performed before/during PLR and then after 500 ml volume expansion. Results In 112 patients, the area under the ROC curve (AUC) of ΔplrSAP was 0.75 (0.66 to 0.83). When ΔplrSAP was >17%, the positive likelihood ratio (LHR) was 26 (18 to 38). Non-invasive ΔplrPP and non-invasive ΔplrMAP were associated with an AUC of 0.70 (0.61 to 0.79) and 0.69 (0.59 to 0.77), respectively. If PLR induced change in central venous pressure (CVP) it was ≥2 mmHg (n = 60), suggesting that PLR actually changed the cardiac preload, AUC of ΔplrSAP was 0.90 (0.80 to 0.97). In these patients, ΔplrSAP >9% was associated with a positive and negative LHR of 5.7 (4.6 to 6.8) and 0.07 (0.009 to 0.5), respectively. See Figure 1.
S27
Methods Included: adult ICU patients carrying an arterial catheter. Excluded: mean arterial pressure (MAP) increase >5 mmHg during cuff inflation (inflation-induced pain); nonperception of the distal pulse despite the resolution of an eventual circulatory failure. For each site (arm, calf, thigh (if Ramsay score >4)), three pairs of NIBP and invasive measurements were respectively averaged. Patients in circulatory failure (MAP <65 mmHg and/or skin mottling and/or cathecholamine infusion) underwent a second set of measurements, after hemodynamic intervention (volume expansion and/or initiation and/or increase in catecholamine dosage). The agreement was assessed via a Bland– Altman analysis. Results Ten patients were excluded and 11 NIBP measurements failed to display any figure: one patient for each site, eight others for the thigh only. Thus, 150 patients were analyzed (41 ± 26 years, BMI 26 ± 6, SAPS II 46 ± 18, Ramsay score = 5 or 6: 83%, mechanical ventilation 99%), comprising 79 patients with circulatory failure (MAP 70 ± 12 mmHg, norepinephrine (n = 62) 0.3 ± 0.3 μg/kg/minute, epinephrine (n = 2) 0.15 ± 0.14 μg/kg/minute). Absolute value of BP – for MAP measurement, NIBP performed better if the cuff was placed on the arm: bias/upper and lower limits of agreement (mmHg) of 3 ± 5/13/–6, 3 ± 8/18/–12 and 6 ± 7/20/–8 on the arm, the calf and the thigh, respectively. NIBP accuracy was similar in case of (mild) circulatory failure. Whatever the anatomic site, NIBP accuracy was better for MAP than for SAP or DAP. MAP changes – among the 57 patients with circulatory failure who underwent a second set of measurements after hemodynamic intervention, MAP changes (%) were better reflected when the cuff was placed on the arm, rather than on the calf or the thigh: 3 ± 5/12/–7, 3 ± 9/20/–14 and 3 ± 7/17/–10, respectively. Conclusions For better reliability of MAP (and its changes) measurements, the cuff should be placed on the arm (if possible) rather than the thigh or the calf. Reference 1.
Chatterjee A, et al.: Crit Care Med 2010, 38:2335-2338.
P75 Validation of non-invasive hemodynamic monitoring with Nexfin in critically ill patients K Van de Vijver, A Verstraeten, C Gillebert, U Maniewski, M Gabrovska, D Viskens, N Van Regenmortel, I De laet, K Schoonheydt, H Dits, M Malbrain ZNA Stuivenberg, Antwerp, Belgium Critical Care 2011, 15(Suppl 1):P75 (doi: 10.1186/cc9495)
Figure 1 (abstract P73).
Conclusions Regardless of CVP (blind PLR), ΔplrSAP >17% reliably identified responders. CVP-guided PLR allowed ΔplrSAP to perform better in the case of sufficient change in preload during PLR. P74 Are the calf and the thigh reliable alternatives to the arm for cuff non-invasive measurements of blood pressure? K Lakhal1, C Macq1, S Ehrmann2, T Boulain3, X Capdevila1 1 CHU, Montpellier, France; 2CHRU, Tours, France; 3CHR, Orléans, France Critical Care 2011, 15(Suppl 1):P74 (doi: 10.1186/cc9494) Introduction Non-invasive measurement of blood pressure (NIBP) is widely used in the critically ill, the cuff being often placed on the calf or the thigh in case of contraindication for placing it on the arm (wounds, fracture, vascular access, and so forth) [1]. However, this common practice has never been validated. We assessed the reliability of NIBP at these different anatomic sites.
Introduction Thermodilution (TD) is a gold standard for cardiac output (CO) measurement in critically ill patients [1]. Although transpulmonary thermodiluation is less invasive than the Swan–Ganz catheter, it still requires an arterial and deep venous line. This study will compare intermittent bolus transpulmonary TDCO with continuous CO (CCO) obtained by pulse contour analysis (PiCCO2; Pulsion Medical Systems) and non-invasive CO (NexCO) measurement via finger cuff using Finapres technology (Nexfin BMEYE). Methods A prospective study in 45 patients (43 mechanically ventilated, 32 male). Age 57.6 ± 19.4, BMI 25.3 ± 4.4, SAPS II 51.5 ± 16.9, APACHE II 25.3 ± 10.3 and SOFA score 9.4 ± 3.3. In an 8-hour period, simultaneous CCO and NexCO measurements were obtained every 2 hours while simultaneous TDCO and NexCO were obtained every 4 hours. The CCO and NexCO values were recorded within 5 minutes before TDCO was determined. Statistical analysis was performed using Pearson correlation and Bland–Altman analysis. Results In total, 585 CO values were obtained: 225 paired CCO–NexCO; 135 paired CCO–TDCO and 135 NexCO–TDCO. Thirty-five patients received norepinephrine at a dose of 0.2 ± 0.2 μg/kg/minute (range 0.02 to 1). TDCO values ranged from 2.4 to 14.9 l/minute (mean 6.6 ± 2.2), CCO ranged from 1.8 to 15.6 l/minute (6.4 ± 2.3) and NexCO from 0.8 to 14.9 l/minute (6.1 ± 2.3). The Pearson correlation coefficient comparing NexCO with TDCO and CCO was similar with an R2 of 0.68 and 0.71 respectively. Bland–Altman analysis comparing NexCO with TDCO revealed a mean bias ± 2SD (limits of agreement (LA)) of 0.4 ± 2.32 l/minute (with 36.1% error) while analysis of NexCO versus CCO showed a bias (± LA) of 0.2 ± 2.32 l/minute (37% error). TDCO was highly correlated with CCO (R2 = 0.95) with bias 0.2 ± 0.86 (% error 13.3).
Critical Care 2011, Volume 15 Suppl 1 http://ccforum.com/supplements/15/S1
The MAP values obtained ranged from 43 to 140 mmHg (83 ± 17) for PiCCO2 and from 44 to 131 (85 ± 17) for Nexfin. The MAP obtained with Nexfin correlated well with invasive MAP via PiCCO2 (R2 = 0.89) with a bias (± LA) of 2.3 ± 12.4 (% error 14.7). Conclusions These preliminary results indicate that in unstable critically ill patients CO and MAP can be reliably monitored non-invasively with Nexfin technology. Although TPTD remains a gold stand for the measurement of CO in ICU patients, Nexfin non-invasive monitoring may provide useful information in the emergency or operating room when an arterial or CVL is not available. Reference 1.
Malbrain M, et al.: Cost-effectiveness of minimally invasive hemodynamic monitoring. In Yearbook of Intensive Care and Emergency Medicine. Edited by Vincent J-L. Berlin: Springer-Verlag; 2005:603-631.
P76 Pleth Variability Index predicts fluid responsiveness in critically ill patients H Nanadoumgar, TL Loupec, DF Frasca, FP Petitpas, LL Laksiri, DB Baudouin, OM Mimoz CHU Poitiers, France Critical Care 2011, 15(Suppl 1):P76 (doi: 10.1186/cc9496) Introduction In patients with acute circulatory failure related to sepsis or hypovolemia, volume expansion is used as first-line therapy in an attempt to improve cardiac output. Dynamic indices based on cardiopulmonary interactions and variation in left ventricular stroke volume like respiratory variations in arterial pulse pressure (ΔPP) are able to predict response to fluid loading in mechanically ventilated patients. The Pleth Variability Index (PVI) (Masimo® Corp., Irvine, CA, USA) is a new non-invasive technique based on perfusion index (PI) variations during the respiratory cycle in mechanically ventilated patients. The objective of the study is to investigate whether PVI, a non-invasive and continuous tool, can predict fluid responsiveness in mechanically ventilated patients with circulatory insufficiency. Methods A prospective study in a surgical ICU of a university hospital. Forty mechanically ventilated patients with circulatory insufficiency were included in whom volume expansion was planned by the attending physician. Exclusion criteria included spontaneous respiratory activity; cardiac arrhythmia; known intracardiac shunt; severe hypoxemia (PaO2/ FIO2 <100 mmHg); contraindication for passive leg raising (PLR); altered left ventricular ejection fraction; hemodynamic instability during the procedure. We performed fluid challenge with 500 ml of 130/0.4 hydroxyethylstarch if ΔPP ≥13% or with PLR otherwise. PVI, ΔPP and cardiac output (CO) estimated by echocardiography were recorded before and after fluid challenge. Fluid responsiveness was defined as an increase in CO ≥15%. Results Twenty-one patients were responders and 19 were nonresponders. Median (interquartile range) PVI (26% (20 to 34%) vs. 10% (9 to 14%)) and ΔPP (20% (15 to 29%) vs. 5% (3 to 7%)) values at baseline were significantly higher in responders than in nonresponders. A PVI threshold value of 17% allowed discrimination between responders and nonresponders with a sensitivity of 95% (95% CI = 74 to 100%) and a specificity of 91% (95% CI = 70 to 99%). PVI at baseline correlated (r = 0.72; P <0.0001) with percentage changes in CO (ΔCO) induced by fluid challenge, suggesting the higher PVI at baseline, the higher ΔCO after volume expansion. Conclusions PVI can predict fluid responsiveness non-invasively in ICU patients under mechanical ventilation. P77 Dynamics of peripheral perfusion parameters in elective coronary artery bypass graft patients M Van Genderen, J Boszhuizen, A Pinto Lima, D Gommers, J Bakker, J Van Bommel Erasmus MC, Rotterdam, the Netherlands Critical Care 2011, 15(Suppl 1):P77 (doi: 10.1186/cc9497) Introduction Recent studies have suggested that microvascular perfusion impairment may play a role in the development of
S28
postoperative organ dysfunction in patients undergoing high-risk or cardiac surgery [1,2]. Postoperative monitoring of tissue perfusion parameters could therefore be used for early detection of tissue hypoperfusion and serve as an endpoint for resuscitation. For this purpose we measured regional and microvascular perfusion parameters in relation to systemic hemodynamics in patients undergoing open heart surgery. Methods We observed 10 consecutive patients who underwent elective coronary artery bypass grafting with cardiopulmonary bypass during the immediate postoperative resuscitation in the ICU. Tissue perfusion was measured directly after admission and repeated before detubation, and consisted of sublingual SDF imaging, forearm Tskindiff, finger peripheral perfusion index, finger capillary refill time (CRT) and thenar tissue oxygenation (StO2). Cardiac output was measured with NICOM bioreactance. Results CO (4.33 ± 1.63 vs. 5.37 ± 1.29) (P <0.05) and central temperature (35.30 ± 0.24 vs. 36.56 ± 0.13) (P <0.01) increased significantly. All tissue perfusion parameters (that is, SDF parameters (MFI ≥2.5; PPV ≥95%), StO2 ≥80%, CRT ≥5 seconds, Tskin-diff ≤3 and PFI ≥1.4) were within the normal range at admission and did not change significantly until detubation. Even the central-to-toe temperature difference showed no significant difference or correlation between cardiac output and any other peripheral tissue perfusion parameter. The postoperative course was uncomplicated in all patients. Conclusions In the postoperative period, peripheral and microvascular tissue perfusion parameters are not impaired in our CABG patients. Although from a small population, these data suggest that these parameters are not suitable for routine use as an extra hemodynamic resuscitation endpoint. This is in contrast with previous studies and might be explained by differences in study population or measurement interval. References 1.
2.
De Backer D, Dubois MJ, Schmartz D, et al.: Microcirculatory alterations in cardiac surgery: effects of cardiopulmonary bypass and anesthesia. Ann Thorac Surg 2009, 88:1396-1403. Jhanji S, Lee C, Watson D, et al.: Microvascular flow and tissue oxygenation after major abdominal surgery: association with postoperative complications. Intensive Care Med 2009, 35:671-677.
P78 Maintenance of arterial catheters with heparin: should we continue? N Catorze, S Teixeira, J Cabrita, J Carreto, V Vieira, S Gonçalves, A Frade, J Martins Centro Hospitalar Médio Tejo, Abrantes, Portugal Critical Care 2011, 15(Suppl 1):P78 (doi: 10.1186/cc9498) Introduction In ICU settings arterial catheters (AC) are used to manage critically ill patients. Maintaining the patency of these catheters is important for continuous hemodynamic evaluation and therapeutic adjustment. Heparinized solutions are used for this purpose although the increasing literature describes the use of saline solutions for the same reason. The authors compare the use of heparinized versus saline solution in the maintenance of ACs and to detect changes in aPTT, platelet count, and local inflammatory signs, in a double-blind randomized trial. Methods During 80 days all ICU patients with ACs were randomized to receive heparinized solution (5 IU/ml) or saline solution. AC patency and functionality was compared in both every 6 hours, and aPTT, platelet count and local inflammatory signs each 24 hours. Patients with thrombocytopenia, receiving anticoagulant or fibrinolytic treatment were excluded. Results Two hundred days of ACs were observed in 49 patients, during which 110 days were with saline solutions and the rest were heparinized. Seven patients were excluded. The median duration of catheters in place was 4.4 days in the saline group and 3.8 days in the heparinized group. We recorded two ACs with local inflammatory signs in the heparinized group that were replaced in a septic context. One local hemorrhage and one AC obstruction were observed in the heparinized group versus no hemorrhage and three AC obstructions in the saline group. No other differences were obtained.
Critical Care 2011, Volume 15 Suppl 1 http://ccforum.com/supplements/15/S1
Conclusions The generalized use of heparin solution for AC maintenance does not seem to be adequate. In this study the comparison of the two populations revealed the same results despite the solution used. These results do not encourage the use of heparinized solutions because they do not have an effective cost/benefit relation and due to the potential iatrogenic problems described in the literature. References 1 2.
[www.anesthesia-analgesia.org/content/100/4/1117.full.pdf] Del Cotillo M, et al.: Heparinized solution vs. saline solution in the maintenance of arterial catheters: a double blind randomized clinical trial. Intensive Care Med 2008, 35:339-343.
S29
Methods CO2 was continuously monitored and recorded every 4 hours in 43 patients who were intubated and on vasopressor medications. Results Mean CO2 values were significantly higher in normal patients when compared with those in patients who had a cardiac arrest (30.18 ± 4.93 vs. 17.45 ± 4.76; P <0.001). CO2 levels were significantly lower in cardiac arrest patients when compared with hypotensive patients 1, 2, 3, and 4 hours prior to a cardiac arrest (see Table 1). CO2 levels were significantly lower in cardiac arrest patients when compared with patients who were acutely withdrawn from care 1, 2, 3, and 4 hours prior to the event (see Table 2). Table 1 (abstract P80). End-tidal CO2 5 hours prior to cardiac arrest compared with hypotension
P79 Validation of continuous intragastric pressure measurement and correlation with intramucosal pH in a pig model M Malbrain1, I De laet1, L Luis2, L Correa3, M Garcia3, G Castellanos4 1 ZNA Stuivenberg, Antwerp, Belgium; 2Neuron NPh, SA, Granada, Spain; 3 Jesús Usón Minimally Invasive Surgery Center, Cacères, Spain; 4’Virgen de la Arrixaca’ University Hospital, Murcia, Spain Critical Care 2011, 15(Suppl 1):P79 (doi: 10.1186/cc9499) Introduction The aim of this study was the validation of continuous intragastric pressure (IGP) measurement and correlation with intramucosal pH (pHi) in a pig model of intra-abdominal hypertension (IAH). Methods In 51 pigs, 611 paired IAP measurements were performed. IAP was measured at end-expiration using two different methods: the gold standard via an indwelling bladder catheter (IVP), and via a balloontipped nasogastric tube (IGP). During the same period 86 simultaneous pHi and IGP measurements were performed in 40 pigs. The abdominal perfusion pressure (APP) was defined as mean arterial pressure (MAP) minus IAP. Statistical analysis was done via Pearson correlation and Bland–Altman analysis; values are mean ± SD unless stated otherwise. Results Mean IGP was 22.3 ± 12.7 mmHg (range 0 to 43.1), and IVP was 22.9 ± 12.6 (0 to 48). There was a very good correlation between IGP and IVP. For the whole set of paired measurements (n = 611), IVP = 1.02 x IGP (R2 = 0.96, P <0.0001); and for the means per individual pig (n = 51), IVP = 1.03 x IGP (R2 = 0.96, P <0.0001). The analysis according to Bland– Altman for the whole set (n = 611) showed a mean IAP of 22.6 ± 12.6 (0.1 to 44) with a bias (±1.96 x SD) of 0.6 ± 2.4 mmHg; the limits of agreement (LA) were –4.2 to 5.5 mmHg (% error of 21.5). Looking at the mean values in each individual animal mean IAP was 22 ± 9.4 (2.5 to 37.9), with a bias of 0.8 ± 1.9 (LA –3 to 4.6) and a % error of 17.2. These intervals are small and reflect a good agreement between the two IAP methods. The mean pHi was 7.02 ± 0.28 (6.34 to 7.37) and correlated well with IGP (R2 = 0.7, P <0.001). Analysis further showed that changes in IGP correlated well with changes in pHi (R2 = 0.66, P <0.001). The MAP was 48.3 ± 14 (3 to 138) and APP was 24.9 ± 17.4 (0.2 to 92). During 388 paired measurements APP correlated significantly with pHi (in a logarithmic fashion, R2 = 0.18), the correlation was linear and even better in conditions when APP <45 mmHg (n = 334): pHi = 0.016 x APP + 6.63 (R2 = 0.55, P <0.0001). Thus increased APP above 45mmHg did not result in a further increase of pHi. Conclusions We found a very good correlation between IGP and IVP. Measurement via the stomach has major advantages over the standard intravesical method: continuous measurement of IAP as a trend over time is possible and there is no interference with estimation of urine output. Moreover, APP is correlated with pHi while IAP and pHi are inversely correlated. P80 End-tidal carbon dioxide levels predict cardiac arrest H Manyam, P Thiagarajah, G Patel, R French, M Balaan Allegheny General Hospital, Pittsburgh, PA, USA Critical Care 2011, 15(Suppl 1):P80 (doi: 10.1186/cc9500) Introduction End-tidal carbon dioxide (CO2) correlates with cardiac output during cardiopulmonary resuscitation (CPR) in cardiac arrest patients. Increasing CO2 during CPR can also indicate the return of spontaneous circulation.
Hour prior
Arrest
Hypotension
P value
1
16.50
20.67
0.013
2
16.25
21.83
0.013
3
16.50
22.67
0.002
4
16.75
21.33
0.024
5
21.25
21.33
0.99
Table 2 (abstract P80). End-tidal CO2 5 hours prior to cardiac arrest versus acute withdrawal of care Hour prior
Arrest
Acute withdrawal of care
P value
1
16.50
23.29
0.016
2
16.25
24.43
0.001
3
16.50
25.29
<0.001
4
16.75
26
<0.001
5
21.25
24.86
0.43
Conclusions CO2 levels decrease prior to cardiac arrest and are significantly lower than prior to hypotensive or acute withdrawal of care events. Further study needs to be done on a larger scale to see whether these results hold true. P81 NT-proBNP and troponin I in acute liver failure: do they predict cardiac dysfunction? M Mcphail1, VK Audimoolam2, W Bernal2, C Willars2, R Sherwood2, J Wendon2, G Auzinger2 1 Imperial College, London, UK; 2King’s College Hospital, London, UK Critical Care 2011, 15(Suppl 1):P81 (doi: 10.1186/cc9501) Introduction Distributive shock with high output cardiac failure is frequently seen in acute liver failure (ALF). A previous study suggested a high incidence of myocardial injury coupled with adverse outcome in this population [1]. Correlation of cardiac biomarkers with invasive hemodynamic parameters or results of echocardiographic studies has thus far not been performed. Methods NT-proBNP (NTpBNP) and troponin I (TI) were measured in ALF patients with shock within 48 hours after admission to a tertiary specialist ICU. Transpulmonary thermodilution cardiac output monitoring (PiCCO) was performed in all patients. Values of cardiac index (CI), stroke volume index (SVI), global end diastolic index (GEDI) and markers of contractility – global ejection fraction (GEF) and cardiac function index (CFI) – as well as severity of illness scores were correlated with cardiac biomarker levels. Correlation was assessed using Pearson’s coefficient for normally distributed data. Results Twenty-six ALF patients with a mean (SD) APACHE II score of 23 (4) and SOFA 15 (2) were assessed. NTpBNP (median 715 (46 to 10, 484) pg/ml) and TI (median 0.28 (0 to 50) u/l) levels were both significantly elevated without any significant ECHO abnormalities and 24 patients required renal replacement therapy. Serum NTpBNP correlated with serum lactate (correlation coefficient 0.61, P = 0.001) and TI (0.63,
Critical Care 2011, Volume 15 Suppl 1 http://ccforum.com/supplements/15/S1
P = 0.001) but not with PiCCO parameters related to flow, contractility or preload (SVI –0.28, P = 0.161, CI –0.08, 0.695, GEF –0.26, 0.200, GEDI –0.32, 0.12) and neither cardiac marker correlated with APACHE II score. There was a trend toward correlation of TI with CFI (0.367, P = 0.084) but not with CI (0.021, 0.92). CFI was correlated with GEF (0.55, P = 0.001) and lactate (0.53, P = 0.003). APACHE and SOFA did not correlate significantly with PiCCO indices. Conclusions Levels of cardiac biomarkers are frequently elevated in ALF. We could not find any correlation of TI and NTpBNP with surrogate markers of cardiac function on invasive hemodynamic monitoring, or indeed significant abnormalities on ECHO. Reference 1.
Parekh NK, et al.: ALF Study Group: Elevated TI levels in ALF: is myocardial injury an integral part of ALF? Hepatology 2007, 45:1489-1495.
P82 Endothelial glycocalyx disruption after cardiac surgery in infants V Sheward, S Tibby, H Bangalore, A Durward, I Murdoch Evelina Children’s Hospital, London, UK Critical Care 2011, 15(Suppl 1):P82 (doi: 10.1186/cc9502) Introduction The endothelial glycocalyx (EGX) modulates vascular permeability and inflammation. It is disrupted by ischaemia– reperfusion. We hypothesised that cardiopulmonary bypass would elevate markers of EGX shedding, which would be associated with increased postoperative inflammation. Methods A prospective cohort of 25 infants (median weight 5 kg) undergoing surgery for congenital heart disease. Blood temporal profiles of two markers of EGX disruption – heparan sulphate (HEP) and syndecan-1 (SYND) – were correlated with a biochemical marker of systemic inflammation (IL-6) and clinical outcome variables. Results Infants showed a dramatic rise in SYND, which peaked at the end of bypass, returning to baseline at 48 hours (Figure 1). The median (IQR) peak SYND levels were 144 ng/ml (113 to 190), representing a sixfold rise from baseline. A less pronounced rise was seen for HEP (median 22.5 μg/ml), which approximately doubled. Peak IL-6 occurred at 12 hours post bypass: median 118 pg/ml (44 to 217). Absolute peak values of both SYND and HEP correlated poorly with IL-6 and all clinical variables. Conversely, peak IL-6 correlated with bypass time (r = 0.53), length of ventilation (r = 0.69) and ICU stay (r = 0.58). Conclusions Although markers of EGX disruption show a reproducible temporal profile after bypass, the lack of correlation with IL-6 and clinical markers means that their significance is unclear.
S30
P83 Microcirculatory changes during hyperoxia in a porcine model of ruptured abdominal aneurysm I Cundrle Jr1, V Sramek1, P Suk1, J Hruda1, J Krbusik1, M Helan1, M Vlasin2, M Matejovic3, M Pavlik1 1 St Anns University Hospital Brno, Czech Republic; 2University of Veterinary and Pharmaceutical Sciences, Brno, Czech Republic; 3University Hospital Plzen, Czech Republic Critical Care 2011, 15(Suppl 1):P83 (doi: 10.1186/cc9503) Introduction Our goal was to evaluate the effect of hyperoxia on sublingual and ileostomal microcirculation during hemorrhagic and reperfusion shock in a porcine model simulating the rupture of an abdominal aortic aneurysm (AAA). We wanted to test the effect of hyperoxia on these two vascular beds because hyperoxia is known to cause different arteriolar responses [1]. Methods Pigs were randomized into four groups: HEM n = 11, HEMHYPEROX n = 11, SHAM n = 6, SHAM-HYPEROX n = 5. Hyperoxia (FiO2 1.0) started 1 hour after hemorrhagic shock and was maintained until the end of the experiment. Microcirculation was recorded with SDF imaging (MicroScan Video Microscope) in eight time points during the whole experiment (T0 before bleeding, T1 to T4 every hour of the 4 hours bleeding, T5 2 hours after the volume was reinfusioned and aorta clamped, T6 after 2 hours of declamping, and T7 after 11 hours of intensive care). In every time point, recordings were sampled three times at 20-second intervals sublingually and from ileostoma. Videodocumentation was elaborated with software AVA 3.0 by single blinded investigator. The following vessel density parameters (TVD, PVD, De Backer score), perfusion parameters (PPV, MFI) and heterogeneity index for MFI and TVD were monitored. Nonparametric statistic methods were used for the evaluation (Statistica 9 CZ). The Mann–Whitney U test was used for comparison of sublingual and ileostomal microcirculations. Results Sublingually there was a significant increase in density parameters TVD and PVD and a decline in TVD heterogeneity index in T5 (end clamping) in the hyperoxia group (P <0.05). In ileostoma there was a significant decline in density parameters TVD in T3 (3 hours bleeding) and De Backer score in T3 and T4 (end bleeding) and in perfusion parameter MFI in T4 in the hyperoxia group (P <0.05). The rest of the parameters remained unchanged. There were no statistically significant changes when comparing sham and sham-hyperoxia groups both sublingually and in ileostoma. Conclusions In this model of ruptured AAA it seems that hyperoxia might compromise microcirculation during bleeding and improved it during resuscitation. Acknowledgements Supported by NS 10109-4 and VZ MSM 0021620819. Reference 1.
Bertuglia S, et al.: Am J Physiol Heart Circ Physiol 1991, 260:362-372.
P84 Impact of synthetic colloids on organ function in patients with severe sepsis O Bayer, M Kohl, B Kabisch, N Riedemann, Y Sakr, C Hartog, K Reinhart Friedrich-Schiller-University, Jena, Germany Critical Care 2011, 15(Suppl 1):P84 (doi: 10.1186/cc9504)
Figure 1 (abstract P82). Syndecan-1 profile.
Introduction Previous studies showed an increased risk for developing acute kidney injury in septic patients receiving synthetic colloids [1]. However, little is known about effects of synthetic colloids on other organs. Ginz and colleagues found altered organ morphology and considerable colloidal storage in parenchymal and reticuloendothelial cells of the liver, lung and kidney in a septic patient after synthetic colloid administration [2]. For this reason we analyzed the effects of HES and gelatin on kidney, liver and lung function in comparison with crystalloids in septic patients. Methods A prospective controlled before-and-after study in 1,046 patients with severe sepsis. Acute kidney injury (AKI) was defined by RIFLE criteria and/or by new occurrence of renal replacement therapy (RRT). Liver function was determined by aspartate aminotransferase (AST), alanine aminotransferase (ALT), bilirubin blood levels during
Critical Care 2011, Volume 15 Suppl 1 http://ccforum.com/supplements/15/S1
the first 14 days, lung function by PaO2/FiO2 ratio and ventilation time. Between 2004 and 2006, standard colloid was HES (mainly 6% HES 130/0.4 (87%) and 10% HES 200/0.5). Between 2006 and 2008, standard colloid was changed to 4% gelatin (Gel). From 2008 until April 2010, patients received only crystalloids (Crys). Results Groups were comparable at baseline concerning SAPS II and SOFA scores, age and renal function. Patients who received synthetic colloids more often met the criteria for AKI (Crys 58.4%, HES 70.6% P = 0.001, Gel 67.6% P = 0.012) or required RRT (Crys 27.8%, HES 34.2% P = 0.072, Gel 35.5% P = 0.031) than patients receiving only crystalloids. On day 3, liver enzymes peaked in both colloid groups but not in the crystalloid group (AST (μmol/l), median (IQR): HES 2.2 (0.9 to 6.3) P = 0.001, Gel 1.7 (0.7 to 3.7) P = 0.158, Crys 1.0 (0.6 to 3.2); ALT: HES 1.1 (0.5 to 3.1) P = 0.003, Gel 0.9 (0.4 to 2.1) P = 0.109, Crys 0.6 (0.3 to 1.9). Bilirubin levels remained significantly elevated from day 0 to 14 in the HES and Gel groups. Median ventilation time (hours) was significantly longer in the HES and Gel groups: HES 214 (60 to 368) P <0.001, Gel 146 (48 to 333) P = 0.002, Crys 105 (15 to 280). The PaO2/FiO2 ratio and ICU or hospital mortality did not show significant differences. Conclusions HES and gelatin may be associated with an increased risk of renal failure, impaired liver function and longer ventilation time in septic patients. References 1. 2.
Brunkhorst et al.: N Engl J Med 2008, 358:125-139. Ginz et al.: Anaesthesist 1998, 47:330-334.
P85 Intraoperative effectiveness of crystalloid and colloid volume substitution in patients undergoing elective major urological surgery by maintenance of the cardiac index within normal range P Szturz, R Kula, J Maca, J Tichy, J Jahoda Faculty Hospital Ostrava, Ostrava, Czech Republic Critical Care 2011, 15(Suppl 1):P85 (doi: 10.1186/cc9505) Introduction We compared intraoperative volume effectiveness of crystalloid and colloid substitution aimed to maintain the cardiac index (CI) within the normal range measured by transesophageal Doppler ultrasonography (TED) [1]. We also evaluated the frequency of postoperative complications, length of in-hospital stay and postoperative in-hospital mortality. Methods One hundred and fifteen urological patients were enrolled into the prospective observational clinical study and then randomized into two groups. The first group was treated by volumotherapy based on crystalloids (Cry) n = 57, and the second group with colloids (Col) n = 58. High-risk surgery criteria were fulfilled in 47% patients in the Cry group and 45% in the Col group. Each patient obtained an esophageal Doppler probe (Hemosonic™100®; Arrow International, USA) after induction to general anesthesia and then hemodynamic optimalization (fluid therapy with Ringer’s solution or HES 6% 130/0.4 and administration of vasoactive drugs) was started according to TED variables to keep the CI between 2.6 and 3.8 l/min/m2. The supplementation of immeasurable fluid losses in the Col group was provided by infusion of Ringer’s solution 0.05 ml/kg/minute. Results We observed high initial incidence of CI <2.6 l/min/m2 after induction of general anesthesia (75%) in both groups. There were no significant differences in demographic characteristics, ASA classification, length of surgical procedure, estimated blood loss and CI during surgery. To maintain the CI we used significantly different amounts of crystalloids compared with colloids: means 5,182 ml versus 1,692 ml, respectively. The number of administered blood units was also higher in the Cry group versus the Col group: RBC 52 versus 19, P = 0.018, FFP 55 versus 16, P = 0.006, respectively. There was more GIT dysfunction in group Cry 31.6% versus 15.5% in the Col group, P = 0.05. The number of complications during 28 days on the ICU, overall inhospital stay and mortality were not statistically significant. Conclusions Crystalloids and colloids are effective in correction of intraoperative flow-related perfusion abnormalities. Different amounts of used crystalloids and colloids proved their unequal pharmacological characteristics (that is, distribution between compartments). The high amount of used transfusion units and postoperative incidence of GIT
S31
dysfunction in the Cry group suggests possibly more adverse effects of crystalloids in the perioperative period. Reference 1.
Bundgaard-Nielsen M, et al.: Br J Anaesth 2007, 98:38-44.
P86 Dilution with three different solutions: plasmatic effects and quantity and quality of urinary output T Langer1, E Carlesso1, A Protti1, M Monti1, L Zani1, G Iapichino1, B Comini1, D Andreis1, C Sparacino1, D Dondossola2, L Gattinoni1 1 Università degli Studi di Milano, Milan, Italy; 2Centro Ricerche Chirurgiche Precliniche, Università degli Studi, Milan, Italy Critical Care 2011, 15(Suppl 1):P86 (doi: 10.1186/cc9506) Introduction Crystalloids have different electrolyte composition and therefore different strong ion differences (SIDinf ). The aim of the study was to investigate the response of the kidney to plasmatic acid– base changes induced by dilution with three crystalloid solutions at different SID. Methods Six pigs (22 ± 4 kg) were anesthetized and mechanically ventilated. The respiratory rate was adjusted to maintain pCO2 constant. A urinary catheter was placed and connected to a urinary analyzer (Orvim, Paderno Dugnano, Italy) [1]. Pigs were randomly assigned to a sequence of dilutions (10% of body weight in 2 hours, followed by 4 hours of washout period) with the following three fluids: normal saline (NS), SID = 0, [Na] = 154, [Cl] = 154; lactated Ringer’s (LR), SID = 29, [Na] = 132, [Cl] = 112; and polysaline RIII (RIII), SID = 55, [Na] = 140, [Cl] = 103. Blood gases and electrolytes as well as urinary pH (pHu), urinary electrolytes and urinary output (UO) were recorded at baseline and at the end of each dilution. Plasmatic SID was defined as [Na] + [K] + 2[Ca] – [Cl] – [Lac]. Variations (d) were defined as baseline – 2-hour value. Results Plasmatic changes are consistent with previous in vitro studies [2]. dSID was mainly due to d[Cl]: 9.0 ± 1.7 for NS, no change for LR, –1.5 ± 1.6 for RIII. Of note, while no difference was yet observed for urinary electrolytes and UO, pHu significantly differed between the three solutions. See Table 1. Table 1 (abstract P86) NS
LR
RIII
dpHa
–0.08 ± 0.02
–0.00 ± 0.03*
0.04 ± 0.03*#
dSID (mEq/l)
–4.56 ± 1.36
0.21 ± 1.41*
3.56 ± 1.95*#
dpHu
–0.16 ± 0.47
0.23 ± 0.44
1.00 ± 0.75*#
639 ± 235
768 ± 172
896 ± 293
UO (ml)
Data presented as mean ± standard deviation. *P <0.05 vs. NS. #P <0.05 vs. LR. One-way ANOVA RM.
Conclusions The quality of infused fluids affects greatly the acid–base and electrolyte equilibrium of plasma. This in turn alters the quality of urine (pHu). References 1. 2.
Caironi P: Minerva Anestesiol 2010, 76:316-324. Carlesso E: Intensive Care Med 2010. [Epub ahead of print]
P87 Efficacy and safety of 10% HES 130/0.4 versus 10% HES 200/0.5 for plasma volume expansion in cardiac surgery patients C Ertmer1, H Van Aken1, H Wulf2, P Friederich3, C Mahl4, F Bepperling4, M Westphal4, W Gogarten1 1 University Hospital, Münster, Germany; 2Phillips-University of Marburg, Germany; 3University Hospital of Hamburg–Eppendorf, Hamburg, Germany; 4 Fresenius Kabi, Bad Homburg, Germany Critical Care 2011, 15(Suppl 1):P87 (doi: 10.1186/cc9507) Introduction Hydroxyethyl starch (HES) solutions are commonly used for perioperative volume replacement. Whereas older HES specimens
Critical Care 2011, Volume 15 Suppl 1 http://ccforum.com/supplements/15/S1
S32
tended to accumulate in the plasma and to cause negative effects on haemostasis, more recent products (for example, HES 130/0.4) are characterised by improved pharmacological properties. The present study was designed to compare the efficacy and safety of 10% HES 130/0.4 and 10% HES 200/0.5. Methods In this post-hoc analysis of a prospective, randomised, double-blind, multicenter therapeutic equivalence trial, 76 patients undergoing elective on-pump cardiac surgery received perioperative volume replacement using either 10% HES 130/0.4 (n = 37) or 10% HES 200/0.5 (n = 39) up to a maximum dose of 20 ml/kg. Results Equivalent volumes of investigational medications were infused until 24 hours after the first administration (1,577 vs. 1,540 ml; treatment difference 37 [–150; 223] ml; P <0.0001 for equivalence). Whereas standard laboratory tests of coagulation were comparable between groups, von Willebrand factor activity on the first postoperative morning tended to be higher following treatment with 10% HES 130/0.4 as compared with 10% HES 200/0.5 (P = 0.025), with this difference being statistically significant in the per-protocol analysis (P = 0.02). Treatment groups were comparable concerning other safety parameters and the incidence of adverse drug reactions. In particular, renal function was well preserved in both groups. Conclusions 10% HES 130/0.4 was equally effective and safe as compared with 10% HES 200/0.5 for volume therapy in patients undergoing cardiovascular surgery. Postoperative coagulation and renal function, as measured by standard laboratory tests, were similar among groups. P88 Nicorandil versus nitroglycerin: a pilot study V Singh1, S Momin2, B Shah3 1 Addenbrooke’s NHS Foundation Trust, Cambridge, UK; 2West Suffolk Hospital NHS Trust, Bury St Edmunds, UK; 3NHL Medical college, Ahmedabad, India Critical Care 2011, 15(Suppl 1):P88 (doi: 10.1186/cc9508) Introduction Continuous exposure to nitrates is associated with tachyphylaxis. This study compares the effects and tolerance during intravenous treatment with nitroglycerin and nicorandil over a 48-hour period. Methods Twenty patients with congestive heart failure and pulmonary capillary wedge pressure (PCWP) ≥18 mmHg were randomly assigned to nitroglycerin or nicorandil intravenous infusions. Doses were titrated to obtain a reduction of PCWP of at least 30% at 6 hours and then maintained for 48 hours. Results There was no statistical difference between the groups in terms of age, sex, and NYHA grade. The pretreatment PCWP for nitroglycerin was 25.7 mmHg, decreasing to 18.4 mmHg at 6 hours. The values for nicorandil were 25.4 mmHg and 17.3 mmHg, respectively. There was no statistical difference between the two groups (P = 0.79 pretreatment and 0.23 at 6 hours). The mean PCWP values for 24 hours were 19.7 and 17.4, respectively, which was statistically significant (P = 0.036). Similarly, the values for 48 hours were 20.6 and 17.9, which was significant (P = 0.026) (see Table 1).
Reference 1.
Tsutamoto T, Kinoshita M, Nakae I, et al.: Absence of hemodynamic tolerance to nicorandil in patients with severe congestive heart failure. Am Heart J 1994, 127(4 Pt 1):866-873.
P89 Dopamine versus norepinephrine in septic shock: a meta-analysis S Shenoy1, A Ganesh1, A Rishi1, V Doshi1, S Lankala1, J Molnar1, S Kogilwaimath2 1 Rosalind Franklin University of Medicine and Science, North Chicago, IL, USA; 2 Memorial University of Newfoundland, St John’s, Canada Critical Care 2011, 15(Suppl 1):P89 (doi: 10.1186/cc9509) Introduction The aim of this meta-analysis is to compare the changes in hemodynamic parameters among patients with septic shock who have received either of the two agents in their management and try to deduce the superiority of one over the other. Methods A total of 880 articles were identified by a computerized search using MEDLINE, OVID and the Cochrane Central Register of Controlled Trials, of which six randomised controlled studies were included in the study. Observational data, retrospective studies or animal-based studies were excluded. Main outcome measures evaluated were the changes from the baseline in heart rate, mean arterial pressure, oxygen delivery index, oxygen extraction, systemic vascular resistance index (SVRI), cardiac index (CI), central venous pressure, blood lactate levels, urine output, mean pulmonary artery pressure (MPAP), pulmonary capillary wedge pressure, right ventricular ejection fraction (RVEF), arrhythmias and 28-day mortality rates. The statistical analysis was performed using Comprehensive Meta-Analysis software. Results No significant difference was found in mortality between the two groups (RR = 1.067, CI = 0.984 to 1.157, P = 0.115). In the norpinephrine group, heart rate was significantly lower in comparison with baseline (mean change = –16.32 beats/minute, CI = –22.23 to –10.31, P <0.001) and so also was the occurrence of arrhythmias (RR = 2.34, CI = 1.456 to 3.775, P <0.001). The SVRI, however, was significantly higher in this group (difference in mean 185 dynes/cm5m2, CI = 141.214 to 229.05, P <0.001). Patients who were on dopamine had significantly better RVEF% (mean difference = 2.38%, CI = 1.058 to 3.671, P <0.001) and a lower lactate level (mean difference = –0.170 mmol/l, CI = –0.331 to –0.009, P = 0.038). Urine output, oxygen delivery, MPAP and oxygen consumption were not significantly different between the two groups. Conclusions Patients who received dopamine had a better right ventricular ejection fraction, lower lactate levels, lower systemic vascular resistance index and a trend towards a better cardiac index. However, this group was noted to have more arrhythmias and a higher baseline heart rate versus the norepinephrine group. Overall, there was no difference in the 28-day mortality between the two groups. Although there are certain hemodynamic advantages, we were unable to deduce the superiority of one pressor. The results support the current practice of individualizing the choice of an initial vasopressor based on patient profile.
Table 1 (abstract P88). PCWP values before and after treatment Variable
Nitroglycerin
Nicorandil
Number
10 (8/2)
10 (7/3)
Age
49.9
51.4
Pretreatment
25.7
25.4
6 hours
18.4
17.3
24 hours
19.7
17.4
48 hours
20.6
17.9
Conclusions Intravenous nicorandil administration gives similar reductions in PCWP compared with nitroglycerin with significantly less haemodynamic tolerance over a 48-hour period compared with nitroglycerin. This might represent a clinical advantage of nicorandil in the short-term treatment of patients with congestive heart failure.
P90 Comparative evaluation of therapeutic interventions during hemorrhagic shock D Fantoni1, DA Otsuki1, AR Martins1, JA Filho1, E Andrades1, E Chaib1, FA Voorwald2 1 USP, São Paulo, Brazil; 2FCAV/UNESP, Jaboticabal, Brazil Critical Care 2011, 15(Suppl 1):P90 (doi: 10.1186/cc9510) Introduction Resuscitation of patients with hemorrhagic shock (HS) represents a challenge in emergency medicine. The uncontrollable bleeding and subsequent cardiovascular collapse are responsible for 40% of the early mortality rate in trauma. Methods Twelve Large White pigs at 5 months of age, weighing 25 kg, were submitted to a surgical procedure for liver resection or autologous liver transplantation. Ketamine S+ (5 mg/kg, i.m.) and midazolam (0.5 mg/kg, i.m.) were used as a premedicant. Anesthesia was induced with propofol (3 mg/kg, i.v.) and maintained with 1.5% isoflurano
Critical Care 2011, Volume 15 Suppl 1 http://ccforum.com/supplements/15/S1
S33
end-tidal concentration and volume-controlled ventilation (8 ml/kg) on 40% inspired oxygen fraction. Analgesia and neuromuscular blockade were accomplishments with continuous infusion of fentanyl (0.4 mg/ kg/minute) and pancuronium (0.3 mg/kg/hour). The shock was diagnosed when blood loss exceeds 40% of the total blood volume. The HS results in mean arterial pressure reduce (MAP ≤50 mmHg), 50% cardiac output reduction (CO) and central venous saturation (SvO2) decreased to 70 mmHg. The animals underwent hemodynamic, arterial blood gases and venous monitoring, at baseline (t0), impact moment (t1), after treatment (t2), intervals of 15 minutes after shock treatment (t3, t4, t5, t6), and 120 minutes after treatment (t7). Subsequent to shock diagnosis, the animals were randomly divided into GI treated with vasopressin (0.01 IU/kg/minute), norepinephrine (0.3 mg/kg/minute) and Ringer’s lactate solution (aliquots of 20 ml/kg/20 minutes until MAP >60 mmHg). GII was equal to GI but ringer lactate administration was replaced during 20 minutes of whole blood stored during 10 days at half blood loss volume. Results See Table 1. Both groups showed a significant parameter decrease during hemorrhagic shock (t1) compared with t0. After treatment GI showed improvements in all parameters, GII showed improvement until t3. During t4 the animals presented a significant increase in K levels, lactate and decreased SvO2, CO, MAP followed by an increase in SvO2 (89%). The differences between the two groups and moments were statistically significant (P >0.01). GII had a 50% of mortality rate between t4 and t5 related with potassium increase. Subsequent to animal blood treatment, the patients showed an increase in T wave, ventricular fibrillation and death. Table 1 (abstract P90) CO (l/min)
MAP (mmHg)
SvO2 (%)
t0 GI
3.6 ± 0.4
86 ± 10
75 ± 3
t1 GI
1.3 ± 0.3
48 ± 10
t0 GII
4 ± 0.4
84 ± 8
t2 GII
1.5 ± 0.5
44 ± 5
PAP K Lactate (mmHg) (mmol/l) (mg/dl) 18 ± 2
3.5 ± 0.4
19 ± 8
58 ± 5
8 ± 3
4 ± 0.3
47 ± 8
76 ± 3
20 ± 3
4 ± 0.2
20 ± 10
57 ± 3
10 ± 2
4.3 ± 0.3
50 ± 108
75 mmHg. Data from right heart catheterization and sidestream darkfield imaging were obtained at baseline and after 6 hours. Results No significant differences were found between groups in terms of MAP, cardiac index, mixed-venous oxygen saturation, arterial lactate, and microvascular flow index of the small vessels (2.1 (1.8; 2.4) vs. 3.0 (2.6; 3.0) for TP, 1.9 (1.7; 2.3) vs. 2.7 (2.0; 3.0) for AVP, 2.3 (2.1; 2.6) vs. 3.0 (2.9; 3.0) for NE). Conversely, AVP and TP significantly reduced NE requirements over time (0.57 (0.29; 1.04) vs. 0.16 (0.03; 0.37) μg/kg/ minute for TP and 0.40 (0.20; 1.05) vs. 0.23 (0.03; 0.77) μg/kg/minute for AVP; all P <0.05). However, no differences were found between TP and AVP after 6 hours. Conclusions The results of the present study suggest that vasopressinergic V1 agonists allow a reduction in catecholamine requirements without negative impact on microvasular perfusion as compared with sole NE therapy. P92 Vasopressin for the treatment of vasodilatory shock: an ESICM systematic review and a meta-analysis A Polito1, E Parisini2, Z Ricci1, S Picardo1, D Annne3 1 Ospedale Pediatrico Bambino Gesu, Roma, Italy; 2Italian Institute of Technology, Milan, Italy; 3Hôpital Raymond Poincaré (Assistance PubliqueHôpitaux de Paris), Garches, France Critical Care 2011, 15(Suppl 1):P92 (doi: 10.1186/cc9512) Introduction We examine benefits and risks of vasopressin/terlipressin use in patients with vasodilatory shock on mortality and morbidity. Methods We searched the CENTRAL, MEDLINE, Embase, and LILACS (through to August 2010) databases. Randomized and quasirandomized trials of vasopressin/terlipressin versus placebo or supportive treatment in adult and pediatric patients with vasodilatory shock were included. The primary outcome for this review was short-term allcause mortality. Results We computed data from 10 randomized trials (n = 1,111). The overall (28-day, 30-day, ICU, hospital and 24-hour) mortality for those treated with vasopressin and terlipressin versus control patients was 237 of 582 (40.7%) versus 226 of 528 (42.8%) (RR, 0.92; 95% CI, 0.81 to
Conclusions It is possible to conclude that whole blood replacement in animals with HS should be slow and steady to avoid the effects of high K administration during a short period. Those therapeutic interventions are indicated to avoid the consequences of HS. Reference 1.
Liberman M, et al.: Curr Opin Crit Care 2007, 13:691-696.
P91 Effects of vasopressinergic V1 receptor agonists on sublingual microcirculatory blood flow in patients with catecholaminedependent septic shock A Morelli1, A Donati2, C Ertmer3, S Rehberg3, A Orecchioni1, A Di Russo1, G Citterio1, MR Lombrano2, L Botticelli2, A Valentini2, P Pelaia2, P Pietropaoli1, M Westphal3 1 University of Rome, Italy; 2Marche Polytechnique University, Ancona, Italy; 3 University Hospital of Münster, Germany Critical Care 2011, 15(Suppl 1):P91 (doi: 10.1186/cc9511) Introduction Arginine vasopressin (AVP) and terlipressin (TP) are increasingly used to stabilize mean arterial pressure in the setting of septic shock. Whether these vasopressor agents negatively impact on microcirculatory perfusion is still not fully understood. The objective of the present study was, therefore, to elucidate the effects of AVP and TP on microcirculatory perfusion in patients with catecholaminedependent septic shock. Methods We enrolled 60 fluid-resuscitated septic shock patients requiring norepinephrine (NE) to maintain mean arterial pressure (MAP) between 65 and 75 mmHg. Patients were randomly allocated to be treated with either continuous TP infusion (1 μg/kg/hour), or AVP (0.04 U/minute), or titrated NE (control; each n = 20). In both the TP and AVP groups, NE was titrated to achieve a MAP between 65 and
Figure 1 (abstract P92). Overall mortality.
Figure 2 (abstract P92). Norepinephrine dosage.
Critical Care 2011, Volume 15 Suppl 1 http://ccforum.com/supplements/15/S1
1.04; P = 0.19; I2 = 0%) without increasing the risk of AEs (nine trials 59/585, 10.0% vs. 55/529, 10.3%) (RR, 1.81; 95% CI, 0.62 to 1.86; P = 0.78; I2 = 0%). See Figure 1. Patients receiving vasopressin/terlipressin are associated with a lower dosage of norepinephrine (seven trials, –0.79 μg/kg/minute (95% CI, –1.25 to –0.33; P <0.001; I2 = 73.6%) and a trend towards a higher urine output within 24 hours of treatment (six trials, 0.40 ml/kg/hour (95% CI, –0.11 to –0.92; P = 0.12; I2 = 67.7%). See Figure 2. Conclusions No significant effect of vasopressin/terlipressin therapy on all-cause mortality was demonstrated. Overall, there is no evidence to support the routine use of vasopressin or terlipressin in the management of patients with vasodilatory shock. There was, however, a reduction in the dose of norepinephrine used for those patients receiving vasopressin/terlipressin. P93 Effects of early versus delayed terlipressin infusion on hemodynamics and catecholamine requirements in ovine septic shock TG Kampmeier1, M Westphal1, S Rehberg1, A Morelli2, M Lange1, H Van Aken1, C Ertmer1 1 University Hospital of Münster, Germany; 2University of Rome ‘La Sapienza’, Rome, Italy Critical Care 2011, 15(Suppl 1):P93 (doi: 10.1186/cc9513) Introduction Terlipressin (TP) is increasingly used in catecholaminedependent septic shock. Whereas recent data suggest advantages of continuous infusion over repetitive bolus infusion, the optimal time of TP initiation remains unclear. The present study was designed as a prospective laboratory experiment to compare the impact of early versus delayed TP infusion on key hemodynamic variables, as well as fluid and catecholamine requirements in ovine septic shock. Methods Twenty-three healthy female sheep were anesthetized and instrumented for hemodynamic monitoring. A median laparotomy was performed and 1.5 g/kg feces were taken from a cecal incision. After gut suture and insertion of peritoneal drains, the abdomen was closed. Following baseline measurements, autologous feces were injected into the abdominal cavity via a drain. When septic shock had established (MAP <60 mmHg and arterial lactate >1.8 mmol/l), causal therapy (meropenem infusion and peritoneal lavage every 8 hours) and supportive treatment (volume therapy guided by stroke volume variation and global end-diastolic volume, as well as norepinephrine infusion to maintain MAP >60 mmHg) were initiated. Sheep were randomized to placebo (n = 7), or to continuous TP infusion (2 μg/ kg/hour) started at shock onset (early TP; n = 8), or to continuous TP infusion (2 μg/kg/hour) started when NE requirements exceeded 0.3 μg/kg/minute (delayed TP; n = 8). After 24 hours of therapy, the surviving sheep were killed in deep anesthesia. Results Whereas two out of seven sheep allocated to the placebo group survived, three out of eight survived in both TP groups. Whereas hemodynamic variables were similar among groups, cumulative open-label NE requirements were significantly lower in the early TP group (0.8 ± 0.6 mg/kg) as compared with both the placebo group (2.7 ± 0.6 mg/kg) or the delayed TP group (2.2 ± 0.5 mg/kg; each P <0.05). Total fluid requirements and increase in body weight tended to be lower in the early TP group as compared with the other two groups. Conclusions Early TP infusion reduces catecholamine and fluid requirements as compared with delayed TP therapy and placebo in ovine septic shock. P94 Levosimendan in trauma patients with acute cardiac failure AN Afonin, N Karpun Burdenko Main Military Clinical Hospital, Moscow, Russia Critical Care 2011, 15(Suppl 1):P94 (doi: 10.1186/cc9514) Introduction Acute heart failure (AHF) is common among trauma patients with pre-existing coronary artery disease (CAD) and myocardial perfusion defect. The therapy is aimed at increased contractility while decreasing afterload and includes β1-adrenergic
S34
agents and phosphodiesterase III inhibitors, which act by increasing the intracellular calcium (Ca) concentration, thus markedly increasing myocardial energy consumption and risk of arrhythmias. The new Ca sensitizer levosimendan enhances cardiac performance without increasing myocardial energy demand and oxygen consumption. We report new use of levosimendan in polytrauma victims with AHF. Methods In this prospective randomized clinical trial we studied effects of levosimendan on myocardium of polytrauma victims with a history of CAD who subsequently developed AHF as diagnosed by invasive monitoring and transthoracic echocardiography. Dobutamine was administered initially to maximum dose or effect and later combined with levosimendan (Group I, n = 12) or with adrenaline (Group II, n = 14). The hemodynamic data were recorded every 6 hours. The primary outcome measures were ECG, cardiac index (CI), troponin I (TnI), and incidence and type of complication. The secondary measures were global perfusion indices: atrial natriuretic peptide (ANP), serum lactate (SL), and inotropic therapy duration. Results A second inotropic drug infusion was added when AHF persisted with average CI of 2.1 ± 0.15 l/minute/m2 and left ventricular ejection fraction of 41 ± 7% despite achieved normovolemia (CVP 11 ± 2 mmHg, pulmonary artery wedge pressure 15 ± 1 mmHg) and continued dobutamine infusion to the maximum effective dose. CI improved to 3.5 ± 0.14 and 2.6 ± 0.33 l/minute/m2 in Groups I and II, respectively (P <0.03). Group I patients had lower levels of TnI, and rate of arrhythmias. ANP was significantly lower in Group I, as well as SL. Duration of inotropic therapy was 71 ± 10.5 hours in Group I and 102 ± 13.5 hours in Group II (P = 0.001). Conclusions Levosimendan effectively enhances myocardial contractility and improves global circulation in polytrauma patients with refractory AHF. It had a significantly lower rate of complications related to increased work of the heart compared with what is usually reported with the use of catecholamines. Reference 1.
Eriksson HI, et al.: Ann Thorac Surg 2009, 87:448-454.
P95 Treatment of calcium channel blocker overdose with levosimendan A Sencan, T Adanır, G Terzi, A Atay, N Karahan Izmir Ataturk Educational and Research Hospital, Izmir, Turkey Critical Care 2011, 15(Suppl 1):P95 (doi: 10.1186/cc9515) Introduction We report a case in which cardiovascular collapse after suicidal calcium channel blocker (CCB) overdose was successfully treated with levosimendan with traditional treatment. Methods A 20-year-old male who had taken 250 mg amlodipin besilat was admitted to the ICU from the Emergency Department. His blood pressure was 70/52 mmHg, heart rate 95 bpm and oxygen saturation 99%. An arterial catheter was inserted and arterial blood pressure (ABP) of 52/20 mmHg was measured. He was tracheally intubated and dopamine infusion of 10 μg/kg/minute, dobutamine infusion of 5 μg/kg/minute was initiated. Dopamine and dobutamine infusions were increased to 20 μg/kg/minute and 15 μg/kg/minute, respectively. Despite very high doses of vasopressors, his ABP tended to decrease below 50 mmHg and frequent epinephrine boluses were given. Upon arrival 8 hours later, levosimendan was initiated without an initial loading dose infusion of 0.2 μg/kg/minute. In 4 hours from initiation of levosimendan treatment, dobutamine and dopamine infusions were stopped respectively. After full recovery the patient was discharged 72 hours after arrival. Results CCB overdose causes intractable hypotension, bradycardia, cardiac conduction abnormalities and depression of myocardial contractility, leading to central nervous system, respiratory and metabolic disorders that are often refractory to standard resuscitation methods. Therapy of intoxication includes measures to inhibit further ingestion and absorption with gastric lavage and activated charcoal, to maintain adequate blood pressure with high doses of catecholamine and fluid replacement and to reverse negative inotropic effects by β-adrenergic agonists, phosphodiesterase inhibitors, glucagon, insulin with dextrose and calcium salt. Well-known inotropic agents show their effects via increasing intracellular calcium level. In CCB overdose patients, the efficiency of these drugs was limited because
Critical Care 2011, Volume 15 Suppl 1 http://ccforum.com/supplements/15/S1
the calcium channels have already been blocked. A new inotropic drug, levosimendan, acts as a calcium sensitizer and increases the association rate of myosin actin cross-bridges and slows down their dissociation rate by binding to troponin C. It also exhibits systemic and coronary vasodilatation via ATP-sensitive potassium channels in vascular smooth muscle cells and on mitochondria. Conclusions We suggest that levosimendan can be considered an additional treatment option in patients with cardiovascular collapse due to CCB intoxication that is refractory to standard management.
S35
and DMSO–NAC 44% (Figure 1). Also, inflammatory properties were absent or to a lesser extent in those groups who used antioxidants. Serum creatinine analysis in the control group showed higher values compared with the association of DMSO–AA, DMSO–NAC where the increases were lower (Figure 2). Conclusions The findings imply that reactive oxygen species play a causal role in I/R-induced renal injury, and that antioxidants exert renoprotective effects, probably by radical scavenging and antioxidant activities, in this way diminishing renal function deterioration. References 1. 2.
P96 Effect of different antioxidants in ischemia–reperfusion syndrome W Hoyos, L Alfaro, B Garcia-Prieto, G Lopez, P Flores Universidad, Santa Tecla, La Libertad, El Salvador Critical Care 2011, 15(Suppl 1):P96 (doi: 10.1186/cc9516) Introduction The ischemia–reperfusion syndrome commonly seen in different clinical scenarios leads to acute renal failure and it is known that the free oxygen radicals play an important role in the pathophysiology of this injury. Recent studies suggest that the use of antioxidants can provide renal protection, reducing parenchymal lesions and expression of inflammatory mediators, improving renal function, resulting in a better outcome. Methods We studied the effect of DMSO, DMSO–ascorbic acid and DMSO–N-acetylcysteine administration on renal injury induced by I/R. Thirty minutes renal ischemia was induced in 50 male, New Zealand rabbits. The subjects were divided into five groups: (A) Sham, unilateral nephrectomy, no ischemia induced. (B) Control group. (C) DMSO, unilateral nephrectomy, I/R treated with DMSO 3.8 mg/kg. (D) DMSO–ascorbic acid, unilateral nephrectomy, I/R treated with ascorbic acid 150 mg/kg and DMSO 3.8 mg/kg. (E) DMSO–N-acetylcysteine unilateral nephrectomy, I/R treated with N-acetylcysteine 20 mg/kg and DMSO 3.8 mg/kg. All subjects were given 8 hours of reperfusion. Two blood samples were taken at baseline and after the reperfusion phase. Each sample was tested for serum creatinine. After reperfusion left nephrectomy was performed on each subject before euthanasia. A pathological analysis evaluated tubular and basement membrane changes. The level of injury was scaled in three stages: mild, moderate and severe. Results The histological analysis showed a total damage in 59% of the control group, compared with DMSO 33%, DMSO–AA 51%,
Figure 1 (abstract P96). Total histopathological renal damage.
Figure 2 (abstract P96). Mean serum creatinine values in the different groups.
3.
Kedar I, Jacob ET, Bar-Natan N, Ravid M: Dimethyl sulfoxide in acute ischemia of the kidney. Ann NY Acad Sci 1983, 411:131-134. Di Giorno C, Pinheiro HS, Heinke T, et al.: Beneficial effect of N-acetylcysteine on renal injury triggered by ischemia and reperfusion. Transplant Proc 2006, 38:2774-2776. Lee J, Kim M, Park C, Kim M: Influence of ascorbic acid on BUN, creatinine, resistive index in canine renal ischemia–reperfusion injury. J Vet Sci 2006, 7:79-81.
P97 Searching for mechanisms that matter in septic acute kidney injury: an experimental study J Benes1, J Chvojka1, R Sykora2, J Radej1, A Krouzecky1, I Novak1, M Matejovic1 1 Charles University Teaching Hospital, Plzen, Czech Republic; 2District Hospital, Karlovy Vary, Czech Republic Critical Care 2011, 15(Suppl 1):P97 (doi: 10.1186/cc9517) Introduction Both hemodynamic and nonhemodynamic factors are implicated in the pathogenesis of sepsis-induced acute kidney injury (SAKI). However, despite similar septic insult, not all patients develop SAKI. The reasons for the difference in sensitivity to AKI are unknown. Therefore, we sought to analyze dynamic changes in renal hemodynamic and non-hemodynamic responses to sepsis in animals who developed AKI and those who do not. Methods Thirty-six pigs were anesthetized, mechanically ventilated and instrumented. After a recovery period, progressive sepsis was induced either by peritonitis (n = 13) or by i.v. infusion of Pseudomonas aeruginosa (n = 15). Eight sham-operated animals served as timematched controls. All animals received standard ICU care including goal-directed hemodynamic management. Before and at 12, 18 and 24 hours of sepsis systemic and renal hemodynamic, microcirculatory and inflammatory variables were measured. AKI development was defined using AKIN criteria. Results Fourteen pigs (50%) developed AKI (62% in peritonitis model, 40% in bacteria infusion model) with a significant increase in serum creatinine observed already at 18 hours of sepsis. There were no differences in the systemic hemodynamics and vasopressor support between AKI and non-AKI groups. Although time-dependent reduction in cortical microvascular perfusion was comparable in both groups, only AKI animals developed a progressive increase in renal vascular resistance. This intrarenal vasoconstriction was preceded by a marked overproduction of serum cytokines (TNFα, IL-6) and markers of oxidative stress (TBARS), observed already at 12 hours of sepsis. This induction of proinflammatory response was delayed in non-AKI animals. Conclusions The observed variability in susceptibility to SAKI in our models replicates that of human disease. This heterogeneity allowed us to isolate and study factors discriminating AKI from non-AKI. Early systemic inflammation coupled with late intrarenal vasoconstriction appears to be major determinant of the initiation of SAKI. Genetic and proteomic analyses underlying the observed differences are being analyzed. Acknowledgements The study was supported by the Research Project MSM 0021620819.
Critical Care 2011, Volume 15 Suppl 1 http://ccforum.com/supplements/15/S1
P98 Raised serum creatinine at admission to critical care is independently associated with mortality in patients with decompensated alcoholic liver disease A Whiteside1, P Whiting2 1 Sheffield Teaching Hospitals NHS Trust, York, UK; 2Northern General Hospital, Sheffield, UK Critical Care 2011, 15(Suppl 1):P98 (doi: 10.1186/cc9518) Introduction Patients with decompensated alcoholic liver disease have a high mortality if they require critical care. Previous studies have indicated that patients who required renal replacement therapy have high mortality, but there is little research on the mortality rate of those with renal impairment not requiring support. Methods A retrospective cohort study of patients with a diagnosis of decompensated alcoholic liver disease admitted to the critical care department of two hospitals over a 3-year period was conducted (n = 51). Results There was no significant difference in the ages (50.8 and 50.3, P = 0.9) or sexes of those who survived and those who died during hospital stay. Hospital, 6-month and 1-year mortality rates were 45%, 49% and 51%, respectively. There was no significant difference in the number of patients requiring advanced respiratory support (69% vs. 74%, P = 0.76). Ninety-four per cent of patients who had a serum creatinine of 150 mmol/l or greater at admission to critical care died during their hospital stay. Conclusions The futility of admitting patients with decompensated alcoholic liver disease with serum creatinine of 150 mmol/l or greater should be considered at the time of referral to critical care, as they have a 94% mortality. References 1. 2.
Mackle IJ, et al.: Br J Anaesth 2006, 97:496-498. Cheynon D, et al.: Intensive Care Med 2005, 31:1693-1699.
P99 Contrast-induced nephropathy in ITU patients: outcomes of a university hospital re-audit K Lam, T Chan, R Lowsby, J Walker Royal Liverpool University Hospital, Liverpool, UK Critical Care 2011, 15(Suppl 1):P99 (doi: 10.1186/cc9519) Introduction Contrast-induced nephropathy (CIN) is a significant and preventable cause of renal failure associated with increased mortality, hospital stay and long-term haemodialysis. Critically ill patients have increased risks of developing CIN due to pre-existing disease and sepsis. A university hospital audit in 2007 found that 22.2% of ITU patients had significant rises in creatinine following intravenous contrast medium (IVCM). In 2008, IVCM guidelines were implemented trust-wide to detect patients with pre-existing renal impairment and provide guidance for pre-optimisation and prophylactic measures depending on CKD stage, including early renal team involvement. A re-audit assessed the impact of IVCM guidelines in decreasing the incidence of CIN in ITU. Methods ITU patients who received IVCM for CT studies from March to December 2010 were identified. Patients on haemodialysis precontrast or who died within 48 hours post-contrast administration were excluded. Pre-contrast (within 48 hours) and post-contrast (48 to 72 hours) creatinine levels were analysed. CIN was defined as an increase in serum creatinine exceeding 25% or 44 μmol/l from baseline within 3 days of administration of contrast media in the absence of alternative causes. Results Ninety patients were identified. Ten patients who required haemodialysis pre-contrast or died within 48 hours post-contrast were excluded. Mean age was 59 years (range 25 to 89 years) with a male:female ratio of 46:34. Fourteen (17.5%) patients had significant rises in creatinine post-contrast. Patients who died within 48 hours had ruptured AAA, severe sepsis, ischaemic bowel, and so forth. Conclusions The incidence of CIN has decreased to 17.5% in medical and surgical ITU patients since the introduction of the IVCM guidelines.
S36
P100 Evaluation of acute kidney injury with pediatric-modified RIFLE criteria after pediatric cardiac surgery P Zeyneloglu, A Pirat, E Baskin, A Camkiran, C Araz, M Ozkan, N Bayraktar, G Arslan Baskent University Hospital, Ankara, Turkey Critical Care 2011, 15(Suppl 1):P100 (doi: 10.1186/cc9520) Introduction Acute kidney injury (AKI) is a serious complication associated with increased morbidity and mortality in pediatric patients undergoing surgery for congenital heart disease. The aim of this study was to evaluate children with AKI after pediatric cardiac surgery using pediatric-modified RIFLE (pRIFLE) criteria and to investigate the value of serum cystatin C in patients with AKI. Methods Eighty-one children undergoing cardiopulmonary bypass (CPB) for surgical correction of acyanotic congenital heart disease were prospectively enrolled in the study. Serial blood samples were collected to measure serum cystatin C and creatinine levels. The primary outcome measure was AKI, defined as ≥50% increase in serum creatinine from baseline. Results Twenty-one children (26%) developed AKI, in which risk occurred in 12 (15%), injury in three (4%) and failure in six (7%) of the patients diagnosed with serum creatinine. Patients with AKI were significantly younger than patients without AKI (P = 0.002). No differences were noted with respect to CPB and aortic cross-clamp durations in those with and without AKI (P >0.05). Postoperative 24-hour inotrope scores were significantly higher in children who developed AKI (P = 0.003). Serum cystatin C concentrations were significantly increased in AKI patients at 2 hours after CPB (P = 0.029) and remained elevated at 24 hours (P <0.001) and 48 hours (P = 0.001). There was a significant positive correlation between presence of AKI and serum cystatin C levels (P <0.05). A significant negative correlation was found between age and AKI (r = –0.344, P = 0.002). Conclusions AKI develops in 26% of patients after pediatric cardiac surgery. Our results suggest that patients with AKI were younger and had postoperative higher serum cystatin C levels and higher inotrope scores when compared with patients without AKI. Reference 1.
Krawchzeski CD, et al.: Clin J Am Soc Nephrol 2010, 5:1552–1557.
P101 Acute kidney injury after coronary artery bypass grafting surgery P Zeyneloglu, A Pirat, N Veziroglu, A Sezgin, G Arslan Baskent University Hospital, Ankara, Turkey Critical Care 2011, 15(Suppl 1):P101 (doi: 10.1186/cc9521) Introduction Acute kidney injury (AKI) after coronary artery bypass grafting (CABG) surgery is associated with increased postoperative morbidity and mortality. The aim of this study was to apply the RIFLE (risk (R), injury (I), failure (F), loss (L) and end-stage kidney disease (E)) criteria in patients after CABG surgery, to identify intraoperative risk factors for occurrence of AKI and to analyze the impact of AKI on mortality. Methods Five hundred consecutive patients who underwent CABG surgery between December 2004 and December 2007 were retrospectively studied. Those who had combined valve and coronary surgery, off-pump surgery and those receiving renal replacement therapy preoperatively were excluded from the study. The primary outcome measure was AKI, defined as ≥50% increase in serum creatinine from baseline. Results The mean age of the patients (74% male) was 60.9 ± 9.8 years. The incidence of AKI was 4%, in which risk occurred in 2%, injury in 1% and failure in 1% of the patients. The cardiopulmonary bypass (CPB) time and duration of the surgery was significantly longer in patients who developed AKI (P = 0.024, P = 0.002). The amounts of fluid and blood administered and vasopressor requirements during surgeries were similar between patients who developed AKI and those without AKI (P >0.05). The need for intraoperative cardiopulmonary resuscitation (CPR), the use of intra-aortic balloon pump (IABP) and total circulatory arrest (TCA) was significantly higher in AKI patients (P = 0.002, P = 0.001 and P = 0.036, respectively). When compared with non-AKI patients, postoperative mortality for patients experiencing AKI was significantly
Critical Care 2011, Volume 15 Suppl 1 http://ccforum.com/supplements/15/S1
S37
high (P = 0.001). There was a significant positive correlation between presence of postoperative mortality and AKI (r = 0.232, P <0.001). Conclusions The results suggest that AKI develops in 4% of patients after CABG surgery. Intraoperative risk factors for occurrence of AKI include longer duration of surgery, CPB time and requirements of CPR, IABP and TCA usage. In addition, postoperative development of AKI is associated with mortality. Reference 1.
De Santo LS, et al.: RIFLE criteria for acute kidney injury in valvular surgery. J Heart Valve Dis 2010, 19:139-147.
P102 Increased severity of acute kidney injury does not increase long-term mortality MB Pereira1, DMT Zanetta2, RCRM Abdulkader1 1 University of São Paulo, Brazil; 2School of Medicine, São Paulo, Brazil Critical Care 2011, 15(Suppl 1):P102 (doi: 10.1186/cc9522) Introduction Acute kidney injury (AKI) increases either in-hospital mortality or long-term mortality. The severity of AKI has been associated with early mortality; however, studies on its role in long-term mortality have shown contradictory results. Methods We studied 300 critically ill patients who had survived an AKI episode defined by AKIN creatinine criteria. All patients were attended by nephrologists in 2005 to 2006 and studied in May 2008. Exclusion criteria: age <18 years, presumed etiology other than acute tubular necrosis, baseline creatinine >3.5 mg/dl, nephrology follow-up <2 days and renal transplant. Analyzed variables: age; gender; type of admission; AKI etiology (ischemia, nephrotoxicity, sepsis or multifactorial); baseline and hospital discharge GFR (evaluated by MDRD equation); AKIN classification (1, 2, 3); need for dialysis, mechanical ventilation or vasoactive drugs; presence of comorbidities (hypertension, diabetes, heart failure, cancer or chronic liver disease); and functional recovery at hospital discharge (discharge GFR ≤1.1 baseline GFR). Survivors and nonsurvivors were compared by t test, Mann–Whitney test, Fischer’s test or chi-square test, as appropriate. Causes of death were identified by death certificate. Data are presented as median (25 to 75 IQ) or percentage. Results At the end of the study 105 patients had died (35%). Death occurred 194 days (69 to 444) after hospital discharge. The main cause of death was cardiovascular diseases (39%). The comparison between survivors and nonsurvivors showed that survivors had higher percentage of males (67 and 52%, P = 0.01), were younger (63 (49 to 72) and 70 years (56 to 79), P <0.0001), had more multifactorial AKI etiology (26 and 41%, P = 0.01) and less heart failure as comorbidity (17 and 32%, P = 0.006). Unexpectedly, more survivors had needed mechanical ventilation (57 and 32%, P = 0.006) but neither vasoactive drugs (60 and 61%, P >0.05) nor dialysis (38 and 39%, P >0.05). See Table 1. Table 1 (abstract P102). AKI characteristics Survivors
Nonsurvivors
P value
39; 25; 36
40; 30; 30
0.38
Baseline GFR
63 (41 to 88)
54 (33 to 74)
0.015
Hospital discharge GFR
53 (36 to 73)
42 (27 to 65)
0.02
Functional recovery (%)
49
47
0.8
AKIN 1; 2; 3 (%)
Conclusions Long-term survival after AKI is not associated with the AKI severity but with baseline renal function. P103 Any level of acute kidney injury may be associated with mortality in critically ill patients AP Rucks, AF Meregalli, DA Becker, JM Andrade, G Friedman Complexo Hospitalar Santa Casa, Porto Alegre, Brazil Critical Care 2011, 15(Suppl 1):P103 (doi: 10.1186/cc9523) Introduction Acute kidney injury (AKI) is a common condition in critically ill patients [1]. It is an independent risk factor for in-hospital
mortality in this population [2]. The goal of this research is to classify critically ill patients within RIFLE criteria [3] and assess its impact on 30-day in-hospital mortality. Methods From September 2009 to July 2010, all patients admitted to two ICUs of Santa Casa Hospital were included in this study. Age, gender, SOFA and APACHE scores, origin, serum creatinine, whether they were clinical or surgical, and outcome were noted. Then patients were classified as ‘no AKI’, ‘risk’, ‘injury’, or ‘failure’ according to RIFLE criteria. The 30-day in-hospital mortality was also evaluated. A multivariate analysis model was created from potentially confusing variables that were statistically significant in an unvaried analysis. P <0.05 was considered statistically significant. Results Two hundred and six patients were included. Most of them were women (54%), with an average age of 62 years. The mean APACHE score was 17 and the mean SOFA score was 5.8. The proportion, according to the RIFLE criteria, for patients at ‘risk’ was 17%, at ‘injury’ was 14%, ‘failure’ was 26% and ‘no AKI’ was 42%. The relative risk for 30-day inhospital mortality for the group ‘no AKI’ was 0.5 (95% CI = 0.39 to 0.63; P <0.001); for the ‘risk’ group was 1.7 (95% CI = 1.03 to 3.06; P = 0.037); for the ‘injury’ group was 1.66 (95% CI = 0.97 to 2.85; P = 0.062); and for the ‘failure’ group was 2.03 (95% CI = 1.22 to 3.37; P = 0.006). Conclusions AKI incidence, according to RIFLE classification, is high in critically ill patients. There is an association between AKI severity and mortality. It is noticeable that patients in the ‘risk’ group have increased mortality. References 1. 2.
3.
Uchino S, et al.: Acute renal failure in critically ill patients: a multinational, multicenter study. JAMA 2005, 294:813-818. Hoste EAJ, et al.: RIFLE criteria for acute kidney injury are associated with hospital mortality in critically ill patients: a cohort analysis. Crit Care 2006, 10:R73. Bellomo R, et al.: Acute renal failure – definition, outcome measures, animal models, fluid therapy and inforation technology needs: the second International Consensus Conference of the Acute Dialysis Quality Initiative (ADQI) Group. Crit Care 2004, 8:R204-R212.
P104 A comparison of four methods to define timing of acute kidney injury KA Wlodzimirow, A Abu-Hanna, C Bouman Academic Medical Center, Amsterdam, the Netherlands Critical Care 2011, 15(Suppl 1):P104 (doi: 10.1186/cc9524) Introduction RIFLE provides standardized criteria for defining acute kidney injury (AKI) [1]. It is based on changes in serum creatinine (sCr), in relation to a premorbid sCr, and on urine output. When premorbid sCr is unknown, baseline sCr is estimated. Often only sCr is used (RIFLEcreat). Thus there are four methods for defining AKI: actual RIFLE, actual RIFLEcreat, estimated RIFLE and estimated RIFLEcreat. There is much interest for biomarkers predicting early AKI [2]. Critical for determining a biomarker’s performance of AKI is the diagnosis of the first day of AKI (AKI-0). We compared the impact of four AKI definitions on determining AKI-0. Methods An observational study for 6 months in ICU patients admitted ≥48 hours. For the first 7 days we calculated daily the number of patients diagnosed with AKI-0 using the four AKI definitions. Results One hundred and one patients (39%) had a known premorbid sCr. Mean age and APACHE was respectively 64 (13) and 22 (7). Figure 1 (overleaf ) shows the distribution of AKI-0. Conclusions The early diagnosis of AKI is significantly reduced when urine output criteria are neglected in the RIFLE definition, and also when baseline sCr is estimated. This may significantly impact the assessment of biomarker performance. References 1. 2.
Bellomo R, et al.: Crit Care 2004, 8:204-212. Endre ZH, et al.: Nephrology 2008, 13:91-98.
Critical Care 2011, Volume 15 Suppl 1 http://ccforum.com/supplements/15/S1
S38
To visualize dependence of adjusted mortality rate and mortality predictive power on AKI definition, we generated 3D and contour plots. Results The UO versus mortality plot demonstrates that when UO <0.5 the mortality rate increases rapidly as urine output decreases. Mortality increases sharply for observation periods up to 5 hours and then the rate of increase is reduced until a plateau is reached at approximately 24 hours. Cross-sections at 6, 12 and 24 hours of the UO mortality plot shows that the mortality rate of AKI 1 and AKI 2 are similar but differ significantly from AKI 3. See Figure 1. Conclusions The current AKIN recommendation that uses a urine output of 0.5 ml/kg/hour is valid. Since AKIN’s stages 1 and 2 were found to exhibit similar mortality rates, we propose a reduction in the AKI 2 threshold to 0.4 ml/kg/hour to better delineate among the three stages. We demonstrated that the mortality rate increases sharply during the first 5 hours of oliguria. Hence, the current used observation period (6 hours) seems to be valid. P106 Urine biomarkers for gentamicin-induced acute kidney injury in the neonatal ICU D Jansen, S Heemskerk, L Koster-Kamphuis, TP Bouw, AF Heijst, P Pickkers Radboud University Nijmegen Medical Centre, Nijmegen, the Netherlands Critical Care 2011, 15(Suppl 1):P106 (doi: 10.1186/cc9526) Figure 1 (abstract P104). Distribution of AKI-0.
P105 Validation of the AKIN criteria definition using high-resolution ICU data from the MIMIC-II database T Mandelbaum1, DJ Scott2, J Lee2, RG Mark2, MD Howell1, A Malhotra3, D Talmor1 1 Beth Israel Deaconess Medical Center and Harvard Medical School, Boston, MA, USA; 2MIT-HST, Cambridge, MA, USA; 3Brigham and Women’s Hospital and Harvard Medical School, Boston, MA, USA Critical Care 2011, 15(Suppl 1):P105 (doi: 10.1186/cc9525) Introduction Recently the Acute Kidney Injury (AKI) Network proposed criteria for the definition of AKI in the critically ill. The minimum hourly urine output rate used to define oliguria (<0.5 ml/kg/hour) is based exclusively on clinical experience and animal models, not on clinical investigation. Moreover, the minimum duration of oliguria (6 hours) is based on clinical experience and was never experimentally determined. We used a massive database of ICU patients (MIMIC) to continuously vary the observation period and threshold of urine output measurements to determine optimal AKI definitions for improved inhospital mortality prediction. Methods After excluding end-stage renal disease, 14,536 adult patients were included. Various AKI thresholds corresponding to different observation periods and urine output measurement thresholds were analyzed using a multivariate logistic regression model for each choice of thresholds. A total of 470 regression models were plotted. We controlled for sex, age, SOFA and co-morbidities (ICD-9 codes).
Introduction Gentamicin (GM) is an aminoglycoside frequently used in the neonatal ICU to treat infections. Despite low resistance and costs, GM is also nephrotoxic and may cause acute kidney injury (AKI). Serum creatinine appears to be an insensitive and unreliable marker in this setting. The objective of this study was to determine whether urine biomarkers are useful for early detection of gentamicin-induced AKI in neonates in the neonatal ICU. Methods Subjects Thirty-three neonates (26 male/seven female, gestational age ±36 weeks) with a bladder catheter without pre-existent kidney disease were divided into a GM group (n = 20) and a reference group (n = 13). Study design and procedures A prospective, clinical observational trial with non-invasive procedures. Demographics, vital signs and clinical conditions were recorded. Every 2 hours, during the period of bladder catheter, urine samples were collected and renal injury biomarkers glutathione-S-transferase A1-1 (GSTA1-1), GSTP11, kidney injury marker-1 (KIM-1), N-acetyl-β-D-glucosaminidase (NAG) and neutrophil gelatinase-associated lipocalin (NGAL) were determined. Residual blood samples were used to measure serum creatinine (sCr). Results Demographics were similar between both groups expect for baseline BUN (P <0.04), which disappeared after the first day of the study. No significant differences were found in baseline kidney function, hemodynamics, ventilation support and reason for admission. Treatment with GM resulted in higher levels of sCr compared with the reference group (58.5 (44.8 to 78.5) vs. 34 (28.3 to 58.8) mmol/l; P <0.05). The average time until the highest peak was shorter for both GSTA1-1 and GSTP1-1 compared with sCr (P <0.05). Furthermore, higher levels of sCr corresponded with higher levels of urine biomarkers and KIM-1, NAG and GSTP1-1 could differentiate between the GM and reference group.
Figure 1 (abstract P105). (a), (b) Urine output mortality plot. (c) Cross-section at 6, 12, 24 hours.
Critical Care 2011, Volume 15 Suppl 1 http://ccforum.com/supplements/15/S1
Conclusions Higher sCr levels correspond with higher urinary excretion of all biomarkers, especially after GM use. In addition, the urinary biomarker GSTP1-1 might be useful for early detection of AKI in the neonatal ICU. P107 Neutrophil gelatinase-associated lipocalin in ICU patients developing oliguria A Roman, M Suball, V Piersoel, T El Mahi, C Hanicq, E Stevens CHU Saint-Pierre, Brussels, Belgium Critical Care 2011, 15(Suppl 1):P107 (doi: 10.1186/cc9527) Introduction Plasma neutrophil gelatinase-associated lipocalin (pNGAL) is an early biomarker of acute kidney injury (AKI) [1]. Methods A prospective observational study enrolling adult ICU patients developing a first episode of oliguria defined as urinary output lower than 0.5 ml/kg/hour for at least only 2 consecutive hours despite conventional treatment and appropriate fluid resuscitation. pNGAL (Biosite, Inverness, San Diego, CA, USA), plasma cystatin C, plasma and urinary sodium and creatinine, were measured to determine on 1 hour the fraction of excretion of the filtered sodium (FeNa) and the glomerular filtration rate (GFR). The SOFA score and RIFLE score [2] were calculated. Hospital mortality was recorded. Results Ninety-three patients were enrolled: 52 presented with 0, 15 with R, 13 with I and 10 with F RIFLE score. The median SOFA score was 3 (minimum: 0 to maximum: 17). Sepsis was the main diagnostic in 38 patients, 27 were cardiac surgery patients who underwent cardiopulmonary bypass (CBP) and 28 were miscellaneous other category patients (hemorrhagic shock, hypotensive surgery, trauma with crush, and so on). In-hospital mortality of the studied cohort was 20%. Eighty-five percent of FeNa were less than 1%, suggesting active antidiuresis and sodium reabsorption. The distribution of pNGAL between survivors (median 61 ng/ml, 95% CI = 59 to 91 ng/ml) and nonsurvivors (median 182 ng/ml, 95% CI = 86 to 594 ng/ml) was statistically significant (P = 0.006, Wilcoxon rank test). Distribution of pNGAL in patients post CPB (median 59 ng/ml; 95% CI = 59 to 59), was statistically different from patients with sepsis (median 180 ng/ml; 95% CI = 92 to 276) and the last group (median 85 ng/ml; 95% CI = 59 to 166) with respectively P <0.0001 and 0.024 after Bonferroni’s correction. No correlation between pNGAL and FeNa was found (Spearman’s rho = 0.309; 95% CI = 0.11 to 0.48), nor between pNGAL and 1-hour GFR (Spearman’s rho = –0.55; 95% CI = –0.68 to –0.38), neither between pNGAL and plasma cystatin C (Spearman’s rho = 0.62; 95% CI = 0.47 to 0.73). Conclusions pNGAL rises in early oliguria independently while kidney function markers such as GFR, FeNa and cystatin C may have remained unaffected at this stage. Sepsis is a stronger trigger for pNGAL elevation. References 1. 2.
Cruz DN, et al.: Intensive Care Med 2010, 36:444-451. Bellomo R, et al.: Crit Care 2004, 8:R204-R212.
P108 Use of Doppler ultrasound renal resistive index and neutrophil gelatinase-associated lipocalin in prediction of acute kidney injury in patients with septic shock CW Ngai1, MF Lam2, SH Lo3, CW Cheung4, WM Chan1 1 Adult Intensive Care Unit, 2Department of Medicine, and 3Department of Surgery, Queen Mary Hospital, Pokfulam, Hong Kong; 4Department of Anaesthesiology, The University of Hong Kong, Pokfulam, Hong Kong Critical Care 2011, 15(Suppl 1):P108 (doi: 10.1186/cc9528) Introduction Acute kidney injury (AKI) is common in septic shock and there is no good marker to predict it. Neutrophil gelatinase-associated lipocalin (NGAL) is a novel renal biomarker showing promising results in prediction of AKI in patients across different clinical settings. Another potential marker is the resistive index (RI) of renal interlobar artery (calculated as (peak systolic velocity – end diastolic velocity) / peak systolic velocity), which has been shown to be useful in identifying those who will develop AKI in patients with septic shock. The aim of this study is to evaluate the usefulness of RI and NGAL in the early detection of AKI.
S39
Methods A prospective, observational study in a 20-bed medical/ surgical ICU of a university teaching hospital. All patients with septic shock were recruited, excluding those with chronic renal failure (serum creatinine >120 μmol/l). Within the first 24 hours after the introduction of vasopressor, urine and serum were collected for NGAL measurement and RI was determined by two independent operators. The occurrence of AKI was measured at day 3, according to RIFLE criteria. RI and NGAL were compared between patients with (RIFLE-F) and without (RIFLE0/R/I) AKI. Results During the period from August to November 2010, 20 patients (age 58 ± 16) with septic shock were recruited. Eleven patients were classified as having AKI. No significant difference in baseline characteristics such as APACHE II score and baseline creatinine was shown at enrollment. RI, serum-NGAL and urine-NGAL were all higher in patients with AKI (RI: 0.749 ± 0.0697 (mean ± SD) vs. 0.585 ± 0.0983, P <0.001; serum-NGAL: 2,182 ± 838 ng/ml (mean ± SD) vs. 1,075 ± 1,006, P = 0.015; urine-NGAL: 2,009 ± 3,370 vs. 993 ± 1,789 (median ± IQR), P = 0.025). Area under the ROC curve for RI and serum-NGAL was 0.909 (±0.088, P = 0.002) and 0.808 (±0.113, P = 0.02), respectively. For RI, using 0.65 as the cut-off, sensitivity and specificity was 1 and 0.89, respectively. For serum-NGAL, using a cut-off of 1,200 ng/ml, it had a sensitivity of 1 and specificity of 0.67. Inter-observer difference of RI was low (0.0015 ± 0.0074 (mean ± SD)). Conclusions Doppler ultrasound renal RI is non-invasive, rapidly available and easily reproducible, and is at least as good as NGAL as a predictor of AKI in patients with septic shock. References 1. 2.
Lerolle N, et al.: Intensive Care Med 2006, 32:1553-1559. Haase M, et al.: Am J Kidney Dis 2009, 54:1012-1024.
P109 Removal of drug delivered via a central venous catheter by a dual-lumen haemodiafiltration catheter inserted at the same site: a quantitative flow model R Kam1, JM Mari2, TJ Wigmore3 1 Imperial College London, UK; 2INSERM, Lyon, France; 3Royal Marsden Hospital, London, UK Critical Care 2011, 15(Suppl 1):P109 (doi: 10.1186/cc9529) Introduction The objectives of this study were to model and visualise flow in a central vein during continuous venovenous haemodiafiltration (HDF), to measure drug removal when an HDF catheter is co-located with a central venous catheter (CVC) infusing medication. Dual lumen HDF catheters are commonly used to deliver continuous venovenous renal replacement therapy in critical care. These catheters are often colocated with a CVC used to infuse drugs, with the tips lying in close approximation in a great vein. The effect of this co-location on drug delivery to the patient due to aspiration by the HDF machine may be of serious import, with the elimination of important vasoactive drugs or minimally protein-bound antibiotics just two possibilities. This effect has never been studied. Methods A model of a human central vein was constructed using transparent polyvinyl chloride piping. A CVC and an HDF catheter were inserted into this and water flow in the central vein and extracorporeal circuit was generated by centrifugal pumps at physiological volume flow rates. Ink was used as a visual tracer and creatinine solution as a quantifiable tracer to determine the extent of removal of CVC infusate via the HDF catheter. The longitudinal distance of the CVC infusion point from the arterial port of the HDF catheter was altered to quantify its effect on tracer removal. Results Volume flow rates of 1.45 l/minute and 200 ml/minute were achieved in the central vein model and the HDF circuit model, respectively, with laminar flow in the central vein confirmed by Duplex imaging and ink flow analysis. All visible ink and 100% of creatinine tracer infused via the CVC were aspirated by the HDF catheter unless the point of infusion was ≥1 cm downstream of the proximal aspect of the arterial port. No measurable tracer was aspirated when the infusion was ≥2 cm downstream. Orientation of side ports did not significantly affect tracer removal. Conclusions This initial study suggests that drugs infused via a CVC colocated with an in-use HDF catheter may be completely and immediately
Critical Care 2011, Volume 15 Suppl 1 http://ccforum.com/supplements/15/S1
aspirated into the extracorporeal circuit. This phenomenon could lead to significant drug underdosing with potentially severely deleterious consequences for patients. When co-location cannot be avoided, drugs with important immediate effects or high membrane clearance should be infused sufficiently distal to the inlet of an adjacent HDF catheter. P110 Effect of total parenteral nutrition on the duration of haemofilter circuit S Saha, P Shah, J Gibbs, J Collins Broomfield Hospital, Chelmsford, UK Critical Care 2011, 15(Suppl 1):P110 (doi: 10.1186/cc9530) Introduction An effective haemofilter circuit is essential for performing continuous renal replacement therapy (CRRT) efficiently and without interruption. Premature clotting is a major problem in the daily practice of CRRT associated with blood loss [1], increased workload and cost implications. Early clotting is related to various factors ranging from bio-incompatibility of the CRRT circuit material, the modality used, ineffective anticoagulation, to site of catheter placement. Shortened haemofilter circuit survival time due to high lipid content in total parenteral nutrition (TPN) has also been described in a case report [2]. We wish to determine whether TPN infusion led to shortening of haemofilter circuit duration. Methods We conducted a retrospective analysis of notes of patients who had undergone CRRT in an adult general ICU over 2 years. Demographic (age, sex) and clinical (platelet count, INR, APTT, anticoagulant used and the rate of infusion of anticoagulant) data that are known to influence the duration of CRRT circuit were compared. Cycles terminated because of high Pin pressure or documented failure of the circuit were included in the study and the duration of the circuit was determined. Note was made if the patient was on TPN during CRRT. They were divided in two groups: CRRT with TPN, and CRRT without TPN. All patients had the similar make vascath (14Fr, polyurethane catheter; Logitech) and the same CRRT machine and circuit. Results One hundred and twenty-one patients had undergone CRRT in the unit in the past 2 years. In total, 246 CRRT circuits were used. A linear regression model was fitted to the duration of filtration with TPN as a categorical predictor, along with other covariates. The mean duration of haemofilter circuit was 24.51 (24.08 to 29.08) hours without TPN and 17.22 (14.98 to 23.59) hours on TPN. With the maximal model, TPN use was significantly (P <0.002) associated with a decrease in duration of filtration, but none of the other factors were significant. There was a tendency for platelet count to be significant. Conclusions So considering the effect sizes, both TPN and increase in platelet count were associated with significant reduction in the duration of haemofiltration circuit. TPN led to decrease in duration of the haemofilter circuit by 7 hours. The effect of TPN was found to be independent of the platelet count. References 1. 2.
Cuts M, et al.: Intensive Care Med 2000, 26:1694-1697. Kazory A, et al.: Nephron Clin Pract 2008, 108:c5-c9.
P111 Effects of ultrafiltration on systemic hemodynamics and microcirculatory perfusion in patients with end-stage kidney disease E Klijn, M Van Genderen, M Betjes, J Bakker, J Van Bommel Erasmus MC University Medical Center, Rotterdam, the Netherlands Critical Care 2011, 15(Suppl 1):P111 (doi: 10.1186/cc9531) Introduction The relationship between systemic hemodynamic parameters and microcirculatory perfusion remains unclear. This is especially apparent in the concept of fluid responsiveness, where stroke volume (SV) can fluctuate strongly without being paralleled by changes in microcirculatory perfusion. Therefore, we hypothesized that large decreases in volume status due to ultrafiltration (UF) with intermittent hemodialysis in patients with end-stage kidney disease (ESKD) would decrease systemic hemodynamics but would not affect parameters of microcirculatory perfusion.
S40
Methods Consecutive patients on chronic intermittent hemodialysis for ESKD were eligible for our study. SV and heart rate were measured continuously and non-invasively using NICOM, a technique based on chest bioreactance. Blood pressure was measured intermittently with a sphygmomanometer. Peripheral and microcirculatory perfusion were measured intermittently with sidestream dark-field (SDF) imaging (sublingual area), and continuously with forearm-to-finger temperature gradient (Tskin-diff ) and photopletysmography (PPG) (finger). All parameters were assessed before (baseline) and after 4 hours at the end of UF. Results Data are presented as median (IQR). Twenty-one patients (13 males, median age 59 (51 to 66) years) were included in our study. A median volume of 2,200 (1,850 to 2,850) ml was removed. SV and mean arterial pressure decreased during UF from 75 (58 to 84) ml to 51 (37 to 67) ml (P <0.01) and from 102 (88 to 109) mmHg to 85 (75 to 95) mmHg (P <0.001), respectively, while heart rate did not change. At baseline all parameters of peripheral and microcirculatory perfusion were undisturbed. During UF, Tskin-diff and the PPG of the finger did not change. Sublingual microvascular flow index and vessel density measured with SDF slightly decreased from 3.0 (3.0 to 3.0) to 2.8 (2.7 to 2.9) (P <0.001) and from 10.6 (9.9 to 11.1) n/mm to 9.9 (9.2 to 10.5) n/mm (P <0.05), respectively. Conclusions UF leads to a significant and uniform decrease in volume status in patients with ESKD but surprisingly this was not associated with large decreases in peripheral and microcirculatory perfusion. Therefore caution is warranted when interpreting systemic hemodynamic parameters in terms of hypovolemia and hypoperfusion when peripheral perfusion is not evidently impaired. P112 Best prediction for need of dialysis following cardiac surgery is obtained with the Thakar model HD Kiers, MC Schoenmakers, HA Van Swieten, JG Van der Hoeven, S Heemskerk, P Pickkers Radboud University Nijmegen Medical Centre, Nijmegen, the Netherlands Critical Care 2011, 15(Suppl 1):P112 (doi: 10.1186/cc9532) Introduction Postoperative acute kidney injury requiring dialysis (AKI-D) occurs in 1 to 5% of patients after cardiac surgery with cardiopulmonary bypass (CPB) and is associated with a high mortality (30 to 60%) and prolonged increased ICU length of stay. There are four models using different covariates that aim to predict the risk for postoperative AKI-D in cardiac surgery patients [1-4]. We aim to investigate which model best predicts AKI and AKI-D in our cardiac surgery population. Methods All adult patients undergoing cardiac surgery with CPB, between October 2006 and January 2009, in our hospital were included in this study. Data on preoperative risk factors and postoperative changes in serum creatinine levels of all patients were collected with the use of hospital databases and medical records. AKI was defined according to RIFLE (Risk, Injury, Failure, Loss and End-stage Kidney Disease). AKI-D was defined as the need for hemodialysis during the first 6 days following cardiac surgery. We assessed the discrimination of each model using the area under the curve of the receiver operating characteristics (AUC-ROC, see Table 1) curve for prediction of AKI and AKI-D. Results A total of 966 patients were included in this study, of which 926 medical records were available for review. The procedures performed were coronary artery bypass grafting CABG (n = 733, 79%), single valve surgery (n = 79, 9%) or CABG and valve or other surgery (n = 114, 12%). Table 1 (abstract P112). AUC-ROC for four models for the prediction of AKI-D and AKI Model
n
AKI-D (95% CI)
AKI (95% CI)
Chertow
918
0.80 (67 to 93)
0.65 (58 to 72)
Thakar
928
0.95 (90 to 99)
0.77 (70 to 83)
Mehta
866
0.81 (66 to 96)
0.74 (67 to 81)
Wijeysundera
924
0.93 (90 to 97)
0.73 (67 to 80)
Critical Care 2011, Volume 15 Suppl 1 http://ccforum.com/supplements/15/S1
S41
The median change in serum creatinine was +6% (IQR –24% to +17%) during the first 6 days after surgery. AKI developed in 32 (3.4%) and in 19 (2.0%) patients classified as Risk and Injury, respectively. AKI-D developed in 13 (1.7%) patients. Table 1 shows the AUC-ROC curve value for each model (P <0.001 for all data) for the prediction of AKI and AKI-D. Conclusions The model of Thakar is the best predictor of AKI and AKI-D in our population. References
P114 In vitro evaluation of HMGB1 removal with various membranes for continuous hemofiltration M Yumoto1, O Nishida1, K Moriyama1, Y Shimomura1, T Nakamura1, N Kuriyama1, Y Hara1, S Yamada2, T Miyasho3 1 Fujita Health University School of Medicine, Toyoake, Japan; 2Shino-test Corporation, Sagamihara, Japan; 3Rakuno Gakuen University, Ebetsu, Japan Critical Care 2011, 15(Suppl 1):P114 (doi: 10.1186/cc9534)
1.
Introduction The high mobility group box 1 protein (HMGB1) is an alarmin that plays an important role in sepsis. HMGB1 is hardly removable by normal hemofiltration because of its large molecular weight of 30 kDa. Here we show the possibility of removing HMGB1 from the blood. Methods The test solution contained 100 μg HMGB1 and 35 g albumin in 1,000 ml of a substitution fluid. Experimental hemofiltration (solution flow of 100 ml/minute and ultrafiltrate flow of 1,000 ml/hour) was conducted for 360 minutes in a closed loop circulation system, and the sieving coefficient (SC) and ultrafiltrate and blood clearance rates of HMGB1 were calculated. High cut-off (HCO), AN69ST, polysulfone (PS), and polymethylmethacrylate (PMMA) membranes were tested (n = 4). Results The concentrations (means ± SD) of HMGB1 at 0, 60 and 360 minutes of hemofiltration for AN69ST (74.0 ± 11.8, 2.1 ± 1.2, and 0.5 ± 0.6 ng/ml) decreased significantly by adsorption. Relative concentrations of HMGB1 as determined by western blot analysis and the calculated clearance rates were obtained. Among the four membranes, AN69ST showed the highest capacity to adsorb HMGB1; it adsorbed 100 μg of HMGB1 in the initial 60 minutes and showed a markedly high clearance (60.8 ± 5.0 ml/minute) at 15 minutes. Although the highest SC for HMGB1 was 0.7 with the HCO membrane, which correlated with a constant filtrate clearance rate, albumin loss was observed. No such removal of both HMGB1 and albumin was observed with the PS membrane and tubing. See Figure 1.
2. 3.
4.
Chertow GM, Lazarus JM, Christiansen CL, et al.: Preoperative renal risk stratification. Circulation 1997, 95:878-884. Thakar CV, Arrigain S, Worley S, et al.: A clinical score to predict acute renal failure after cardiac surgery. J Am Soc Nephrol 2005, 16:162-168. Mehta RH, Grab JD, O‘Brien SM, et al.; Society of Thoracic Surgeons National Cardiac Surgery Database Investigators: Bedside tool for predicting the risk of postoperative dialysis in patients undergoing cardiac surgery. Circulation 2006, 114:2208-2216. Wijeysundera DN, Karkouti K, Dupuis JY, et al.: Derivation and validation of a simplified predictive index for renal replacement therapy after cardiac surgery. JAMA 2007, 297:1801-1809.
P113 Hypercalcemia during renal replacement therapy after liver transplantation J Matsumi, H Morimatsu, K Morita Okayama University Hospital, Okayama, Japan Critical Care 2011, 15(Suppl 1):P113 (doi: 10.1186/cc9533) Introduction Patients who suffer from acute kidney injury (AKI) show electrolyte abnormalities that can be corrected using renal replacement therapy (RRT). But some reports showed hypercalcemia during RRT and they reasoned this as the effect of citrate used for anticoagulant. We report eight post-liver transplantation (LT) recipients who suffered from AKI requiring RRT without citrate, but showed abnormal increase of ionized calcium (iCa) levels. Methods We retrospectively identified the recipients who suffered from AKI requiring CRRT after LT. Then we picked up those who had increased iCa over 1.25 mmol/l as hypercalcemia (group H). We compared these recipients with those who matched in graft–recipient weight ratio (G/R) and intraoperative transfusion (units/kg) as controls (group N). Data were expressed as means with standard deviations. Analyses were made using Student’s t test. We considered P <0.05 statistically significant. Results Among 250 recipients who had undergone LT in our hospital, 12 recipients received RRT. All RRT patients received nafamostat mesilate for anticoagulation. Eight patients had increased iCa (group H). All recipients in group H died during their index hospitalization. Compared with group N, group H had a higher iCa (1.3 ± 0.1 vs. 1.1 ± 0.0 mmol/l) and total bilirubin (T.Bil; 17 ± 9 vs. 4 ± 0 mg/dl). See Table 1.
Figure 1 (abstract P114). Percentage of HMGB1 remaining in the test solutions with HCO and AN69ST membrane.
Table 1 (abstract P113). Characteristics Group H
Group N
P value
G/R
0.9 ± 0.4
0.9 ± 0.3
0.5
RCC
0.3 ± 0.3
0.3 ± 0.4
0.41
Conclusions Continuous hemofiltration using HCO or AN69ST membrane will be a promising approach for HMGB1-related sepsis. Reference
FFP
0.8 ± 0.7
0.6 ± 0.5
0.33
1.
PLT
0.2 ± 0.3
0.3 ± 0.3
0.33
iCa
1.3 ± 0.1
1.1 ± 0.0
<0.01
T.Bil
17 ± 9
4 ± 0
<0.01
Conclusions We reported eight LT recipients who suffered from AKI and required RRT and had abnormally increased iCa levels without using citrate as anticoagulant. Only T.Bil was higher in the hypercalcemic group compared with the matched control. Because all of the eight hypercalcemic patients with CRRT died, this abnormality would be important for patient outcome.
Wang H, et al.: Shock 2009, 32:348-357.
P115 Sustained high-efficiency daily diafiltration using a cytokine-adsorbing membrane in the treatment of patients with severe sepsis O Nishida, T Nakamura, N Kuriyama, Y Hara, K Moriyama, M Yumoto, Y Shimomura Fujita Health University School of Medicine, Toyoake, Japan Critical Care 2011, 15(Suppl 1):P115 (doi: 10.1186/cc9535) Introduction Sustained high-efficiency daily hemodiafiltration using a cytokine-adsorbing membrane (SHEDD-fA) is an effective modality
Critical Care 2011, Volume 15 Suppl 1 http://ccforum.com/supplements/15/S1
Figure 1 (abstract P115). Decrease in blood IL-6 level over 3 days (left) and the removal ratio in one pass (right).
for sepsis treatment. Here we describe the effectiveness of SHEDD-fA, which makes the best use of three principles for solute removal, in the treatment of severe sepsis. Methods Twenty-nine septic shock patients were analyzed retrospectively. SHEDD-fA was initiated after adequate fluid resuscitation and catecholamine support. Operation conditions were QB = 150 ml/ minute, QF = 1,500 ml/hour (post-dilution) and QD = 300 to 500 ml/ minute using an HD machine over 8 to 12 hours daily. For the purpose of maximizing cytokine adsorption efficiency, we used a large-size (2.1 m2) PMMA dialyzer. Results Decrease in blood IL-6 level: SHEDD-fA was performed for 3 days. The percentage of IL-6 removed from the blood was 84.4 ± 25.8% (mean ± SD; P <0.01; n = 25; Figure 1). In addition, we simultaneously assayed both inlet and outlet IL-6 and found a 21.0 ± 13.4% (P <0.01; n = 25) removal ratio, showing that IL-6 is effectively removed after one pass through the hemofilter. Moreover, depressed monocytic HLA-DR ratio was improved from 40.6 to 51.9% in one typical case. Hemodynamics and PaO2/FiO2 improvement In 22 out of the 29 septic shock patients, significant decreases in the catecholamine index/mean blood pressure were observed 3 hours after the initiation of SHEDD-fA (P <0.01). In septic ARDS patients, PaO2/FiO2 was significantly improved at 1 hour (P <0.01). The improvement of the abovementioned parameters continued afterwards for 72 hours. As a result, 13 of 16 patients survived. Conclusions We propose the use of a large-size, cytokine-adsorbing hemofilter (PMMA or AN69 based membrane) and the selection of a suitable duration modality in the treatment of severe sepsis. P116 Model-based cardiovascular monitoring of large pore hemofiltration during endotoxic shock in pigs JA Revie1, DJ Stevenson1, JG Chase1, CE Hann1, GM Shaw2, A Le Compte1, BC Lambermont3, A Ghuysen3, P Kolh3, T Desaive3 1 University of Canterbury, Christchurch, New Zealand; 2Christchurch Hospital, Christchurch, New Zealand; 3University of Liege, Belgium Critical Care 2011, 15(Suppl 1):P116 (doi: 10.1186/cc9536)
S42
Results The model predicted the left and right ventricular enddiastolic volumes and maximum left and right ventricular pressures to mean absolute errors of 7.1% and 6.7%. Changes in the modelled right ventricular end systolic elastance and pulmonary vascular resistance compared well (R = 0.68 and 0.73) with the same metrics derived experimentally (via caval occlusion manoeuvre and four-element Windkessel model) from an earlier study on right ventricular–vascular coupling [1]. Clinically, the systemic vascular resistance (SVR) model parameter decreased initially in all four pigs and stabilised to a level 26% (on average) below baseline during hemofiltration. Hyperdynamic states were observed in two pigs, where increases in left ventricle contractility were unable to counteract the loss in SVR, resulting in decreased mean arterial pressure (MAP) and increased cardiac output (CO) in the model, consistent with the experimental measurements. In contrast, for the other two pigs, increases in SVR after hemofiltration helped maintain MAP, with CO remaining relatively constant over the duration of these trials. Conclusions Subject-specific CVS models are capable of accurately capturing acute disease-dependent hemodynamic changes due to endotoxic shock in pigs using a minimal set of measurements that are available in a typical ICU setting. Reference 1.
Lambermont B, et al.: Artif Organs 2006, 30:560-564.
P117 Different effect of CVVHDF and coupled plasma filtration and adsorption on IL-6 and procalcitonin in sepsis F Turani, M Falco, R Barchetta, F Candidi, A Marinelli, C Di Corato European Aurelia Hospital, Rome, Italy Critical Care 2011, 15(Suppl 1):P117 (doi: 10.1186/cc9537) Introduction A decrease of IL-6 and procalcitonin (PCT) correlates with survival during sepsis [1]. Coupled plasma filtration and adsorption (CPFA) supports the renal function and removes proinflammatory mediators, but few clinical studies compare the effects of CPFA and CVVHDF, the standard of care in septic patients with renal failure [2]. The aim of this study is to evaluate whether CPFA and CVVHD have a different effect on IL-6 and PCT in septic patients. Methods Seventy septic patients have been enrolled in this study. Fifty-five patients were submitted to CPFA. Every patient had four CPFA treatments (LINDA; Bellco-Mirandola, Italy) for 8 hours with Qb = 200 ml/minute, Q ultrafiltration = 30 ml/kg/hour and Q plasma = 20% of Qb. Fifteen septic patients submitted to CVVHDF were used as the control group. At T0 (basal), T1 (after 24 hours), T2 (after 76 hours), plasma IL-6 and plasma PCT was evaluated. ANOVA was used to compare changes during times study. P <0.05 was considered statistically significant. Results Tables 1 and 2 present the main results of this study. In the CPFA group at T2 IL-6 and PCT decreased to lower levels than T0, whereas in CVVHDF no significant change was observed. Hemodynamic data and adrenergic support improved more in the CPFA group than in the CVVHDF group. Table 1 (abstract P117). IL-6 and procalcitonin during CPFA CPFA IL-6 (pg/ml)
Introduction The aim of this research is to test the ability of a modelbased method to track disease-dependent hemodynamic changes in sepsis. Thus, subject-specific models of the cardiovascular system (CVS) are identified using measurements from a porcine model of septic shock with hemofiltration [1]. Methods Hemodynamic measurements were recorded every 30 minutes in four (porcine model) trials of 4 hours. Animals received a 0.5 mg/kg endotoxin infusion over the first 30 minutes and underwent zero-balance continuous venovenous filtration with 0.7 m2 large pore substrate (80 kDa cut-off ) from 60 minutes onwards [1]. Subject-specific CVS models were fitted to 34 sets of data from the four trials. Each dataset represents a minimal set of measurements available in an ICU. Identified physiological model parameters and model outputs were compared with experimentally derived indices and measurements for validation.
Procalcitonin (ng/ml)
T0
T1
T2
393 ± 87
235 ± 56
113 ± 23*
23 ± 9
16 ± 5
5 ± 2*
*P <0.001 between T2 and T0.
Table 2 (abstract P117). IL-6 and procalcitonin during CVVHDF
IL-6 (pg/ml) Procalcitonin (ng/ml)
T0
T1
T2
262 ± 67
433 ± 96
144 ± 35
18 ± 6
17 ± 7
14 ± 4
Conclusions CPFA seems more efficient then CVVHDF to remove either IL-6 or PCT and to improve hemodynamic status. Further studies are warranted to show whether these data may translate into a better clinical outcome.
Critical Care 2011, Volume 15 Suppl 1 http://ccforum.com/supplements/15/S1
References 1. 2.
Nakada et al.: Mol Med 2008, 14:257-263. Lentini P, et al.: G Ital Nefrol 2009, 6:695-703.
P118 Effectiveness of continuous venovenous hemodiafiltration using a polymethylmethacrylate membrane hemofilter judging from a multiplex suspension array system in septic shock patients Y Sakamoto1, T Miyasho2, N Kutsukata1, T Ito1, T Iwamura1, A Nakashima1, M Yahata1, K Mashiko3, H Yokota4, T Obata5 1 Saga University Hospital, Saga City, Japan; 2Rakuno Gakuen University, Sapporo, Japan; 3Chiba Hokusou Hospital, Nippon Medical School, Inzai, Japan; 4Nippon Medical School, Tokyo, Japan; 5Microbial Chemistry Research Foundation, Tokyo, Japan Critical Care 2011, 15(Suppl 1):P118 (doi: 10.1186/cc9538) Introduction Septic shock is a condition associated with diffuse coagulopathy and multiple organ failure, and frequently ends in death. The effectiveness of continuous venovenous hemodiafiltration using a polymethylmethacrylate membrane hemofilter (CVVHDF using PMMA) for critically ill patients has also been reported. This treatment was showed as cytokine adsorption therapy, but there are not so many reports in the world. Methods We treated 16 septic shock patients by CVVHDF using PMMA. The patients were checked for 17 kinds of cytokines (IL-1, IL-2, IL-4, IL-5, IL-6, IL-7, IL-8, IL-10, IL-12, IL-13, IL-17, TNFα, G-CSF, GM-CSF, IFNγ, MIP-1, MCP-1/MCAF) using a multiplex suspension array system. We also checked the PMMA column. Results The average APACHE II score and the average sepsis-related organ failure assessment (SOFA) score were 25.8 ± 12.5 and 10.1 ± 3.3 (Bio-Plex™). The survival rate was 83.3%. One day after treatment by CVVHDF using PMMA, IL-1β (P = 0.0473), IL-4 (P = 0.0206), IL-5 (P = 0.0436), IL-7 (P = 0.0061), IL-12 (P = 0.0049), IL-13 (P = 0.0150), IL-17 (P = 0.0036), IFNγ (P = 0.0308) and TNFα (P = 0.0208) were significantly decreased. And 3 days after this treatment, IL-6 (P = 0.0498), GC-SF (P = 0.0144) and MCP (P = 0.0134) were significantly decreased. Conclusions Therapies aimed at blood purification, such as CVVHDF, continuous hemofiltration (CVVHF) and plasma exchange, have been reported to be effective for the removal of inflammatory cytokines and various mediators. Few reports have shown the influence of the column used for CVVHDF on the removal efficiency of the above-mentioned factors, although several columns have been used in CVVHDF. CVVHDF using PMMA has been reported to be effective for cytokine removal. Our findings suggest that many cytokines were decreased after CVVHDF using PMMA treatment. On the other hand, we checked adsorption of many sepsis-related factors on a PMMA column. References 1.
2.
Sakamoto Y, et al.: Effectiveness of continuous hemodiafiltration using a polymethylmethacrylate membrane hemofilter after polymyxin B-immobilized fiber column therapy of septic shock. ASAIO J 2008, 54:129-132. Nakada T, et al.: Continuous hemodiafiltration with PMMA hemofilter in the treatment of patients with septic shock. Mol Med 2008, 14:257-263.
P119 Catecholamine index is a simple and useful marker for bacteremic patients treated by polymyxin B hemoperfusion therapy Y Isa, N Harayama, H Arai, T Shinjou, K Nagata, M Ueki, S Nihei, K Aibara, M Kamochi University of Occupational and Environmental Health Japan, Kitakyushu City, Fukuoka, Japan Critical Care 2011, 15(Suppl 1):P119 (doi: 10.1186/cc9539) Introduction Polymyxin B hemoperfusion therapy has been used for the treatment of sepsis to reduce blood endotoxin levels and a variety of inflammatory mediators. There are many reports that polymyxin B hemoperfusion therapy potentially improves circulatory dynamics and reduces mortality [1,2]. However, it is still controversial what is an important predictive factor to define the mortality. We analyzed a
S43
relationship between circulatory dynamics and mortality in our cases of polymyxin B hemoperfusion therapy. Methods From January 2007 to June 2010, 69 patients who received polymyxin B hemoperfusion therapy were retrospectively reviewed. Two child cases, six cases of 24-hour death and the seven cases in whom bacteremia was not detected by blood culture test were excluded. In total, for 54 patients information including characteristics, etiological microorganisms, circulatory dynamics (catecholamine index (CAI) and mean arterial pressure (MAP)), lactate concentration and mortality was investigated. We divided the patients into survivor and nonsurvivor groups and compared these two groups. The statistical analyses were performed by unpaired t test. Results Thirty-four patients (63.0%) survived and 20 patients (37.0%) died. Before polymyxin B hemoperfusion therapy, there were no significant differences in CAI, MAP and lactate concentration (CAI: 23.6 ± 26.5 (mean ± SD) vs. 34.0 ± 25.3, MAP: 69.7 ± 16.7 vs. 62.0 ± 16.7 mmHg, lactate: 4.0 ± 2.6 vs. 4.4 ± 3.6 mmol/l). But 2 hours after polymyxin B hemoperfusion therapy, only the CAI of the survivor group was significantly lower than in the nonsurvivor group (14.2 ± 14.1 vs. 30.4 ± 25.5; P <0.01). However, MAP and lactate concentration did not show significant differences between the two groups (MAP: 80.1 ± 13.0 vs. 78.0 ± 15.4, lactate: 2.5 ± 1.3 vs. 3.6 ± 3.2). At 24 hours after polymyxin B hemoperfusion therapy, the CAI difference between the two groups was became more remarkable (6.09 ± 9.02 vs. 27.18 ± 29.31; P <0.01). Conclusions The CAI after polymyxin B hemoperfusion therapy was highly related to mortality, although the CAI before that therapy was not. Polymyxin B hemoperfusion therapy improve the circulatory dynamics of most sepsis patients, but the efficacy of that therapy to decreasing catecholamine is one of the important prognosis predictors for bacteremic patients. References 1. 2.
Cruz DN, et al.: JAMA 2009, 301:2445-2451. Cruz DN, et al.: Crit Care 2007, 11:R47.
P120 Re-evaluation of direct hemoperfusion with polymyxin-B immobilized fiber for severe sepsis and septic shock SM Matsuo, TI Ikeda, KI Ikeda Tokyo Medical University, Hachioji Medical Center, Tokyo, Japan Critical Care 2011, 15(Suppl 1):P120 (doi: 10.1186/cc9540) Introduction The equivalency of continuous venovenous hemofiltration and intermittent hemodialysis (2B) was described as a key recommendation of the Surviving Sepsis Campaign guidelines in 2008. However, there are some discrepancies associated with the evaluation of blood purification in severe sepsis and septic shock in Japan. Direct hemoperfusion with polymyxin-B immobilized fiber (PMX-DHP), developed and currently in use in Japan, has not yet been evaluated abroad. We performed a retrospective study to re-evaluate PMX-DHP for severe sepsis or septic shock patients in our ICU. Methods We enrolled 302 patients (survival (S) group: 201, nonsurvival (NS) group: 101) in whom PMX-DHP had been performed for severe sepsis and septic shock from 1994 to 2010. These patients were allocated into two groups: those who survived for at least 28 days after the start of PMX-DHP therapy (S group: 201 patients) and those who did not (NS group: 101 patients). Background factors (age, gender, APACHE II scores, sepsis-related organ failure assessment score, Goris multiple organ failure (MOF) score), hemodynamics (blood pressure, PaO2/FiO2 ratio, catecholamine requirement), inflammatory mediators (IL-6, IL-8, IL-1ra), endothelial-related markers (PAI-1, ELAM-1) and procalcitonin levels were examined in each group. Results On background factors, only the Goris MOF score showed a statistically significant difference among the groups. Blood pressure and the PaO2/FIO2 ratio both improved markedly immediately after PMX-DHP. Also, the average required amount of catecholamine decreased after PMX-DHP. IL-6 and IL-1ra levels decreased immediately after PMX-DHP in both groups, but these values before PMX-DHP did not show any statistically significant difference between the groups. PAI-1 levels showed a significant decrease after PMX-DHP in both groups.
Critical Care 2011, Volume 15 Suppl 1 http://ccforum.com/supplements/15/S1
Conclusions We confirmed an improvement in pulmonary oxygenation and hemodynamic parameters using PMX-DHP for severe sepsis and septic shock patients. The levels of various inflammatory mediators decreased using PMX-DHP, but we did not find any correlation between these changes and outcome. P121 Extended duration of direct hemoperfusion with polymyxin B-immobilized fiber column improves hemodynamics in patients with septic shock C Yamashita1, Y Takasaki2 1 Uwajima Social Insurance Hospital, Uwajima, Japan; 2Uwajima Municipal Hospital, Uwajima, Japan Critical Care 2011, 15(Suppl 1):P121 (doi: 10.1186/cc9541) Introduction Endotoxin adsorption therapy by direct hemoperfusion with a polymyxin B-immobilized fiber column (PMX-DHP) has been widely used in patients with septic shock in Japan. Many Japanese doctors use each PMX cartridge only for 2 hours; however, the mechanisms and optimal duration of PMX treatment remain unclear. We have performed PMX-DHP for longer than 2 hours to confirm that an extended duration of PMX-DHP for patients with septic shock would give significant improvements of hemodynamics. Methods We performed an extended PMX-DHP on 13 patients whose hemodynamics did not achieved the target of mean arterial pressure (MAP) >65 mmHg and inotropic score <5.0 at the time point of 2 hours after PMX-DHP. Hemodynamic parameters such as MAP, heart rate and the dose of vasoactive agents were assessed before treatment, 2 hours after the start of PMX-DHP, immediately and 24 hours after completion of PMX-DHP. The following were also recorded during the study: microbiological data, the APACHE II score, the Sequential Organ Failure Assessment (SOFA) score and 28-day mortality. Results APACHE II and SOFA scores were 26.0 ± 9.0 and 10.4 ± 3.0, respectively. The 28-day mortality rate was 15.4%. The average duration of PMX-DHP was 14.9 ± 7.5 hours. PMX-DHP was well tolerated and showed no side effect over extended duration in treatment. MAP was increased: 64.2 ± 8.8 mmHg (baseline), 79.7 ± 10.5 mmHg (2 hours after the start of PMX-DHP), 88.4 ± 13.8 mmHg (immediately after completion) and 89.8 ± 12.8 mmHg (24 hours after completion). The inotropic score was also decreased: 16.4 ± 9.2 (baseline), 13.5 ± 7.2 (2 hours after the start of PMX-DHP), 5.7 ± 6.8 (immediately after completion) and 2.8 ± 3.6 (24 hours after completion). These improvements for 2 hours were statistically significant (P <0.01). Conclusions The hemodynamics kept improving during extended duration of DHP with one PMX cartridge. And we could use these cartridges safely. Thus we suggest that an extended duration of PMX treatment affords beneficial effects and may contribute to improve the mortality of patients with septic shock. P122 Use of activated clotting time to monitor anticoagulation in patients receiving unfractionated heparin on renal replacement therapy A Bidwai1, R Sundaram2 1 RLUH, Liverpool, UK; 2RAH, Glasgow, UK Critical Care 2011, 15(Suppl 1):P122 (doi: 10.1186/cc9542) Introduction The aim of our study was to determine the correlation between activated clotting time (ACT) and APTT values in patients receiving unfractionated heparin (UFH) for renal replacement therapy (RRT). Methods A retrospective analysis was made of case notes and laboratory data of 39 critically ill patients who were on UFH for RRT over a 1-year period. There were 183 paired APTT and ACT measurements done at the same time (29 patients). APTT was done at the laboratory and ACT was done at the bedside using an ACTALYKE monitor (Array Medical). Target APTT and ACT ranges for UFH during RRT were 45 to 55 seconds (control 27 to 32 seconds) and 250 to 270 seconds (control 180 to 220 seconds). Datasets were divided into three groups and the correlation coefficient (Pearson’s) was calculated using SPSS software.
S44
Table 1 (abstract P122). ACT versus APTT High ACT
Low
Normal
High APTT
35
70
36
Low
0
29
2
Normal
1
7
0
Figure 1 (abstract P122). Scatterplot of ACT versus APTT.
Results Mean APTT was 129.5 ± 68.29 (range 25.6 to 360) seconds and mean ACT was 234.6 ± 47.02 (range 125 to 387) seconds. APTT and ACT values were divided into three datasets in a 3 x 3 table. There was no correlation between APTT and ACT values (kappa score being 0.12). There were more above-range APTT values (140/183) against aboverange ACT values (36/183). See Table 1 and Figure 1. Conclusions Our data demonstrate that monitoring of anticoagulation with UFH using ACT cannot be recommended. Reference 1.
Waele JJ, et al.: The use of activated clotting time for monitoring heparin therapy in critically ill patients. Intensive Care Med 2003, 29:325-328.
P123 Single-dose application of antithrombin III as alternative anticoagulation during extracorporeal therapy in critically ill patients with advanced liver cirrhosis: a retrospective data analysis R Brunner, C Madl, W Druml, U Holzinger Medical University of Vienna, Austria Critical Care 2011, 15(Suppl 1):P123 (doi: 10.1186/cc9543) Introduction Adequate anticoagulation is essential to achieve efficient and cost-effective renal and liver replacement therapy. However, critically ill patients with advanced liver cirrhosis are associated with low antithrombin III (ATIII) serum levels and increased tendency to both coagulation and bleeding disorder. Thus, we hypothesized that singledose application of antithrombin III prolongs filter lifetime during renal and liver replacement therapy in critically ill patients with advanced liver cirrhosis without causing additional bleeding problems. Methods In this retrospective study, data of 33 extracorporeal therapies in nine critically ill patients with advanced liver cirrhosis admitted to a medical ICU in 2007 and 2008 were analyzed. Included patients underwent either continuous renal replacement therapy (CRRT), intermittent hemodialysis (IHD) or liver replacement using the molecular adsorbents recirculation system (MARS) with single doses of ATIII as sole anticoagulant. Bleeding complications and filter lifetimes were used as outcome parameters. Results Data were available for 13 CRRT, 14 IHD, and six MARS filters with total filter lifetimes of 661 (CRRT), 66 (IHD), and 42 hours (MARS), respectively. Mean filter lifetimes were 44.0 ± 27.9 (CRRT), 4.7 ± 1.6 (IHD), or 4.6 ± 12.6 hours (MARS). Fifteen percent (two out of 13) of CRRT filters, 7% (one out of 14) of IHD filters and 0% (zero out of six) of MARS filters were lost due to clotting of the dialysis circuit. New onset of bleeding was not observed during IHD, MARS and CRRT.
Critical Care 2011, Volume 15 Suppl 1 http://ccforum.com/supplements/15/S1
Conclusions Our data suggest that single-dose application of ATIII is effective and safe as alternative anticoagulation in critically ill patients with advanced liver cirrhosis. However, prospective controlled trials are necessary to confirm our findings. P124 Safety of drotrecogin alfa (activated) treatment in patients with severe sepsis on renal replacement therapy without additional anticoagulation L Mirea, I Luca Vasiliu, R Ungureanu, A Balanescu, I Grintescu Clinical Emergency Hospital, Bucharest, Romania Critical Care 2011, 15(Suppl 1):P124 (doi: 10.1186/cc9544) Introduction Patients with sepsis-induced acute renal failure on continuous renal replacement therapy (CRRT), who receive heparin, may be at higher risk of bleeding when drotrecogin alfa activated (DAA) is administered in addition to standard anticoagulation, especially surgical patients. There are some previous observations that no additional anticoagulation is necessary during simultaneous DAA infusion and CRRT. The aim of this study was to evaluate the safety of CRRT during DAA infusion without additional anticoagulant therapy. Methods An observational, prospective study was conducted in an adult ICU. Sixteen surgical patients with severe sepsis on CRRT were divided into two groups: group A (eight patients) with DAA infusion, group B (eight patients) without DAA infusion. Baseline demographics, APACHE II score, serious bleeding events, and in-hospital mortality were reported. CRRT was performed using the Multifiltrate® system, heparin-free continuous venovenous hemodialysis mode in group A. After the completion of the DAA infusion, intravenous standard heparin was administered for the remaining time on hemofiltration. In group B concomitant heparin was administered as necessary to achieve an aPTT of approximately 60 seconds. Results The mean filter survival time (defined as the time until the circuit clotted) was 30 hours on DAA infusion versus 22 hours after DAA infusion in group A and 19.6 hours in group B. All survivors had recovery of dialysis-free renal function. The mean APACHE II score was 31.25 in group A and 22.12 in group B. Hospital mortality was 50% in group A (4/8) and 37.5% in group B (3/8); no mortality was attributed to bleeding. One case of severe thrombocytopenia was recorded with premature interruption of DAA infusion. The need for transfusion of blood and blood products infusion was compared (61% during DAA infusion vs. 52% after DAA infusion; 55% in group B); no serious bleeding event in both groups. Conclusions The use of DAA in patients with severe sepsis requiring RRT is safe and is not associated with an increased of major bleeding events. No additional anticoagulation is necessary during simultaneous DAA infusion and CRRT. References 1. 2. 3.
Camporota L, et al.: Crit Care 2008, 12:R163. de Pont AC, et al.: Crit Care 2009, 13:113. Payen D, et al.: Surgery 2007, 141:548-561.
S45
of red blood cells (RBC) transfused during the course of RRT and for 24 hours after. Results In total, 156 patients were treated with RRT during the 6-month period. One hundred and forty-two patients received a single type of anticoagulation throughout the whole course of RRT (heparin via the circuit or systemically, n = 85; citrate, n = 12; epoprostenol, n = 45). Among patients without overt clinical bleeding episodes, the number of RBCs needed per day of RRT to maintain Hb at 8 g/dl was 0.5 units on citrate, 0.6 units on heparin and 0.6 units on epoprostenol (P = NS). Among 14 patients who had clinically recognized bleeding problems and did not change their anticoagulation, the requirements for RBC transfusion were 4.8 units/day in patients on heparin, 2.8 units/ day on epoprostenol and 1.7 units on citrate (P = NS). In 11 patients, anticoagulation was changed during the course of RRT because of bleeding problems. Of the seven patients started on heparin, three were changed to citrate and four to epoprostenol. Four patients had a change from epoprostenol to citrate. Change from heparin to citrate resulted in reduced transfusion requirements from 0.8 units RBC per RRT day to 0.6 units per day (P = NS). Changing from heparin to epoprostenol was associated with a reduction from 8.1 to 0.73 units RBC per day on RRT (P = NS). Conclusions Citrate-based anticoagulation for RRT in patients with contraindications to heparin was not associated with lower transfusion requirements. P126 Economic argument for citrate haemofiltration J Patterson, D Laba, M Blunt Queen Elizabeth Hospital, King’s Lynn, UK Critical Care 2011, 15(Suppl 1):P126 (doi: 10.1186/cc9546) Introduction Regional citrate anticoagulation is associated with increased mean filter life and greater completion of scheduled filter life compared with heparin [1]. Studies report mean filter lifespans of 44 hours [2] and that 80% of patients reach 72 hours [3]. The potential cost saving from this reduced filter kit purchase is only realised if the treatment is stopped due to filter clotting and needs to be recommenced. In order to identify this we set out to evaluate the filter life and stopping reason for CVVHF treatment in general critically ill patients. Methods One hundred sequential patients receiving CVVHF were identified. For each patient, the number of treatments, filter life and reason for stopping treatment were recorded. A subset of treatments in which stopping was due to filter clotting and therapy resumed was identified. These were then analysed to see how many filtration sets could be saved if the filter life was 44 hours [2]. Sensitivity analysis was performed based on a 50% change in filter life improvement. Results A total of 304 filter sets were used in 100 patients (one to 14 per patient) – median duration 18.3 hours (IQR 8.5 to 38.3) (Table 1). Cost analysis demonstrated 75 filters could be saved if filter lives were prolonged to 44 hours, equivalent to €4.01/treatment-hour (€3.26 to €5.03). Table 1 (abstract P126). Treatments by stopping reason
P125 Association between type of anticoagulation and blood transfusion requirements during renal replacement therapy in the ICU A Iyer, J Ewer, L Tovey, H Dickie, M Ostermann Guy’s & St Thomas’ Foundation Hospital, London, UK Critical Care 2011, 15(Suppl 1):P125 (doi: 10.1186/cc9545) Introduction Renal replacement therapy (RRT) is an essential component of modern critical care. Anticoagulation is necessary to prevent premature clotting of the extracorporeal circuit. We aimed to determine whether regional anticoagulation with citrate is associated with the reported reduced need for blood transfusions compared with heparin or epoprostenol. Methods We retrospectively analysed all of the adult patients who received RRT in the general ICU at Guy’s & St Thomas’ Hospital, London between October 2008 and March 2009. Our first-line anticoagulation was heparin delivered via the circuit. It was clinical practice to maintain patients’ haemoglobin (Hb) at 8 g/dl. We calculated the number of units
Stopping reason
Access
Filter clot
Treatment resumed
Yes
Yes
n
10
149
41
100
4
304
16
38.0
22.8
11.2
18.3
Duration 13.4 (median) (hours)
End Elective therapy Miscellaneous Total Yes
No
Yes
Conclusions Prolonged filter life associated with citrate CVVHF leads to a potential saving of €4.01/treatment-hour. This information is of benefit when considering the business case for introducing citrate continuous venovenous haemofiltration. References 1. 2. 3.
Bagshaw SM, et al.: J Crit Care 2005, 20:155-161. Mehta et al.: J Am Soc Nephrol 1993, 4:368. Slowinski T, et al.: Crit Care 2010, 14(Suppl 1):p518.
Critical Care 2011, Volume 15 Suppl 1 http://ccforum.com/supplements/15/S1
P127 Multicenter prospective observational study on safety and efficacy of regional citrate anticoagulation in CVVHD in the presence of liver failure: the Liver Citrate Anticoagulation Threshold Study (L-CAT) T Slowinski1, S Morgera2, M Joannidis3, T Henneberg4, R Stocker5, E Helset4, K Andersen6, M Wehner2, J Kozik-Jaromin7, S Brett8, J Hasslacher3, JF Stover5, H Peters2, HH Neumayer2, D Kindgen-Milles8 1 Charité CCM, Berlin, Germany; 2Department of Nephrology, Charité CCM, Berlin, Germany; 3Department of Internal Medicine I, Medical University, Innsbruck, Austria; 4Department of Visceral and Transplant Surgery, Charité CVK, Berlin, Germany; 5Surgical Intensive Care, University Hospital, Zurich, Switzerland; 6Department of Acute Medicine, University Hospital, Oslo, Norway; 7Clinical Research, Fresenius Medical Care, Bad Homburg, Germany; 8 Department of Anaesthesiology, University Hospital, Duesseldorf, Germany Critical Care 2011, 15(Suppl 1):P127 (doi: 10.1186/cc9547) Introduction Regional citrate anticoagulation in continuous venovenous hemodialysis (citrate-CVVHD) has become a widely used technique in the ICU, which decreases risk of bleeding. However, concern exists about safety of citrate in liver failure patients. The aim of our study was to evaluate safety and efficacy of regional citrate anticoagulation in ICU patients with normal and impaired liver function. Methods One hundred and thirty-three consecutive adult ICU patients were prospectively observed for 72 hours of citrate-CVVHD. Patients were stratified into three groups according to their serum bilirubin (mg/dl) (normal: ≤2, n = 47, mild: >2 to ≤7, n = 44, severe: >7, n = 42). Citrate-CVVHD was performed with variable treatment dose using the multiFiltrate device (Fresenius Medical Care, Germany). End-points for safety were: severe acidosis or alkalosis (pH ≤7.2; ≥7.55) and severe hypocalcemia or hypercalcemia (≤0.9; ≥1.5 mmol/l) of any cause. Endpoint for efficacy was the filter lifetime. Results Main types of ICU admission were: 56% medical and 38% post-surgery. Liver failure was predominantly due to ischemia (39%) or multiple organ dysfunction syndrome (27%). The frequency of safety end-points of any cause did not differ between the three patient strata: severe alkalosis (normal: 2%, mild: 0%, severe: 5%; P = 0.41); severe acidosis (normal: 13%, mild: 16%, severe: 14%; P = 0.95); severe hypocalcemia (normal: 8%, mild: 16%, severe: 12%; P = 0.57); severe hypercalcemia (0% in all strata). Only in three patients was an increased ratio of total to ionized calcium (≥2.5) detected (2%). Overall filter lifetime was 49% after 72 hours; however, after censoring for discontinuation due to non-clotting causes (for example, renal recovery, death) 96% of all filters were running after 72 hours. Conclusions Our data demonstrate that citrate-CVVHD can be safely used in patients with liver dysfunction. Furthermore, it yields excellent filter patency and avoids bleeding, and thus can be recommended also in patients with liver dysfunction. P128 Regional citrate anticoagulation in high-volume continuous venovenous hemodialysis R Kalb1, J Ammann1, T Slowinski2, S Morgera2, D Kindgen-Milles1 1 University Hospital, Düsseldorf, Germany; 2Charité, Berlin, Germany Critical Care 2011, 15(Suppl 1):P128 (doi: 10.1186/cc9548) Introduction Regional citrate anticoagulation (RCA) is a new anticoagulation mode for continuous renal replacement therapy (CRRT). Compared with heparin anticoagulation, RCA prolongs filter lifetime, decreases transfusion requirements, and yields good metabolic control [1,2]. However, RCA was not investigated in patients requiring dialysis doses of >3 l/hour because of severe metabolic derangements or obesity. We investigated whether RCA for CVVHD is safe and effective also in patients in need of such intensified treatment. We focused on the filter lifetime, delivered dialysis dose, and control of acid–base balance. Methods In a prospective observational study we enrolled 75 patients with acute kidney failure (AKF) following extended surgery. Highvolume CVVHD was applied using RCA for at least 72 hours. Minimum dialysis dose was targeted at 45 ml/kg/hour. According to the protocol, for effective anticoagulation, a citrate dose of 4 mmol/l blood and a calcium infusion of 1.7 mmol/l dialysate was required. We measured
S46
arterial blood gases and levels of ionized calcium pre-filter and postfilter every 4 hours. Blood flow, dialysis dose and doses of citrate and calcium were registered as well as filter lifetime and the reason for downtime. Results The mean dialysis dose during the first 72 hours of treatment was 49 ± 14 ml/kg/hour, corresponding to a dialysate flow of 3,736 ± 88 ml/hour. Mean blood flow was 177 ± 4 ml/minute. The mean citrate dose applied during the first 72 hours was 3.83 ± 0.07 mmol/l. The mean calcium dose was 1.85 ± 0.06 mmol/l. Severe hypocalcemia/ hypercalcemia did not occur. In one case an increasing demand for calcium substitution occurred after 84 hours that was indicative of citrate accumulation but the total/ionized calcium index was never higher than 2.5. After 72 hours of CVVHD, acidosis (pH <7.35) occurred in 7% (5/75) of all patients, an alkalosis (pH >7.45) in 22% (16/73) while 71% (52/73) showed a normal pH. Mean filter lifetime was 78 ± 2 hours. Thirteen treatments were stopped because of filter clotting, in all the remaining 87 filters stopping of treatment was caused by other reasons (surgery, diagnostic procedures, restored diuresis, death). There were no bleeding complications related to renal replacement therapy. Inhospital mortality was 57% (43/75). Conclusions Regional citrate anticoagulation for CVVHD is safe and effective to deliver a high dialysis dose, to control acid–base status, and to yield excellent filter lifetimes in postoperative AKF. References 1. 2.
Monchi M, et al.: Intensive Care Med 2004, 30:260-265. Morgera S, et al.: Crit Care Med 2009, 37:2018-2024.
P129 Systemic citrate load during continuous renal replacement therapy is not negligible and can be predicted using indirect methods M Zakharchenko1, M Balik1, M Otahal1, J Hruby1, J Vavrova2, A Jabor3 1 First Faculty of Medicine Charles University and General University Hospital, Prague, Czech Republic; 2University Hospital, Hradec Kralove, Czech Republic; 3 IKEM, Prague, Czech Republic Critical Care 2011, 15(Suppl 1):P129 (doi: 10.1186/cc9549) Introduction Data on significance of systemic gain of citrate during continuous renal replacement therapy (CRRT) are missing. Direct citrate measurements are scarcely available. The quantification using a difference of unmeasured anions (UA) on the filter and the method using correlation between concentration of citrate (Cf ) in effluent to the proportion of citrate flow to blood flow (Qc/Qb) were compared with the control exact methods. Methods A prospective controlled observational study was performed in a 20-bed general ICU. Patients on 2.2% acid-citrate-dextrose (ACD, n = 41) were compared with controls on unfractioned heparin (n = 17). All were treated with an Aquarius Baxter device on 1.9 m2 polysulfone filters. Samples were taken from a central venous catheter, ports pre filter and post filter and from dialysate/filtrate 24 hours after commencing with CRRT and 60 minutes later. Results There were no significant differences (P >0.05) between CVVH (n = 18) and CVVHDF (n = 23) in measured citratemias nor in systemic gain of citrate. The difference between post-filter and pre-filter UA correlated with difference of citrate concentrations (r2 = 0.66). Citrate gain was calculated as 31.5 ± 10.5 mmol/hour utilizing this relationship. Cf showed tight correlation with the Qc/Qb ratio (r2 = 0.72). Gain of citrate calculated as citrate input minus citrate removal (effluent flow x Cf ) where the regression equation replaces Cf was 29.4 ± 7.2 mmol/ hour. The first exact method used post-filter and pre-filter citrate concentrations multiplied by matching blood flows. Gain of citrate obtained by this method was 29.3 ± 11.0 mmol/hour. The second exact method deducted citrate removal (15.7 ± 5.9 mmol/hour) in effluent from citrate input (45.1 ± 8.8 mmol/hour) and produced a citrate gain of 29.3 ± 7.2 mmol/hour. Comparing two studied methods of citrate gain estimation with exact methods showed no significant differences (P = 0.5, Kruskal–Wallis ANOVA). Bland–Altman analysis showed no systematic bias in results. Conclusions Systemic load of citrate is not negligible and can be predicted without taking direct citrate levels. Proposed indirect methods showed reasonable accuracy in systemic citrate load estimation.
Critical Care 2011, Volume 15 Suppl 1 http://ccforum.com/supplements/15/S1
P130 Use of 2-hourly creatinine clearance to inform cessation of renal replacement therapy O Solymos1, S Frohlich2, N Conlon1 1 St Vincent’s University Hospital, Dublin, Ireland; 2St James’s Hospital, Dublin, Ireland Critical Care 2011, 15(Suppl 1):P130 (doi: 10.1186/cc9550) Introduction Acute kidney injury (AKI) is a common problem in critically ill patients, with a reported incidence of 1 to 25% and a poor prognosis. Although optimal dosing of renal replacement therapy (RRT) is relatively well understood, appropriate timing of commencing and ceasing RRT in patients with AKI has been under debate for a long time. From the viewpoint of an early renal support strategy, the goal of early RRT is to maintain solute clearance and fluid balance to prevent subsequent multiorgan damage, while waiting for the recovery of renal function. It has previously been noted that 2-hourly creatinine clearance accurately reflects the more cumbersome 24-hour value [1]. The aim of the present study was to evaluate whether routine measurement of creatinine clearance (CrCl) could help to predict when to cease dialysis, and determine what value for CrCl best predicted remaining dialysis-free in critically ill patients receiving CRRT. Methods Two-hourly creatinine clearance is calculated daily on most patients on CRRT in our ICU. If CrCl is greater than 20 ml/minute, CRRT is ceased. Our retrospective chart review examined records for all patients admitted to our ICU in 2008 and determined whether a CrCl greater than 20 ml/minute accurately predicted remaining dialysis-free 5 days later. Results Forty-one patients were suitable for analysis. Of these, 12 (30%) never reached CrCl >20 ml/minute and remained on dialysis leaving the ICU. Of the remaining 29 patients, in 23 (79%) having a CrCl >20 ml/ minute meant they remained dialysis-free for at least the following 5 days. Six patients (21%), despite having a CrCl >20 ml/minute, resumed dialysis within 5 days for metabolic or fluid-removal reasons. Conclusions Although this is a small retrospective study it suggests that 2-hourly creatinine clearance values may accurately predict when CRRT should be discontinued. These pilot results should be used to inform a larger prospective study. Reference 1.
Herrera-Gutiérrez ME, Seller-Pérez G, Banderas-Bravo E, et al.: Replacement of 24-h creatinine clearance by 2-h creatinine clearance in intensive care unit patients: a single-center study. Intensive Care Med 2007, 33:1900-1906.
P131 NT-proBNP, troponin I and troponin T are elevated in ARDS patients without structural heart disease: a single initial reading of cardiac markers is not different from serial daily readings Y Nassar, D Monsef, S Abdelshafy, G Hamed Cairo University, Cairo, Egypt Critical Care 2011, 15(Suppl 1):P131 (doi: 10.1186/cc9551) Introduction Myocardial injury and cardiac marker elevation may occur in ARDS patients without a structural heart disease, which might affect cardiac markers [1,2]. Methods The study was conducted in Cairo University Hospital between 1 June 2008 and 1 April 2009. The inclusion criterion was any adult patient diagnosed to have ARDS according to the criteria of the American–European Consensus Conference of 1994. Exclusion criteria were any pre-existing structural heart disease, pulmonary embolism, atrial fibrillation, renal insufficiency, age <18. Plasma levels of cardiac markers NT-proBNP, troponin I and troponin T were measured on day 0 and on day 2 and day 7 of ARDS diagnosis. All patients benefited from mechanical ventilation with a lung-protective ventilation strategy according to the NHBLI ARDS Network Treatment Protocol. Results The study comprised a total of 20 patients with mean age of 58.9 ± 20.69 years, 11 men versus nine women (P> 0.05). The ARDS aetiology was five (25%) patients due to sepsis, four (20%) due to pneumonia, three (15%) aspiration, three (15%) lung contusions due to road traffic accidents (RTA), two (10%) drug overdose, one (5%) burns, one (5%) pancreatitis, one (5%) drowning. NT-proBNP mean values were 8,903.3 ± 12,852.8 versus 6,083.6 ± 8,467.9 versus 9,914.8 ± 12,574.1 on
S47
day 0, day 2 and day 7, respectively (P >0.05). Troponin I mean values were 3.0 ± 7.7 versus 2.2 ± 6.6 versus 1.5 ± 4.4 on day 0, day 2 and day 7, respectively (P >0.05). Troponin T mean values were 0.3 ± 0.6 versus 0.6 ± 1.5 versus 0.5 ± 1.1 on day 0, day 2 and day 7, respectively (P >0.05). Conclusions ARDS patients with structurally normal hearts show persistent elevated levels of cardiac markers NT-proBNP, troponin I and troponin T over the first week with no significant change between levels of day 0, day 2 and day 7. A single reading of cardiac markers on any day of the first week of ARDS may not be different from serial daily readings. References 1. 2.
Phua J, et al.: B-type natriuretic peptide: issues for the intensivist and pulmonologist. Crit Care Med 2005, 33:2094. Leuchte et al.: Clinical significance of brain natriuretic peptide in primary pulmonary hypertension. J Am Coll Cardiol 2004, 43:764.
P132 Comparison of three different multi-analyte point-of-care devices during clinical routine on a medical ICU V Stadlbauer1, S Wallner1, T Stojakovic2, KH Smolle1 1 University Hospital Graz, Austria; 2Clinical Institute of Medical and Chemical Laboratory Diagnostics, Medical University of Graz, Austria Critical Care 2011, 15(Suppl 1):P132 (doi: 10.1186/cc9552) Introduction Multi-analyte point-of-care (POC) devices are important to guide clinical decisions in critical care. However, the use of different devices in one hospital might cause problems. We therefore evaluated three commonly used POC devices and analysed accuracy, reliability and bias. Methods Seventy-four arterial blood samples were analysed with three POC devices (Cobas, Roche (CO); ABL800 Flex, Radiometer (ABL); Gem Premiere, Instrumentation Laboratory (IL)). For selected parameters, samples were also analysed in the central laboratory. pCO2, pO2, SO2, bicarbonate and standard bicarbonate (HCO3 and HCO3std), sodium, potassium, calcium, pH, lactate, base excess (BE(B) and BEecf ), glucose, hemoglobin and hematocrit were compared. Results For most parameters only minor, although statistically significant, changes were observed between the POC devices. For pO2, BE(B), hemoglobin and hematocrit, clinically significant differences were found. When for example looking at a pO2 of 60 mmHg, in six out of 74 samples, IL and/or CO showed a pO2 below 60 mmHg and ABL showed a pO2 of above 60 mmHg. For hematocrit and hemoglobin, differences between the devices would result in different decisions regarding the use of packed red cells in 11 to 19% of the samples. For BE(B) in a total of 15% of measurements, the results obtained from the different devices would not agree whether a BE(B) is normal or not. Conclusions Although POC devices are of high standard and overall comparability between devices is high, there might be a clinically relevant bias between devices, as found in our study for pO2, BE(B), hemoglobin and hematocrit. This can be of importance when interpreting results of the same patient obtained from different POC devices, as could happen when a patient is transferred within a hospital where different devices are used. P133 Appropriate regulation of routine laboratory testing can reduce the costs associated with patient stay in intensive care K Goddard, SJ Austin Mater Hospital, Belfast, UK Critical Care 2011, 15(Suppl 1):P133 (doi: 10.1186/cc9553) Introduction Traditionally within our ICU, comprehensive daily bloods were taken on a routine basis without direct clinician involvement. Such routine blood testing can be costly [1], time consuming, labour intensive, and can contribute to patient anaemia [2]. Recognising these concerns, a new clinician-centred system for ordering blood tests was implemented in July 2010. This was based on a blood investigation order chart completed by medical personnel to specify the blood tests required for individual patients for the following day. The objective of
Critical Care 2011, Volume 15 Suppl 1 http://ccforum.com/supplements/15/S1
this audit was therefore to assess whether the implementation of the blood investigation order chart reduced the number of blood tests performed and the associated costs. Methods Data on the numbers and types of blood investigations were collated for all patients with a length of stay greater than 24 hours in our six-bed critical care unit. The audit period covered 100 days prior to implementation of the order chart and 100 days post implementation. The blood tests assessed were; full blood picture (FBP), urea and electrolytes (U&E), coagulation screen, liver function tests (LFT), magnesium, bone profile (Ca, PO4 and albumin), and C-reactive protein (CRP). A comparative analysis of the numbers, types and costs of blood testing pre and post implementation was conducted. The study did not seek to assess patient outcomes mainly due to the small number of patients involved. Results The implementation of the ordering chart resulted in a reduction in the number of blood investigations ordered, from a total of 2,209 pre implementation to 1,477 post implementation; that is, a 33% net reduction. The tests that showed the largest reductions were coagulation screens, LFT and bone profiles, with reductions of 52%, 54% and 53%, respectively. A moderate reduction was observed in magnesium and CRP tests, at 43% and 21% respectively. Only a very small reduction in the number of FBP and U&E tests was found. When the financial costs of these reductions are assessed, the analysis showed an overall saving for the ICU of £17,914 per annum, or £2,986 per bed. Conclusions The results of this audit suggests that the implementation of simple low-cost measures, such as a blood investigation order chart to specify and customise blood testing in the ICU, can significantly reduce the costs associated with patient stay in the ICU. References 1. 2.
Prat G, et al.: Intensive Care Med 2009, 35:1047–1053. Chant C, et al.: Crit Care 2006, 10:R40.
P134 Contribution of red blood cells to the compensation for hypocapnic alkalosis through plasmatic strong ion difference variations T Langer, L Zani, E Carlesso, A Protti, P Caironi, M Chierichetti, ML Caspani, L Gattinoni Università degli Studi di Milano, Milan, Italy Critical Care 2011, 15(Suppl 1):P134 (doi: 10.1186/cc9554) Introduction Chloride shift is the movement of chloride between red blood cells (RBC) and plasma (and vice versa) caused by variations in pCO2. The aim of our study was to investigate changes in plasmatic strong ion difference (SID) during acute variations in pCO2 and their possible role in the compensation for hypocapnic alkalosis.
Figure 1 (abstract P134). *P <0.05 versus first quartile. §P <0.05 versus second. #P <0.05 versus third. One-way ANOVA.
S48
Methods Patients admitted in this year to our ICU requiring extracorporeal CO2 removal were enrolled. Couples of measurements of gases and electrolytes on blood entering (v) and leaving (a) the respiratory membrane were analyzed. SID was calculated as [Na+] + [K+] + 2[Ca2+] – [Cl–] – [Lac–]. Percentage variations in SID (SID%) were calculated as (SIDv – SIDa) x 100 / SIDv. The same calculation was performed for pCO2 (pCO2%). Comparison between v and a values was performed by paired t test or the signed-rank test, as appropriate. Results Analysis was conducted on 205 sample-couples of six enrolled patients. A significant difference (P <0.001) between mean values of v–a samples was observed for pH (7.41 ± 0.05 vs. 7.51 ± 0.06), pCO2 (48 ± 6 vs. 35 ± 7 mmHg), [Na+] (136.3 ± 4.0 vs. 135.2 ± 4.0 mEq/l), [Cl–] (101.5 ± 5.3 vs. 102.8 ± 5.2 mEq/l) and therefore SID (39.5 ± 4.0 vs. 36.9 ± 4.1 mEq/l). pCO2% and SID% significantly correlated (r2 = 0.28, P <0.001). Graphical representation by quartiles of pCO2% is shown in Figure 1. Conclusions As a reduction in SID decreases pH, the observed movement of anions and cations probably limited the alkalinization caused by hypocapnia. In this model, the only source of electrolytes are blood cells (that is, no interstitium and no influence of the kidney is present); it is therefore conceivable to consider the observed phenomenon as the contribution of RBC for the compensation of acute hypocapnic alkalosis.
P135 Interactive visual analysis of a large ICU database: a novel approach to data analysis H Gan1, K Matkovic2, A Ammer2, W Purgathofer2, D Bennett1, M Terblanche3 1 Guy’s & St Thomas’ Hospital, London, UK; 2VRVIS Research Centre, Vienna, Austria; 3King’s College London, London, UK Critical Care 2011, 15(Suppl 1):P135 (doi: 10.1186/cc9555) Introduction ICUs generate vast amounts of valuable data. The size and complexity of the data make analysis technically demanding and time-consuming. We used interactive visual analysis (IVA) to analyse a large ICU database using the association between sodium and mortality as a case study. Methods We analysed routinely collected longitudinal clinical ICU data using ComVis©, an IVA tool developed for research in nonmedical fields. Coordinated multiple views enable the simultaneous visualisation of multiple variables of any data type (including time series). Individual variables and relationships between multiple variables are displayed in multiple linked views using user-selected box plots, histograms, scatter-plots, time series, parallel coordinates, and so forth. Visually selecting data by brushing with the cursor simultaneously highlights corresponding data in all other views. Multiple brushes are combined using Boolean logic, and the new selection is automatically updated across all views. We used IVA to analyse the univariate effect of sodium (Na) longitudinal trends (and rate of change) on mortality in 1,447 ICU patients. We defined high sodium as >150 mmol/l, low Na as <130 mmol/l, and a rapid rise and fall as a change >3 mmol/l/hour at any time. Trends of interest were identified using IVA while OR and P values were calculated using standard statistical techniques. Results Overall ICU mortality was 22.5% (95% CI = 0.20.3 to 24.7%). Mean Na was 140 mmol/l (SD 4.3, within-patient minimum and maximum 123 and 166). Mortality was associated with: high Na versus Na <150 (28.6% vs. 20.9%, OR = 1.5, P = 0.004); rapid Na fall versus no rapid fall (27.6% vs. 17.7%, OR = 1.8, P <0.001); and rapid Na rise versus no rapid rise (27.6% vs. 17.7%, OR = 1.8, P <0.001). In contrast, low Na versus Na >130 (24.8% vs. 21.9%, OR = 1.2, P = 0.3), low Na with a rapid rise versus low Na with no rapid rise (26.3% vs. 20.7%, OR = 1.4, P = 0.3) and high Na with a rapid fall versus high Na with no rapid fall (30.6% vs. 24.2%, OR = 1.4, P = 0.3) were not associated with mortality. Conclusions IVA facilitates a visual approach to data analysis that is both intuitive and efficient. This hypothesis can first be explored visually before further analysis using conventional statistical methods. Advanced statistical modeling can be used to confirm any potential hypothesis identified by visual analyses.
Critical Care 2011, Volume 15 Suppl 1 http://ccforum.com/supplements/15/S1
P136 Base excess can be misleading in acute respiratory acidosis S Kocsi, K Kiss, B Szerdahelyi, M Demeter, Z Molnar University of Szeged, Hungary Critical Care 2011, 15(Suppl 1):P136 (doi: 10.1186/cc9556) Introduction Base excess (BE) is the measure of nonrespiratory change of acid–base status in the body. It is calculated after correcting the blood sample’s pH to 7.4, temperature to 37°C and pCO2 to 40 mmHg. Actual HCO3 level is a metabolic parameter derived directly from the Henderson–Hasselbalch equation. There is some evidence that temporary changes in pCO2 affect BE [1,2], but little is known about the response of HCO3. Therefore, the aim of this study was to investigate the relationship between BE and HCO3 in critically ill patients immediately after admission to the ICU. Methods The first arterial blood gas samples (within 1 hour of admission) of patients admitted to our ICU were retrospectively evaluated and pH, HCO3, pCO2 and BE were registered and analysed. After testing the data distribution, correlation was determined with Pearson’s correlation. Results Arterial blood gas samples from 88 patients were analysed. There was a strong, significant correlation between BE and HCO3 (r2 = 0.93, P <0.001) in the whole sample. In blood samples with pCO2 >45 mmHg, in 26 cases the pH was >7.3, and in 15 cases pH was <7.3 (that is, acute respiratory acidosis). In these cases with a cut-off BE <0 mmol/l, the BE had sensitivity = 73% and specificity = 85% for predicting acidosis. With a cut-off for HCO3 <24 mmol/l, the HCO3 had sensitivity = 27% and specificity = 100% for acidosis. Choosing a cutoff for BE <–2 mmol/l, sensitivity = 47%, specificity = 100%; for HCO3 <22 mmol/l, sensitivity = 13%, specificity = 100%. Conclusions Although BE and HCO3 had very good correlation in the whole sample, in acute respiratory acidosis BE indicated metabolic acidosis with high sensitivity, while the high specificity and low sensitivity of HCO3 showed that there was no metabolic component of the acid–base imbalance. Therefore, in accord with previous studies, our preliminary results give further evidence that HCO3 is a more reliable parameter to analyse acid–base balance in acute circumstances, especially in acute respiratory acidosis, than BE. References 1. 2.
Morgan TJ, et al.: Crit Care Med 2000, 28:2932-2936. Park M, et al.: J Crit Care 2009, 24:484-491.
P137 Prescription and clinical impact of chest radiographs in 104 French ICUs: the RadioDay Study MS Serveaux-Delous1, K Lakhal1, X Capdevila1, JY Lefrant2, S Jaber3, RadioDay Study Group1 1 CHU Lapeyronie, Montpellier, France; 2CHU Caremeau, Nimes, France; 3 CHU Saint Eloi, Montpellier, France Critical Care 2011, 15(Suppl 1):P137 (doi: 10.1186/cc9557) Introduction Prescribing daily routine chest radiographs (CXRs) in ICU patients is a matter for debate. We aimed at describing current strategies of CXR prescriptions and their diagnostic and therapeutic impacts in a large panel of French ICUs. Methods We performed a postal survey recording ICU habits of CXR prescription and a snapshot single-day (called RadioDay) observational study analyzing all of the prescribed CXRs. Results Survey (n = 104 ICUs) CXR prescription was made on a daily routine basis for every patient and only in mechanically ventilated patients in 7% and 37% of the 104 ICUs, respectively. Depending on the ICUs, ICU admission (55% of the ICUs), endotracheal intubation (87%), tracheostomy (87%), superior vena cava device (96%), nasogastric tube (48%), chest tube insertion (98%) and chest tube removal (60%) were systematically followed by a CXR. A written procedure for CXR prescription was available in 12% ICUs. Snapshot study On RadioDay, 854 CXRs were performed (8.2 ± 4.6 per center) in 804 patients: 36.5% were prescribed on a daily routine basis. The most frequent indications for on-demand CXR were: follow-up of pleuropulmonary pathology
S49
(32%), control after invasive device placement (20%), search for an etiology of respiratory or circulatory failure (13%) and ICU admission (11%). On-demand CXRs were mostly (62%) performed during the morning round. On-demand CXR showed more frequently a tissue abnormality than daily routine CXR (69 vs. 48%, P <0.001) and this radiographic finding was unexpected in 20 and 15%, respectively (P = 0.22). On-demand CXR was more frequently associated with treatment modification (which would not have occurred without the CXR) than daily routine CXR (38 vs. 19%, P <0.001): placement/ modification/or removal of an invasive device (18 vs. 9%, P <0.001), prescription of another paraclinical investigation (15 vs. 3%, P <0.001), initiation/continuation/or discontinuation of medications (25 vs. 11%, P <0.001). CXR findings were expected and had no impact on management in 56 and 77% (P <0.001) of the on-demand and daily routine CXR, respectively. Conclusions There is an obvious lack of consensus for CXR prescription in French ICUs. The clinical impact of on-demand CXR is higher than that associated with a daily routine prescription.
P138 Intraosseous blood aspirates analysed by a portable cartridge-based device G Strandberg1, A Larsson2, M Lipcsey1, M Eriksson1 1 Anesthesia & Intensive Care, Uppsala University, Sweden; 2Clinical Chemistry, Uppsala University, Sweden Critical Care 2011, 15(Suppl 1):P138 (doi: 10.1186/cc9558) Introduction Intraosseous (IO) needles play an important role in medical emergencies, when venous access is difficult to establish. IO needles are suitable for infusion, but their use for blood sampling has been questioned, since aggregates of marrow substances may block analysers [1]. However, portable laboratory instruments have been developed, where the blood may be analysed within a separate cartridge. We decided to evaluate whether such a portable device is suitable for analysis of blood gases and electrolytes in aspirates obtained from IO needles during a 6-hour period. A second aim of this study was to compare such IO aspirates with arterial blood samples, both of them analysed by a handheld laboratory analysis system. Methods IO needles (Im-Medico) were inserted bilaterally in the proximal tibiae of five anaesthetised healthy pigs. Blood gases and electrolytes (Na, K, Ca) were taken hourly. IO aspirates and arterial blood samples were immediately analysed by an i-STAT handheld (Abbott Point of Care) equipped with EG7+ and CG4+ cartridges. A coefficient of variance (CV) >20%, was regarded as the upper limit of quantification [2]. Bland–Altman curves were used to assess agreement between the two methods [3]. Results Repeated IO aspirates were easily obtained during the entire 6-hour period. There were excellent consistencies in blood gases and electrolytes, between IO aspirates from the left and right tibiae, except for BE, where CV >20%. IO aspirates were compared with arterial samples. There were compliant values between these sources regarding electrolytes, Hb, pH, pCO2 and SBC. This was in contrast to BE, lactate, PO2 and SO2, which all exhibited CV >20%. Although both SO2 and PO2 were higher in arterial samples as compared with IO samples, there were high correlations between these two variables in arterial blood and IO aspirates (R >0.9; P <0.001 and R = 0.7; P <0.001, respectively). There were only minor changes over time in any of these variables during the entire experimental period. Conclusions Blood gases and electrolytes in IO blood aspirates are easily analysed by a handheld device during a 6-hour period. The development of this cartridge-based laboratory analysis system strengthens the concept of using IO needles as a valuable tool in medical emergency situations. If blood gases are to be evaluated in IO aspirates, SBC seems to reflect arterial conditions better than BE does. References 1. 2. 3.
Nicoll SJ, et al.: Resuscitation 2008, 168:168-169. Christenson RH, et al.: Clin Biochem 2010, 43:683-690. Bland JM, et al.: Lancet 1986, 1:307-310.
Critical Care 2011, Volume 15 Suppl 1 http://ccforum.com/supplements/15/S1
P139 Capnography activation is improved by better ventilator interface ergonomics E Hodge, M Blunt, P Young Queen Elizabeth Hospital, King’s Lynn, UK Critical Care 2011, 15(Suppl 1):P139 (doi: 10.1186/cc9559) Introduction In critical care, capnography is recommended [1]. Upon intubation this is important to rapidly confirm endotracheal tube position. Often capnography is built into critical care ventilators, but as these are frequently used for non-invasive ventilation it is necessary that this monitoring may be switched off and on. We postulated that the ease with which this could be done would relate to the ergonomic design of the ventilation interface and compared the Drager Evita 4 and Drager V500. The Evita 4 has a button hidden within the alarm limits section, whereas on the V500, which has locally configurable interface, this had been placed on the main screen. Methods Thirty-one nursing and medical ICU staff were studied. The ventilator was set up in a controlled mode with the default front screen visible with capnography disabled. The time to successful activation of capnography was recorded. Each subject performed the same test on both ventilators in a randomized crossover design. Results More subjects failed to activate capnography within 120 seconds with the Evita 4 compared with the V500 (14 vs. 1) and survival analysis identified significantly faster time to successful activation in the V500 (see Figure 1). Analysis identified no period effect due to the crossover design.
S50
We hypothesized that the duration of cardiac arrest (CPA TIME) would impact the pulmonary dysfunction in patients with postcardiac arrest syndrome. The aim of the present study was to investigate the lung dysfunction quantitatively using EVLW and PVPI in successfully resuscitated patients after cardiac arrest (CPA). Methods This was a prospective observational study of 106 (59 male, 47 female) postcardiac arrest syndrome patients. Eligible patients included all who were in CPA on arrival at the hospital and experienced effective resuscitation resulting in resumption of spontaneous circulation. All patients were resuscitated per therapeutic protocol in our hospital. The CPA TIME from the scene was recorded. The patients were divided into two groups by the cause of CPA; cardiogenic (CG) or noncardiogenic (NCG). Thermodilutional EVLW and PVPI measurements were performed using the PiCCO monitoring system (Pulsion Medical Systems, Munich, Germany) as soon as the patients were admitted to the ICU. Results A moderate positive correlation was documented between the CPA TIME, EVLW (r = 0.36, P <0.001) and PVPI (r = 0.43, P <0.001) in all 106 patients. In the CG group, we found a very close positive correlation between the CPA TIME, EVLW (r = 0.52, P <0.001) and PVPI (r = 0.75; P <0.001). No correlations were documented between the CPA TIME, EVLW (r = 0.25, P = 0.05) and PVPI (r = 0.24, P = 0.06) in the NCG group. Conclusions The duration of cardiac arrest impacts on the increase in the EVLW and PVPI, especially in patients with CG postcardiac arrest syndrome. Acknowledgements Clinical trial registration UMIN-CTR: UMIN00000 3224. P141 Ultrasonography is a valuable non-invasive tool for determining extravascular lung water in severe sepsis M Kok1, H Endeman2 1 Diakonessenhuis Utrecht, the Netherlands; 2Onze Lieve Vrouwe Gasthuis, Amsterdam, the Netherlands Critical Care 2011, 15(Suppl 1):P141 (doi: 10.1186/cc9561)
Figure 1 (abstract P139). Survival analysis for time to capnography activation for Evita 4 and V500.
Conclusions Despite the extensive experience and training on the Evita 4, many subjects were not able to activate capnography within 2 minutes; however, by configuring the screen of the V500 this was almost eliminated in staff even without specific training. Immediate availability of capnography is an important safety issue and manufacturers should consider this in the ergonomic design of their equipment interfaces. Reference 1.
Standards for Capnography in Critical Care. London: ICS; 2009.
P140 Impact of cardiac arrest duration on extravascular lung water and pulmonary vascular permeability in patients with postcardiac arrest syndrome: a prospective observational study T Tagami1, R Tosa1, M Omura1, J Hagiwara1, N Kido1, H Hirama1, H Yokota2 1 Aidu Chuo Hospital, Aizuwakamatsu, Fukushima, Japan; 2Nippon Medical University, Bunkyo, Japan Critical Care 2011, 15(Suppl 1):P140 (doi: 10.1186/cc9560) Introduction Pulmonary dysfunction after cardiac arrest is a common phenomenon. Evidence appears to support the usefulness of quantitative assessment of pulmonary dysfunction using extravascular lung water (EVLW) and the pulmonary vascular permeability index (PVPI).
Introduction The aim of this study was to evaluate the value of ultrasonography of the lung in order to determine the level of volume load defined as the extravascular lung water index (ELWI). Hereto the presence of bilateral interstitial syndrome found by pulmonary ultrasonography is compared with ELWI as measured by thermodilution with PiCCO technology. Methods A prospective study was carried out. The study was performed in the ICU of a medium-sized teaching hospital. Adult patients who were suffering from severe sepsis were included in the study. Ultrasonography (OptiGo; Philips) of the lung was categorized as an A-profile in cases of no signs of interstitial syndrome and a B-profile in cases of interstitial syndrome. Ultrasonography of both sides of the lung was performed. Therefore, the following profiles were determined: AA, AB and BB. The BB-profile, bilateral interstitial syndrome, is regarded as being associated with volume overload [1]. The ELWI was calculated after thermodilution by PiCCO technology in all patients and compared between the three different ultrasonographic profiles. Statistical analysis was performed by independent-sample t test. P <0.05 was considered statistically significant. Results In 11 consecutive patients (six men), ultrasonography of the lung was performed 27 times. Mean age was 70 years (SD 3.4), mean APACHE IV score 88 (SD 23) and APACHE II score 26 (SD 6). Most frequent reasons for ICU admission were sepsis, respiratory and renal failure. Mean ELWI in patients with the AA-profile (48.1% of the profiles) and the BB-profile (29.6%) was respectively 8.5 (SD 1.7) and 13.8 (SD 2.9). This difference was significant (P = 0.001). Mean ELWI of the AB-profile (22.2%) was 7.8.(SD 2.3). The mean ELWI of this profile also differed significantly with the BB-profile (P = 0.002). See Figure 1. Conclusions Our study demonstrates the potential of ultrasonography in the detection of extravascular lung water in adult intensive care patients, suffering from severe sepsis. Since ultrasonography is an inexpensive, non-invasive and effective modality, the small study supports the use of ultrasonography as a possible tool in the evaluation of volume status in patients with severe sepsis. Larger studies are necessary to confirm these findings. Reference 1.
Lichtenstein DA, et al.: Chest 2009, 136:1014-1020.
Critical Care 2011, Volume 15 Suppl 1 http://ccforum.com/supplements/15/S1
S51
P143 Feasibility of continuous exhaled breath analysis in intubated and mechanically ventilated critically ill patients LD Bos, PJ Sterk, MJ Schultz Academic Medical Center, Amsterdam, the Netherlands Critical Care 2011, 15(Suppl 1):P143 (doi: 10.1186/cc9563)
Figure 1 (abstract P141). Boxplots of the relationship between extravascular lung water (ELW, ml/kg) and the different profiles determined by ultrasonography of both lung sides, in patients with severe sepsis.
Introduction Pulmonary elimination of volatile molecules (so-called volatile organic compounds (VOCs)) is altered in a variety of pulmonary and nonpulmonary diseases [1]. Because breath of intubated and mechanically ventilated critically ill patients is continuously available, detection of changes in VOC patterns could be used to monitor these patients. We hypothesized that an electronic nose (eNose) provides a reliable and continuous read-out of changes in patterns of exhaled VOCs (so-called breathprints). Methods An observational pilot study of six intubated and mechanically ventilated critically ill patients. Breathprints were collected by means of an eNose every 10 seconds for ±7 hours. The patient sample size is too small for statistical analysis between patients, but varying fluctuations could be analysed within each patient. Results Breathprints fluctuated considerably over time (SEM 1.18). However, typical changes could be detected: for example, salbutamol inhalation, decreased static compliance and increased minute volumes all caused a rapid change in the breathprints (illustrated in Figure 1).
P142 Indexing extravascular lung water to predicted body weight increases the correlation with lung injury score in patients with acute lung injury/acute respiratory distress syndrome: a prospective, multicenter study conducted in a Japanese population H Fukushima, T Seki, Y Urizono, M Hata, K Nishio, K Okuchi Nara Medical University Hopital, Kashihara City, Japan Critical Care 2011, 15(Suppl 1):P142 (doi: 10.1186/cc9562) Introduction Since predicted body weight derived from height and gender reflects lung size better than actual body weight, it is reported that extravascular lung water indexed to the predicted body weight (EVLWIp) is more closely correlated with severity of illness and mortality than EVLW indexed to the actual body weight (EVLWIa). However, the usefulness of EVLWIp has not been evaluated in a multicenter study or in the Asian population. Methods We conducted a prospective, multicenter observational study in Japan with the following inclusion criteria: adult (≥18 years) patients needing mechanical ventilation, PaO2/FiO2 ratio below 300, and acute bilateral infiltrates in both lung fields on chest X-ray. The diagnosis of acute lung injury/acute respiratory distress syndrome (ALI/ARDS) was based on peer review. Predicted body weight was calculated as 50 (for male) or 45.5 (for female) +0.91(centimeters of height –152.4). The normal range of body mass index (BMI) was defined as 18.5 to 22.9. Obesity was defined as BMI ≥25. Data are presented as medians and interquartile ranges (IQR). A Wilcoxon’s rank sum test and the Mann–Whitney test were used to compare the values, and correlations were analyzed using Spearman’s rank correlation coefficient. Statistical significance was tested at a level of 0.05. Results Seventy-eight patients with ALI/ARDS were enrolled. The values of EVLWIp (17.1 ml/kg; IQR, 12.9 to 21.4) were not different from EVLWIa (16.6 ml/kg; IQR, 12.3 to 21.7). Although the overall correlation with APACHE II score, SOFA score, or mortality was not stronger for EVLWIp compared with EVLWIa, in patients weighing under or over the normal range (BMI <18.5 or BMI ≥23, 41 cases), EVLWIp was more closely correlated with Lung Injury Score (LIS) than ELWIa (EVLWIa; rs = 0.228, P = 0.152 vs. EVLWIp; rs = 0.333, P = 0.033). Furthermore, in patients with BMI ≥25 (19 cases), the correlation of EVLWIp with LIS was much higher (rs = 0.611. P = 0.005) compared with EVLWIa (rs = 0.283, P = 0.240). Conclusions Even in the Japanese population, EVLWIp is more highly correlated to the LIS, especially in obese patients. References 1. 2.
Phillips CR, et al.: Crit Care Med 2008, 36:69-73. World Health Organisation, International Association for the Study of Obesity, International Obesity TaskForce: The Asia-Pacific Perspective: Redefining Obesity and its Treatment. Sydney: Health Communications; 2000. [http://www. diabetes.com.au/pdf/obesity_report.pdf ]
Figure 1 (abstract P143). Changes in resistance of sensors during 7 hours of mechanical ventilation.
Conclusions Continuous monitoring of exhaled breath using an eNose is feasible in intubated and mechanically ventilated patients. Our data suggest that changes of breathprints within patients could be used to assess the clinical course of the patients. Reference 1.
Rock F: Chem Rev 2008, 108:705-725.
P144 Pattern of cytokines and chemokines in exhaled breath condensate is related to the characteristics of mechanical ventilation I Van Walree1, A Van Houte1, G Rijkers2, H Van Velzen-Blad2, H Endeman1 1 Diaconessenhuis, Utrecht, the Netherlands; 2St Antonius Hospital, Nieuwegein, the Netherlands Critical Care 2011, 15(Suppl 1):P144 (doi: 10.1186/cc9564) Introduction Ventilator-associated lung injury (VALI) is an inflammatory response of the lung caused by mechanical ventilation (MV) and is related to tidal volumes (TV), positive end-expiratory pressure (PEEP) and peak pressures (Ppeak) [1]. In experimental settings, VALI is characterized by a local inflammatory response measured in tissue or lavate. It is difficult to obtain this material in the critically ill [2]. Exhaled breath condensate (EBC) is obtained in patients on MV using an easy non-invasive technique. In this pilot study we examined the relation
Critical Care 2011, Volume 15 Suppl 1 http://ccforum.com/supplements/15/S1
between levels of inflammatory proteins in EBC of patients on MV and characteristics of MV. Methods A prospective study was performed in 13 patients on MV. EBC was obtained from the connection-swiffle between ventilator and tube. IL-1β, IL-4, IL-6, IL-8, IL-10, IL-12, IL-17, IFNγ, MCP-1 and MIP-1β were determined by multiplex immunoassay. Levels of inflammatory mediators were correlated with parameters of MV. Results In 13 (seven males) patients, 29 samples were obtained. Median age of the patients was 69 years, median APACHE II score 25 points. Samples were taken during MV: seven during pressure control (PC) and 22 during pressure support (PS) mode. Median Ppeak was 18 cmH2O, median PEEP 8 cmH2O, median TV 7.22 ml/kg and median P/F ratio 33.62 kPa. Levels of all inflammatory proteins except for IL-12 were lower in patients on PC, reaching statistical significance for IL-17 (median PS 1.96 vs. PC 0.96, P = 0.002) and MCP-1 (median PS 0.72 vs. PC 0.38, P = 0.033). Significant lower levels were found in patients ventilated with TV ≤8 for MCP-1 (median TV ≤8 ml/kg 0.75 vs. TV >8 ml/ kg 3.41, P = 0.032) and MIP-1β (median TV ≤8 ml/kg 0.00 vs. TV >8 ml/ kg 1.30, P = 0.028). Levels of cytokines were lower in case of low Ppeak (≤20 cmH2O) reaching the level of statistical significance for IFNγ (median Ppeak ≤20 cmH2O 0.00 vs. > 20 cmH2O 6.23, P = 0.025). Conclusions In a small group of patients, cytokine and chemokine patterns in EBC were related with characteristics of MV. MV with a TV ≤8 may limit inflammatory response. References 1.
2.
Frank JA, et al.: Pathogenetic significance of biological markers of ventilator-associated lung injury in experimental and clinical studies. Chest 2006, 130:1906-1914. Perkins GD, et al.: Safety and tolerability of nonbronchoscopic lavage in ARDS. Chest 2005, 127:1358-1363.
P145 Divergent changes in regional pulmonary filling characteristics during endotoxin-induced acute lung injury in pigs A Aneman1, S Sondergaard2, A Fagerberg2, H Einarsson2 1 Liverpool Hospital, Sydney, Australia; 2Sahlgrenska University Hospital, Gothenburg, Sweden Critical Care 2011, 15(Suppl 1):P145 (doi: 10.1186/cc9565) Introduction Divergent regional filling characteristics of the lung may explain ventilator-induced lung injury. In this descriptive study, the potential of electrical impedance tomography (EIT) to determine progressive changes in regional filling characteristics during acute lung injury was explored. Methods Endotoxin was infused during 150 minutes in 11 mechanically ventilated pigs (VC, TV 10 ml/kg, PEEP 5, RR set to normocapnia at I:E 1:2). EIT (Evaluation Kit 2; Dräger Medical) was used to monitor global and regional (four equal ventrodorsal regions of interest, ROIs 1 to 4) impedance changes at the mid-thoracic level. The tidal regional versus global impedance changes were normalized and analysed by seconddegree polynomial correlation [1]. A square coefficient (x2) <0 indicates hyperinflation, >0 indicates recruitment and a value around 0 indicates homogeneous regional to global filling. Statistical evaluation was by ANOVA and Kruskal–Wallis post-hoc test, significance was set at P <0.05.
S52
Results Endotoxinaemia increased the A–a O2 gradient and shunt, Qs/Qt, from 5.7 ± 3.6 to 33 ± 24 kPa and from 9.2 ± 2 to 27 ± 6%. Homogeneous filling in all four ROIs occurred at baseline (Figure 1) but progressively changed to hyperinflation in ROI 1 (x2 = –0.36) and recruitment (x2 = 0.66) in ROI 4 at 150 minutes, with ROIs 2 and 3 showing intermediate but similar changes. The x2 gradient from ROIs 1 to 4 (dotted line) increased significantly consistent with increased regional heterogeneity comprising hyperinflation as well as recruitment. Conclusions EIT can identify lung areas showing hyperinflation, recruitment or homogeneous filling, allowing ventilator settings to be adjusted to optimize pulmonary filling characteristics. Monitoring by EIT may thus potentially be used to minimize ventilator-induced lung injury. Reference 1.
Hinz et al.: Regional filling characteristics of the lungs in mechanically ventilated patients with acute lung injury. Eur J Anaesth 2007, 24:414-424.
P146 Electrical impedance tomography to monitor regional tidal ventilation at different pressure support levels T Mauri1, G Bellani1, A Confalonieri1, P Tagliabue2, M Bombino2, N Patroniti1, G Foti2, A Pesenti1 1 Universita degli Studi di Milano-Bicocca, Monza, Italy; 2San Gerardo Hospital, Monza, Italy Critical Care 2011, 15(Suppl 1):P146 (doi: 10.1186/cc9566) Introduction Implementation of assisted mechanical ventilation in acute lung injury (ALI) patients may decrease ventilator-induced lung injury by redistribution of tidal ventilation towards dependent lung regions. Up to now, tidal ventilation regional distribution has been measured by expensive and complicated methods, not readily available at the bedside. Electrical impedance tomography (EIT) is a relatively new non-invasive bedside method to monitor tidal ventilation distribution, validated in preclinical studies. We verified the feasibility of using EIT to monitor tidal ventilation regional distribution in patients undergoing assisted ventilation and we describe the effect of different pressure support levels on regional ventilation. Methods We enrolled 11 consecutive ALI patients admitted to our ICU, intubated and undergoing pressure support (PS) ventilation. We monitored the regional tidal ventilation distribution by means of a new EIT monitor (PulmoVista 500®; Dräger Medical GmbH, Lübeck, Germany), dividing the lung imaging field into four contiguous samesize regions of interest (ROI): ventral right (ROI 1) and left (ROI 2), dorsal right (ROI 3) and left (ROI 4). We randomly performed two steps of PS ventilation for 15 minutes, leaving the positive end-expiratory pressure (PEEP) and FiO2 unchanged: PSlow (p0.1 ≥2 cmH2O) and PShigh (p0.1 <2 cmH2O). At the end of each step, we recorded: ventilation parameters, arterial blood gas analysis and percentage of tidal ventilation distribution in the four ROIs. Analyses were performed by paired t test. Results The ALI etiology was: trauma (18%), septic shock (18%), pneumonia (46%) and postoperative respiratory failure (18%). PSlow was set at 3 ± 2 cmH2O and PShigh at 12 ± 3 cmH2O. An increase in PS level determined a significant increase of tidal volume (7 ± 2 vs. 9 ± 3 ml/ kg, P = 0.003) and peak inspiratory pressure (12 ± 4 vs. 18 ± 4 cmH2O, P = 0.0001). At PShigh, proportional distribution of tidal ventilation significantly changed in all four ROIs (ROIs 1 to 4: 25 ± 9 vs. 33 ± 10%, P = 0.0003; 32 ± 13 vs. 37 ± 12%, P = 0.02; 20 ± 8 vs. 14 ± 8%, P = 0.0008; 23 ± 8 vs. 16 ± 5%, P = 0.005), moving from dorsal to ventral. Conclusions EIT may be a useful tool to monitor lung regional ventilation at the bedside. PS levels that blunt patient effort may promote redistribution of tidal ventilation towards ventral lung regions. P147 Endotracheal cuff pressure: role of tracheal size and cuff volume PL Lichtenthal1, UB Borg2 1 University of Arizona, Tucson, AZ, USA; 2Covidien, Boulder, CO, USA Critical Care 2011, 15(Suppl 1):P147 (doi: 10.1186/cc9567)
Figure 1 (abstract P145).
Introduction To resolve conflicting issues of volume/pressure relationships in endotracheal (ETT) cuffs, we examined this using an animal
Critical Care 2011, Volume 15 Suppl 1 http://ccforum.com/supplements/15/S1
model. Sengupta and colleagues concluded that cuff volumes were fairly consistent despite varying tracheal and ETT sizes [1]. Hoffman and colleagues concluded that the volume/pressure relationships in ETT cuffs are linear and that additional air volume above that necessary to reach safe sealing pressure would not result in a precipitous increase in pressure [2]. Methods In a study approved by the Animal Care and Use Committee, excised canine tracheas with four diameters (18, 20, 23 and 26 mm) were intubated with six different 7.5 mm ETTs from different manufacturers (Hi-Lo, TaperGuard and Hi-Lo Intermediate, Tyco Healthcare, Pleasanton, CA, USA; Blue Line SACETT Portex, Smith Medical, Keene, NH, USA; Teleflex ISIS HVT, Research Triangle Park, NC, USA; MicroCuff, Kimberly Clark, Roswell, GA, USA). Cuff pressure was determined with a pressure transducer located at the same level as the cuff and connected via the air-filled inflation line. The cuffs were inflated stepwise adding 1 ml of air per step. Results The volume/pressure relationship for all cuffs is initially dependent on the resting volume of the cuff. Once the cuff pressure is equal to the force of the tracheal durometer, the cuff pressure increases linearly, reflecting the compliance of the trachea. This occurs at a cuff pressure of 30 cmH2O. In high-volume low-pressure cuffs (Hi-Lo, SACETT, ISIS) the inflation volume was greater compared with low-volume low-pressure cuffs (TaperGuard, Hi-Lo Intermediate). The polyurethane cuff (PU, MicroCuff ) exhibited a unique volume/pressure relationship. Conclusions The tracheal diameter influences the volume necessary to reach a certain cuff pressure with the same-size cuff, contrary to the findings of Sengupta and colleagues [1]. The type of cuff, high-volume low-pressure versus low-volume low-pressure, greatly influences the behavior of the cuff pressure. The high-volume low-pressure cuffs required the largest inflation volume. The type of material changes the behavior of the volume/pressure relationship. A PU cuff has a more nonlinear volume/pressure relationship compared with polyvinylchloride cuffs since PU is less distensible. It should be noted that the commonly recommended inflation pressure (25 to 30 cmH2O) [3] was the point at which the steep linear rise in pressure was seen with small increments of added inflation volume. In conclusion, we have demonstrated that ETT cuff pressure is multifactorial including cuff volume, material and tracheal diameter. References 1. 2. 3.
Sengupta et al.: BMC Anesthesiol 2004, 4:8. Hoffman et al.: West J Emerg Med 2009, 10:137-139. Bunegin et al.: Anesth Analg 1993, 76:1083-1090.
P148 A survey of healthcare professionals’ knowledge of emergency oxygen use in adult patients A Hartopp, K Horner, C Botfield Princess Royal University Hospital, Orpington, UK Critical Care 2011, 15(Suppl 1):P148 (doi: 10.1186/cc9568) Introduction There are many inaccurate teachings and a paucity of quality evidence about oxygen. We aimed to assess knowledge levels amongst healthcare professionals who administer oxygen with respect to basic physiology, delivery devices and the potential to cause harm in commonly encountered emergency situations. Methods The salient clinical points from the British Thoracic Society guidance on Emergency Oxygen use in Adults Patients [1], as determined independently by three doctors, were incorporated into a questionnaire. The survey was conducted at a large district general hospital amongst frontline staff. Clinicians of all grades and backgrounds including emergency, surgical, anaesthetic and medical staff were surveyed under direct supervision. Results A total of 196 people were surveyed, including 107 doctors (D), 69 nurses (N), 10 midwives (M) and 10 physiotherapists (P). Only 70% knew how to set up a non-rebreathe mask (D 62%, N 87%, P 80%, M 40%). Further, just 74% selected this as their first-line delivery device in a
S53
critically ill patient. For a simple facemask a flow rate of 5 to 10 l/minute is recommended (D 51%, N 54%, P 60%, M 90%), whilst the maximum flow rate by nasal cannulae is 6 l/minute, known by 14% of participants. Interestingly mouth breathing does not reduce the inspired oxygen concentration delivered by nasal cannulae, which was known by 37%. Recent evidence suggests the physiology of hypercapnic respiratory failure due to excessive oxygen therapy in some COPD patients is mainly due to worsening V/Q mismatching rather than a loss of hypoxic drive (D 16%, N 6%, P 0%, M 20%). In the absence of hypoxia, oxygen is not recommended in myocardial infarction (MI) or stroke because of hyperoxaemia-induced vasoconstriction. There was better awareness of oxygen use in stroke, with 41% answering correctly compared with 18% in MI. Of the vital signs, respiratory rate is the best predictor of severe illness (D 64%, N 71%, P 80%, M 70%). A >3% drop in saturations, even if within the normal range, is significant (D 83%, N 78%, P 60%, M 60%). Therefore oxygen should be titrated to a target saturation (D 47%, N 52%, P 40%, M 80%) rather than administering maximal oxygen therapy, which may mask acute deterioration. Conclusions In our hospital there is a widespread lack of awareness about emergency oxygen. Patients are potentially being administered or deprived of oxygen in a manner detrimental to their care. Education is needed to protect patients and ensure correct teaching to future generations of medical professionals. Reference 1.
O’Driscoll BR, et al.: British Thoracic Society. Thorax 2008, 63(Suppl 6):1-68.
P149 Weaning from NIV: how rapidly can we go? J Chico1, L Sayagues2, R Casado2, M Muñoz1, L Lage1, S Vara1, V Gomez1, C Vara1 1 Hospital Xeral, Vigo, Spain; 2Hospital Clinico, Santiago Compostela, Spain Critical Care 2011, 15(Suppl 1):P149 (doi: 10.1186/cc9569) Introduction Little evidence exists about how to wean patients from NIV. We assess the efficacy and tolerance of a rapid weaning sequence. Methods The population was consecutive patients admitted to our ICU during 1 year with COPD or pulmonary edema (PE) who underwent NIV. Criteria for weaning: improvement of acute disease, pH >7.33, RR <25, pO2 >65, FiO2 <0.6, EPAP <8. Day 1: withdrawal of NIV (could be placed for a maximum of 8 hours the first day). If no reintroduction of NIV: discharge. If reintroduction <8 hours: observation for 24 hours more, and discharge if no need for NIV. If deterioration or need to extend NIV time: change to a standard protocol (decremental NIV time). Results Twenty-one patients were included, 89% male. Mean age was 67 years. Fifty per cent had previous history of COPD, 25% heart disease (mostly ischemic and hypertensive) and 35% both. Reason for admission was PE (80%), and 20% COPD exacerbation. Mean APACHE II score: 20. Mean FiO2/pH/pCO2: 0.6/7.22/72. Mean EPAP/IPAP: 6/19. Mean time of NIV: 48 hours. Mean time of weaning: 35 hours. Eighteen patients were weaned successfully in 48 hours (50% discharged in 24 hours). No patient needed readmission. We found no differences in weaning success related with NYHA, APACHE, reason for admission or NIV time. All patients with PE were weaned successfully. Mean basal LVEF: 54%. Mean LVEF in acute disease: 50%. Those with LVEF deterioration showed the same success rates. Patients with history of severe COPD (FVC <38%) needed more NIV time during weaning, longer ICU stay and were more likely to fail weaning (three patients failed weaning, all with severe COPD). Conclusions Evidence about how to wean patients from NIV is scarce. The usual practice is to decrease NIV time, but extending weaning time can lead to higher costs and NIV failure. Pinto showed in 65 COPD patients that a 3-day approach with decreasing time of NIV was feasible. All patients were discharged in 4 days without complications. In our case, a more aggressive approach was attempted. Our results suggest that rapid weaning sequence could be feasible in PE patients, although further studies are needed.
Critical Care 2011, Volume 15 Suppl 1 http://ccforum.com/supplements/15/S1
P150 Factors associated with non-invasive ventilation response on the first day of therapy in patients with hypercapnic respiratory failure G Gürsel1, M Aydoğdu1, S Taşyürek1, G Gülbaş2, S Özkaya3, S Nazik1, A Demir1 1 Gazi University Medical Faculty, Ankara, Turkey; 2İnönü University Medical Faculty, Pulmonary Diseases Department, Malatya, Turkey; 3Rize University Medical Faculty, Pulmonary Diseases Department, Rize, Turkey Critical Care 2011, 15(Suppl 1):P150 (doi: 10.1186/cc9570) Introduction Non-invasive ventilation (NIV) decreases the need for mechanical ventilation in the early period of acute hypercapnic respiratory failure and factors for success have been studied well. On the other hand, little is known about what kind of factors influence the NIV response in the subacute period. This study aimed to determine the factors influencing PaCO2 reduction below 50 mmHg in the first 24 hours of therapy. Methods In this retrospective study we investigated the differences in NIV strategies and patient characteristics between the responsive group (PaCO2 levels drop below 50 mmHg in first 24 hours) (group 2) and the nonresponsive group (group 1). Results In 34% of the patients, PaCO2 reduced to below 50 mmHg in first 24 hours. There were no significant differences between the length of NIV application time and ICU stay, intubations and mortality rates, across the groups. Despite a significantly higher level of pressure support usage in group 1 than in group 2, PaCO2 did not reduce below 50 mmHg in group 1 within the first 24 hours. While 91% of the responsive group had received nocturnal NIV therapy, only 74% of the nonresponsive group had received NIV therapy all night long (P = 0.036). The home ventilation usage rate was significantly higher in the nonresponsive group than the responsive group. Conclusions Results of this study showed that, although nocturnal application of NIV in the ICU is associated with a faster drop rate in PaCO2 levels, the higher pressure support requirement and prior home ventilation usage are predictors for late and poorer response to NIV. P151 Formal airway assessment prior to emergency tracheal intubation: a regional survey of usual practice A Karmali, S Saha, P Patel Imperial College Healthcare NHS Trust, Hammersmith Hospital, London, UK Critical Care 2011, 15(Suppl 1):P151 (doi: 10.1186/cc9571) Introduction Formal airway assessment prior to tracheal intubation is one of the core skills taught to trainees in anaesthesia and forms part of routine perioperative practice. In the United Kingdom, anaesthetists perform the vast majority of emergency intubations of critically ill patients. We conducted a survey of usual practice and opinion regarding airway assessment in the emergency setting by trainees in anaesthesia. Methods An online survey tool was used to create a structured questionnaire pertaining to participants’ experience of emergency tracheal intubation of critically ill patients in hospital wards, emergency departments and critical care units. This was distributed to trainees in anaesthesia across London. Participants were asked how often they had performed a formal airway assessment and whether they felt this would have changed patients’ clinical outcome. Results We received 178 responses from anaesthetists with recent experience of difficult tracheal intubations in critically ill patients. One hundred and fifty had encountered grade III/IV views at laryngoscopy. Interestingly, the frequency of these encounters had no relationship to anaesthetic experience. The mean anaesthetic experience was 4.8 (SD 2.6) years. Table 1 highlights how often individuals performed an airway assessment and shows that the majority (73.4%) felt that a formal airway assessment beforehand would not have changed eventual patient outcome. Situational urgency and patient factors (for example, level of consciousness) were cited as factors limiting respondents’ ability to perform an airway assessment. Conclusions Previous studies have highlighted difficulties in formal airway assessment of critically ill patients in the Emergency Department [1]. These difficulties – for example, lack of patients’ ability to cooperate with an assessment – are mirrored in our survey. The majority of anaesthetists surveyed felt that formal airway assessment prior to
S54
Table 1 (abstract P151) Never
Sometimes
Always
Airway assessment?
8 (4.5%)
121 (68%)
49 (27.5%)
Changed outcome?
124 (73.4%)
42 (24.8%)
3 (1.8%)
emergency tracheal intubation of critically ill patients would make no difference to patient outcome. This suggests that most of those surveyed would question the usefulness of formal airway assessment in context of these circumstances. Reference 1.
Bair A, et al.: J Emerg Med 2010, 38:677-680.
P152 Urgent orotracheal intubation in critically ill patients M Hernández Bernal, JJ Manzanares Gomez, C Soriano Cuesta, A Agrifoglio Rotaeche, J Figueira, J López, M Jimenez Lendinez La Paz University Hospital, Madrid, Spain Critical Care 2011, 15(Suppl 1):P152 (doi: 10.1186/cc9572) Introduction The aim of this study is to analyze the incidence of difficult intubation, and likewise characteristics, complications and mortality of urgent orotracheal intubation (OTI) in critically ill patients. Methods An observational, descriptive and prospective study. We analyze the impact of difficult OTI, morbidity and mortality in urgent OTI, in the noncoronary ICU of a third-level university hospital in Madrid. We collected all OTIs during the period of 1 year. Demographic data, blood pressure and O2 saturation with pulsioximetry, before and after OTI, indications, type of technique, medication administrated, place where the technique was performed, and complications were collected. Results Patients: 277. OTIs: 305. Average attempts: 1.15 (SD: 0.41). Sex: male (M): 197 (64.6%), female (F): 108 (35.4%). Age: 56 years (15 to 87). Indications for OTI: low level of consciousness: 103 (34%), excessive work of breathing: 88 (29%), airway protection: 58 (19%), poor secretion management: 44 (14.4%), endotracheal tube change: 29 (9.5%), combative patient: 27 (8.8%), autoextubation: 6 (2.1%), glottis or laryngeal edema: 5 (1.7%), others: 6 (2%). Two or more indications agreed in 36%. Place technique was performed: ICU: 172 (56.4%), Emergency Department (ED): 85(27.9%), hospital ward: 29 (9.5%), burn unit: 16 (5.2%), others: 3 (1%). Complications: 113 (37%): hemodynamic deterioration: 72 (23.6%), hypoxemia: 22 (7.2%), esophageal intubation: 5 (1.6%), selective bronchial intubation: 4 (1.3%), bronchoaspiration: 4 (1.3%), impossible OTI: 3 (0.9%), others: 3 (0.9%). Difficult and impossible OTI: 7 (2.3%): difficult OTI: 4 (1.3%), impossible OTI: 3 (0.98%). Average age: 52 years (38 to 81). Sex: M: 3 (42.8%), F: 4 (57.2%). Place technique was performed: ICU: 3 (42.9%), ED: 2 (28.5%), hospitalization ward: 1 (14.3%), burn unit: 1 (14.3%). Average attempts: 4.5 (SD 0.5). Total mortality of the study: 3 (0.98%). Conclusions In our study, difficult intubation rates were lower than those reported in other series, so it is remarkable the low mortality of the series, less than 1%, which was determined by hemodynamic deterioration after the technique and not associated with the procedure. In view of the results it is advisable to carry out predictive tests, taking into account the characteristics of the critical patients who require urgent intubation, to provide technical difficulties in carrying out the process and anticipate the preparation of necessary materials before starting sequence intubation; likewise, new systems have access to the airway for risk. Reference 1.
Jaber et al.: Crit Care Med 2006, 34:2355-2361.
P153 Propofol is the induction agent of choice for urgent intubations with UK physicians KD Rooney, R Jackson, A Binks, A Jacques, RT IC-Severn Bristol School of Anaesthesia, Bristol, UK Critical Care 2011, 15(Suppl 1):P153 (doi: 10.1186/cc9573) Introduction We performed a multicentre, prospective, observational study across nine hospitals in the Severn Deanery (UK). Choice of
Critical Care 2011, Volume 15 Suppl 1 http://ccforum.com/supplements/15/S1
induction agents for out-of-theatre intubations was compared against historical controls. Methods Data were collected prospectively on all out-of-theatre tracheal intubations occurring within the region during a 1-month period. We included all intubations performed outside areas normally used for elective or emergency surgery. Neonates and cardiac arrests were excluded from analysis. Data were collected locally using a standardised proforma and centrally collated. All intubations were performed according to the preference of the treating team. Results Hypnotics were used for 164 out-of-theatre intubations. Seventy-six per cent of intubations were accomplished by the use of propofol. Propofol was more likely to cause hypotension than other hypnotics (27.4% vs. 14.3%). Use of alternatives increased with seniority of the intubator. Consultants and senior trainees were less likely to use propofol than junior trainees (73% vs. 93%). Etomidate was not used at all. Previous studies from North American and European centres demonstrate greater use of alternative induction agents, particularly etomidate and ketamine [1-4]. UK practice has also changed over time, comparing our study with historical controls [5,6]. Conclusions There is significant geographical variation in choice of induction agent for critically ill patients. There has been an increase in the use of propofol amongst UK physicians over the past 7 years. Choice of hypnotic agent has a significant impact on physiological stability and out-of-theatre intubations are commonly performed in emergent circumstances on unstable patients. This study raises concerns that UK physicians choose induction agents based on familiarity rather than the pharmacodynamic profile. References 1. 2. 3. 4. 5. 6.
Jaber S, et al.: Crit Care Med 2006, 34:2355-2361. Griesdale DEG, et al.: Intensive Care Med 2008, 34:1835-1842. Jabre P, et al.: Lancet 2009, 374:293-300. Jaber S, et al.: Intensive Care Med 2010, 36:248-255. Graham CA, et al.: Emerg Med J 2003, 20:3-5. Reid C, et al.: Emerg Med J 2004, 21:296-301.
P154 Frequency and significance of post-intubation hypotension during emergency airway management A Heffner, D Swords, J Kline, A Jones Carolinas Medical Center, Charlotte, NC, USA Critical Care 2011, 15(Suppl 1):P154 (doi: 10.1186/cc9574) Introduction Arterial hypotension is known to follow emergency intubation but the significance of this event is poorly described. We aimed to measure the incidence of post-intubation hypotension (PIH) following emergency intubation and determine its association with inhospital mortality. Methods A retrospective cohort study of endotracheal intubations performed in a large, urban emergency department over a 1-year period. Patients were included if they were >17 years old and had systolic blood pressure (SBP) >90 mmHg for 30 consecutive minutes prior to intubation. Patients were analyzed in two groups: those with PIH defined by SBP <90 mmHg within 60 minutes of intubation, and those with no PIH. The primary outcome was hospital mortality. Results Emergency intubation was performed on 465 patients, of which 336 met inclusion criteria and were analyzed. The median patient age was 49 years, 59% of patients presented with nontraumatic illness and 92% underwent induction with etomidate. PIH occurred in 76/336 (23%) of patients. The median time to first PIH was 11 minutes (IQR 2 to 27). Intubation for acute respiratory failure was the only independent predictor of PIH (OR = 2.1, 95% CI = 1.1 to 4.0). Patients with PIH had significantly higher in-hospital mortality (33% vs. 21%; 95% CI for 12% difference = 1 to 23%) and longer mean ICU length of stay (9.7 vs. 5.9 days, P <0.01) and hospital length of stay (17.0 vs. 11.4 days, P <0.01). Multivariate logistic regression analysis confirmed PIH as an independent predictor of hospital mortality (OR = 1.9, 95% CI = 1.1 to 3.6). Conclusions PIH occurs in nearly one-quarter of normotensive patients undergoing emergency intubation. Intubation for acute respiratory failure is an independent predictor of PIH. PIH is associated with a significantly higher in-hospital mortality and longer ICU and hospital lengths of stay.
S55
P155 Clinical experiences with a new endobronchial blocking device: the EZ-Blocker T Végh, A Enyedi, I Takács, J Kollár, B Fülesdi University of Debrecen, Hungary Critical Care 2011, 15(Suppl 1):P155 (doi: 10.1186/cc9575) Introduction Both elective and emergency thoracic surgical procedures may require one-lung ventilation (OLV) for lung isolation [1]. Although in the majority of the cases a double lumen endotracheal tube (DLT) is the first choice, there are situations when insertion of DLT is not feasible [2]. We therefore intended to test the applicability of a recently developed endobronchial blocker (BB), the EZ-Blocker, in clinical practice. Methods Data were obtained from 10 patients undergoing thoracic surgery necessitating OLV. For lung isolation, a single lumen tube (SLT) and EZ-Blocker as BB were used. The time of insertion and positioning of BB, the lung deflation time with the BB cuff inflated and deflated, the minimal occlusion volume (MOV) of the BB cuff with 25 cmH2O positive airway pressure (PAP) and intracuff pressure (ICP) at MOV were registered. Based on the CT scan the diameter of the right (RMB) and left main bronchus (LMB) at 1 cm distal apart from the bifurcation was measured offline. Lung deflation was defined as 5.5 cm distance of the upper lobe from the rib cage at open chest. Results The insertion time was 76 ± 15 seconds. The lung deflation time through the lumen with the BB cuff inflated was 700 ± 83 seconds, and with a deflated cuff through the lumen of SLT was 9.4 ± 0.7 seconds. The MOV was 6.7 ± 1 ml in LMB versus 8 ± 1 ml in RMB (P = 0.03). The ICP was 40 ± 4 mmHg in LMB versus 85 ± 5 mmHg in RMB (P <0.001). With linear regression there were strong positive relationships between the diameter of MB and MOV/ICP. Conclusions The use of EZ-Blocker is easy and safe for infrequent users, too. The short insertion time and short lung deflation time allows use in an emergency situation or in case of a difficult airway. Only a small fraction of ICP (10 to 20%) is transmitted to the bronchial wall and it does not cause mucosal ischemia. The diameter of the MB has great impact on the MOV and ICP. The MOV is similar but ICP is smaller than published in previous reports with other BBs [3]. References 1. 2. 3.
Mungroop HE, et al.: Br J Anaesth 2010, 104:119-120. Benumof JL: J Cardiothor Vasc Anesth 1998, 12:131-132. Roscoe A, et al.: Anesth Analg 2007, 104:655-658.
P156 Rohrer’s constant, k2, as a factor for determining endotracheal tube obstruction AG Flevari, N Maniatis, E Dimitriadou, M Theodorakopoulou, E Paramythiotou, N Christoforidis, A Kaziani, D Koukios, F Drakopanagiotakis, A Armaganidis Attikon University Hospital, Athens, Greece Critical Care 2011, 15(Suppl 1):P156 (doi: 10.1186/cc9576) Introduction The purpose of the study was to apply a method by which to measure Rohrer’s constant, k2, in order to estimate endotracheal tube (ETT) resistance (RETT). The resistance drop across the ETT is expressed by the equation RETT = k1 + k2V’, as Rohrer described, where k1 is the constant of laminar flow (V’) and k2 is the constant of turbulent flow. In our past study we graphed RETT over inspiratory V’ for ETTs with inner diameters of 6.5 to 9.0 mm [1]. This graph provided us with k1 and k2 constant values, for each ETT size. Methods Ten intubated patients with ETTs with difficulty in patency were included in the study. Patients were all fully sedated and mechanically ventilated, by a Siemens Servo 300 ventilator, under constant flow. Pressure data were obtained: at the proximal end of the ETT (Pproximal), reflecting the impedance distally to the proximal end of the ETT; and at the distal end of the ETT (Pdistal), reflecting the resistance distally to the distal end of the ETT. Pdistal was recorded by an intratracheal catheter, placed 2 cm above the carinal end of the ETT. Each resistance was calculated by dividing ΔP (Ppeak – Pplateau) by V’, at every point of interest (either proximal or distal sites), using the rapid end-inspiratory occlusion method. RETT resulted from the difference:
Critical Care 2011, Volume 15 Suppl 1 http://ccforum.com/supplements/15/S1
S56
use of Ambu bag (4.6%), reintubation (2.3%), insertion of chest tube (2.3%) and other measures (11.6%). Most patients required at least two interventions. Patients developing AD had significantly higher (P <0.05) SAPS II (median 54 vs. 42), SOFA (9 vs. 6) scores and ICU stay (41 vs. 8). None of the episodes had fatal outcome. Most common hours for developing AD were 07.00, 14.00 and 23.00. Conclusions AD is a common medical emergency condition requiring prompt interventions. One over three patients developed at least two episodes of AD corresponding to one episode per 4.3 days. The most common etiology is atelectasis and secretion retention.
Figure 1 (abstract P156). Comparison of the k2 constant in vivo value with the corresponding in vitro k2 value.
RETT = Rproximal – Rdistal. A two-tailed t test (unpaired with unequal variances) was used to analyse the difference between data and the level of significance P was set at 0.05. Results Ten patients (five men), with mean age of 66 ± 17 years, were tested. Figure 1 demonstrates the difference in measured k2 constant values compared with baseline in vitro values of the corresponding ETT size, for every patient. This is based on the assumption that at the moment of endotracheal intubation, the k2 constant has approximately the same value as the one measured in vitro. Figure 1 shows that the in vivo values were significantly higher (P = 0.0012). Conclusions Our data suggest a significant discrepancy between predicted and in situ ETT resistance, raising concern for the presence of unrecognized ETT obstruction. Comparing the k2 constant, measured in vivo, with its corresponding in vitro value provides an estimation of ETT’s resistive behaviour. Reference 1.
Flevari A, et al.: Intensive Care Med 2010, 36(Suppl 2):S213.
P157 Acute desaturation in intubated patients P Myrianthefs1, C Kouka2, E Giannelou2, E Evodia2, G Baltopoulos2 1 School of Nursing, Athens University, Kifissia, Greece; 2School of Nursing, Athens University, ‘Agioi Anargyroi’ Hospital, Kifissia, Greece Critical Care 2011, 15(Suppl 1):P157 (doi: 10.1186/cc9577) Introduction The purpose of the study was to record the incidence, the etiology and management of acute desaturation (AD) in intubated critically ill ICU patients. Methods We collected demographics of the patients developing AD defined as a documented fall in SaO2 (>3%) in combination with clinical signs of respiratory distress requiring medical intervention. Etiology of AD was investigated by clinical evaluation, ABG analysis and chest X-ray. Numerical data are presented as mean (SEM) or median. Results We included 57 patients (37 men) admitted to our ICU within 6 months of mean age 54.4 (2.7) and mean ICU stay of 25.9 (5.7) days. We recorded 42 episodes of AD in 19 patients (33%). Mean age was 51.4 (3.8), mean ICU stay 51.1 (15.3) days and illness severity APACHE II 20.8 (1.6), SAPS II 52.2 (3.3) and SOFA 9.2 (0.8). The incidence was one episode per 30 ventilator-days or one every 4.3 days, corresponding to 2.3 (1.1) episodes per patient. Mean fall in SaO2 was 5%, in PaO2 44 mmHg and in PaO2/FiO2 113. Eight episodes developed while on T-piece due to atelectasis/secretion retension (6) or respiratory muscle fatigue (2). The remaining episodes developed in patients under sedation: atelectasis/secretion retention (10), pulmonary edema (6), fever/SIRS (5), occlusion/displacement of endotracheal tube (5), patient–ventilator asychrony (4), bronchospasm (2), patient transfer (1) and pneumothorax (1). Management included FiO2 increase (53.5%), physiotherapy/bronchial toilet/patient poisoning (39.5%), change in ventilator mode (23.3%), PEEP increase (23.3%), drugs (sedation, diuresis, bronchodilators, 16.2%), change in respiratory rate (11.6%),
P158 Continuous control of tracheal cuff pressure and microaspiration of gastric contents: a randomized controlled study S Nseir, F Zerimech, C Fournier, R Lubret, P Ramon, A Durocher, M Balduyck University Hospital, Lille, France Critical Care 2011, 15(Suppl 1):P158 (doi: 10.1186/cc9578) Introduction Underinflation of a tracheal cuff frequently occurs in critically ill patients, and results in microaspiration of contaminated oropharyngeal secretions and gastric contents that plays a major role in the pathogenesis of VAP. The aim of this study was to determine the impact of continuous control of cuff pressure (Pcuff ) on microaspiration of gastric contents. Methods Patients requiring mechanical ventilation through a PVCcuffed tracheal tube >48 hours were eligible. Patients were randomly allocated to continuous control of Pcuff using a pneumatic device (Nosten®) (intervention group, n = 61) or routine care of Pcuff (control group, n = 61). Target Pcuff was 25 cmH2O in the two groups. The primary outcome was microaspiration of gastric contents as defined by the presence of pepsin at a significant level (>200 ng/ml) in tracheal secretions. Secondary outcomes included incidence of microbiologically confirmed VAP (tracheal aspirate >105 cfu/ml), incidence of tracheobronchial colonization, and tracheal ischemic lesions as defined by a macroscopic score. Pepsin was quantitatively measured in all tracheal aspirates during the 48 hours following randomization. A patient was considered as having abundant microaspiration when >65% of tracheal aspirates were pepsin positive. Patients remained in a semirecumbent position in bed, and a written enteral nutrition protocol was used. All analyses were performed on an intention-to-treat basis. Results Patient characteristics were similar in the two groups. The pneumatic device was efficient in controlling Pcuff. Pepsin was measured in 1,205 tracheal aspirates. The percentage of patients with abundant microaspiration (18% vs. 46%, P = 0.002, OR (95% CI) 0.25 (0.11 to 0.59)), pepsin level (median (IQ) 195 (95 to 250) vs. 251 (130 to 390), P = 0.043), and VAP rate (9.8% vs. 26.2%, P = 0.032, 0.30 (0.11 to 0.84)) were significantly lower in the intervention group compared with control group. However, no significant difference was found in rate of patients with tracheobronchial colonization (34% vs. 39%, P = 0.7) or in tracheal ischemia score (4.5 (1 to 6) vs. 4.5 (1 to 7), P = 0.9) between the two groups. Conclusions Continuous control of Pcuff is associated with significantly decreased microaspiration of gastric contents in critically ill patients. P159 Outcome of tracheostomy timing on critically ill adult patients undergoing mechanical ventilation: a retrospective observational study A Dhrampal, D Pearson, N Berry Norfolk and Norwich University Hospital, Norwich, UK Critical Care 2011, 15(Suppl 1):P159 (doi: 10.1186/cc9579) Introduction Tracheostomy is now an established standard of care in the management of some critically ill patients. Despite this, however, the effect of its timing on patient outcome remains unclear [1]. Methods We interrogated the database of our clinical information system (MetaVision, iMDSoft) and identified 75 patients who underwent tracheostomy insertion. Outcome data, including 28-day mortality, length of stay (LOS) and weaning interval, were captured
Critical Care 2011, Volume 15 Suppl 1 http://ccforum.com/supplements/15/S1
S57
for those patients undergoing tracheostomy <4 days into critical care admission (early group) and >4 days into critical care admission (late group). Continuous data when expressed as mean (SD) were analysed using t-test and when expressed as median (IQR) were analysed using the Mann–Whitney U test. Binary outcome data were analysed using the chi-square test. P <0.05 was considered statistically significant. Results The early group (n = 32) had a mean LOS of 19 days (SD = 16.57), median weaning interval of 9 days (IQR = 9.5) and a mortality of 12.5% (n = 4). The late group (n = 43) had a mean LOS of 21.6 days (SD = 12.62), median weaning interval of 8 days (IQR = 13) and a mortality of 27.9% (n = 12). More tracheostomies were performed late at our institution, but despite this there was no significant difference in LOS (P = 0.481, t test), weaning interval (P = 0.852, Mann–Whitney U test) or 28-day mortality (P = 0.107, chi-square test) between the two groups. Conclusions Many clinicians believe that early tracheostomy insertion may benefit critically ill patients requiring mechanical ventilation. This benefit does not seem to extent to 28-day survival, critical care LOS or weaning from mechanical ventilation. Reference 1.
Griffiths J, et al.: BMJ 2005, 330:1243-1246. Figure 1 (abstract P161). Difference between maximal grip forces.
P160 Duration of mechanical ventilation on the result of diaphragmatic function in weaning HB Qiu, W Guo, Y Yang Zhongda Hospital, Southeast University, Nanjing, China Critical Care 2011, 15(Suppl 1):P160 (doi: 10.1186/cc9580) Introduction To investigate the influence of duration of mechanical ventilation on the diaphragmatic function. Methods Patients included in this study were those mechanically ventilated for at least 24 hours and were preparing to wean from December 2008 to December 2009 in the ICU of Nanjing Zhong-Da Hospital. Patients, according to the duration of mechanical ventilation, were divided into group A (ventilated less than 3 days) and group B (ventilated more than 3 days). A 30-minute spontaneous breathing test (SBT) was carried out on the patients satisfying the weaning permission. Indices of diaphragm function such as electrical activity of diaphragm (Edi), neuromuscular strength index (NMS), neuromechanical coupling (NMC) and neuroventilatory coupling (NVC) at 0, 5 and 30 minutes of SBT were monitored. Results Forty-four patients were included finally, of whom 19 patients (43.2%) were ventilated more than 3 days (group B), while the average duration of mechanical ventilation was 6.2 ± 3.9 days. Twenty-five patients were ventilated less than 3 days (group A), whom had an average duration of mechanical ventilation for 2.2 ± 0.7 days. There was no significant difference in Edi, NMS, NMC or NVC at 0 minutes of SBT between the two groups. Edi and NMS in group B were 20 ± 11 μV and 571 ± 338 μV•cpm at 5 minutes of SBT, which were both largely more than group A (16 ± 8 μV and 387 ± 208 μV•cpm, P <0.05). Then, NMC and NVC had no significant difference. At SBT 30 minutes, Edi and NMS in group B both were significantly higher than group A (23 ± 11 μV vs. 15 ± 8 μV, 598 ± 309 μV•cpm vs. 362 ± 224 μV•cpm, P <0.05). Whereas NVC in group B (20 ± 12 ml/μV) was lower than group A (35 ± 21 ml/μV, P <0.05). Conclusions The contractility and endurance of diaphragm decreased in patients whom were ventilated more than 3 days at 30 minutes of SBT. It seemed that an incremental duration of mechanical ventilation could exacerbate diaphragm dysfunction, which might be one of the important factors leading to failed weaning. P161 Hand-grip test is a good predictor of extubation success in adult ICU patients D De Bels1, J Devriendt1, P Gottignies1, D Chochrad2, S Theunissen3, T Snoeck3, C Balestra3, U Pilard3, S Roques1 1 Brugmann University Hospital, Brussels, Belgium; 2Hôpitaux IRIS Sud, Brussels, Belgium; 3ISEK Environmental Physiology Laboratory, Brussels, Belgium Critical Care 2011, 15(Suppl 1):P161 (doi: 10.1186/cc9581) Introduction Ventilator weaning protocols have been published during the past 20 years. Although patients fulfill weaning criteria, they may still
experience extubation failure. Risk factors include respiratory muscle weakness. This is accompanied by peripheral muscle weakness. The aim of the study is to evaluate the possible relation between peripheral (hand) muscle strength and extubation success in ICU patients. Methods Fifty-four consecutive patients (62 ± 14 years) extubated in the ICUs of the Brugmann University Hospital and the Etterbeek-Ixelles General Hospital were included in the study. Extubation failure was defined as reintubation within 48 hours after extubation. Hand muscle strength is measured by a grip test method. Results Maximal hand grip strength is statistically (14.8 ± 7.7 vs. 5.3 ± 3.8 kg, P <0.001) higher in patients successfully undergoing extubation compared with patients failing extubation. See Figure 1. Conclusions Hand grip strength testing is a good predictor of successful extubation in ICU patients. The positive predictive value of 100% is obtained if maximal strength is >13 kg. Further studies are needed before grip testing could be routinely used as a decisionmaking test for extubation in ICU patients. P162 Use of NT-proBNP in weaning from mechanical ventilation A Martini, B Benedetti, N Menestrina, E Polati, E Bresadola, L Gottin University Hospital, Verona, Italy Critical Care 2011, 15(Suppl 1):P162 (doi: 10.1186/cc9582) Introduction Our objective is to evaluate the role of the levels of B-type natriuretic peptide (BNP), released in response to increased wall tension, as a predictor of weaning failure. Methods We enrolled 98 patients, admitted to the ICU for acute respiratory failure, who underwent mechanical ventilation and were considered ready for a weaning trial. Patients were divided by means of echocardiographic criteria into four groups according to the severity of heart dysfunction: Group 1: normal left and right ventricular function and absence of relevant valvulopathy; Group 2: mild left systolic ventricular dysfunction, ejection fraction >40%, mild valvulopathy, diastolic dysfunction >II; Group 3: moderate to severe left systolic ventricular dysfunction, ejection fraction <40%; and Group 4: severe right ventricular dysfunction: ventricular volumes R/L >0.6, arterial pulmonary pressure >30 mmHg. Plasma NT-proBNP was measured just before (BNP 1) and at the end (BNP 2) of the weaning trial in all patients. Patients who passed the weaning test were finally extubated. Extubation was considered failed if the patient required reintubation within 48 hours. We compared plasma BNP concentrations in the different groups with Mann–Whitney or chi-square tests and we considered also ΔBNP (BNP 2 – BNP1) and %Variation (Δ / BNP1). Results In the whole sample NT-proBNP levels were not significantly different in patients who had a positive weaning and in those who failed it. ΔBNP and %Variation were higher (P <0.001) in patients who failed the test than in patients who passed the test. In Group 1
Critical Care 2011, Volume 15 Suppl 1 http://ccforum.com/supplements/15/S1
S58
a higher ΔBNP, and in Group 2 a higher ΔBNP and %Variation, were correlated with weaning failure. In Group 4, instead, the plasma BNP concentration decreased during the weaning test. ROC curve analysis was performed to assess ΔBNP and %Variation’s ability to discriminate between patients who had a positive weaning and those who failed. In Group 1 the area under the ROC curve values were 0.88 for ΔBNP and 0.94 for %Variation. In Group 2 the area under the ROC curve values were 0.64 for ΔBNP and 0.86 for %Variation. Conclusions Recent papers evaluated the role of BNP in patients who had undergone mechanical ventilation. In our population ΔBNP and %Variation before and after the weaning test are more reliable than NT-proBNP levels to detect extubation failure in patients with mild cardiopathy or without relevant cardiopathy. In patients with severe cardiopathy because of the complexity of clinical pattern, NT-pro-BNP cannot be used as a predictive marker of extubation failure. P163 Efficacy of implementation strategies of an evidenced-based awakening and breathing protocol O Almuslim, M Rezk, N Hassan King Fahad Specialist Hospital – Dammam, Saudi Arabia Critical Care 2011, 15(Suppl 1):P163 (doi: 10.1186/cc9583) Introduction A protocol that paired spontaneous awakening trials (SAT) and spontaneous breathing trials (SBT) decreased duration of mechanical ventilation (DMV), ICU length of stay (LOS) and mortality [1]. We studied the efficacy of multifaceted implementation strategies (MIS) of an evidenced-based protocol at a tertiary academic center. Methods This was a prospective observational cohort study with historical control. The cohort consisted of consecutive patients who were extubated at least once during the ICU stay. The intervention was MIS of a quality improvement (QI) protocol pairing SAT and SBT. These strategies included: preprinted daily order sheets, structured daily multidisciplinary rounds, QI monitoring and regular feedback to the ICU staff. The outcomes: DMV, ICU LOS, reintubation and hospital mortality. Chi-square and t tests, adjusted logistic and Cox regressions were used. Table 1 (abstract P163). Main outcomes 2009 group (n = 40)
2010 group (n = 80)
P value
MV duration (days)
10.3 (SD 8.6)
5.3 (SD 6.7)
<0.01
ICU LOS (days)
12.4 (SD 8.3)
8.6 (SD 9.1)
0.03
Reintubation
33% (n = 13)
18% (n = 14)
0.06
Hospital mortality
60% (n = 24)
20% (n = 16)
<0.01
Results Total patients n = 120 (2009, n = 40; 2010, n = 80). The baseline characteristics were imbalance for age and APACHE II. The 2010 group (after QI) had less DMV, ICU LOS and hospital mortality (Table 1). The adjusted hazard ratio in reducing time to extubation = 0.57 (95% CI = 0.37 to 0.88) and adjusted odds ratio for hospital mortality = 0.27 (95% CI = 0.12 to 0.67) in the 2010 group. See Figure 1. Conclusions MIS of a paired SAT and SBT protocol reduced duration of MV, ICU LOS and hospital mortality. Reference 1.
Girard T, et al.: Lancet 2008, 371:126-134.
P164 Can we predict left ventricular dysfunction-induced weaning failure? Invasive and echocardiographic evaluation A Abdelbary, W Ayoub, Y Nassar, K Hussein Faculty of Medicine, Cairo University, Cairo, Egypt Critical Care 2011, 15(Suppl 1):P164 (doi: 10.1186/cc9584) Introduction The aim was to study the relation of weaning failure to development of diastolic dysfunction using echocardiography and PA catheter. Methods Thirty invasively mechanically ventilated patients fulfilling criteria of weaning from mechanical ventilation were shifted to SBT (using low PSV (8 cmH2O)) for 30 minutes. Two sets of variables were measured at the beginning and end of the SBT. Weaning failure was defined as: failed SBT, reintubation and/or ventilation or death within 48 hours following extubation. A Swan–Ganz catheter was used to obtain the right atrial (RAP), pulmonary artery (PAP), pulmonary artery occlusion (PAOP) pressures, and cardiac index (CI). Echocardiography: the LV internal diameter at end diastole (LVIDd) and end systole (LVIDs), ejection fraction (LVEF), E/A ratio, deceleration time (DT) (ms), isovolumetric relaxation time (IVRT), and E/E’ ratio. Results Mean age was 56.6 ± 15.9 years, 53% were males. The outcome of weaning was successful in 76.6% of patients. The patients were subdivided into two groups according to weaning outcome: Group I, 23 patients (successful weaning); Group II, seven patients (failed weaning). RAP, PAOP and SVO2 were similar at the start of SBT (6.3 ± 1.9 vs. 7.6 ± 2.3, P = 0.1; 12 ± 3.7 vs. 14.6 ± 3, P = 0.4; 72 ± 2.4 vs. 71 ± 3.1, P = 0.1) between Groups I and II yet significantly different at the end (6.2 ± 2.4 vs.10 ± 3.5, P = 0.01; 12.8 ± 3.5 vs.19 ± 5.4, P = 0.004; 73 ± 2.8 vs. 66.6 ± 7, P = 0.009), respectively. CI was similar between Groups I and II at both ends of the SBT, P = 0.5 and P = 0.9. Groups I and II had similar LVIDs and EF at the beginning of SBT (3 ± 0.7 vs. 3.3 ± 0.5, P = 0.2; 68 ± 8 vs. 62 ± 6, P = 0.08) yet different at the end (3 ± 0.6 vs. 3.5 ± 0.5, P = 0.048; 66 ± 8 vs. 58 ± 7, P = 0.03), respectively. There was no significant differences in E/A, IVRT, DT yet a significant difference in E/E’ between Group I and Group II at both ends of the trial (1.04 ± 0.4 vs. 0.97 ± 0.3, P = 0.78; 1.02 ± 0.4 vs. 1.07 ± 0.4, P = 0.78; 94 ± 26 vs. 99.6 ± 18, P = 0.52; 97 ± 22 vs. 91 ± 24, P = 0.57; 194 ± 31 vs. 196 ± 30, P = 0.98; 197 ± 27 vs. 189 ± 33, P = 0.6; 8.9 ± 2 vs. 12.2 ± 4, P = 0.02; 9.4 ± 2.3 vs. 13 ± 5, P = 0.02), respectively. Conclusions LV dysfunction may have an impact on weaning outcome. Invasive monitoring as well as echocardiography and tissue Doppler indices may be reliable in monitoring and detection of LV dysfunction, and subsequently may be possibly useful in improving weaning outcome. RAP may be a particularly reliable and easy method to monitor during the period of weaning. P165 High-flow oxygen therapy through nasal cannulae versus low-flow oxygen therapy via Venturi mask after extubation in adult, critically ill patients F Antonicelli, A Cataldo, R Festa, F Idone, A Moccaldo, M Antonelli, SM Maggiore ‘A. Gemell’ University Hospital, Rome, Italy Critical Care 2011, 15(Suppl 1):P165 (doi: 10.1186/cc9585)
Figure 1 (abstract P163). Time to extubation KM curve.
Introduction Oxygen therapy, usually delivered with the Venturi mask, is frequently used in critically ill patients after extubation. This device delivers low-flow oxygen with cold humidification. Recently available is
Critical Care 2011, Volume 15 Suppl 1 http://ccforum.com/supplements/15/S1
a new device for oxygen therapy through nasal cannulae (NHF). Such a device delivers up to 60 l/minute oxygen, with heated humidification. The aim of this study was to compare the effects of these two devices for oxygen therapy on arterial blood gases, discomfort and adverse events in critically ill patients after extubation. Methods Inclusion criteria were mechanical ventilation for more than 24 hours and a successful spontaneous breathing trial with PaO2/ FiO2 <300 at the end of the trial. Exclusion criteria were tracheostomy, age <18 and anticipated need for non-invasive ventilation after extubation. Patients were randomized to receive oxygen therapy with NHF or Venturi mask after extubation. With both devices, nominal FiO2 was set to obtain SpO2 between 92 and 98% (between 88 and 95% in hypercapnic patients). Arterial blood gas, respiratory rate, and discomfort were recorded at 1, 3, 6, 12, 24, 36, and 48 hours from inclusion. Discomfort was assessed by asking patients to rate their discomfort related to the interface and to the upper airway dryness (mouth, throat, and nose dryness, difficulty to swallow and throat pain), using a numerical scale from 0 (no discomfort) to 10 (maximum discomfort). Results Seventy-five patients were enrolled (40 NHF, 35 Venturi mask). No difference was observed in the baseline characteristics at inclusion. PaO2/FiO2 was higher in the NHF group, being statistically significant at 1, 3, 24, and 36 hours (317 ± 78 vs. 253 ± 84 at 24 hours, P <0.01). PaCO2 was similar in the two groups. Nominal FiO2 and the respiratory rate were always lower with NHF than with Venturi mask (30 ± 6 vs. 37 ± 10%, P = 0.01, and 21 ± 4 vs. 27 ± 4 breaths/minute at 24 hours, P <0.01, respectively). Discomfort due to the interface was higher with the Venturi mask at 12, 24, 36, and 48 hours (4 ± 3 vs. 6 ± 3 at 24 hours, P <0.01). Discomfort related to dryness of the upper airways was also higher with the Venturi mask than with NHF at all time steps (2 ± 2 vs. 4 ± 2 at 24 hours, P <0.01). Oxygen desaturations and interface displacements were more frequent with the Venturi mask than with NHF (94 vs. 40% patients, P <0.01, and 71 vs. 30% patients, P <0.01, respectively). Conclusions NHF is an effective method for delivering oxygen therapy after extubation, allowing better oxygenation with less patient discomfort and adverse events than the Venturi mask.
S59
large granulations in one case, and intubation with small endotracheal tube after partial dilation in one case. Conclusions Management of PITS in the ICU was beneficial for some of our patients and especially those with CPITS. VT allowed precise measurements of PITS. HFJV created stable conditions for work.
P167 Can extubation failure be related to high unit activity? I Keith, R Sundaram, KD Rooney RAH, Glasgow, UK Critical Care 2011, 15(Suppl 1):P167 (doi: 10.1186/cc9587) Introduction Extubation failure has become an important quality indicator. The aim of our study was to ascertain whether extubation failure was related to unit activity; that is, whether it was more frequent on days of greater unit activity. Methods We retrospectively analysed 520 consecutive admissions to our seven-bed ICU over an 18-month period. We defined extubation failure as the need for reintubation within 24 hours. Bed occupancy was used as a surrogate marker of unit activity. Bed occupancy was based upon the number of hours patients were nursed in the ICU each day and was summed and expressed as a percentage of the maximum available (24 x 7). Data were collected from our national audit database and analysed using SPSS software. Results We studied 520 intubated patients over an 18-month period after excluding children, tracheostomised patients and patients who were receiving end-of-life care. Sixty-five patients (12.5%) were reintubated within the 24 hours. Bed occupancy was not different in the extubation success group as compared with the failure group (70.6 CI ± 1.75 vs. 72.9 CI ± 4.9; P = 0.37). The two groups were similar in terms of their severity of illness; that is, APACHE II scores. Length of stay was increased in the extubation failure group. There was no correlation between bed occupancy and extubation failure using the Pearson correlation coefficient (R = 0.05; P = 0.68). See Table 1 and Figure 1. Conclusions We could not demonstrate any correlation between high unit activity and reintubation rates. Reference 1.
P166 Post-intubation tracheal stenosis in the ICU: diagnosis and treatment N Makhoul1, E Altman2, S Croitoru3, S Ivry2, A Gurevich2, S Krimerman3, M Croitoru3 1 Western Galilee Hospital, Naharya, Israel; 2Western Galilee Hospital Naharia, Israel; 3Bnai Zion Medical Center, Haifa, Israel Critical Care 2011, 15(Suppl 1):P166 (doi: 10.1186/cc9586) Introduction Prolonged mechanical ventilation of critically ill patients may be complicated by formation of post-intubation tracheal stenosis (PITS) with respiratory disorders of different grades. Critical post-intubation tracheal stenosis (CPITS) may create life-threatening conditions. However, organized teamwork on the ground in the ICU may give positive results. Methods We reviewed retrospectively the medical records of 17 patients admitted to our ICU with PITS and CPITS during 2003 to 2010. Ten of them were males with mean age 68 years old and seven females with mean age 72. In relatively stable patients, computed tomography (CT) and virtual tracheoscopy (VT) were used, followed by rigid (RB) or fiberoptic (FOB) bronchoscopy. In emergency cases we used RB for diagnosis and treatment. All procedures in the operating room were done under general anesthesia, the majority with high-frequency jet ventilation (HFJV). Results In 13 patients PITS had diameter of about 5 to 6 mm and produced dyspnea. Four of 13 patients had soft PITS that were dilated with boogie; in another five patients with hard stenosis, balloon dilation was used. In the remaining four patients with severe respiratory distress, CPITS was diagnosed as having diameter of 3 to 4 mm. Emergency tracheostomy was performed in two patients; excision of
Beckmann U, et al.: Chest 2001, 120:538-542.
Table 1 (abstract P167). Control
Failure
455
65
Age
57.26
51.2
0.01
APACHE
20.33
21.5
0.69
Number
P value
Bed occupancy
70.6
72.9
0.37
Admitted
1.21
1.21
0.84
Discharged
1.4
1.32
0.37
Figure 1 (abstract P167). Scatterplot of reintubation rates versus bed occupancy.
Critical Care 2011, Volume 15 Suppl 1 http://ccforum.com/supplements/15/S1
P168 Decannulation: in the ICU or in the ward? Does it really matter? O Milercy, J López, J Figueira, J Manzanares, M Hernández La Paz Hospital, Madrid, Spain Critical Care 2011, 15(Suppl 1):P168 (doi: 10.1186/cc9588) Introduction The aim of our study was to evaluate the in-hospital mortality of patients who underwent tracheostomy during their ICU admission, and were discharged to different areas of the hospital prior to decannulation. Methods A prospective observational study of a group of patients who underwent tracheostomy in our ICU from January 2001 to December 2007 and were discharged to different areas of the hospital prior to decannulation. The mortality of patients decannulated or not in the wards was reviewed. Results Between January 2001 and December 2007, 6,333 patients were admitted to our unit. A total of 1,528 needed mechanical ventilation (MV) for more than 48 hours. Four hundred and fortythree underwent tracheostomy (29% of patients needed prolonged MV). Mean age was 56 years, 66% were male. Mean APACHE II score was 20. The main diagnoses were polytrauma that included head injury (24.2%), other structural neurological diseases (21%), prolonged weaning of several etiologies – sepsis, post-surgical (35%). Tracheostomy was performed with the percutaneous dilatational technique (PDT) in most cases (90%). The most frequent complication was subglottic stenosis presenting in 15 patients. Ninety-two patients (20.77%) died in the ICU and 351 were discharged to different wards. Of these 351, 161 (45.8%) could be decannulated in the ICU and 109 (31%) in the wards. Eighty-one patients (23%) could not be decannulated. The ward mortality in patients decannulated in the ICU was 5.6% (9/161), for those decannulated in the wards was 10% (11/109). In patients not decannulated the mortality reached 37% (30/81). There were no differences of statistical significance in mortality between patients decannulated in the ICU and patients decannulated in the wards (5.6% vs. 10%; OR = 1.9 CI = 0.8 to 4.2). The main diagnoses in the patients who died on the wards were: 31 residual encephalopathy (post-anoxic, post-traumatic, others), five severe chronic respiratory failure, three spinal cord injury, two neuromuscular disease. Conclusions Mortality was not related to whether decannulation was done in the ICU or on the ward. Although mortality was higher in the group of patients that could not be decannulated in either setting due to their poor neurological or functional status. Several authors suggest tracheostomy in these patients only delays their death without improving overall in-hospital survival due to their poor vital prognosis. References 1. 2.
Scales DC: Crit Care Med 2008, 36:2547-2557. Tobin AE: Crit Care 2008, 12:R48.
P169 Assessment of the impact of unplanned extubation on ICU patient outcome E Bastos de Moura, J Aires de Araújo Neto, M De Oliveira Maia, F Beserra Lima, R Fernandes Bomfim Hospital Santa Luzia, Brasília, Brazil Critical Care 2011, 15(Suppl 1):P169 (doi: 10.1186/cc9589) Introduction The objective of this study is to investigate and analyze the events of unplanned extubation (UE) in the ICU of Santa Luzia Hospital, Brasília, Brazil. Incidence rates of unplanned extubation vary; reported rates range from 3% to 14%. This phenomenon occurs during procedures performed by healthcare workers, or in self-extubation if the patient removes the endotracheal tube. Unplanned extubations are considered an indicator of healthcare quality in the ICU. Reintubation may be necessary and is associated with complications, including emergency cricothyrotomy, cardiac arrest, and death. Methods A retrospective cohort study, analysing the cases of UE reported between January 2009 and June 2010 in Santa Luzia Hospital’s ICU. In this period 3,302 patients were admitted, and 551 were submitted to mechanical ventilation (MV). The cases of UE are notified through proper form by the physiotherapy. The incidence rate
S60
of unplanned is calculated by the relationship between the number of patients extubated accidentally and the number of patients intubated/ day, multiplied by 100. Results The incidence rate of UE was 0.21% (nine patients in 4,232 days of MV). Only two extubations (22.22%) occurred accidentally while seven cases (77.78%) were self-extubation. Patients were predominantly female (55.56%; n = 5), mean age was 59.86 ± 27.28 years, mean SAPS II score of 35.33 ± 12.50 (RISK: 21.56 ± 18.32%), mean APACHE II score of 10.44 ± 6.27 (RISK: 17.11 ± 15.35%), mean duration of MV 8.68 ± 9.81 days, mean length of stay in ICU 15.89 ± 8.75 days. Two patients (22.22%) needed reintubation. In only one patient (11.11%) urgent cricothyrotomy was required due to difficulty on reintubation. Most patients had already started the weaning process (77.78%). The leading cause of accidental extubation was failure of restraint (88.89%) associated with psychomotor agitation (55.56%). We had three (33.33%) cases of death in the group, but not associated with the UE. Conclusions In the studied population we observed a low incidence of this adverse event, which demonstrates effectiveness in prevention strategies adopted. Reintubation and urgent cricothyrotomy rates were low, which resulted in increased length of stay in the ICU and MV. References 1. 2. 3.
Epstein SK, et al.: Am J Respir Crit Care Med 2000, 161:1912-1916. Curry K, et al.: Am J Crit Care 2008, 17:45-51. Tanios MA, et al.: Respir Care 2010, 55:561-568.
P170 Outcome and complications in infants with respiratory failure: venovenous two-site versus double-lumen ECMO M Hermon, G Mostafa, J Golej, G Burda, R Vargha, G Trittenwein Medical University of Vienna, Austria Critical Care 2011, 15(Suppl 1):P170 (doi: 10.1186/cc9590) Introduction Extracorporeal membrane oxygenation (ECMO) provides temporary life support for children with severe respiratory or cardiac failure. Since 1990, more than 27,000 children have received ECMO and an overall survival rate of 76% [1] has been observed. The objective of this study was to compare outcomes and complications of the two-site venovenous versus the double-lumen ECMO in infants with respiratory failure. Methods The Extracorporeal Life Support Organization (ELSO, Ann Arbor, MI, USA) registry database collected between 1999 and 2009 was provided for research. A total of 9,086 children ≤7 kg BW were treated with ECMO. From these children, those who were older than 32 days and received VV ECMO were extracted for analysis. A total of 270 children met the inclusion criteria. Two hundred and thirty-six children were treated with VVDL ECMO and 34 children received VV two-site ECMO. ELSO registry records were reviewed for the following information: demographic data, type of ventilation, ventilator days and settings during an ECMO run, complications during an ECMO run and outcome. Results In this study 87% (n = 236) of the children were cannulated with VVDL and 13% (n = 34) using the VV two-site technique. APGAR scores were significantly lower in the VV two-site group. Twenty-four hours after ECMO onset, ventilator settings were significantly higher in the VV two-site group. ECMO duration was significantly shorter in the VV twosite group (137 hours vs. 203 hours, P <0.01). The total complication rate, however, did not differ between the groups. Survival rates (71% in the VVDL group and 56% in the VV group) were not significantly different either. Conclusions The total complication rate was found to be similar in both groups. The ECMO duration period was significantly shorter in the VV two-site group. No difference was found in survival rates between the two groups. Neither of the two-cannulation methods – venovenous two-site or venovenous double-lumen ECMO – has shown any significant superiority. The decision about which technique to use for infants depends mainly on the best practice experience of each individual ECMO centre and their routinely-used technical equipment. Reference 1.
Extracorporeal Life Support Organization: Registry Report, International Summary; January 2009.
Critical Care 2011, Volume 15 Suppl 1 http://ccforum.com/supplements/15/S1
P171 Weaning-induced alterations in cardiac function: invasive and echocardiographic assessment A Abdelbary, W Ayoub, Y Nassar, K Hussein Faculty of Medicine, Cairo University, Cairo, Egypt Critical Care 2011, 15(Suppl 1):P171 (doi: 10.1186/cc9591) Introduction The aim was to study LV dysfunction during weaning from mechanical ventilation (MV). Methods Thirty invasively MV patients fulfilling the criteria of weaning were shifted to SBT (using low PSV (8 cmH2O)) for 30 minutes. Two sets of variables were measured at the beginning and end of the SBT: respiratory rate (F), tidal volume (VT), minute ventilation (VE), peak inspiratory pressure (PIP), PaO2/FIO2 ratio (P/F ratio); and one reading at the start of the SBT of: airway resistance (Raw), static respiratory compliance (Ceff ), maximum negative inspiratory pressure (NIP), (F/ VT), arterial blood gases. Weaning failure was defined as: failed SBT, reintubation and/or reventilation or death within 48 hours. Swan–Ganz catheterization was used to obtain the right atrial (RAP), pulmonary artery (PAP), pulmonary artery occlusion (PAOP) pressures, and cardiac index (CI). Echocardiography was used to obtain the LV internal diameter at end diastole (LVIDd) and end systole (LVIDs), ejection fraction (LVEF), E/A ratio, deceleration time (DT) (ms), isovolumetric relaxation time (IVRT), Doppler tissue imaging (DTI) and E/E’. Results Mean age 56.6 ± 15.9 years, 53% were male. Weaning was successful in 76.6% of patients. There was reduction in VT with increase in F and VE (0.53 ± 0.06 vs. 0.45 ± 0.1 l, P = 0.0003; 12.5 ± 2 vs. 20.3 ± 7.5, P <0.0001; 6.6 ± 1.5 vs. 8.8 ± 2.4 l, P <0.0001), respectively. P/F_1 was higher than P/F_2 (278 ± 86 vs. 252 ± 74, P = 0.005). ABG showed a reduction in PaO2 (126 ± 32 vs. 115 ± 29, P = 0.01) without change in PaCO2 (37.6 ± 6.4 vs. 36.5 ± 6.2, P = 0.24). There was a rise in PAOP with insignificant change in RAP, PAP, and CI (12.6 ± 4.7 vs. 14.2 ± 4.7, P = 0.003; 6.6 ± 2 vs. 7.2 ± 3, P = 0.16; 29.7 ± 7.2 vs. 29.7 ± 7, P = 1; 3.2 ± 0.6 vs. 3.22 ± 0.5, P = 0.4), respectively. There was a reduction in LVEF with insignificant LVIDd and LVIDs change (66.4 ± 8.1 vs. 64.5 ± 8.4%, P = 0.01; 4.83 ± 0.68 vs. 4.7 ± 0.7 cm, P = 0.5; 3.1 ± 0.7 vs. 3.12 ± 0.6 cm, P = 0.8), respectively. There was no differences between E/A, IVRT, and DT or E/E’ at both ends of the trial (1.02 ± 0.38 vs. 1.04 ± 0.37, P = 0.6; 95.5 ± 24 vs. 95.8 ± 22, P = 0.8; 194.6 ± 30 vs. 195 ± 28 ms, P = 0.8; and 9.7 ± 3.1 vs. 10.3 ± 3.5, P = 0.09), respectively. E/E’ and RAP correlated significantly before and after SBT (r = 0.54, P = 0.002; and r = 0.79, P <0.0001), respectively. Despite insignificant correlation between E/E’ and PAOP at the beginning of SBT, there was significant correlation between them at the end of SBT (r = 0.6, P = 0.001). Conclusions LV dysfunction during weaning is mainly diastolic. Changes in E/E’ and RAP and/or PAOP may be the most convenient methods for monitoring diastolic function during weaning from MV. P172 Impact of open lung ventilation on right ventricular outflow impedance assessed by transoesophageal echocardiography S Salah, H El-Akabawy Cairo University, Cairo, Egypt Critical Care 2011, 15(Suppl 1):P172 (doi: 10.1186/cc9592) Introduction Open lung concept ventilation is a method of ventilation intended to maintain end-expiratory lung volume by increased airway pressure [1]. Since this could increase right ventricular (RV) afterload, we investigated the effect of this method on RV outflow impedance during inspiration and expiration using transoesophageal echoDoppler in a trial to differentiate the RV consequence of increasing lung volume from those secondary to increasing airway pressure during mechanical ventilation. Methods Thirty stable patients on MV because of different causes were enrolled prospectively in this single-center, cross-sectional clinical study. Each patient was firstly subjected to conventional ventilation (CV) with volume-controlled ventilation, followed by OLC ventilation by switching to a pressure-controlled mode, then a recruitment maneuver applied until PaO2/FiO2 >375 torr. Hemodynamic (MAP, CVP and HR) and respiratory (peak, plateau and mean airway pressure and total and dynamic lung compliance) measurements were recorded before,
S61
20 minutes after a steady state of both CV and 20 OLC ventilation. Also, transoesophageal ECHO Doppler was performed at the end of inspiration and end of expiration to calculate the mean acceleration (ACmean), as a marker of the RV outflow impedance, 20 minutes after a steady state of both CV and OLC ventilation. Results During inspiration, ACmean was significantly lower during CV compared with OLC ventilation (P <0.001). Inspiration did not cause a significant decrease in ACmean compared with expiration during OLV (P <0.001) but did do so during CV. In comparison with baseline and CV, OLC ventilation was associated with a statistically significant higher CVP (P <0.001 for both), higher total quasi-static lung compliance (P <0.001 for both) and dynamic lung compliance (P = 0.001 for both). Moreover, the PaO2/FiO2 ratio of OLV was significantly higher than in baseline and CV (P <0.001 for both). Conclusions OLC ventilation does not change RV afterload during inspiration and expiration as RV afterload appears primarily mediated through the tidal volume. Moreover, OLC ventilation provides a more stable hemodynamic condition and better oxygenation and lung dynamics. Reference 1.
Hartog A, Vazquez de Anda G, et al.: At surfactant deficiency, application of ‘the open lung concept’ prevents protein leakage and attenuates changes in lung mechanics. Crit Care Med 2000, 28:1450-1454.
P173 Lung sound amplitude measured by vibration response imaging is influenced by the presence of secretions S Lev1, AS Stern-Cohen2, MS Shapiro1, JC Cohen1, YG Glickman2, PS Singer1 1 Rabin Medical Center, Beilinson Campus, Petach Tikva, Israel; 2DeepBreeze Ltd, Or-Akiva, Israel Critical Care 2011, 15(Suppl 1):P173 (doi: 10.1186/cc9593) Introduction There is no valid estimation of the presence of airway secretions in mechanically ventilated patients. Secretions may amplify breath sounds by increasing turbulence in the airways or alternatively decrease breath sounds by obstructing air flow. Vibration response imaging (VRI) was recently suggested as a tool to assess secretion removal following physiotherapy [1]. The objective of our analysis was to describe the acoustic effects of secretion removal by measuring the lung sound amplitudes pre and post airway suction in both lungs. Methods Twenty-two recordings pre-suction and 22 recordings postsuction (19 patients) were performed with VRI while the mode of ventilation remained constant. The sound amplitude measurements before and after the suction procedure were compared. Results After suction a decrease in total lung sound amplitude was detected in all of the recordings. The lung sound amplitude of the right lung decreased significantly by 3.3-fold from 52.05 ± 16.11 to 15.54 ± 5.36 arbitrary units (AU) (mean ± SEM) (n = 22, P <0.01). The left lung sound amplitude decreased by 2.4-fold from 28.42 ± 11.28 to 11.69 ± 3.15 AU (mean ± SEM) (n = 22, P >0.01). The flow rate (measured by the VRI D-lite flow meter) of both lungs increased significantly after secretion removal (n = 22, P <0.01). See Figure 1. Conclusions The finding that the VRI signal amplitude decreased after a suction procedure in ventilated patients suggests that secretions are usually noisy. This effect was more pronounced on the right side
Figure 1 (abstract P173). Lung sound amplitude of secretion removal (mean ± SEM).
Critical Care 2011, Volume 15 Suppl 1 http://ccforum.com/supplements/15/S1
probably due to expected more efficient secretion removal. We suggest that effective removal of secretions may be inferred by a combination of a decrease in VRI signal coupled with an increase in air flow rate. Reference 1.
Ntoumenopoulos G, Glickman Y: Computerized lung sound monitoring to assess effectiveness of physiotherapy and secretion removal: a feasibility study [abstract]. Crit Care 2010, 14(Suppl 1):P169.
P174 Continuous elevation of lung sound amplitudes, recorded at fixed flow rate, may indicate an increase in lung water content S Lev1, P Singer1, K Robinson2, K Hojnowski2, L Wolloch3, L Gatto4, GF Nieman2 1 Rabin Medical Center, Beilinson Campus, Petach Tikva, Israel; 2SUNY Upstate Medical University, Syracuse, NY, USA; 3Deep Breeze Ltd, Or-Akiva, Israel; 4SUNY Cortland, Cortland, NY, USA Critical Care 2011, 15(Suppl 1):P174 (doi: 10.1186/cc9594) Introduction Vibration response imaging (VRI) is a bedside lung sound monitoring system. We previously reported that vibration intensity can be significantly elevated in patients with congestion, as opposed to pleural effusion, atelectasis, or normal lung [1]. We hypothesized that changes in lung water content (that is, pulmonary edema) may influence breath sound amplitude and explored the possibility of using continuous digitalized lung sound monitoring as a means to track changes in extravascular lung water (EVLW). Methods EVLW was increased in three pigs: in two animals by installation of saline into the endotracheal tube, and in one animal with sepsis-induced edema. In both models the increase in extravascular lung water index (EVLWi) was evaluated by the PiCCO system, and lung sound amplitude was monitored with the VRI. Animals were ventilated at a fixed flow rate. Results In both the saline installation and sepsis animal models, significant elevation in lung sound amplitude was measured. In the saline installation animals, sound amplitude increased from 2.21 x 10⁵ ± 1.58 x 10⁴ au to 9.49 x 10⁵ ± 8.02 x 10⁴ au (average ± SEM), concomitant with an increase in EVLWi from 10 ml/kg to 14 ml/kg. Similarly, sound amplitudes changed in correspondence with elevation of EVLWi in the septic animal (see Figure 1).
S62
P175 Impact of normocapnic and permissive hypercapnic one-lung ventilation on arterial oxygenation T Végh, Z Szabó-Maák, S Szatmári, J Hallay, I László, I Takács, B Fülesdi University of Debrecen, Hungary Critical Care 2011, 15(Suppl 1):P175 (doi: 10.1186/cc9595) Introduction Physiologically, an approximately 5 to 10 mmHg difference exists between end-tidal carbon dioxide (EtCO2) and arterial carbon dioxide (PaCO2) measured during double-lung ventilation (DLV) that may increase during one-lung ventilation (OLV) especially if low tidal volume is applied. There is no evidence that during OLV the EtCO2 or PaCO2 should be kept in the normal range. The aim of the present work was to test whether different ventilatory strategies to maintain EtCO2 or PaCO2 in the normal range during OLV have any impact on arterial oxygenation (PaO2). Methods Data were obtained from 100 patients undergoing thoracic surgery necessitating OLV. Patients were randomized into two groups. In GrEtCO2 (n = 50) the OLV was guided by capnography, and the respiratory rate (RR) was adjusted to maintain EtCO2 in the normal range. In GrPaCO2 (n = 50) the OLV was guided by arterial blood gas analysis (ABG) and RR was adjusted to maintain PaCO2 in the normal range. ABG was performed in a supine position after induction and in a lateral decubitus position during DLV and every 15 minutes during OLV. During OLV 5 ml/kg tidal volume with 5 cmH2O PEEP, I:E = 1:2 ratio and FiO2 1.0 was used. Results There were no significant differences in PaO2 values between groups during DLV and at the 15th minute of OLV. There were significant differences in PaO2 at the 30th and 45th minutes between groups. In GrPaCO2 mean airway pressure and RR was higher, and the inspiratory and expiratory time was shorter than in GrEtCO2. Conclusions The relatively high RR impairs the emptying of alveoli and results in increased functional residual capacity. So the normocapnic lung-protective OLV results in significantly higher PaO2 than permissive hypercapnic OLV. References 1. 2. 3.
Russel GB, et al.: Anesth Analg 1995, 81:806-810. Ip Yam PC, et al.: Br J Anaesth 1994, 72:21-24. Morisaki H, et al.: Acta Anaesth Scand 1999, 43:845-849.
P176 Titration of analgosedation with neurally adjusted ventilatory assist in the ICU MJ Sucre, A De Nicola San Leonardo Hospital, Castellammare di Stabia, Italy Critical Care 2011, 15(Suppl 1):P176 (doi: 10.1186/cc9596)
Figure 1 (abstract P174). Sound intensity and EVLWi versus time, in a septic pig model (average ± SEM).
Conclusions These preliminary results suggest that continuous elevation of lung sound amplitudes, recorded at fixed flow rate, may indicate an increase in lung water content. Reference 1.
Lev S, et al.: Respiration 2010, 80:509-516.
Introduction The patient–ventilator asynchrony (PVA) is a cause of oversedation that prolongs mechanical ventilation unnecessarily. The current tools for measurement of sedation are inadequate for assessing the PVA. Neurally adjusted ventilatory assist (NAVA) is an innovative ventilatory mode that provides an excellent real-time monitor of the neural signal of diaphragmatic electrical activity (EAdi) and consequently highlights the PVA. Whether EAdi can be of help to titrate the level of sedation has not yet been proved, so we want to verify this conjecture. To titrate the level of analgosedation, we used this signal, which informs us continuously on changes in lung mechanics and synchrony. Methods A prospective observational study on 50 coma patients, ventilated with Maquet SERVO-I, was performed, following monitoring chart EAdi and recording the numerical values of Edi peak and Edi min during the different ventilatory modes. We recorded the analgosedation via continuous infusion; the dose was titrated to achieve a score of the Richmond Agitation-Sedation Scale from –2 to +1 and the Behavioral Pain Scale ≤4. Results The average duration of mechanical ventilation was 5.9 days (P = 0.004), the average of analgosedation was 4.8 days while the average length of stay was 6.4 days (P = 0.02). The average dose of remifentanil was varied between 0.075 ± 0.025 μg/kg/minute, propofol 0.5 ± 0.2 mg/kg/hour and clonidine 0.025 ± 0.02 μg/kg/minute. Comparing the pressure, volume and EAdi traces we identified all
Critical Care 2011, Volume 15 Suppl 1 http://ccforum.com/supplements/15/S1
degrees of PVA. The Edi peak (16.8 ± 7.6 mV) and Edi min (0.1 ± 1.3 mV) values were used to adjust the level of sedation. The analgosedation quality was 97%. Conclusions NAVA has been a real monitoring tool that provided a continuous dynamic lung overview. Monitoring NAVA avoided the more serious complications of the PVA: prolonged mechanical ventilation, barotrauma, and inadequate or excessive sedation. It was the only mode able to determine the asynchrony, allowing us to administer a tailored analgosedation, until the suspension. Moreover this protocol permitted us to save valuable resources. The measurement of PVA is a priority for the optimal sedation and NAVA can become an indicator for rating of analgosedation scales. References 1. 2. 3.
Rowley DD, et al.: Respiratory Therapy 2009, 4:51-53. Kress JP: N Engl J Med 2000, 342:1471-1477. Sucre MJ, De Nicola A: Crit Care 2010, 14(Suppl 1):P205.
P177 Early prognostic indices for weaning after long-term mechanical ventilation A Temelkov, R Marinova, M Lazarov Alexandrovska University Hospital, Sofia, Bulgaria Critical Care 2011, 15(Suppl 1):P177 (doi: 10.1186/cc9597) Introduction A large number of predictive indices are used for evaluation of the capability for transition to spontaneous breathing in critically ill, mechanically ventilated patients. The great number of these indices and the difficulties in the interpretation causes significant obstacles and unclear points during the early attempts for transition to spontaneous breathing. In our study we investigated the role of predictive indices that are significant for weaning after long-term mechanical ventilation. The purpose is to determine predictive indices, which have early and significant predictive value concerning successful transition to spontaneous breathing. Methods The study covers 45 critically ill patients who were mechanically ventilated for more than 7 days in our ICU. The weaning efforts were made through a T-circuit for spontaneous breathing according to the local protocol. The patients were allocated into two groups – group A (38 patients with successful 2-hour spontaneous breathing through a T-circuit) and group B (seven patients with unsuccessful 2-hour test of weaning with a T-circuit system). The monitored parameters in this period were: respiratory rate/tidal volume ratio (f/Vt), occlusive pressure (Po.1), inspiratory time/tidal time ratio (Ti/Ttot), pressure time index, pressure time product and work of breathing (WOBp) together with SAPS II score and clinical and paraclinical parameters, concerning successful weaning. Results Clinical research of f/Vt and WOBp between the two groups gives a reliable index in transition to spontaneous breathing. Changes in Po.1, Ti/Ttot, pressure time index and pressure time product are later and thus less important in the early assessment of withdrawal after long-term mechanical ventilation. Conclusions Respiratory rate/tidal volume ratio (f/Vt) and work of breathing (WOBp) are the earliest predictive indices for the possible outcome in the process of weaning after long-term mechanical ventilation. References 1. 2.
Burns S, et al.: Am J Crit Care 1995, 4:4-22. Ely E, et al.: Intensive Care Med 1999, 25:581-587.
P178 Alveolar morphology depends on ventilator settings: lessons from in vivo alveolar microscopy under static and dynamic conditions D Schwenninger, S Schumann, J Guttmann University Medical Center Freiburg, Germany Critical Care 2011, 15(Suppl 1):P178 (doi: 10.1186/cc9598) Introduction In the context of lung-protective mechanical ventilation, knowledge about the global respiratory mechanics (for example, lung resistance and compliance) can be essential to guide the ventilatory therapy. From recent work it is known that the lung shows a
S63
significantly different mechanical behaviour when examined under static conditions (continuous ventilation interrupted by zero-flow or low-flow respiratory manoeuvres) compared with dynamic conditions (no interruption). However, the significance of this difference at the anatomical level of the alveoli has not yet been fully examined. This study aims to determine changes in morphology of subpleural alveoli under static and dynamic conditions in an animal model. Methods A method for endoscopic intravital microscopy of lung tissue [1] was used to record videos of subpleural alveolar structures in a rat model. This specialized method allowed the continuously focused recording of the lung surface during any kind of respiratory manoeuvre, including continuous mechanical ventilation. Videos of alveolar structures were recorded during continuous mechanical ventilation (dynamic) at different levels of positive end-expiratory pressure (PEEP) and during low-flow manoeuvres (static) where the lung was slowly inflated up to an airway pressure of 40 mbar. Alveolar morphology was analysed using a dedicated semiautomatic image processing algorithm by tracking the change of area-size of the visible subpleural alveoli in the videos. The simultaneous change of area-size of different alveoli was averaged to get the mean alveolar area-size depending on the respective airway pressure. Comparison was done by calculating the difference of relative area-size increase in identical ranges of airway pressure under dynamic and static conditions. Results Data from five animals mechanically ventilated at PEEP levels of 6 and 15 mbar showed a significantly smaller increase in areasize under dynamic compared with static conditions: 12% smaller at 6 mbar; 40% smaller at 15 mbar. Conclusions Under dynamic conditions, the pressure-dependent change in alveolar morphology is significantly different compared with static conditions. We conclude that, to guide mechanical ventilation therapy, it is essential to determine respiratory mechanics under dynamic conditions. Reference 1.
Schwenninger D, et al.: J Biomech in press. doi: 10.1016/j.jbiomech.2010.09.019.
P179 Ventilatory ratio: validation in an ex vivo model and analysis in ARDS/ALI patients P Sinha1, K Corrie2, A Bersten3, JG Hardman2, N Soni1 1 Chelsea and Westminster NHS Foundation Trust, London, UK; 2Queen’s Medical Centre, Nottingham, UK; 3Flinders Medical Center, Adelaide, Australia; 3 ANZICS CTG, Flinders Medical Center, Adelaide, Australia Critical Care 2011, 15(Suppl 1):P179 (doi: 10.1186/cc9599) Introduction Several indices exist to monitor adequate oxygenation, but no such index exists for ventilatory efficiency. The ventilatory ratio (VR) is a simple tool to monitor changes in ventilatory efficiency using variables commonly measured at the bedside [1]: •
VEmeasured × PaCO measured VR = ________________ • VEpredicted × PaCO 2
2 predicted
See Figure 1 overleaf (where predicted values are VE 100 ml/kg/minute and PaCO2 5 kPa). Methods The Nottingham Physiology Simulator (NPS), a validated computational model of cardiopulmonary physiology [2], was used to validate the ability of VR to reflect ventilatory efficiency ex vivo. Three virtual patients were configured, representing healthy lung, ARDS and COPD. VR was calculated while minute ventilation, ventilation rate and VCO2 were each varied in isolation. The clinical uses of VR were then examined in a database comprising 122 patients with ALI and ARDS [3]. Standard respiratory data and VR values were analysed in all patients. Results The NPS model showed significant correlation between VR and physiological deadspace fraction (Vd/Vtphys) at constant VCO2 (P <0.001, r = 0.99). Similarly, VCO2 had a linear relationship with VR at constant Vd/Vtphys. Across the various ventilatory configurations the median values and ranges of calculated VR for the three patients were as follows: normal patient VR 0.89 (0.61 to 1.36), COPD 1.36 (0.95 to 1.89) and ARDS 1.73 (1.2 to 2.62). In the ALI /ARDS database the range
Critical Care 2011, Volume 15 Suppl 1 http://ccforum.com/supplements/15/S1
S64
12 hours. Statistical analysis: two-way ANOVA and Bonferroni post-hoc comparison. Data are expressed as mean ± SEM. Significance P <0.05. Results The PaO2/FiO2 ratio was significantly decreased in the control group versus baseline (BL: 530 ± 16 vs. 96 hours: 267 ± 51). The ratio showed significantly higher values in the treatment versus control sheep (96 hours: 377 ± 32). All treated sheep survived and were weaned from the ventilator. Four out of five treatment sheep could be decannulated from the tracheostomy tube at 72 hours. Only three out of five control sheep survived 96 hours and none of the control sheep could be weaned from the ventilator. Conclusions This triple therapy with nebulization of heparin and tPA and intravenous application of rhAT may be a novel and efficient therapeutic alternative to improve the outcome of burn patients with smoke inhalation injury.
Figure 1 (abstract P179). Chi-squared test for trends P = 0.0015.
of values for VR was 0.56 to 3.93 (median 1.36). Patients with ARDS had a significantly higher VR in comparison with patients with ALI (1.44, 1.25 to 1.77 vs. 1.25, 0.94 to 1.6, P = 0.02). VR was significantly higher in nonsurvivors as compared with survivors (1.7 ± 0.64 vs. 1.45 ± 0.56, P <0.03). There was poor correlation between PaO2/FiO2 ratio and VR in the population (r = –0.32, 95% CI = –0.47 to –0.15). Conclusions Ex vivo modling shows that VR can be simply and reliably used to monitor ventilatory efficiency at the bedside. VR is influenced by changing CO2 production and deadspace ventilation. As a clinical tool it is a predictor of outcome and is independent to PaO2/FiO2 ratio. References 1. 2. 3.
Sinha et al.: Br J Anaesth 2009, 102:692-697. Hardman et al.: Br J Anaesth 1998, 81:327-329. Bersten et al.: Am J Respir Crit Care Med 2002, 165:443-448.
P180 Therapy with recombinant human antithrombin, heparin and tissue plasminogen activator improves survival and reduces ventilation days in a long-term ovine model of cutaneous burn and smoke inhalation injury S Asmussen1, Y Yamamoto1, DL Traber1, H Ito1, R Cox1, H Hawkins1, LD Traber1, D Herndon2, P Enkhbaatar1 1 University of Texas Medical Branch, Galveston, TX, USA; 2Shriners Hospital for Children, Galveston, TX, USA Critical Care 2011, 15(Suppl 1):P180 (doi: 10.1186/cc9600) Introduction In this study we investigated the long-term effects of a combined therapy with recombinant human antithrombin (rhAT), heparin (hep) and tissue plasminogen activator (tPA) in our established model of acute lung injury, resulting from burn and smoke inhalation injury (BSII). We hypothesised that this triple therapy decreases the requirement of ventilation, reduces ventilation days and improves survival. Methods Ten female sheep (34.4 ± 2.1 kg) were operatively prepared for chronic study, and were randomly allocated either to control or treatment groups (n = 5 each). After tracheostomy, BSII (48 breaths of cotton smoke) and third-degree burn of 40% total body surface area was performed under deep anesthesia. The sheep were mechanically ventilated and fluid resuscitated for 96 hours in an awake state. The therapy group received combined therapy of rhAT, nebulized heparin and nebulized tPA. The continuous i.v. infusion of 0.7 mg/kg/hour rhAT was started 1 hour post-injury. The nebulizations of 5,000 IE heparin every 4 hours were started 2 hours post-injury and 2 mg tPA were nebulized every 4 hours, starting 4 hours post-injury. The treatment was stopped at 48 hours. Ventilator weaning was started at 48 hours, if PaO2/FiO2 ratio ≥250. The control group received saline nebulization. Measurements were taken in intervals ranging from 3 to
P181 Hypercapnic acidosis transiently weakens hypoxic pulmonary vasoconstriction in anesthetized pigs, without affecting the endogenous pulmonary nitric oxide production MC Nilsson1, A Larsson1, K Hambraeus-Jonzon2 1 Surgical Sciences, Uppsala, Sweden; 2Karolinska University Hospital, Stockholm, Sweden Critical Care 2011, 15(Suppl 1):P181 (doi: 10.1186/cc9601) Introduction Hypercapnic acidosis is often seen in critically ill patients and during protective mechanical ventilation. Conflicting findings regarding the effect of hypercapnic acidosis on endogenous nitric oxide (NO) production and hypoxic pulmonary vasoconstriction (HPV) have been reported. The aim of this study was to test the effects of hypercapnic acidosis on HPV, and the endogenous NO production in hypoxic and hyperoxic lung regions. Methods Sixteen healthy anesthetized pigs were separately ventilated with hypoxic gas to the left lower lobe (LLL) and hyperoxic gas to the rest of the lung. The pigs were then randomized into two groups. Eight pigs received 10% CO2 inhalation (Hypercapnia group) to both lung regions, and eight pigs served as the Control group. The NO concentration in exhaled air (ENO), nitric oxide synthase (NOS) activity in lung tissue, and regional pulmonary blood flow were measured. Results There were no significant differences between the Hypercapnia and Control groups for ENO, Ca2+-independent, or Ca2+-dependent NOS activity in hypoxic or hyperoxic lung regions. The relative perfusion to the hypoxic LLL (QLLL/QT) increased during the first 90 minutes of hypercapnia from 6 (1)% (mean (SD)) to 9 (2)% (P <0.01), and then decreased to the same level as in the Control group where QLLL/QT remained unchanged over time (P >0.05). In addition, hypercapnia increased cardiac output (QT) (P <0.01), resulting in increased oxygen delivery (P <0.01), despite a significant decrease in PaO2 (P <0.01). Conclusions Hypercapnic acidosis does not affect the endogenous pulmonary NO production, nor does it potentiate HPV. References 1.
2.
Ketabchi F, et al.: Effects of hypercapnia with and without acidosis on hypoxic pulmonary vasoconstriction. Am J Physiol Lung Cell Mol Physiol 2009, 297:L977-L983. Pfeiffer B, et al.: Mechanical ventilation with permissive hypercapnia increases intrapulmonary shunt in septic and nonseptic patients with acute respiratory distress syndrome. Crit Care Med 2002, 30:285-289.
P182 Stenotrophomonas maltophilia in the respiratory tract of medical ICU patients B Saugel, K Eschermann, R Schmid, W Huber Klinikum Rechts der Isar, München, Germany Critical Care 2011, 15(Suppl 1):P182 (doi: 10.1186/cc9602) Introduction Stenotrophomonas maltophilia can cause pneumonia in critically ill patients. The aim of the study was to investigate characteristics of critically ill patients with S. maltophilia isolated from the respiratory tract and to identify risk factors for S. maltophilia pneumonia and ICU mortality and to analyze antibiotic susceptibility of S. maltophilia.
Critical Care 2011, Volume 15 Suppl 1 http://ccforum.com/supplements/15/S1
S65
Methods A retrospective analysis of medical records (November 2005 to December 2009) for three medical ICUs in a university hospital. Results Sixty-four patients with S. maltophilia isolated from the respiratory tract (median age 66.0 years). Thirty-six patients fulfilled the criteria for diagnosis of pneumonia. Mechanical ventilation was needed in 51 patients. A significantly higher lung injury score was observed in patients with pneumonia compared with patients with colonization (P = 0.010). Independent risk factors for S. maltophiliarelated pneumonia were higher Sequential Organ Failure Assessment (SOFA) score (P = 0.009) and immunosuppression (P = 0.014). Patients with S. maltophilia pneumonia had higher ICU mortality within a followup of 28 days (P = 0.040) and higher hospital mortality (P = 0.018) than patients with colonization. The highest antibiotic susceptibility rates were observed to trimethoprim-sulfamethoxazole, tigecycline, and moxifloxacin. A higher SOFA score when S. maltophilia was isolated (P = 0.001) and development of renal failure (P = 0.021) were independent risk factors for ICU mortality. Conclusions Higher SOFA score and immunosuppression are independent risk factors for S. maltophilia pneumonia. Patients with pneumonia caused by S. maltophilia have a significantly higher ICU mortality within a follow-up of 28 days, hospital mortality and lung injury score compared with patients with S. maltophilia colonization.
Methods All patients admitted to the 18-bed ICU of our university hospital between 1 January 2009 and 30 June 2010, affected by PAPN, were retrospectively enrolled in a cohort study. Results Over the study period 1,109 patients were admitted and 322 bacterial PN were diagnosed. Sixty-five PAPN occurred: 52 ICU-acquired (ICUa) and 13 non-ICU-acquired (nICUa). Patients were mainly admitted because of a medical condition (71%), with a median length of ICU stay of 29.2 ± 27.6 days. The median SAPS II and SOFA scores were 40 ± 13.5 and 6.2 ± 3. A total of 35.4% of PA isolated were multidrug-resistant (MDR), 49.2% of patients with PAPN received a >24 hour delayed adequate antimicrobial treatment (DAAT >24 hours) and 57% received an anti-pseudomonas combination therapy; 25 patients (38.5%) died in the ICU. Comparing patients with ICUaPN with those with nICUaPN, the former group were younger (P <0.01), with a longer length of ICU stay (P <0.01), more frequently admitted for a traumatic reason (P = 0.02) and presented less severe SAPS II (P <0.05). The independent risk factors associated with ICU mortality are listed in Table 1.
P183 Hospital-acquired pneumonia is associated with deficient γc-cytokine gene expression M White1, R McManus2, T Ryan1 1 St James Hospital, Dublin, Ireland; 2Trinity College, Dublin, Ireland Critical Care 2011, 15(Suppl 1):P183 (doi: 10.1186/cc9603)
SAPS II score
Introduction Lymphocyte homeostasis is dependent on the γc cytokines. We hypothesised that infection in humans is associated with differential gene expression of the γc cytokines and their associated apoptosis mediators. Methods Sixty patients undergoing elective lung resection surgery were recruited. Nineteen patients developed postoperative pneumonia. Pneumonia was diagnosed by CDC NNIC criteria. Gene expression in peripheral blood leukocytes (PBLs) of IL-2, IL-7, IL-15 and IFNγ, Bax, Bim, Bcl-2 was determined by qRT-PCR preoperatively and again on day 1 and day 5 postoperatively. IL-2 and IL-7 serum protein levels were determined by ELISA preoperatively and again on day 1 and day 5 postoperatively. Results In lung resection surgery patients, postoperative pneumonia was associated with a perioperative decrease in IL-2 mRNA (P <0.0001) and IL-7 mRNA (P = 0.003). IL-15 gene expression was similar between both groups at all three points. Bcl-2 and Bax gene expressions were similar between both pneumonia and nonpneumonia groups at all three time points. Bim gene expression was greater in the pneumonia group compared with the nonpneumonia group on day 5 postoperatively (P = 0.04). IL-2 protein levels were similar in pneumonia and nonpneumonia groups. IL-7 protein levels were similar in all groups. Conclusions Patients with postoperative pneumonia display deficient IL-2 and IL-7 gene expression in PBLs. Aberrant cytokine gene expression may precede the onset of infection. P184 Clinical aspects and predictors of mortality of Pseudomonas aeruginosa pneumonia in a cohort of critically ill patients G De Pascale1, F Antonicelli1, R Maviglia1, A Cataldo1, R Festa1, F Idone1, EM Trecarichi2, MA Pennisi1, M Tumbarello2, M Antonelli1 1 Department of Anesthesiology and Intensive Care, Sacro Cuore Catholic University, Rome, Italy; 2Institute of Infectious Diseases, Sacro Cuore Catholic University, Rome, Italy Critical Care 2011, 15(Suppl 1):P184 (doi: 10.1186/cc9604) Introduction Pseudomonas aeruginosa (PA) pneumonia (PN) represents a serious complication of long-term hospitalization [1]. The aim of our study is to analyze the clinical characteristics and predictors of mortality of PAPN in critically ill patients.
Table 1 (abstract P184). Chronic renal failure (CRF) P value
OR
0.01
12.2 (1.6 to 91)
MDR PA
0.01
5.9 (1.4 to 25.6)
DAAT >24 hours
0.01
5.8 (1.4 to 23.6)
0.01
1.1 (1.01 to 1.13
CRF
Conclusions PA has appeared as a relevant respiratory pathogen in our cohort of critically ill patients, either in ICU or pre/ICU settings. Patients’ (baseline clinical condition), PA (MDR) and physicians’ (DAAT >24 hours) related factors can influence the outcome of PN. The knowledge of local bacterial epidemiology and the prompt use of an anti-pseudomonas empiric treatment in patients with recognized PA risk factors could improve the outcome of severe MDR PAPN. Reference 1.
Jones RN: Clin Infect Dis 2010, 51:S81-S87.
P185 Safety and efficacy of intratracheal DNase with physiotherapy in severe status asthmaticus A Nyman, K Puppala, S Colthurst, S Parsons, S Tibby, I Murdoch, A Durward Evelina Childrens Hospital, Guy’s and St Thomas’ NHS Trust, London, UK Critical Care 2011, 15(Suppl 1):P185 (doi: 10.1186/cc9605) Introduction Diffuse airway plugging with thick viscous secretions is recognised in acute severe asthma, and contributes to airflow limitation in ventilated asthmaticus. Since 2004, we have used intratracheal DNase with physiotherapy as second-line therapy in mechanically ventilated children with severe status asthmatics who are refractory to conventional medical management. Our aim is to report the safety profile and efficacy of intratracheal DNase mucolytic therapy in this cohort. Methods A retrospective cohort analysis in a 20-bed PICU. Forty-six ventilated children, median (IQR) age 74 months (45 to 141), received intratracheal DNase with physiotherapy (January 2004 to August 2010). Indication for DNase was peak inspiratory pressure (PIP) >28 cmH2O with hypercarbic acidosis (pCO2 >10 kPa). Eleven patients required additional doses of DNase. In 40 episodes DNase was given blindly (n = 40) or bronchoscopically (n = 17). Results The median (IQR) time to DNase following PICU admission was 2.1 hours (1.3 to 3.8). At the time of DNase, median PIP was 34 cm (30 to 40), pH was 7.12 (7.01 to 7.22) and pCO2 was 11 kPa (7.9 to 14.1). Overall DNase produced an improvement in ventilation (see Figure 1). Salbutamol IV was constant at 1 μg/kg/minute (0.5 to 2). The therapy was well tolerated with no hypoxic or hypotensive episodes, or air leaks. Median length of ventilation was 22 hours (15 to 37). No patient required extracorporeal membrane oxygenation and there were no deaths.
Critical Care 2011, Volume 15 Suppl 1 http://ccforum.com/supplements/15/S1
S66
P187 Induced hypothermia is protective in a rat model of pneumococcal pneumonia C Beurskens, H Aslami, M Kuipers, M Schultz, N Juffermans Academic Medical Centre, Amsterdam, the Netherlands Critical Care 2011, 15(Suppl 1):P187 (doi: 10.1186/cc9607)
Figure 1 (abstract P185). Fractional polynomial regression of PIP/PCO2 following DNAse.
Conclusions Intratracheal DNase with physiotherapy is safe and effective therapy for refractory ventilated patients with status asthmatics. A randomised control trial is warranted. References 1. 2.
Kuyper LM, et al.: Am J Med 2003, 115:6-11. Durward A, et al.: Crit Care Med 2000, 28:560-562.
P186 Relation between mortality rate, duration of hospitalization and levels of TNFα, IL-6 and catalase at admission of cases to the emergency department with COPD attack A Bayır1, P Büyükünaldı2, A Kıyıcı1, A Ak1, F Kara1 1 Selçuk University, Selçuklu Faculty of Medicine, Konya, Turkey; 2Selçuk University, Meram Faculty of Medicine, Konya, Turkey Critical Care 2011, 15(Suppl 1):P186 (doi: 10.1186/cc9606) Introduction The aim of the study was to investigate the relation between the mortality rate, the hospitalization period in the emergency department or ICU and the obtained levels of TNFα, IL-6 and catalase before they underwent attack treatment at admission of the cases applying to the emergency department with COPD attack. Methods The cases diagnosed with COPD before and who applied to the emergency department with COPD attack were included in the study. Venous blood samples were obtained to evaluate the levels of TNFα, IL-6, catalase, leucocyte, sedimentation and CRP when the cases applied to the emergency department. Their hospitalization in the service or ICU, the follow-up period in mechanical ventilation and leaving hospital (dead or discharged) were followed. The mean levels of TNFα, IL-6, catalase, leucocyte, sedimentation and CRP values were compared with the average period of hospitalization in the service or ICU and with each other. The Mann–Whitney U test and chi-square test were used as nonparametric tests. P ≤0.05 values were regarded as significant. Results All of the cases that died (n = 7) were followed in intensive care, they underwent invasive mechanical ventilation treatment and their mean hospitalization period was 25 days. The cases discharged (n = 80) were all followed in the service and their average hospitalization duration was 6.2 days. Non-invasive mechanical ventilation was applied to 12 of these cases. Of the dead cases, the mean leukocyte value was 12.665, sedimentation 29.68, CRP 49.7, TNFα 27.3, IL-6 32 and catalase was 81. Of the cases discharged, the mean leukocyte value was 8.200, sedimentation 19.0, CRP 49.7, TNFα 29.3, IL 13.6 and catalase was 85.9. The mean value of leukocyte, sedimentation, CRP and IL-6 of the dead cases were significantly higher than those of the cases in the discharged group (P = 0.040, 0.038, 0.02, 0.017, respectively). Conclusions A high level of leukocyte, sedimentation, CRP values and low IL-6 values at the admission of cases with COPD attack to the emergency department may indicate the requirement to follow in the ICU and treatment with mechanical ventilation, and a high mortality rate.
Introduction Induced hypothermia is protective in ischemia–reperfusion injury by reducing the inflammatory response and is increasingly applied in the ICU. Hypothermia may dampen host response during an infection and it is believed that induced hypothermia may carry the risk of acquiring or aggravating an infection. We investigated the effect of hypothermia on bacterial outgrowth and on the inflammatory response in a rat model of pneumococcal pneumonia. Methods Sprague–Dawley rats (350 to 400 g) were inoculated intratracheally with ~5.5 x 10⁶ cfu of Streptococcus pneumonia, controls received saline. After 40 hours, the animals developed pneumonia and mechanical ventilation was started via a tracheotomy. Hypothermia (32°C) was induced using icepacks on the abdomen. In controls, normothermia was maintained by a thermomatrass. After 4 hours, rats were sacrificed, bronchoalveolar lavage fluid (BALF) was obtained and blood and organs were collected. Data are shown in percentages or median (range). Results Induced hypothermia reduced pulmonary inflammation during pneumonia, exemplified by a reduction in pulmonary cell influx (1.3 (0.8 to 1.6) x 106 vs. 3.1 (1.6 to 4.6) x 106 mg/ml, hypothermia vs. normothermia; P <0.05) and BALF protein levels (0.9 (0.6 to 1.3) vs. 1.5 (1.4 to 1.6) mg/ml; P <0.05). Hypothermia also reduced BALF level of IL-1 (0.4 (0.1 to 0.6) vs. 0.8 (0.6 to 0.9) ng/ml; P <0.05), but had no effect on BALF levels of CINC3 and IL-6. Hypothermia, however, did not affect bacterial outgrowth in the BALF (1.4 (0.3 to 20) vs. 0.5 (0.2 to 5.2) x 106 cfs/ml; P = NS) nor in homogenized lungs (13.5 (0.2 to 69.2) vs. 0.8 (0.1 to 14.5) x 106 cfu/g; P = NS). Hypothermia tended to reduce bacterial dissemination to the blood (38 vs. 50%, P = NS), spleen (0 vs. 50% culture positivity, P = 0.08) and liver (38 vs. 63% culture positivity, P = NS). Conclusions Although hypothermia reduces pulmonary cell influx and protein leakage, it does not affect local bacterial outgrowth during pneumonia and even tends to reduce bacterial dissemination in this animal model of pneumococcal pneumonia. In contrast to current belief, induced hypothermia seems protective in a model of pneumococcal pneumonia. P188 Incidence of and risk factors for nonrespiratory acute organ failure in ICU patients receiving respiratory support: a pilot international cohort study M Terblanche1, A Smith2, E Recchia3, M Harward4, L Gilfeather5, D McAuley6 1 King’s College London, UK; 2Royal London Hospital, London, UK; 3St Thomas’ Hospital, London, UK; 4Princess Alexandra Hospital, Brisbane, Australia; 5 Altnagelvin Hospital, Londonderry, UK; 6QUB, Belfast, UK Critical Care 2011, 15(Suppl 1):P188 (doi: 10.1186/cc9608) Introduction Strategies to prevent the progression to nonrespiratory multiorgan failure (nrAOF) in patients receiving invasive or non-invasive ventilation are needed. We performed a pilot international prospective cohort study to determine the incidence of and risk for nrAOF in ICU patients receiving respiratory support. Methods All consecutive ICU admissions to 11 ICUs (UK, Australia and Canada) were screened during the first 24 hours over a 4-week period. Patients receiving positive pressure ventilatory support for at least 1 hour during the first 24 hours were eligible. Those with nrAOF (SOFA 3 to 4), or elective postsurgical patients extubated and ready for discharge within 24 hours after admission, were excluded. Follow up lasted for the first of 14 days after enrolment or ICU discharge. Results In total, 123/766 (16.1%) patients were enrolled. Elective postsurgery ventilation (22.1%) and type I respiratory failure (29.5%) were the most frequent indications for respiratory support. n = 49 (39.8%, 95% CI = 31.1 to 48.6%) developed nrAOF after an average 3.7 (SD 1.5) days. The 28-day ICU mortality was 8.1%. In univariate analysis, APACHE II >14.5 (OR = 3.0, 95% CI = 1.2 to 7.1) and nonrespiratory SOFA score >1 (OR = 2.3, 95% CI = 1.1 to 4.7 excluding GCS) were associated (P <0.05) with AOF. See Table 1.
Critical Care 2011, Volume 15 Suppl 1 http://ccforum.com/supplements/15/S1
S67
Table 1 (abstract P188). Variable
No AOF
AOF
P value
Age
54.3 (19.6)
58.2 (19.6)
0.56
Female
24 (58.5%)
17 (41.5%)
0.007
APACHE II
12.1 (6.7)
17.5 (7.1)
<0.0001
SOFA
1.52 (1.52)
2.9 (2.5)
0.0002
AOF, acute nonrespiratory organ failure; SOFA, excluding respiratory and GCS.
Conclusions Nearly 4/10 developed AOF, but the treatment window is relatively small. APACHE II and baseline SOFA may predict risk. These data inform future trials of preventive strategies but a study with more outcome events is needed to reduce the confidence intervals. P189 Pharmacological randomized controlled trials in acute respiratory distress syndrome mortality C Santacruz1, E Carrasco2, J Wardini Dantas do Amaral3 1 Fundacion Abood Shaio, Bogota, Colombia; 2Hospital Valladolid, Spain; 3 Erasme Hopital, Brussels, Belgium Critical Care 2011, 15(Suppl 1):P189 (doi: 10.1186/cc9609) Introduction Acute lung injury and acute respiratory distress syndrome are common conditions encountered in the ICU. Whether mortality has decreased over time or not, they are still many unanswered questions about the impact of pharmacological treatment on ALI/ARDS mortality. Methods The objectives were to perform a review of the literature in search of the randomized control trials that asses the pharmacological impact in ALI/ARDS on all-cause mortality. We included all RCTs of pharmacological treatments in ALI/ARDS that had an impact in mortality in adults. We excluded RCTs that included patients <18 years old and animals. We also excluded trials that tested fluid therapy, mechanical ventilation, nonpharmacological treatments, antibiotics and reviews. No date or language restriction was applied. Results We included 37 RCTs involving 6,303 patients in different ALI/ ARDS treatment modalities: steroids (n = 271), enteral nutrition (n = 411), surfactant (n = 1,754), nitric oxide (n = 1,342), APC (n = 75), muscle relaxants (n = 340), prostaglandins (n = 550), NAC (n = 127), silvelastat (n = 492), rPAF-HD (n = 127) lisofylline (n = 235), rFVIIa antagonist (n = 214), OTZ (n = 215) and verapamile-procaine compound (n = 150). Conclusions Only steroid treatment (methylprednisolone) and nutritional therapy (EPA + GLA + antioxidants) showed a trend towards reduced mortality. Other treatments were associated with reduced morbidity. However, many empirical treatments are still used in day-to-day practice. References 1. 2. 3. 4.
Brun-Buisson C, Lemaire F, et al.: Intensive Care Med 2004, 30:51-61. Phua J, Ferguson ND, et al.: Am J Respir Crit Care Med 2010, in press. Tang et al.: Crit Care Med 2009, 37:1594-1603. Adhikari NKJ, Burns KEA, Meade MO, Ratnapalan M: Cochrane Database Syst Rev 10:CD004477.
P190 Positive end-expiratory pressure improves oxygenation inducing ventral-to-dorsal tidal ventilation redistribution: an electrical impedance tomography study T Mauri1, G Bellani1, A Pradella1, A Grassi1, P Tagliabue2, M Bombino2, N Patroniti1, G Foti2, A Pesenti1 1 Universita degli Studi di Milano-Bicocca, Monza, Italy; 2San Gerardo Hospital, Monza, Italy Critical Care 2011, 15(Suppl 1):P190 (doi: 10.1186/cc9610) Introduction Positive end-expiratory pressure (PEEP) improves oxygenation in acute lung injury (ALI) patients by increasing endexpiratory lung volume (EELV). Electrical impedance tomography (EIT) is a relatively new non-invasive bedside method to monitor regional distribution of tidal ventilation and EELV changes, validated in preclinical studies. We tested EIT as a monitor of PEEP-induced tidal
redistribution and EELV changes in ALI patients, and the relationship between EIT parameters and oxygenation. Methods We enrolled 14 consecutive ALI patients admitted to our ICU, intubated and undergoing mechanical ventilation. We monitored the regional tidal ventilation distribution by means of a new EIT system (PulmoVista 500®; Dräger Medical GmbH, Lübeck, Germany) dividing the lung imaging field into four contiguous same-size regions of interest (ROIs): ventral right (ROI 1) and left (ROI 2) and dorsal right (ROI 3) and left (ROI 4). EIT allowed us to measure changes in EELV at different PEEP levels by measuring differences in end-expiratory total lung electrical impedance. We randomly performed the following two steps for 15 minutes, leaving tidal volume and FiO2 unchanged: PEEPlow (clinical) and PEEPhigh (PEEPlow +5 cmH2O). At the end of each step, we recorded: ventilation parameters, arterial blood gas analysis, percentage of tidal ventilation distribution in the four ROIs and EELV change. Analyses were performed by paired t test and linear regression. Results Patients were 55 ± 12 years old and seven were women. ALI etiology was: trauma (14%), septic shock (21%), pneumonia (37%) and postoperative respiratory failure (28%). PEEPlow was 7 ± 2 cmH2O and PEEPhigh 12 ± 3 cmH2O. At PEEPhigh, PaO2/FiO2 significantly ameliorated (266 ± 98 vs. 287 ± 102 mmHg, P = 0.0003), the proportional distribution of tidal ventilation changed in all four ROIs (ROI 1 to ROI 4: 34 ± 14 vs. 29 ± 9%, P = 0.03; 33 ± 13 vs. 30 ± 11%, P = 0.12; 16 ± 9 vs. 20 ± 10%, P = 0.002; 17 ± 7 vs. 21 ± 6%, P = 0.002), moving from ventral to dorsal, and EELV increased by 349 ± 121 ml. Changes in PaO2/FiO2 correlated better with ventral-to-dorsal shifts of tidal ventilation than with EELV changes (r = 0.499, P = 0.08; r = –0.399, P = 0.18). Conclusions EIT allowed us to detect ventral-to-dorsal tidal ventilation redistribution at higher PEEP levels. This mechanism may be a key determinant of PEEP-induced oxygenation improvement. P191 Neurally adjusted ventilatory assist reduces asynchrony and patient effort in severe acute respiratory distress syndrome patients undergoing extracorporeal membrane oxygenation T Mauri1, G Bellani1, A Confalonieri1, F Magni1, G Grasselli2, N Patroniti1, A Pesenti1 1 Universita degli Studi di Milano-Bicocca, Monza, Italy; 2San Gerardo Hospital, Monza, Italy Critical Care 2011, 15(Suppl 1):P191 (doi: 10.1186/cc9611) Introduction Assisted ventilation may prevent muscle atrophy and reduce sedation needs in severe acute respiratory distress syndrome (ARDS) patients undergoing extracorporeal membrane oxygenation (ECMO). However, pressure support (PS) is difficult to implement in these patients: inspiratory flow peaks and drops rapidly and the ventilator expiratory phase may overlap patient inspiration causing asynchrony and barotrauma. Neurally adjusted ventilatory assist (NAVA) is an assisted ventilation mode driven by diaphragmatic electrical activity (EAdi) and should adapt better to patients’ respiratory pattern. We measured whether NAVA could reduce asynchrony in severe ARDS patients undergoing ECMO. Methods We enrolled seven consecutive adult patients undergoing ECMO for severe ARDS. Twenty-four hours after their ventilation mode was switched from controlled to assisted, we randomly tested the following strategies for 30 minutes each, leaving positive endexpiratory pressure (PEEP), FiO2 and ECMO settings unchanged: (1) PS with expiratory trigger at 30% of flow peak value (PS30); (2) PS with expiratory trigger at 1% (PS1); (3) NAVA. The PS level and NAVA gain were chosen to obtain a similar tidal volume (V T ). From continuous recordings of airway pressure, flow, volumes and EAdi we calculated the average V T, respiratory rate (RR) and asynchrony index (AI: number of asynchrony events / (ventilator cycles + wasted efforts) x 100) of each step and, at the end, we measured arterial blood gases and p0.1. Data are the median (IQR) and were compared by nonparametric Friedman test and linear regression. Results At enrolment, patients were 44 (42 to 56) years old. Respiratory system compliance (Crs) was 12 (9 to 23) ml/cmH2O, PEEP 10 (7 to 12) cmH2O, FiO2 0.5 (0.4 to 0.5) and V T 2.9 (2.8 to 4) ml/kg. Patients were on 3.2 (2.9 to 3.6) l/minute venovenous ECMO since 22 (16 to 29) days. Switching from PS30 to PS1 to NAVA, PaO2/FiO2 did not change
Critical Care 2011, Volume 15 Suppl 1 http://ccforum.com/supplements/15/S1
(P = 0.817), p0.1 was reduced (3.1 (2.6 to 5.7) vs. 2.1 (1.8 to 3.2) vs. 1.6 (0.9 to 2.3) cmH2O, P = 0.003) together with RR (P = 0.129) and AI (55 (29 to 66) vs. 46 (26 to 56) vs. 16 (8 to 18)%, P = 0.004). The difference between AI during PS30 and NAVA was significantly correlated with Crs (R2 = 0.87, P = 0.02). Conclusions Implementation of NAVA in severe ARDS patients undergoing ECMO may decrease patient effort and asynchrony events. The advantage of NAVA over PS is more evident in patients with lower Crs. P192 Danger signal uric acid is involved in ventilator-induced lung injury pathogenesis M Kuipers, H Aslami, T Van der Poll, M Schultz, C Wieland Academic Medical Centre, Amsterdam, the Netherlands Critical Care 2011, 15(Suppl 1):P192 (doi: 10.1186/cc9612) Introduction Endogenous molecules released during tissue injury can trigger an innate immune response and are termed damage-associated molecular patterns (DAMPs). Uric acid is considered an important DAMP and causes acute lung inflammation when administered locally. The exact role of the innate immune response in ventilator-induced lung injury (VILI) is not yet completely understood. We hypothesized that uric acid is released during VILI and that reduction of uric acid levels attenuates lung injury induced by short-term mechanical ventilation (MV). Methods Uric acid levels in bronchoalveolar lavage fluid (BALF) of wildtype C57BL/6 mice ventilated for 5 hours with low tidal volume (LVT ~7.5 ml/kg) or high tidal volume (HVT ~15 ml/kg) and spontaneously breathing mice were determined. In addition, mice were treated with allopurinol (25 mg/kg; inhibits uric acid synthesis) or uricase (0.2 mg/ kg; degrades uric acid) or vehicle (10% DMSO), 1 hour before start of HVT MV. Endpoints of VILI were lung wet/dry ratio, total protein, IgM and sRAGE concentrations in BALF as well as neutrophil influx and pulmonary cytokine and chemokine levels. Results Injurious MV leads to uric acid release in BALF of previously healthy mice. HVT ventilation significantly increased all endpoints of VILI as compared with the unventilated control group. Allopurinol and uricase treatment significantly decreased the wet/dry ratio and alveolar protein leak as compared with the HVT ventilated vehicle-treated group. IgM levels were also significantly lower in the allopurinoltreated group indicating protection of alveolar barrier function. Reduction of lung injury by allopurinol and uricase treatment was also demonstrated by the reduction of sRAGE concentrations, a marker of alveolar type I cell injury. Interestingly, treatment in the HVT group with allopurinol or uricase did not significantly reduce neutrophil influx or cytokine and chemokine levels. Conclusions The danger signal uric acid is released due to injurious mechanical ventilation. Reduction of uric acid concentrations with allopurinol or uricase decreased VILI and specifically epithelial injury and alveolar barrier dysfunction P193 High-frequency oscillatory ventilation in adults: experience in Chile SU Ugarte, CR Rojas, C Herrera Clinica INDISA, Santiago, Chile Critical Care 2011, 15(Suppl 1):P193 (doi: 10.1186/cc9613) Introduction The aim was to describe the epidemiological profile of adult patients who were treated with HFOV like a rescue method after conventional mechanical ventilation failure, during 2009 in our ICU, in Santiago, Chile, and to describe patient characteristics, HFOV strategies and outcomes. Methods A descriptive study. We evaluated the medical record of all adult patients treated with HFOV during 2009 at Clínica INDISA. We evaluated sex, age, associated co-morbidities, laboratory test results and main diagnosis at ICU admission, hours in conventional mechanical ventilation previous to HFOV connection, indication of HFOV, laboratory test results at the connection time to HFOV, and patient outcome.
S68
Results A total of 15 patients were treated with HFOV during 2009 in our ICU; the mean age was 47 years, being 80% men. Three patients did not have, at ICU admission or during the course of the current hospitalization, description of associated co-morbidities, while 53.3% had report of two or more co-morbidities. The main diagnosis at ICU admission was severe pneumonia (53.3%) with a mean APACHE II score of 27.7. The mean values for PaFi and IOX prior to HFOV connection were 108.8 and 25, respectively. The main indication observed in those patients was very high FiO2 requirement to achieve an adequate arterial oxygen saturation (60% of the cases). Twenty percent of the sample required reconnection to HFOV, the mortality in this group of patients was 100%. Of all patients that were exposed to HFOV, there was an effective weaning to CMV and medical discharge in 40% of them, while the mortality during HFOV was 60%. Conclusions We present the epidemiological profile of the patients exposed to HFOV during 2009 at our medical center, the mean age at admission was 47 years old; the main diagnosis was severe pneumonia, 40% of all patients survived. HFOV has beneficial effects on PaO2/FiO2 ratios and OI, and may be an effective rescue therapy for adults with severe oxygenation failure. This is the first study of its kind at a national level. References 1. 2.
3.
Rose L, et al.: High-frequency oscillatory ventilation in adults. AACN Adv Crit Care 2008, 19:412-420 Hager DN, et al.: Tidal volume delivery during high-frequency oscillatory ventilation in adults with acute respiratory distress syndrome. Crit Care Med 2007, 35:1522-1529. Metha S, et al.: High-frequency oscillatory ventilation in adults: the Toronto Experience. Chest 2004, 126:518-527.
P194 Stress–strain relationship in pulmonary cells under bidirectional stretch application K Gamerdinger, S Schumann, F Wernet, E Faehnrich, M Schneider, J Guttmann University Medical Center, Freiburg, Germany Critical Care 2011, 15(Suppl 1):P194 (doi: 10.1186/cc9614) Introduction Analysing the effects of mechanostimulation on pulmonary cells improves the understanding of the stress–strain relationship in the lungs. While there are plenty of different methods to apply strain on cells and thereby to analyze intracellular and extracellular processes, it remains difficult to measure the resulting strain, in other words the forces produced by cells to counteract the applied strain. Recently we presented a bioreactor to cyclically deflect cells by co-deflecting them with a carrier membrane [1]. The air-tight highly pliant siloxane-carrier membranes [2] used in our bioreactor were modified with Sulfo-SANPAH and RGD peptide [3] to allow cell adherence. Here we present actual data demonstrating changes in mechanical properties of pulmonary cell monolayers as a response to strain levels of up to 20% surface increase. Methods Different alveolar epithelial cell lines (A549 and RLE-6TN) were grown on RGD-coated, highly flexible polydimethyl siloxane membranes and were mechanically stimulated in a bioreactor [1,2]. After becoming 100% confluent, microscopic images of cell monolayers were taken before subjecting them to increasing sinusoidal mechanical strain of up to 20% surface increase. The resulting stress was measured as the force that the cells opposed to the applied strain. Immediately after the procedure, additional images of cells were taken. Results Stretching pulmonary cells bidirectionally led to a loss of intercellular connections and/or loss of integrin-binding sites to the RGD-labeled carrier membranes as indicated by comparing microscopic images before and after application of strain to cell monolayers. This was accompanied by a loss of the cell’s counterforce on strain. Conclusions The investigation of cell forces with our strain applicator allows us to analyze mechanical properties of cell constructs at the same time as we can track visually changes in cellular morphology. Strain-related cell damages as found in this study could play a role in development of ventilator-induced lung injury. References 1. 2. 3.
Schumann S, et al.: J Biomed Mater Res B Appl Biomater 2008, 86B:483-492. Armbruster C, et al.: J Biomed Mater Res B Appl Biomater 2009, 91:700-705. Li B, et al.: J Biomed Mater Res A 2006, 79:989-998.
Critical Care 2011, Volume 15 Suppl 1 http://ccforum.com/supplements/15/S1
P195 Optimal positive end-expiratory pressure in mechanically ventilated patients: a clinical study A Sundaresan1, JG Chase1, CE Hann1, GM Shaw2 1 University of Canterbury, Christchurch, New Zealand; 2Christchurch Hospital, Christchurch, New Zealand Critical Care 2011, 15(Suppl 1):P195 (doi: 10.1186/cc9615) Introduction The optimal level of positive end-expiratory pressure (PEEP) is still widely debated in treating acute respiratory distress syndrome (ARDS) patients. Current methods of selecting PEEP only provide a range of values and do not provide unique patient-specific solutions. Model-based methods offer a novel way of using noninvasive pressure–volume (PV) measurements to estimate patient recruitability. This paper examines the clinical viability of such models in pilot clinical trials to assist therapy, optimise patient-specific PEEP, and assess the disease state and response over time. Methods Ten patients with acute lung injury or ARDS underwent incremental PEEP recruitment manoeuvres. PV data were measured in increments of 5 cmH2O and fitted to the recruitment model using volume-controlled ventilation. Inspiratory and expiratory breath holds were performed to measure airway resistance and auto-PEEP. Three model-based metrics are used to optimise PEEP based on threshold opening pressures (TOP), threshold closing pressures (TCP) and net recruitment. ARDS status was assessed by model parameters capturing recruitment and compliance. Two patients underwent multiple recruitment manoeuvres over time and four model metrics reflected and tracked the state or their ARDS. Results Median model fitting error across all patients for inflation and deflation was 2.8% and 1.02%, respectively, with all patients experiencing auto-PEEP. In all three metrics cases, model-based optimal PEEP was higher than clinically selected PEEP. Ranges for optimal PEEP were (5, 27), (10, 25) and (10, 30) cmH2O for TOP, TCP and net recruitment metrics, respectively. Disease-tracking metrics corresponded with the physiological status of two patients, indicating the potential for tracking disease state. In particular, monitoring TOP, standard deviation, TOP gradient and TCP gradient reflected compliance and recruitability changes as a function of time. Normalised SD reflected compliance changes in an exponential manner with the equation 72.6 x exp–0.0664 x SD, indicating the model’s utility in evaluating true lung linear compliance. Conclusions For ARDS patients, the model-based method presented in this paper provides a unique, non-invasive method to select optimal patient-specific PEEP. In addition, the model has the capability to assess disease state over time and monitor patient status.
P196 Flow-balanced expiration reduces oedema formation in a porcine oleic acid lung injury model S Schumann1, U Goebel1, J Haberstroh2, M Schneider1, HJ Priebe1, M Lichtwarck-Aschoff3, J Guttmann1 1 University Medical Center, Freiburg, Germany; 2University BioMed Center, Freiburg, Germany; 3Uppsala University, Uppsala, Sweden Critical Care 2011, 15(Suppl 1):P196 (doi: 10.1186/cc9616) Introduction Positive pressure ventilation involves ventilatorcontrolled inflation of the lungs followed by passive expiration driven by the elastic recoil forces of the respiratory system. In contrast to inspiration where the flow is controlled by the ventilator, expiration is passive, and the only clinically available means of influencing expiration is positive end-expiratory pressure (PEEP). During passive expiration, the flow curve starts with a high peak flow followed by an exponential decay in airflow rate so that typically there is no flow during more than 50% of expiration time. Prolonging the phase of expiratory flow may be expected to be lung protective. Methods Sixteen pigs with oleic acid-induced lung injury were mechanically ventilated for 6 hours with volume-controlled ventilation either without or with flow-balanced expiration. Following insertion of a controllable expiratory resistance into the expiratory outlet of the ventilator, expiratory resistance markedly increased at the beginning of expiration and decreased continuously during the expiration phase.
S69
As a result, the expiratory flow curve changed from an exponentially decaying curve to a balanced flow pattern with lower flow rates at the beginning and higher ones at the end of the expiration phase, thereby achieving complete expiration. Ventilation settings were tidal volume 8 ml/kg, I:E ratio 1:2, RR 15/minute, Tinsp 1.5 seconds. Initially PEEP was set at 8 cmH2O. During the experiment, PEEP was adjusted to maintain PaO2 ≥60 mmHg. Results To maintain PaO2 ≥60 mmHg, after 6 hours of mechanical ventilation PEEP had to be increased from 8 to 13 ± 3 cmH2O in the conventionally ventilated animals but to only to 10 ± 1 cmH2O in the animals ventilated with flow-balanced expiration (P <0.05). Lung biopsies from animals ventilated without flow-balanced expiration showed more infiltrations and thicker septa compared with those ventilated with flow-balanced expiration (all P <0.05). The wet-todry ratio of tissue samples from lungs ventilated with without flowbalanced expiration were higher than those from lungs ventilated with flow-balanced expiration (10 ± 5 vs. 5 ± 4, P <0.05). Conclusions Flow-balanced expiration during mechanical ventilation reduces oedema formation in the injured lung. Reduced expiratory peak flow and increased mean airway pressure during expiration are likely to have contributed to this beneficial effect.
P197 Positive changes in the continuous desaturation index during mechanical ventilation are associated with mortality due to acute respiratory failure G Vazquez de Anda1, S Larraza2, J Talavera1, L De la Cruz Avila3, H Lopez3, D Rodriguez1 1 Universidad Autonoma del Estado de Mexico, Toluca, Mexico; 2Hospital Materno Perinatal Monica Pretelini del Instituto de Salud del Estado de Mexio, Toluca, Mexico; 3Centro Medico del Instituto de Seguridad Social del Estado de Mexico y Municipios, Toluca, Mexico Critical Care 2011, 15(Suppl 1):P197 (doi: 10.1186/cc9617) Introduction We have previously shown that the desaturation index (DI) and the continuous desaturation index (CDI) displayed on the desaturation index monitoring system (DIMS) have a high sensitivity and specificity to identify lung dysfunction [1,2]. However, dynamic changes during mechanical ventilation (MV) that may reflect the patient’s response for MV treatment have not yet been tested. Methods Fifty-eight patients with and without ALI/ARDS were followed during the first 24 hours of MV with the DIMS. The system computes the CDI from the positive end-expiratory pressure (PEEP), the inspired fraction of oxygen (FiO2) and arterial saturation by pulse oximetry (SpO2) [1,2]. The CDI is a percentage that is displayed graphically and numerically. Patients were divided into three groups according to the initial (first hour) CDI. Group (G) I (n = 16), CDI above 90%. GII (n = 22), CDI between 70 and 90%. GIII (n = 20), CDI below 70%. Then, changes in the CDI were calculated every hour (CDIh1 minus CDIh2, CDIh2 minus CDIh3, and so forth), three types of changes were expected: no change (even), negative changes (improvement of lung function) and positive changes (worsening of lung function). The mean of CDI changes was calculated at 6, 12, 18 and 24 hours after the initial recording. All patients were followed and mortality associated with acute respiratory failure (ARF) was recorded. Results Changes (mean ± standard deviation) at 6 hours for GI: –1.82 ± 4.2, GII: –2.27 ± 9.2 and GIII: 2.52 ± 5.2 (P = 0.061). At 12 hours: GI: –2.2 ± 4.9, GII: –2.2 ± 9.1 and GIII: 6.07 ± 13.7 (P = 0.014). At 18 hours: GI: –1.36 ± 5.2, GII: –4.24 ± 11 and GIII: 5.47 ± 19.2 (P = 0.068). At 24 hours: GI: –2.09 ± 4.7, GII: –4.24 ± 12.8 and GIII: 8.53 ± 27.8 (P = 0.058). The mortality rate was 17.9% for GI, 33.3% for GII and 73.3% for GIII (P = 0.01). The association between positive changes and mortality was 30.8% for GI, and 100% for GII and GIII (P = 0.01). Conclusions We conclude that positive changes in the CDI during the MV are associated with mortality due to ARF. The CDI may help to improve the MV settings according to the patient’s response to the FiO2 and PEEP treatment. References 1. 2.
Vazquez de Anda GF, et al.: Intensive Care Med 2004, 30(Suppl 1):A0230. Vazquez de Anda GF, et al.: Crit Care 2005, 9(Suppl 1):P89.
Critical Care 2011, Volume 15 Suppl 1 http://ccforum.com/supplements/15/S1
S70
Table 1 (abstract P199). Calculations to extract additional Vt according to predicted and measured PFTs Vt to PFTs (%)
Vt to PFTs (%)
δ
VtA (ml)
VtN (ml)
Vt Pr (ml)
FEV1 Pr
FEV1 Ms
FEV1
FEV1
FEV1
Males
476.3 (6.1)
10.0 (016)
10.9 (0.13)
0.87 (0.1)
47.7 (5.1)
524 (8.1)
Females
384.9 (6.0)
10.4 (0.2)
11.1 (0.16)
0.67 (0.1)
29.9 (4.7)
414.8 (7.8)
Vt Pr (ml)
FVC Pr
FVC Ms
FVC
FVC
FVC
Males
476.3 (6.1)
8.35 (0.12)
9.1 (0.1)
0.75 (0.1)
51.3 (5.7)
527 (9.1)
Females
384.9 (6.0)
8.9 (0.17)
9.6 (0.14)
0.67 (0.1)
34.7 (5.5)
419 (8.6)
P198 Strain threshold for ventilator-induced lung injury A Santini1, A Protti1, M Cressoni1, T Langer1, D Febres1, G Conte2, L Lombardi3, M Lattuada3, P Taccone3, L Gattinoni1 1 Università degli Studi di Milano, Dipartimento di Anestesiologia e Terapia Intensiva, Milan, Italy; 2Università degli Studi di Milano, Centro Ricerche Chirurgiche Precliniche, Milan, Italy; 3Fondazione IRCCS Ca’ Granda, Ospedale Maggiore Policlinico, Milan, Italy Critical Care 2011, 15(Suppl 1):P198 (doi: 10.1186/cc9618) Introduction Unphysiological lung strain (tidal volume/functional residual capacity, TV/FRC) may cause ventilator-induced lung injury (VILI) [1]. Whether VILI develops proportionally to the applied strain or only above a critical threshold remains unknown. Methods In 20 healthy, mechanically ventilated pigs, FRC and lung weight were measured by computed tomography. Animals were then ventilated for up to 54 hours with a TV set to produce a predetermined strain. At the end, lung weight was measured with a balance. VILI was defined as final lung weight exceeding the initial one. Results Lung weight either did not increase at all (no-VILI group; lung weight change –73 ± 42 g, n = 9) or markedly augmented (VILI group; 264 ± 80 g, n = 11). In the two groups, strain was 1.38 ± 0.68 and 2.16 ± 0.50 (P <0.01), respectively. VILI occurred only when lung strain reached or exceeded a critical threshold, between 1.5 and 2.1 (Figure 1). Conclusions In animals with healthy lungs VILI only occurs when lung strain exceeds a critical threshold. Reference 1.
Gattinoni L, Carlesso E, Cadringher P, et al.: Physical and biological triggers of ventilator-induced lung injury and its prevention [review]. Eur Respir J 2003, 22(Suppl 47):15s-25s.
Figure 1 (abstract P198).
P199 Do athletes require a higher tidal volume? An approach using predicted versus measured PFTs P Myrianthefs, G Baltopoulos School of Nursing, Athens University, ‘Agioi Anargyroi’ Hospital, Kifissia, Greece Critical Care 2011, 15(Suppl 1):P199 (doi: 10.1186/cc9619) Introduction Tidal volume (Vt) for ALI/ARDS is 6 ml/kg. However, professional athletes have higher forced vital capacity (FVC) and forced expiratory volume in 1 second (FEV1) than predicted for the same body weight and thus a higher Vt could be required. Methods To answer this question, the predicted Vt (Vt Pr = 6 ml/kg) was calculated as the percentage of measured (Ms) and predicted (Pr) FEV1 and FVC, and their difference (Δδ = Ms – Pr) was extracted to calculate the additional Vt (VtA) required according to measured PFTs. Values are expressed as the mean (SEM). Results We included 156 males and 95 females of mean duration of sporting of 11.8 (6.4) and 11.6 (6.9) years, respectively. Ms and Pr FEV1 and FVC were recorded (data not shown). Vt Pr, the percentage to Ms and Pr FEV1 and FVC, their difference Δδ, the corresponding VtA and the new Vt (VtN) are presented in Table 1. Conclusions According to our hypothesis an additional Vt of 0.6 for males and 0.5 ml/kg for females maybe required for professional athletes under mechanical ventilation. Acknowledgements Partially funded by OPAP. P200 Potential reduction of ventilator-associated pneumonia by a novel peristaltic feeding tube: initial evaluation of safety and efficacy in a pig model and humans Y Avitzur1, L Dayan2, O Pintel2, M Dayan2, S McClave3, P Singer4 1 Sickkids, Toronto, Canada; 2LunGuard, Omer, Israel; 3University of Louisville, KY, USA; 4ICU, Rabin, Petah Tikva, Israel Critical Care 2011, 15(Suppl 1):P200 (doi: 10.1186/cc9620) Introduction Prevention of gastroesophageal reflux (GER) may reduce the incidence of ventilator-associated pneumonia (VAP). The aim of this study was to assess the safety and tolerance of a novel peristaltic feeding tube (PFT/LunGuard) in a pig model and healthy volunteers, and to assess its initial efficacy in preventing GER. Methods The PFT is a NG feeding tube with three longitudinal balloons located at its distal end. The distal balloon is positioned 3 cm above the GE junction. The balloons are inflated/deflated sequentially in a peristaltic manner by an external monitor to prevent GER. Initially in six ventilated pigs, safety parameters including vital signs, macroscopic and microscopic inspection of the esophagus were assessed after sacrificing the animals. Prevention of GER was assessed by pH meter in one pig. In three healthy volunteers where the PFT was placed and operated for 8 hours, safety and tolerance were assessed by questionnaire given to the study subjects and by gastroscopy done pre/post PFT operation. Results Each balloon was cyclically inflated for 30 seconds and then deflated. Average intermittent pressure against the esophageal wall while the balloons were inflated was approximately 30 mmHg. Visual inspection of the esophagus in both animals and humans showed no damage to the esophageal wall. Full thickness biopsies taken from esophagus under the area of the balloons as well as control biopsies taken from the proximal esophagus above showed no evidence of
Critical Care 2011, Volume 15 Suppl 1 http://ccforum.com/supplements/15/S1
necrosis, ulceration, inflammation, or cell damage. Healthy volunteers reported a minimal sensation of PFT rhythmic movement at the nares and minimal discomfort in the nose and hypopharynx from the tube itself. The PFT did not interfere with normal drainage of oropharyngeal secretions. PH measurements made in the pig following injection of diluted HCl (pH = 4.0) into the distal esophagus at a maximum rate of 16 ml/second over 5 seconds showed that GER was prevented by the PFT. Conclusions The PFT is safe, well tolerated and may serve to reduce risk of VAP by preventing GER in ICU patients on mechanical ventilation who are receiving enteral nutrition. Prospective clinical trials to assess PFT efficacy will be conducted. P201 Respiratory variability in mechanically ventilated patients T Desaive1, L Piquilloud2, K Moorhead1, J Roeseler3, JG Chase4, E Bialais3, PF Laterre3, P Jolliet2, T Sottiaux5, D Tassaux6, B Lambermont1 1 University of Liege, Belgium; 2University Hospital, Lausanne, Switzerland; 3 Cliniques Universitaires St-Luc, Brussels, Belgium; 4University of Canterbury, Christchurch, New Zealand; 5La clinique Notre Dame de Grâce, Gosselies, Belgium; 6University Hospital, Geneva, Switzerland Critical Care 2011, 15(Suppl 1):P201 (doi: 10.1186/cc9621) Introduction Increased respiratory pattern variability is associated with improved oxygenation. Pressure support (PS) is a widely used partialassist mechanical ventilation (MV) mode, in which each breathing cycle is initiated by flow or pressure variation at the airway due to patient inspiratory effort. Neurally adjusted ventilatory assist (NAVA) is relatively new and uses the electrical activity of the diaphragm (Eadi) to deliver ventilatory support proportional to the patient’s inspiratory demand. We hypothesize that respiratory variability should be greater with NAVA compared with PS. Methods Twenty-two patients underwent 20 minutes of PS followed by 20 minutes of NAVA. Flow and Eadi curves were used to obtain tidal volume (Vt) and ∫Eadi for 300 to 400 breaths in each patient. Patientspecific cumulative distribution functions (CDF) show the percentage Vt and ∫Eadi within a clinically defined (±10%) variability band for each patient. Values are normalized to patient-specific medians for direct comparison. Variability in Vt (outcome) is thus expressed in terms of variability in ∫Eadi (demand) on the same plot. Results Variability in Vt relative to variability in ∫Eadi is significantly greater for NAVA than PS (P = 0.00012). Hence, greater variability in outcome Vt is obtained for a given demand in ∫Eadi, under NAVA, as illustrated in Figure 1 for a typical patient. A Fisher 2 x 2 contingency analysis showed that 45% of patients under NAVA had a Vt variability in equal proportion to ∫Eadi variability, versus 0% for PS (P <0.05). Conclusions NAVA yields greater variability in tidal volume, relative to ∫Eadi demand, and a better match between Vt and ∫Eadi. These results indicate that NAVA could achieve improved oxygenation compared
Figure 1 (abstract P201).
S71
with PS when sufficient underlying variability in ∫Eadi is present, due to its ability to achieve higher tidal volume variability from a given variability in ∫Eadi. P202 Suspended animation-inducer hydrogen sulphide protects against organ injury during endotoxemia, but aggravates systemic inflammation H Aslami, C Beurskens, F De Beer, M Kuipers, M Schultz, N Juffermans Academic Medical Centre, Amsterdam, the Netherlands Critical Care 2011, 15(Suppl 1):P202 (doi: 10.1186/cc9622) Introduction A suspended animation-like state induced by hydrogen sulphide (H2S) was shown before to protect lungs from ventilatorinduced lung injury by reducing metabolism and inflammation. This beneficial effect of H2S seems promising, but the effects of H2S during prolonged infusion are unknown. We hypothesized that reducing metabolism in a rat model of LPS-induced systemic inflammation during 8 hours is more protective than during 4 hours. Methods After anesthesia, rats (400 g) received an intravenous injection with 7.5 ml/kg LPS and were subsequently randomized to 4 or 8 hours of mechanical ventilation and treated with intravenous H2S donor NaHS (2 mg/kg/hour). Controls received saline. During the experiment, mean arterial pressure (MAP) was kept above 65 mmHg with fluids and noradrenalin infusion. After exsanguination, bronchoalveolar lavage fluid was obtained and organs were harvested. Data are mean ± SEM. Results H2S reduced metabolism, exemplified by a reduction in heart rate, body temperature and etCO2 compared with saline controls. Also, oxygenation was improved in these groups. The H2S-treated animals required more noradrenalin to keep the MAP above 65 mmHg. LPSinduced lung injury was reduced after 4 hours of H2S infusion compared with controls, with lower BALF protein levels (399 ± 46 vs. 655 ± 85 μg/ ml), IL-6 levels (4.5 ± 0.3 vs. 6.2 ± 0.6 ng/ml) and CINC3 levels (2.4 ± 0.09 vs. 2.9 ± 0.2 ng/ml) (P <0.05 for all), whereas 8 hours of infusion did not enhance protection. Kidney injury, measured by wet-to-dry ratio, was reduced after 8 hours of H2S infusion compared with saline controls (5.5 ± 0.1 vs. 6.1 ± 0.1 ratio, P <0.05). The cumulative fluid balance was the same in all groups. In contrast to the protective effect at tissue level, H2S infusion resulted in enhanced systemic levels of IL-1, IL-6, TNF and CINC3 compared with saline controls. Conclusions During endotoxemia, 4 hours of H2S infusion protected against lung injury, which was not further enhanced by 8 hours of infusion. In contrast, kidney damage was diminished after 8 hours but not after 4 hours of H2S infusion. However, H2S aggravated systemic inflammation in endotoxemia, suggesting that administration of H2S gas may be preferable. P203 Dead space fraction indicates the titration of optimal positive endexpiratory pressure after recruitment in acute respiratory distress syndrome Y Yang, J Chen, H Qiu Zhong-Da Hospital and College of Southeast University, Nanjing, China Critical Care 2011, 15(Suppl 1):P203 (doi: 10.1186/cc9623) Introduction The objective of this study is to evaluate the value of dead space fraction (VD/VT) as a method for indicating the optimal PEEP titration. Methods Twenty-three patients with ARDS were enrolled in the study. After lung recruitment using sustained inflation (SI), the optimal PEEP was respectively titrated by the optimal oxygenation, the maximum static pulmonary compliance (Cst), and the lowest VD/VT. The influence of these methods on oxygenation, Cst, VD/VT and FRC were observed. Results The PEEP level titrated by the lowest VD/VT (10.1 ± 2.8 cmH2O) had no significant difference from the PEEP level titrated by the maximum Cst (11.3 ± 2.5 cmH2O) (P >0.05). However, the PEEP level titrated by the lowest VD/VT was significantly lower than that determined by optimal oxygenation (P <0.05). The oxygenation at the PEEP titrated by VD/VT was significantly lower than the optimal oxygenation, but no significant difference in PaO2/FiO2 was observed
Critical Care 2011, Volume 15 Suppl 1 http://ccforum.com/supplements/15/S1
between the PEEP titrated by the lowest VD/VT and the maximum Cst. Additionally, the VD/VT and the FRC at the PEEP chosen by the three methods also had no significant difference. Conclusions The lowest VD/VT could be one of the methods to choose the optimal PEEP in ARDS patients. References 1. 2. 3. 4. 5. 6. 7. 8. 9. 10.
Ware LB, et al.: N Engl J Med 2000, 342:1334-1349. Meade MO, et al.: JAMA 2008, 299:637-645. Rubenfeld GD: JAMA 2010, 303:883-884. Rouby JJ, et al.: Am J Respir Crit Care Med 2002, 165:1182-1186. Tusman G, et al.: Intensive Care Med 2006, 32:1863-1871. Bernard GR, et al.: Am J Respir Crit Care Med 1994, 149(3 Pt 1):818-824. Gattinoni L, et al.: N Engl J Med 2006, 354:1775-1786. Takeuchi M, et al.: Anesthesiology 2002, 97:682-692. Borges JB, et al.: Am J Respir Crit Care Med 2006, 174:268-278. Gattinoni L, et al.: Eur Respir J Suppl 2003, 47:15s-25s.
P204 Dynamic distribution of conventional dendritic cells in the lung, blood and spleen from the early phase of sepsis-induced acute lung injury J Liu, H Qiu Zhong-Da Hospital, Southeast University, Nanjing, China Critical Care 2011, 15(Suppl 1):P204 (doi: 10.1186/cc9624) Introduction Respiratory dendritic cells (DCs), especially conventional DCs, are centrally involved in the induction phase of the immune response in our respiratory system. However, their role in acute lung injury (ALI) is largely unknown and little information concerning cDCs of blood and spleen is available on ALI. Methods c57BL/6 mice were intratracheally challenged with Escherichia coli LPS (2 mg/kg). At 6 hours, 12 hours, and 24 hours after i.t. delivery of LPS (ALI group) or PBS alone (Control group), mice were sacrificed, and blood, lungs and spleens were collected. cDCs were detected using flow cytometry in enzyme-digested lung, blood, and spleen. Results The sepsis-induced ALI showed divergent kinetics of cDCs in peripheral blood, lung and spleen, respectively. ALI resulted in a rapid cDC accumulation in the lung, the frequencies of cDCs in ALI mice were significantly increased during all time points, compromised (2.38 ± 0.78)% at 12 hours, and peaked at 24 hours postchallenge (2.86 ± 0.55)%, relative to lung nucleated cells (P <0.05 vs. Control). However, splenic cDCs only showed a markedly transient augmentation to a peak (1.92 ± 0.25)% at 12 hours (P <0.05 vs. Control), but subsequently declined to baseline (0.96 ± 0.21)% at 24 hours. In contrast to the lung cDC accumulation at 6 hours, sepsis-induced ALI led to a decreased percentage (0.32 ± 0.10)% of circulating cDCs at the same time point (P <0.05 vs. Control), then the percentage of circulating cDCs was significantly increased (1.50 ± 0.31)% compared with that of control mice at 12 hours, and further increased (2.20 ± 0.92)% at 24 hours after LPS-induced ALI (P <0.05 vs. Control). All cDCs within the blood, lungs and spleens had undergone a modest maturation in ALI from sepsis. Conclusions ALI by sepsis produces different quantitative and phenotypical changes in pulmonary, circulatory and splenic cDCs. Lung cDCs may participate in the early inflammatory response to ALI. P205 A radiological visual scale to predict the potentially recruitable lung in ALI/ARDS patients D Chiumello1, M Cressoni1, A Marino2, E Gallazzi2, M Brioni2, MC Andrisani1, M Lazzerini1, P Biondetti1 1 Fondazione IRCCS Ca’ Granda-Ospedale Maggiore Policlinico, Milan, Italy; 2 Università degli Studi di Milano, Milan, Italy Critical Care 2011, 15(Suppl 1):P205 (doi: 10.1186/cc9625) Introduction In ALI/ARDS patients the amount of potentially recruitable lung is extremely variable and it is poorly predictable by the changes of oxygenation, carbon dioxide or compliance during a PEEP trial [1]. At the present time the gold standard to compute the lung recruitability is the quantitative lung CT scan, in which each lung
S72
image, after being manually drawn, is analyzed by dedicated software. However, this is both a laborious and time-consuming technique. The aim of this study was to evaluate the ability of a visual radiological scale compared with lung CT scan analysis to predict the lung recruitability in ALI/ARDS patients. Methods A whole lung CT scan was performed at 5 and 45 cmH2O airway pressure. For CT scan analysis each lung image was manually outlined and analyzed by a dedicated software. The potentially recruitable lung was defined as the proportion of the nonaerated lung tissue in which aeration was restored [1]. For radiological visual scale analysis, two radiologists performed a blinded evaluation of the consolidation/collapsed areas in each lobe by visual inspection [2]. The overall lung change in consolidation/collapsed was obtained by the sum of each lobe and computed as the difference between the two conditions. Results Twenty-four ALI/ARDS patients (age 59 ± 15 years, BMI 26 ± 4 kg/m2, PaO2/FiO2 170 ± 60, PEEP 10 ± 2 cmH2O) were enrolled. The percentage of potentially recruitable lung was 16.2 ± 7.1% and 14.7 ± 7.0%, computed by CT scan and by the visual radiological scale, respectively. The mean difference between CT scan analysis and visual radiological analysis was 3.3 ± 4.6% (median: 2.91, interquartile range: 0.38 to 6.56). The error of the visual method was lower than 5% in 14 patients (58.3%), between 5% and 10% in eight patients (33.3%) and between 10% and 15% in two patients (8.3%). Conclusions The application of a radiological visual scale is able to predict the amount of potentially recruitable lung similarly to those obtained by a dedicated software avoiding the need of manually drawing each lung image. References 1. 2.
Gattinoni L, et al.: N Engl J Med 2006, 354:1775-1786. Pierce RJ, et al.: Thorax 1980, 35:773-780.
P206 Interactions of nebulized heparin with intravenous antithrombin for combined therapy of acute lung injury S Rehberg1, L Sousse2, Y Yamamoto2, LD Traber2, DL Traber2, P Enkhbaatar2 1 University of Muenster, Germany; 2The University of Texas Medical Branch, Galveston, TX, USA Critical Care 2011, 15(Suppl 1):P206 (doi: 10.1186/cc9626) Introduction The present randomized, controlled, experimental study was performed to compare the effects of two different doses of nebulized heparin on the efficiency of the combined therapy with intravenous (i.v.) recombinant human antithrombin (rhAT) and nebulized tissue plasminogen activator (TPA) in an established ovine model of acute lung injury. Methods Chronically instrumented sheep were subjected to a 40% total body surface area third-degree burn and 48 breaths of cotton smoke under deep anesthesia. Sheep were randomly assigned to receive an i.v. infusion of 6 U/kg/hour rhAT (started 1 hour post injury) combined with nebulized TPA (2 mg every 4 hour, started 4 hours post injury) and heparin (5,000 (low-dose) or 10,000 IU (high-dose), respectively, every 4 hours, started 2 hours post injury) or 0.9% NaCl i.v. and aerosolized (control; n = 6 each). All sheep were awake, mechanically ventilated and fluid resuscitated according to international guidelines for 48 hours. Data are expressed as mean ± SEM at 48 hours. Results Both strategies attenuated lung injury, as suggested by higher PaO2/FiO2 ratios (low-dose: 276 ± 44 mmHg, high-dose: 352 ± 25 mmHg, control: 134 ± 30 mmHg) and lower airway peak pressures (27 ± 2 cmH2O, 27 ± 1 cmH2O, 36 ± 2 cmH2O). Notably, the combination with low-dose heparin reduced pulmonary transvascular fluid flux (16 ± 2 ml/hour, 40 ± 5 ml/hour, 51 ± 4 ml/hour) and the permeability index (9 ± 1 ml/hour, 19 ± 2 ml/hour, 25 ml/hour) and increased plasma protein (4.6 ± 0.1 g/dl, 3.9 ± 0.2 g/dl, 4.0 ± 0.3 g/dl) versus both other groups (P <0.05 each). Cumulative net fluid balance was lower in the low-dose heparin group (2.1 ± 0.2l) versus control animals (3.5 ± 0.4 l; P <0.05). Conclusions With the lower dose of heparin the systemic antiinflammatory effects of i.v. rhAT on vascular leakage are more pronounced, while the local, beneficial effects of nebulized heparin on gas exchange are preserved. Therefore, lower doses of heparin may
Critical Care 2011, Volume 15 Suppl 1 http://ccforum.com/supplements/15/S1
S73
be more beneficial when used in combination with i.v. rhAT for the treatment of combined burn and smoke inhalation injury. A reduction of the systemic interaction between heparin and rhAT represents a possible explanation. P207 Thrombopoietin may enhance ventilator-induced lung injury LD Del Sorbo, V Fanelli, G Muraca, EL Martin, L Lutri, A Costamagna, B Assenzio, E Lupia, G Montrucchio, VM Ranieri University of Turin, Italy Critical Care 2011, 15(Suppl 1):P207 (doi: 10.1186/cc9627) Introduction Ventilator-induced lung injury is characterized by release of inflammatory mediators and increased vascular permeability resulting in alveolar edema formation. Thrombopoietin (TPO), whose most known function is the stimulation of the proliferation of megakaryocytes, has also shown several proinflammatory effects. Moreover, TPO receptor, c-Mpl, is constitutively expressed on endothelial cells and may modulate the permeability of the endothelium. We investigated the role of TPO in the impairment of the alveolar-capillary membrane resulting in alveolar edema formation during mechanical ventilation. Methods An ex vivo model of isolated, ventilated and perfused mouse lung was set up: ventilation was performed for 2 hours with both low-stress pressure (peak inspiratory pressure = 7 cmH2O, PEEP = 2 cmH2O, RR = 90 beats/minute) and high-stress pressure (peak inspiratory pressure = 20 cmH2O, PEEP = 0, RR = 90 beats/minute), in the presence or absence of TPO (1 ng/ml) in the perfusate (2% bovine serum albumin RPMI medium at 1 ml/minute flow rate). At the end of the experiment, lung compliance, assessed through tidal volume, and protein concentration in the bronchoalveolar lavage (BAL) fluid were measured. Results During high-stress ventilation, lung compliance was significantly reduced by the presence of TPO in the perfusate. TPO did not affect compliance during low-stress pressure. BAL fluid protein concentration was increased by the presence of TPO in both pressure setup, but the increase was statistically significant only after high-stress ventilation. See Table 1. Conclusions TPO may enhance the permeability of the alveolarcapillary membrane contributing to the mechanisms of ventilatorinduced lung injury. P208 Indoleamine-2,3-dioxygenase activity induces neutrophil apoptosis K Van der Sluijs, R Singh, A Dijkhuis, M Snoek, R Lutter Academic Medical Center, Amsterdam, the Netherlands Critical Care 2011, 15(Suppl 1):P208 (doi: 10.1186/cc9628) Introduction Influenza-related mortality is often caused by secondary bacterial pneumonia. We have previously shown that the tryptophancatabolizing enzyme indoleamine-2,3-dioxygenase (IDO) critically impairs host defense against secondary bacterial pneumonia [1]. Since inhibition of IDO resulted in increased neutrophil numbers during primary viral infection, we hypothesized that tryptophan degradation and/or the generation of downstream metabolites induces neutrophil apoptosis. In the present study we aimed to investigate the impact of IDO-mediated tryptophan metabolism on neutrophil apoptosis in vitro and in vivo. Methods Freshly isolated neutrophils were cultured in the presence or absence of tryptophan, kynurenine and 3-hydroxy-anthranilic acid. Apoptosis was identified by annexin V/propidium iodine staining
(%, mean ± SD). To confirm our in vitro data, transgenic mice that conditionally express IDO in the airway epithelium upon doxycycline (dox) treatment and control mice were challenged with LPS (1 μg) or Klebsiella pneumoniae (104 colony-forming units) intranasally and sacrificed after 24 hours to count neutrophils in bronchoalveolar lavage fluid (total number, mean ± SD). Statistical analysis was performed by Student’s t test or Mann–Whitney U test where appropriate. P <0.05 was considered significant. Results Both kynurenine and 3-hydroxy-anthranilic acid enhanced apoptosis in freshly isolated neutrophils (60.3 ± 8.7% and 45.5 ± 1.7% respectively vs. 33.5 ± 8.1% under control conditions, both P <0.05), which was reversed by adding tryptophan. Conditional transgenic mice, which showed marked expression of IDO in the pulmonary compartment, had reduced neutrophil numbers in bronchoalveolar lavage fluid after challenge with K. pneumoniae (3.36 ± 1.92 x 10⁵ vs. 12.1 ± 9.0 x 10⁵ in dox-treated littermates, P <0.05) and LPS (1.88 ± 1.22 x 10⁵ vs. 5.21 ± 3.81 x 10⁵ in control-treated transgenic mice, P <0.05), which was associated with active caspase-3 staining in dox-treated mice, but not in control mice. Conclusions Neutrophils undergo apoptosis in presence of kynurenine or 3-hydroxy-anthranilic acid and the absence of tryptophan. Pulmonary IDO expression, as occurs during influenza infection, enhances neutrophil apoptosis in vivo and may impair host defense against secondary bacterial infections. Reference 1.
van der Sluijs KF, et al.: J Infect Dis 2006, 193:214-222.
P209 Defining sepsis in the ICU: a sensitivity analysis P Klein Klouwenberg, OL Cremer University Medical Centre Utrecht, the Netherlands Critical Care 2011, 15(Suppl 1):P209 (doi: 10.1186/cc9629) Introduction According to Consensus Conference [1] and PROWESS study criteria [2], the diagnosis of sepsis requires evidence of infection and the presence of a systemic inflammatory response syndrome (SIRS) that is characterized by specific physiological alterations. Although these criteria are widely accepted in clinical practice and research, they have been criticized for being nonspecific and nonrobust in both clinical practice and clinical research settings [3]. With regard to these issues, it remains unknown to what extent differences in the frequency (every minute vs. hourly), timing (SIRS criteria transiently present at any time point in the last 24 hours vs. simultaneously present during a longer period) and method (automated vs. manual) of data capture may affect the diagnosis of sepsis. In this study we aimed to quantify the effect of minor variations in the definition of SIRS on the apparent incidence of sepsis. Methods We performed an observational study in consecutive patients admitted to a large tertiary ICU in The Netherlands between January 2009 and October 2010. Patients following elective surgery who had an uncomplicated stay <96 hours were excluded from analysis. We collected data on SIRS criteria and information on infectious status during the first 24 hours of admission. Results In total 1,216 patients met the inclusion criteria. The incidence of SIRS varied from 99.5% (defined as having two or more criteria transiently present during a 24-hour period of automatic recording) to 66.4% (defined as having three or four criteria simultaneously present with manual recording at hourly intervals), and the incidence of sepsis ranged subsequently from 31.1% to 25.1% (RR = 0.81, 95% CI = 0.71 to 0.92). The PPV of having an infection was 31.2% and 37.7% for the respective settings, the NPV was 100% and 82.1%. In non-infected patients, 60.0% of patients had three or more SIRS criteria. The frequency of having two
Table 1 (abstract P207) High-stress MV
High-stress MV + TPO
Low-stress MV
Low-stress MV + TPO
Lung elastance (cmH2O/ml)
14.1 ± 1.43
16.5 ± 0.4*
10.2 ± 0.3
9.6 ± 0.4
BAL (μg/g body weight)
19.18 ± 1.69
29.80 ± 3.25*
13.22 ± 1.29
17.71 ± 1.54
Data presented as mean ± SE. *P <0.05.
Critical Care 2011, Volume 15 Suppl 1 http://ccforum.com/supplements/15/S1
or more SIRS criteria varied from 79.2% in the first 2 hours of admission compared with 70.2% 12 to 24 hours after admission. Conclusions The measured incidence of SIRS and sepsis heavily depended on minor variations in modes of data recording and interpretation of diagnostic criteria. A more precise definition of sepsis should be incorporated into the design of future clinical trials in sepsis in order to ensure the uniform recruitment of patients. References 1. 2. 3.
Bone R., et al.: Chest 1992, 101:1644-1655. Bernard G, et al.: N Engl J Med 2001, 344:699-709. Vincent J: Crit Care Med 1997, 25:372-374.
P210 Analysis of nosocomial bacteremia in an ICU during 16 months L Cachafeiro, C Soriano, J Figueira, J Manzanares, J Camacho, M Jimenez Lendinez Hospital la Paz, Spain, Spain Critical Care 2011, 15(Suppl 1):P210 (doi: 10.1186/cc9630) Introduction The aim of our study is to evaluate the mortality, clinical impact and causative microorganisms of nosocomial bacteremia in the ICU of a tertiary university hospital. Methods A prospective observational study in a 20-bed medical/ surgical ICU, during a 16-month period. We included all patients admitted to the ICU >24 hours, excluding patients with acute coronary disease, from February 2009 to June 2010. We collected all episodes of bacteremia occurring in patients, demographics and epidemiological data, clinical impact, overall hospital mortality, ICU mortality and mortality related to bacteremia. Bacteremia type (primary, secondary, or connected to the catheter), microbiologic agents and empirical antibiotic therapy used. Results A total of 1,112 patients were admitted to the ICU from February 2009 to June 2010. During this period, 63 nosocomial bacteremias were diagnosed in 45 patients, which represented 4% from the total admissions. The median age was 52 ± 16. Sixty-four percent were male. The median APACHE II score was 24 ± 9 versus 16 of all patients admitted during this period in the ICU (P <0.05). The average stay of patients with bacteremia was 39 ± 25 versus 8 days of all patients (P <0.01). Seventy-two percent of patients with bacteremia developed septic shock. The type of bacteremia: primary 35%: bacteremia/100 patients rate: 1.98; secondary 65%: bacteremia/100 patients rate: 3.68 (respiratory 25%, abdominal 19%, urinary 5%, skin 5%, CNS 2%, catheter 9%: bacteremias/1,000 VCC rate: 0.8). Seventyeight percent were multidrug-resistant microorganisms. Mortality of patients admitted was 16% versus 40% overall mortality in patients with bacteremia (P <0.01). Bacteremia was the direct cause of death of the patient in 27% of cases. Mortality with adequate empirical treatment was 8.2% versus 52% with inadequate treatment (P <0.01). No patient died of bacteremia drug-sensitive organisms. Conclusions Nosocomial bloodstream infections in the ICU make a major impact, with a high percentage of patients with septic shock, high morbi-mortality and hospital stay. Multidrug-resistant microorganisms played an important role in these results. It is necessary to optimize the control measures of the RBC and other devices, minimizing the multidrug-resistant microorganisms as well as empirical treatment protocols with broad-spectrum antibiotics. Reference 1.
Burke JP: Infection control. N Engl J Med 2003, 348:651-655.
P211 Delayed ICU admission with community-acquired severe sepsis greatly increases mortality and resource use A Shorr1, Y Choe2, W Linde-Zwirble3 1 Washington Hospital Center, Washington, DC, USA; 2Eisai Inc., Woodcliff Lake, NJ, USA; 3ZD Associates LLC, Perkasie, PA, USA Critical Care 2011, 15(Suppl 1):P211 (doi: 10.1186/cc9631) Introduction While many severe sepsis (SS) patients go to the ICU on hospital admission, others with community-acquired infection (CAI) either progress to SS later in the hospitalization or are not considered
S74
severely ill on admission. The proportion of SS cases falling into these two groups is not known, and their outcomes are not well described. Methods We identified all adult hospitalizations in the 2008 Premier database that had an ICD-9-CM code for SS (995.92, 785.52), a CAI, and who entered the hospital through the ED (for example, not transferred from another hospital). Patients were characterized by the sequence of ICU and floor care, the number of antibiotic classes (AbxC) on day 1, and the duration of floor stay before ICU admission. We assessed resource use via length of stay (LOS) and total cost. We also examined hospital mortality. Results The cohort included 33,059 discharges (49.1% male, mean age 69.0 years), of whom 17,690 (53.5%) were admitted to the ICU at hospital presentation. Mortality in direct to ICU subjects equaled 31.2%, and these patients had an average LOS of 12.0 days with a mean cost of $30,174, with only 22.8% given a single AbxC. Those admitted to the floor initially (46.5%) had a similar LOS (11.7 days) and mortality (31.1%) but had lower mean costs ($22,728) and nearly half (49.3%) had a single AbxC. Of these initial floor patients, those that were never admitted to the ICU (28.0% of all cases) had the shortest stay (7.6 days), lowest cost ($11,753), and lowest mortality (24.2%) with 44.3% receiving a single AbxC on day 1. Those starting on the floor and later transferred to the ICU (18.4% of all cases) had the longest stay (17.7 days), highest cost ($39,332) and highest mortality (41.5%), and were most likely to have a single AbxC on day 1 (56.8%). Even those admitted to the ICU after 1 day on the floor (3,179, 52.1% of delayed ICU cases) had higher mortality (36.0%) than those starting in the ICU (P <0.0001). Mortality increased with longer delays before ICU admission (40.7%, for a 2-day delay (14.1% of delayed cases) and 50.3% for those with a 3-day or more delay (33.8% of delay cases)). Conclusions SS patients with CAI admitted to the floor and later transferred to the ICU are a major fraction of all SS cases and have the worst outcomes. While many may have developed organ dysfunctions later in the hospitalization, nearly two-thirds were admitted to the ICU after just 1 or 2 days on the ward, indicating that they may have been mis-triaged. Interventions to better identify and aggressively treat these cases may improve outcomes. P212 Septic shock in a cohort of patients from the northeast of France: a preliminary epidemiological study, EPISS group J Quenot1, A Pavon1, C Binquet2, F Kara3, O Martinet4, JC Navellou5, D Barraud6, J Cousson7, JF Poussel8 1 University Hospital Bocage, Dijon, France; 2Faculté de Médecine, Dijon, France; 3Centre Hospitalier, Haguenau, France; 4Nouvel Hôpital Civil, Strasbourg, France; 5Centre Hospitalier Universitaire, Besancon, France; 6 Hôpital Central, Nancy, France; 7Centre Hospitalier, Intensive Care, Reims, France; 8Centre Hospitalier, Intensive Care, Metz, France Critical Care 2011, 15(Suppl 1):P212 (doi: 10.1186/cc9632) Introduction Incidence of septic shock in France ranges from 8 to 10% among patients admitted to intensive care. Mortality at 28 days is 55 to 60% [1]. We aimed to investigate epidemiology, treatment and mortality of patients with septic shock further to the Surviving Sepsis Campaign international guidelines [2]. Methods A prospective, multicentre, observational cohort study supported by the Collège Interrégional des Réanimateurs du Nord-Est (CIRNE) including 14 ICUs in 10 university or nonacademic hospitals. Inclusion criteria were: patients presenting with documented/ suspected infection requiring initiation of vasopressor amines despite adequate vascular filling, with at least one of the following hypoperfusion criteria: metabolic acidosis (base excess ≥5 mEq/l or alkaline reserve <18 mEq/l or lactate ≥2.5 mmol/l); oliguria/renal insufficiency (<0.5 ml/kg/hour for 3 hours or elevation >50% of baseline creatinine); or hepatic dysfunction (AST or ALT >500 IU/l or bilirubin >20 mg/l (34 μmol/l)). Quality control was performed by the Dijon Clinical Investigation Center (INSERM). Results Mean inclusion was 80 patients/month for all centres. We analysed the first 350 patients with validated files of 876 patients included up to 1 December 2010. Mean age was 69 ± 13 years, 66% men. Indication for admission was medical in 84%. Mean SAPS II score was 60.9 ± 21.8, mean SOFA score at time of shock was 11.7 ± 3.5. Sepsis
Critical Care 2011, Volume 15 Suppl 1 http://ccforum.com/supplements/15/S1
was mainly of pulmonary (45.7%), digestive (19.4%), or urinary (11.1 %) origin, with 23.8% other causes. Sepsis was mainly community-acquired (63.7%) and was documented in 67% (234/350), of which 53.4% were Gram-negative bacilli, 30.3% Gram-positive cocci and 16.3% others. Replacement techniques used were: invasive mechanical ventilation (82.6%), continuous dialysis (31.1%) and discontinuous dialysis (19.7%). Activated protein C was used in 17 patients (5%) and hydrocortisone hemisuccinate in 238 (68.6%). Mortality was 49.1% in intensive care, 58.8% in-hospital. Conclusions Our findings raise hope of improved knowledge of epidemiology and management of septic shock in intensive care patients, and should have a beneficial effect on prognosis. References 1. 2.
Annane D: Am J Respir Crit Care Med 2003, 168:165. Dellinger R: Crit Care Med 2008, 36:296.
P213 Long-term effects of an in-hospital program on sepsis management in the ICU E Ferrari1, G Serafini1, D Trevisan1, L Donno2, L Rinaldi2, M Girardis1 1 Università degli Studi di Modena e Reggio Emilia, Modena, Italy; 2Policlinico di Modena, Italy Critical Care 2011, 15(Suppl 1):P213 (doi: 10.1186/cc9633) Introduction A hospital program named Sopravvivere alla Sepsi nel Policlinico di Modena (www.policlinico.mo.it) started in 2005 with the main objective to improve the survival rate of septic patients by means of continuous education and implementation of a sepsis operative protocol including the activation of a specific consultation by an intensivist and an infectious disease specialist. The aim of this study was to evaluate the long-term effects of this in-hospital program on compliance to treatments indicated by the evidence-based guidelines and on outcome in patients admitted to the ICU with septic shock (SS). Methods In patients admitted with SS to a 10-bed ICU from January 2005 to December 2009 we collected: age, type of admission (medical or surgical), site of infection, SAPS II, 30-day mortality and the application of five resuscitative (blood cultures before antibiotics, antibiotics within
S75
3 hours, source control, adequate fluid resuscitation, SvO2 optimization within 6 hours) and four management interventions (glycemia control, steroid use, rhAPC administration and plateau inspiratory pressure <30 cmH2O) as suggested by the surviving sepsis guidelines. Patients with end-stage liver disease, age <18 years and indications for end-oflife treatment were excluded. Results A total of 129 patients have been evaluated and the number of SS admissions increased from a mean value of 19 patients/year in the period 2005 to 2007 to a value of 36 patients/year in the past 2 years. Age, SAPS II and site of infection were similar throughout the analyzed period whereas the percentage of medical admission increased from 33% to 42% in the past 2 years. Compliance to the five resuscitative interventions improved progressively from 24% in 2005 to 63% in 2007. Subsequently, they came back to values observed at the starting of the project (21% in 2008 and 25% in 2009). Similarly, the adherence to management interventions increased quickly after 2005 (from 14% to 50% in 2006) but decreased to a mean value of 35% in the past 3 years. Immediately after 2005, the observed 30-day mortality rate became lower than that predicted by the SAPS II, but it slightly increased from 31% in 2006 to 48% in 2009. Conclusions The effects of an in-hospital program devoted to severe sepsis and SS management allowed an increase of ICU admissions for sepsis, a better management and an improvement of patients’ survival rate. However, as expected, the adherence to guidelines gradually worsened with a slight increased in mortality rate in the past 2 years. P214 Extending the classification of healthcare-associated bloodstream infection to other main foci: respiratory, urinary and intra-abdominal C Cardoso1, O Ribeiro2, I Aragão1, A Costa-Pereira2, A Sarmento3 1 Hospital de Santo António, Porto, Portugal; 2Faculty of Medicine, University of Porto, Portugal; 3Hospital de São João, Porto, Portugal Critical Care 2011, 15(Suppl 1):P214 (doi: 10.1186/cc9634) Introduction Healthcare-associated infection (HCAI) is a growing phenomena associated with the increase of the outpatient clinical
Figure 1 (abstract P214). Microbiological profile according to the focus of infection.
Critical Care 2011, Volume 15 Suppl 1 http://ccforum.com/supplements/15/S1
care. Friedman in 2002 proposed a new classification for healthcareassociated bloodstream infections, suggesting that they are different from nosocomial and community-acquired infections [1]. The authors extend this classification to other main focus of infection: respiratory, urinary and intra-abdominal. Methods A prospective cohort study (1 year), in five wards of a university hospital, including all consecutive adult patients that met the CDC definition of infection. Only the first episode of infection was characterized. They were classified in community-acquired (CAI), HCAI (using Friedman’s classification [1]) and hospital-acquired (HAI), and data on the host and the infectious episode were collected. Results See Figure 1. We included 1,035 patients: 493 (48%) with CAI, 225 (22%) with HCAI and 317 (31%) with HAI. Conclusions Differences were observed according to the type and focus of infection. These results reinforce the need for this classification and probably the need for specific antibiotic therapy guidelines for this group of patients. Reference 1.
Friedman ND, et al.: Ann Intern Med 2002, 137:791-797.
P215 Healthcare-associated infection: do doctors recognize this group of patients? T Cardoso1, O Ribeiro2, I Aragão1, A Costa-Pereira2, A Sarmento3 1 Hospital de Santo António, Porto, Portugal; 2Faculty of Medicine, University of Porto, Portugal; 3Hospital de São João, Porto, Portugal Critical Care 2011, 15(Suppl 1):P215 (doi: 10.1186/cc9635) Introduction Traditionally infections are divided into community acquired (CAI) or hospital acquired (HAI). The authors study the association between healthcare-associated infections (HCAI) and inappropriate antibiotic therapy and hospital mortality. Methods A prospective cohort study (1 year), in five wards of a university hospital, including all consecutive adult patients that met the CDC definition of infection. They were classified in: CAI, HCAI (using Friedman’s classification [1]) and HAI. A multivariable logistic regression was used with inappropriate antibiotic therapy as the dependent variable and sex, age, previous co-morbidities, type of infection (CAI, HCAI or HAI), severity of infection, SAPS II, total SOFA score, focus of infection, polymicrobial infection, previous antibiotic therapy, positive blood cultures, number of hospitalizations in the previous year and Karnovsky index as independent variables, and a similar model with also inappropriate antibiotic therapy and microbiological diagnosis with hospital mortality as the dependent variable. Results We included 1,035 patients: 493 (48%) with CAI, 225 (22%) with HCAI and 317 (31%) with HAI. HCAI (adjusted OR = 1.905, 95% CI = 1.152 to 3.152) was associated with inappropriate antibiotic therapy. The following variables were associated with hospital mortality: HAI (adjusted OR = 2.095, 95% CI = 1.275 to 3.441), cancer (adjusted OR = 2.768, 95% CI = 1.316 to 5.823), diabetes (adjusted OR = 0.420, 95% CI = 0.228 to 0.775), Karnovsky index (adjusted OR = 0.968, 95% CI = 0.958 to 0.978), SAPS II (adjusted OR = 1.107, 95% CI = 1.085 to 1.128) and inappropriate antibiotic therapy (adjusted OR = 1.663, 95% CI = 1.006 to 2.747). HCAI was not associated with increased hospital mortality (adjusted OR = 0.808, 95% CI = 0.449 to 1.453), although this group of patients had higher SAPS II (median = 30 vs. 28 in the other two groups, P = 0.002), no differences were found regarding median SOFA score or severity of infection. Conclusions HCAI was not associated with increased hospital mortality but it was associated with inappropriate antibiotic therapy, an independent prognostic factor. Doctors might not be sufficiently aware of this new group of patients. Locally driven information campaigns are needed. Reference 1.
Friedman ND, et al.: Ann Intern Med 2002, 137:791-797.
S76
P216 Sustainability of an antimicrobial stewardship program in a community hospital ICU at 3 months post implementation K Walker, J Sauve, J Powis, V Leung, S Gill Toronto East General Hospital, Toronto, Canada Critical Care 2011, 15(Suppl 1):P216 (doi: 10.1186/cc9636) Introduction Our goal was to develop an antimicrobial stewardship program (ASP) and integrate it within a medical/surgical ICU clinical practice. During a 3-month pilot ASP, one pharmacist (Ph) provided clinical service and one antimicrobial (AM) stewardship pharmacist (ASPh) participated in the ICU ASP. Two ASP Phs worked routinely as designated ICU Phms. Post ASP implementation, the ICU Ph added AM stewardship to their role. Methods From 1 April to 30 June 2010, a pilot ASP was implemented in a 490-bed urban community hospital ICU on weekdays. The pilot ASP goals were to optimize/reduce AM usage, improve clinical outcomes and reduce nosocomial C. difficile infection rates [1]. The ASPh collected information on ICU patients receiving an AM on a standardized data collection tool. Identified patients were reviewed with the infectious disease (ID) physician, then the ASPh and ID physician met with the ICU care team to discuss ways to optimize AM use. After the pilot ASP, this process was reduced to 3 weekdays and conducted by the ICU Ph, eliminating the ASP Ph involvement. The same metrics used in the pilot program were collected for a 3-month follow-up period [2]. Results The pilot ASP resulted in a 47.7% reduction in AM cost from $58,544 (1 April to 30 Jun 2009) to $30,627 (1 April to 30 June 2010). The AM cost in the 3-month post-ASP period (1 July to 30 September 2010) was $22,010. No new cases of nosocomial C. difficile infections were identified during the pilot period. Based on an average of 1.4 cases/1,000 patient-days, two cases were expected during the pilot duration. The post-pilot period observed 0.42 cases/1,000 patientdays. The pilot ASP showed a 38.9% reduction of broad-spectrum antipseudomonal AM usage as compared with the same time period of the previous year and a 28.5% reduction in the 3-month post-ASP period. No changes were noted in the Multiple Organ Dysfunction Score or mortality in the pilot and post-pilot groups as compared with the same time period of the previous year. Conclusions The ICU Ph developed the skills required through participation in the pilot ASP program and integrated it within their daily ICU practice. The post-ASP period showed sustained reductions in AM use, costs and nosocomial C. difficile rates. References 1. 2.
Dellit TH, et al.: Clin Infect Dis 2007, 44:159-177. Polk RE, et al.: Clin Infect Dis 2007, 44:664-670.
P217 Attention to electronic prescription process improves time to first-dose antibiotics in patients on the ICU R Wan1, D Gonzalez Bermejo2, S Moore3, C Whiteley1, C Mckenzie1, A Jones1 1 Guy’s & St Thomas’ NHS Foundation Trust, London, UK; 2La Paz University Hospital, Madrid, Spain; 3Kings College Medical School, London, UK Critical Care 2011, 15(Suppl 1):P217 (doi: 10.1186/cc9637) Introduction Effective timely antibiotic administration is associated with increased survival to discharge in patients with septic shock [1]. Time to antibiotic administration was the strongest predictor of outcome and is a key recommendation in sepsis management [2]. However, implementation faces barriers at clinician, patient and environmental levels [3]. Methods A retrospective review of antibiotic prescribing on a 30-bed university medical–surgical ICU. Data were extracted from the clinical informatics system (Intellivue Clinical Portfolio (ICIP) Philips). For a 4-month period (baseline assessment September 2009 to January 2010), patients initiated on new intravenous antibiotics were included. After baseline data review, the ICIP prescription order process was modified to automatically include STAT doses. A further 4-month period (post implementation) review followed.
Critical Care 2011, Volume 15 Suppl 1 http://ccforum.com/supplements/15/S1
Results At baseline, 139 patients and 320 prescriptions were analysed. Median time to antibiotic administration was 127 minutes (IQR 29 to 272). The proportion of antibiotics administered within 1 hour and 3 hours was found to be 81/320 (25%) and 193/320 (60%), respectively. Analysis by antibiotic class revealed aminoglycosides and vancomycin had the lowest median time that in our unit are initiated as STAT doses, 86 minutes (IQR 43 to 195 minutes). Post modification of the ICIP prescription order process, 139 patients and 194 prescriptions were analysed. Median time to antibiotic administration improved to 79 minutes (IQR 43 to 159), P <0.0001. A greater proportion was administered within 1 hour (70/194, 37%) and 3 hours (153/194, 79%), P ≤0.001, for this cohort. Conclusions Barriers to timely administration of antibiotics exist, an intervention shown to significantly improve patient outcome. This study demonstrates modification of an electronic prescribing order process contributes to improved performance. However, a multifactorial problem may exist. It confirms clinical informatics systems play in improving the delivery of quality patient care in the ICU. References 1. 2. 3.
Kumar A, et al.: Crit Care Med 2006, 34:1589-1596. Dellinger RP, et al.: Crit Care Med 2008, 36:296-327. Cabana MD, et al.: JAMA 1999, 282:1458-1465.
P218 An audit of antibiotic dosing according to renal function or renal replacement therapy in critical care KD Donnelly, KD Smith, JJ Coleman, D Westwood, AN Billington UHB Trust, Birmingham, UK Critical Care 2011, 15(Suppl 1):P218 (doi: 10.1186/cc9638) Introduction An audit of antibiotic dosing was conducted over the four critical care units at University Hospital Birmingham. The prescribed dose of four antibiotics (co-amoxiclav, meropenem, tazocin and ciprofloxacin) was audited against local prescribing guidance based on renal function and use of renal replacement therapy (RRT). Methods The electronic prescribing system was interrogated for all prescriptions of the intravenous (i.v.) form of the antibiotics during 2009. Antibiotic, dose and frequency, estimated glomerular filtration rate (eGFR), prescriptions of diasylate solution (indicating RRT), and number of administrations were recorded. One-off prescriptions and those without recent eGFR were discarded. A total of 2,472 records were included. Prescriptions were grouped by unit and antibiotic, then by renal function (normal, mild, moderate or severe impairment) or RRT, and by one of four categories (appropriate, underdosing, overdosing or incorrect regimen). Results Of the 2,472 prescriptions, 2,004 (81.1%) were correctly prescribed with regards to renal function and RRT. The total numbers of prescriptions per antibiotic are as follows: coamoxiclav (631 prescriptions, of these 94.9% correct), ciprofloxacin (282, 98.9%), tazocin (696, 80.6%) and meropenem (863, 65.6%). On Unit 3, tazocin was underdosed in cases of normal renal function (15.2% of their ward’s prescriptions with regard to that antibiotic; median administrations 3, range 1 to 15), and during RRT (6.5%; 6, 0 to 29). On Unit 4, tazocin was underdosed during mild renal failure (7.0%; 9, 2 to 81) and during RRT (7.7%; 10, 3 to 30). Meropenem was overdosed during RRT on Unit 1 (6.1%; 4, 0 to 30), Unit 3 (20%, 15, 1 to 38) and Unit 4 (13%; 15, 1 to 31), and underdosed during RRT on Unit 4 (17.9%; 7.5, 1 to 28). Conclusions Tazocin was frequently underdosed in this critically ill population. It is possible that the minimum inhibitory concentration was not reached in some patients, with the associated risk of treatment failure [1,2]. Meropenem was underdosed on one unit; however, overdosing was more common. The clinical significance of this is equivocal as raised peak levels can be advantageous [3]. The electronic prescribing system currently lacks renal dosing decision support; this audit suggests a potential benefit to the integration of antibiotic prescribing guidelines. References 1. 2. 3.
Arzuaga A, et al.: J Clin Pharmacol 2005, 45:168-176. Valtonen M, et al.: J Antimicrob Chemother 2001, 8:881-885. Giles LJ, et al.: Crit Care Med 2000, 28:632-637.
S77
P219 De-escalation of antimicrobial therapy in Gram-negative sepsis: easier said than done? L Phee1, N Gordon2, M Hornsey2, D Wareham2 1 Barts and The London NHS Trust, London, UK; 2QMUL, London, UK Critical Care 2011, 15(Suppl 1):P219 (doi: 10.1186/cc9639) Introduction Appropriate and timely de-escalation of antimicrobial therapy has long been recognised as an important element in the optimal management of sepsis. When a causative pathogen has been isolated and its susceptibility profile known, the most suitable single therapy should be instituted to prevent the development of superinfection with pathogenic or resistant organisms, as well as reduce toxicity and costs. Methods All blood cultures analysed on the BD BACTEC system were evaluated over a 6-week period (17 April 2010 to 30 May 2010). Organisms in positive blood cultures were then further identified by MALDI-TOF mass spectrometry (Brucker) and susceptibility testing was performed using the MicroScan WalkAway system (Siemens). The demographics, treatment regimens and clinical outcomes of all episodes of clinically significant Gram-negative bacteraemia were prospectively audited. Results Two hundred and seventy sets of blood cultures were positive during our study period, representing 246 individual bacteraemic episodes. A total 143/270 were considered contaminants, 42/270 were significant Gram-positive bacteraemias, 1/270 Candida albicans, and 84/270 Gram-negative bacteraemia. Of the latter, 70 were individual episodes, of which two died prior to susceptibility results being available. Of the survivors, following knowledge of the susceptibility profile, only 20.5% (14) were de-escalated to a narrower-spectrum agent and only 31% (21) were converted to suitable oral agents when practical. Twelve per cent (10) were treated with combination therapies even though single agents remained highly active. Of the group that failed to de-escalate antimicrobial therapy (54 patients), the 30-day mortality rate was 9% (5/54) versus 7% (1/14) in the group (14 patients) that adhered to the surviving sepsis guidelines. Likewise, the former group were more likely to develop diarrhoea, 38% (21/54) versus 21% (3/14), with three patients positive for Clostridium difficile toxin in the former group (none in the latter). Multidrug-resistant organisms and fungal colonisation occurred more frequently in the first group – 38% (21/54) and 22% (12/54) versus 21% (3/14) and 0% (0/14), respectively. Conclusions Surviving sepsis guidelines have reiterated the need for timely use of appropriate empirical antimicrobials as well as the importance of de-escalation of therapy when the causative agent has been identified. However, as is the case in our study, this has not always been the prevailing practice. Many factors underlie this deviation from recommended guidelines, including worsening clinical condition, reported penicillin allergy as well as multiple co-morbidities.
P220 Impact of the adequacy of antibiotic therapy on the outcome of ventilator-associated pneumonia J Goncalves-Pereira1, T Sequeira2, B Moya3, T Cardoso4, N Catorze5 1 Hospital Sao Francisco Xavier, Lisboa, Portugal; 2Hospital Sao Jose, Lisboa, Portugal; 3Hospital Sao Bernardo, Setubal, Portugal; 4Hospital Santo António, Porto, Portugal; 5Centro Hospitalar Médio Tejo, Abrantes, Portugal Critical Care 2011, 15(Suppl 1):P220 (doi: 10.1186/cc9640) Introduction The aim was to assess the impact of empiric antibiotic adequacy on ICU outcome of patients with ventilator-associated pneumonia (VAP), the reasons for inadequacy and risk factors for potential multidrug-resistant organisms. Methods During a 24-month period a multiple-centre observational study was conducted in five ICUs. Adult patients with documented VAP were segregated for analysis. Empiric antibiotic therapy was classified as adequate or inadequate according to in vitro efficacy against all isolated bacteria. The day of ICU discharge or death was recorded. Comparison between survivors and nonsurvivors was performed. Infection with potential multidrug-resistant organisms
Critical Care 2011, Volume 15 Suppl 1 http://ccforum.com/supplements/15/S1
(methicillin-resistant Staphylococcus aureus, Pseudomonas aeruginosa, Acinetobacter baumanii or Stenotrophomonas maltophilia) was evaluated for therapeutic inadequacy, ICU length of stay before diagnosis and previous use of antibiotics. Results One hundred and twenty-three patients with VAP (age 62.7 ± 16.9 years, 65.9% men, and SAPS II 49.5 ± 15.5) were identified. Empiric antibiotic therapy was adequate in 65.9%. These patients’ ICU mortality was significantly lower in comparison with those with inadequate therapy (28.4% vs. 45.2%, P = 0.049). Patients infected with a potential multidrug-resistant organism were more likely to receive inadequate antibiotic therapy (80.1%, P = 0.001), and to have had longer previous ICU stay (11.5 days vs. 7.2 days, P = 0.005), but there was no difference in the previous use of antibiotics (65.2% vs. 50%, P = 0.102). Conclusions An empiric adequate antibiotic therapy was associated with a lower mortality rate in VAP. Multidrug-resistant organisms were significantly associated with therapeutic inadequacy and longer ICU length of stay.
P221 Aetiology of pneumonia in the ICU: the need for early Gram-negative cover A Khanna1, H Al-shather1, M Chawla2, R Gibbs1 1 Musgrove Park Hospital, Somerset, UK; 2Nottingham City Hospital, Nottingham, UK Critical Care 2011, 15(Suppl 1):P221 (doi: 10.1186/cc9641) Introduction Pneumonia remains one of the commonest infectious causes of intensive care unit (ITU) admissions. Despite recent advances, mortality in the ITU from this diagnosis remains around 50% [1]. Early targeted antibiotic therapy to minimise the development of ventilatorassociated pneumonia is recommended [2]. This requires an updated knowledge of aetiology of this common diagnosis in ITU settings. Methods We conducted a retrospective cohort study into 200 consecutive admissions to our ITU with coded diagnosis of pneumonia. Baseline patient characteristics microbiological diagnosis, disease severity and mortality outcomes were studied. Results The average patient age in this cohort was 58 years (range 11 to 90 years). The male to female ratio was 1.35:1. All of the patients were admitted to ITU within 48 hours of their hospital admission, mainly due to worsening respiratory failure. Out of the total of 200 cases, microbiological isolates were identified in 110 (55%). Eighty-five isolates were deemed likely to be pathogenic (42.5%) while 25 (12.5%) were likely to be the result of antibiotic use (candida and coliforms species in sputum). Gram-negative bacteria were responsible for 50.9% isolates. Streptococcus pneumoniae remained the single most common isolate (28/110; 25.4%). Pseudomonas species (23/110; 20.9%) and Haemophilus influenzae (11/110; 10%) were the second and third most common isolates. Pseudomonas infection was more often associated with advanced age and existing lung pathology. Staphylococcus aureus was isolated in 8.1% (9/110) with one confirmed as methicillin resistant (MRSA). Atypical organisms (Legionella 2.7%, mycoplasma spp. 0.9%) and fastidious organisms (Stenotrophomonas maltophilia 2.7%) were also isolated. Other organisms isolated included enterobacter cloacae, Citrobacter koseri, Streptococcus Group A, Haemophilus parainfluenzae, Moraxella catarrhalis and Kleibsella species. Mortality amongst our patients was 28.5% (57/200). This was comparable with previously published findings. Conclusions Whilst the aetiology of pneumonia in our cohort is similar to that previously reported [3], the incidence of Gram-negative organisms is much higher. This, if reconfirmed, may have important implications in designing targeted antibiotic therapy for pneumonia in ITU settings. References 1. 2. 3.
Lim WS, et al.: Thorax 2009, 64(Suppl III):iii1–iii55. Craven DE, et al.: Clin Infect Dis 2010, 51(Suppl 1):S59-S66. Emmi V, et al.: Infez Med 2005, Suppl:7-17.
S78
P222 Respiratory failure in cancer patients with influenza A (H1N1) is associated with poor prognosis E Snyder, M Cardenas-Turanzas, C Perego, R Erfe, RC Chemaly, KP Price, JL Nates The University of Texas MD Anderson Cancer Center, Houston, TX, USA Critical Care 2011, 15(Suppl 1):P222 (doi: 10.1186/cc9642) Introduction During the spring of 2009, the influenza A (H1N1) virus emerged, resulting in an estimated 12,000 deaths in the United States. We aimed to describe the critically ill patients with cancer who developed 2009 H1N1 in a comprehensive cancer center. Methods We conducted an observational study of patients >17 years of age with confirmed infection from 1 June 2009 to 30 April 2010. Data collected included demographics, clinical characteristics and outcomes. Results A total of 9/2,629 adult patients (0.3%) admitted to the ICU were diagnosed with 2009 H1N1 influenza. Six patients were female, patient age ranged from 43 to 77 and all had hematological cancers. The ICU mortality rates were 16% for all-cause admissions and 78% for 2009 H1N1cases. The most frequent co-morbidities were obesity and hypertension. Eight patients were diagnosed with bilateral pneumonia. The median hospital length of stay (LOS) was 28 days (range 9 to 45) and ICU LOS was 8 days (range 2 to 31). The ventilation course of the nonsurvivors was characterized by progressive hypoxemia. At admission, 67% of patients had a PaO2/FiO2 less than 200; at day 7, 71% of patients, and at day 14, 100% of patients. The nonsurvivors (seven patients) received respiratory care by a range of ventilation mechanisms: patients received non-invasive mechanical ventilation, were intubated, and then utilized one or a combination of bilevel, pressure control and pressure support ventilation. One patient used high-frequency ventilation. Invasive ventilation lasted a median of 7 days (range 4 to 23). The survivors (two patients) received only supplemental oxygen. All patients were treated with antiviral medications and antibiotics. Four patients died from cardiac arrest and three patients died following life support therapy withdrawal. All nonsurvivors had DNR orders in place at death. Conclusions At our center, the ICU mortality due to the 2009 H1N1 influenza was remarkably higher than that observed in patients with cancer without this infection. However, the number of patients developing the infection and requiring critical care was smaller than expected if considering we care for a population of patients with a high prevalence of immune suppression.
P223 Hemodynamic and echocardiographic characteristics in severe novel influenza A (H1N1) pneumonia P Theerawit, Y Sutherasan, T Hongpanat, C Kiatboonsri, S Kiatboonsri Ramathibodi Hospital, Bangkok, Thailand Critical Care 2011, 15(Suppl 1):P223 (doi: 10.1186/cc9643) Introduction Even though we found a small proportion of patients with severe H1N1 pneumonia developed multiple organ failure, hemodynamic characteristics are beneficial for optimizing treatment. We thus studied hemodynamics including echocardiographic findings in severe H1N1 influenza pneumonia in a single center. Methods All hemodynamic data were collected from severe H1N1 pneumonia patients admitted to the ICU during year 2009 to 2010. H1N1 infections were confirmed by the RT-PCR technique. These positive results were obtained from respiratory tract specimens. Results We enrolled 18 severe pneumonia patients in this study. The mean arterial pressure was 82.62 ± 13.01 mmHg. Thirteen patients were measured for cardiac output (CO) by thermodilution method whereas the remaining cases were measured by echocardiogram. The average CO in the all patients was 5.81 ± 2.49 l/minute. The mean pulmonary artery pressure was 28.77 ± 7.83 mmHg. The central venous pressure and pulmonary capillary wedge pressure (PCWP) were 12.2 ± 3.56 and 15.46 ± 5.22 mmHg, respectively. The SVRI and PVRI were 1,448 ± 457.10 and 293 ± 168.13 dynes•second/cm5/m2. The CO
Critical Care 2011, Volume 15 Suppl 1 http://ccforum.com/supplements/15/S1
was higher in ARDS patients than in non-ARDS pneumonia (6.98 ± 2.25 vs. 3.86 ± 0.69, P = 0.002). The PCWP in ARDS patients was 16.08 ± 4.93 that was higher than in the non-ARDS group (11.82 ± 1.01), but no statistical significance was demonstrated. The ejection fraction (EF) was measured in 14 patients. The average EF was 59.79 ± 12.87%. There was only one patient having EF less than 30%. There was no statistic significance found in the EF between the ARDS and non-ARDS groups. The E/a ratio and E/E’ were 1.29 ± 0.49 and 8.67 ± 2.25, respectively. Conclusions The novel influenza A (H1N1) severe pneumonia resulted in high CO in the ARDS group. The PCWP in these patients was also higher than that in non-ARDS patients. Due to almost all patients having good left ventricular contraction, the etiology of higher PCWP in ARDS patients might result from some degree of high-output cardiac dysfunction. Thus diuretics may have an important role to improve impaired gas exchange in these patients caused by this severe viral pneumonia with ARDS. References 1.
2.
Perez-Padilla R, de la Rosa-Zamboni D, Ponce de Leon S, et al.: Pneumonia and respiratory failure from swine-origin influenza A (H1N1) in Mexico. N Engl J Med 2009, 361:680-689. Ukimura A, Izumi T, Matsumori A: A national survey on myocarditis associated with the 2009 influenza A (H1N1) pandemic in Japan. Circ J 2010, 74:2193-2199.
P224 Gram-positive nosocomial infections in a general ICU: emerging new clues S Milanov, G Georgiev, V Todorova, M Milanov Pirogov Emergency Institute, Sofia, Bulgaria Critical Care 2011, 15(Suppl 1):P224 (doi: 10.1186/cc9644) Introduction Gram-positive aerobes are currently the leading cause of infection in many ICUs. Despite this trend, there are still no firm recommendations for empiric Gram-positive antimicrobial coverage in patients with severe nosocomial infections. The current study is an extension of our previous work in this field, aiming to challenge some of the earlier trends and to bring out new clues. Methods A prospective observational study was conducted including all episodes of documented nosocomial infection in a general ICU for a 4-year period (2006 to 2009). Data on demographics, primary diagnosis, co-morbidity, number of indwelling devices, previous microbial isolates and current antibiotics were cross-tabulated according to the presence and type of Gram-positive pathogens. For the identified most likely risk factors, separate contingency tables were constructed and analyzed. Results A total of 339 patients with Gram-positive isolates were identified (51.21% of 662). Gram-positive isolates were more prevalent in patients with obesity (1.27; CI = 1.08 to 1.47) and diabetes (1.28; CI = 1.03 to 1.53). The following independent risk factors for Grampositive nosocomial infections (RR and 95% CI) were identified: MRSEgunshot wound (4.18; 2.35 to 5.19), stab wound (4.01; 2.03 to 4.59), polytrauma (1.91; 1.47 to 2.46), previous isolation of both Acinetobacter spp. and Pseudomonas or Candida spp. (2.01; 1.38 to 2.72 and 2.72; 1.71 to 4.21), treatment with aminoglycoside or carbapenem (2.52; 1.59 to 3.42 and 1.37; 1.03 to 1.80); Enterococcus – billiary peritonitis (2.23; 1.27 to 3.73), acute necrotizing pancreatitis (2.23; 1.27 to 3.73), traumatic lesion of urinary bladder with cystostomy (6.68; 3.26 to 9.65), previous isolation of both Klebsiella and Candida spp. (6.02; 1.85 to 9.40), treatment with cefoperazone + sulbactam or third-generation cephalosporin (3.49; 2.18 to 5.34 and 1.87; 1.17 to 2.92); MRSA – clinical uroinfection (5.27; 1.74 to 13.52), previous isolation of both Acinetobacter and Pseudomonas spp. (4.21; 1.79 to 9.42); MSSE – treatment with first/ second/third-generation cephalosporin ± metronidazole (5.88; 1.84 to 17.16 and 4.65; 1.71 to 12.18); Streptococcus – pelvic inflammatory disease (5.10; 1.35 to 15.75), soft tissue infection (8.32; 2.73 to 45.36), treatment with quinolones (3.45; 1.34 to 8.54). Conclusions New light was shed on the identification of associated risk factors for Gram-positive nosocomial infections in our ICU. Sufficient data were gathered to aid empirical antibiotic choice in such high-risk patients.
S79
P225 Prevalence of Gram-negative bacilli resistance in adult critically ill patients at admission screening D Kotwinski, R Batra, T Olga, J Edgeworth, D Wyncoll, M Shankar-Hari King’s College London & Guy’s and St Thomas’ NHS Foundation Trust, London, UK Critical Care 2011, 15(Suppl 1):P225 (doi: 10.1186/cc9645) Introduction Nosocomial infections in critically ill patients are increasing and they are often due to multidrug-resistant Gram-negative bacilli (GNB). Emerging resistance in common nosocomial pathogens is usually related to local antibiotic use. Gentamicin is the first-line empiric antibiotic for hospital-acquired infections in St Thomas’ Hospital ICUs. No decontamination therapy for GNBs is employed, but rectal and nose swabs are routinely taken from patients on admission to screen for resistance in GNB. This informs the choice of antimicrobial therapy in the event of nosocomial infection during the patient’s stay. We describe antibiotic resistance rates in GNB isolates at admission in critically ill adult patients over 8 years. Methods An 8-year retrospective observational cohort study using prospectively collected data in a 30-bed referral ICU. Patients: The cohort inclusion criterion was defined as patients admitted to the ICUs at St Thomas’ Hospital and remaining in the ICU for more than 24 hours. In addition, the cohort inclusion was restricted to the first admission from each patient over the 8-year period where the length of stay was greater than 24 hours and the admission screen had been conducted within the first 2 days of admission. GNB screening: In patients admitted to the ICU, rectal and nose swabs were sent at admission for microbiological evaluation antibiotic resistance in GNB. Results Of the 8,095 ICU admissions, 4,753 patients satisfied the inclusion criteria. The case-mix characteristics and outcome did not show any statistically significant difference during the study period. Overall, the number of patients presenting with gentamicin-resistant GNBs on admission has remained stable, although time trends depend on the bacterial genus considered (9.3% in 2002 to 8.4% in 2009). Hospital-associated (ICU admission >48 hours following hospital admission) gentamicin resistance in GNB has fallen (14.8% in 2002 to 8.3% in 2009). Patients with a positive admission screen are more likely to have the same resistant genus isolated from a nosocomial infection during the same admission spell, as compared with those negative on admission. Conclusions Screening for GNB resistance guides empiric antibiotic therapy. P226 Risk factors to bloodstream infection due multidrug-resistant Acinetobacter baumanni in colonized patients in the ICU R Passos, S Ultchak, P Mota, AV Mendes, M Souza, RH Oliveira, PB Batista Sao Rafael, Sao Rafael, Brazil Critical Care 2011, 15(Suppl 1):P226 (doi: 10.1186/cc9646) Introduction Epidemic outbreaks caused by multidrug-resistant Acinetobacter spp. (MDR Aspp) in ICUs have emerged in recent years. The incidence of MDR Aspp bacteremia, which develops as a result of colonization, is increasing through widespread dissemination of the pathogen and may cause severe clinical disease that is associated with a high mortality. The aim of the study was to evaluate risk factors for MDR Aspp bacteremia in patients colonized with MDR Aspp in the ICU. Methods We conducted a prospective, observational study of all patients colonized with MDR Aspp in the ICU between January 2007 and December 2010. Screening for MDR Aspp (using axillary, oropharynx and rectal swabs) was performed weekly. Only the first bacteremia was considered. Results Of the 185 patients colonized with MDR AB, 74 developed MDR Aspp bacteremia. APACHE II and SOFA scores were higher in bacteremic than nonbacteremic patients at the time of ICU admission (22 vs. 16; P = 0.015, 16 vs. 9; P <0.001, respectively). There was no difference between the two groups in the duration of time from ICU admission to colonization (8.2 vs. 7.8 days; P = 0.923). In univariate analysis, advanced age, admission for clinical reason, use of broad-spectrum antibiotic agents, total parenteral nutrition, having a central venous
Critical Care 2011, Volume 15 Suppl 1 http://ccforum.com/supplements/15/S1
catheter, endotracheal tube, arterial catheter or nasoenteral tube and acute renal failure requiring dialysis were significant risk factors for bacteremia (all P <0.05). In multivariate analysis, the number of recent invasive procedures (OR, 4.17; 95% CI, 1.6 to 11.1; P = 0.001) and previous administration of carbapenem (OR, 2.07; 95% CI, 1.47 to 2.91; P = 0.036) were independently associated with MDR Aspp bacteremia. Conclusions Our results suggest that the nosocomial occurrence of MDRAspp bacteremia in colonized patients is strongly related to the number of invasive procedures and may be favored by the selection pressure of previous carbapenem administration. P227 Blood cultures at central line insertion: a comparison with peripheral venipuncture S Stohl1, S Benenson2, S Sviri2, C Block2, C Sprung2, P Levin2 1 Children’s Hospital of Philadelphia, PA, USA; 2Hadassah Hebrew University Medical Center, Jerusalem, Israel Critical Care 2011, 15(Suppl 1):P227 (doi: 10.1186/cc9647) Introduction The objective was to compare contamination rates of blood cultures obtained at central line (CVC) insertion with cultures obtained at peripheral venipuncture or arterial line (AL) insertion. Contamination of blood cultures adds to cost, length of hospital stay, and unnecessary antibiotic administration. As most contaminants come from patients’ skin, obtaining blood cultures after skin disinfection and under strict sterile precautions during CVC insertion might reduce contamination rates. Methods A retrospective analysis of all blood cultures taken in the general and medical ICUs of a tertiary academic hospital over 8 years. Positive blood cultures were categorized as growing contaminants (Bacillus species, Corynebacterium species, Propionibacterium species, non-pneumococcal α-hemolytic Streptococci, and single-culture isolates of coagulase-negative Staphylococci), or true pathogens (all other results). Results of CVC insertion cultures were compared with peripheral venipuncture and AL insertion cultures. Results A total of 17,384 blood cultures including 3,389 (19.5%) CVC, 1,844 (10.6%) AL and 12,151 (69.9%) peripheral cultures were analyzed. CVC insertion cultures were contaminated more frequently than AL or peripheral cultures (455/3,389 (13.4%) CVC, 103/1,844 (5.6%) AL, and 755/12,151 (6.2%) peripheral cultures, P <0.001 CVC vs. peripheral and CVC vs. AL). However, true pathogens were found more frequently in CVC insertion cultures (445/3,389 (13.1%) CVC, 192/1,844 (10.4%) AL and 1,112/12,151 (9.2%) peripheral cultures, P <0.001 CVC vs. peripheral and CVC vs. AL). The contamination and true positive rates for each source were almost identical in each ICU. Although there was a general decrease in culture contaminants over 8 years, the proportion of contaminants in CVCs remained approximately double that found in peripheral cultures at all time points. Conclusions In complete contrast to the expected findings, and despite superior sterile precautions, cultures taken at CVC insertion had a higher contamination rate than either peripheral or AL blood cultures. These data were consistent in two completely independent ICUs and in cultures obtained over 8 years. The higher contamination rate may be related to the increased skin and soft tissue manipulations performed during CVC insertion. The higher true positive rate in CVC insertion cultures may indicate that these cultures retain utility.
S80
been found [1,2]. Different guidelines for the prevention of CRBSI recommend avoiding femoral venous access sites [3,4]. However, the incidence of CRBSI in subclavian sites in the presence of tracheostomy is higher than without tracheostomy [5,6]. In addition, the incidence of CRBSI in jugular sites with tracheostomy is higher than in femoral sites [7]. Currently, there are no comparative data on the incidence of CRBSI between the femoral venous and the subclavian venous catheter site in the presence of tracheostomy and there are no recommendations in the guidelines relating to this circumstance; and this was the objective of the present study. Methods A prospective observational 6-year study was carried out in the ICU of the University Hospital of the Canary Islands (Tenerife, Spain). We included all patients undergoing insertion of subclavian venous catheter in the presence of tracheostomy (subclavian-CVC+tracheo) or femoral venous catheter (femoral-CVC). Results We diagnosed 26 CRBSI in 313 femoral-CVC during 2,565 days (10.1 CRBSI episodes/1,000 catheter-days) and five CRBSI in 147 subclavian-CVC+tracheo during 1,268 days (3.9 CRBSI episodes/1,000 catheter-days). Subclavian-CVC+tracheo showed a lower incidence of CRBSI than femoral-CVC (OR = 0.39; 95% CI = 0.001 to 0.91; P = 0.03). Survival analysis showed that subclavian-CVC+tracheo had greater CRBSI-free time than femoral-CVC (chi-square = 4.69; P = 0.03). Conclusions Subclavian-CVC+tracheo could be considered a safer venous access site than femoral-CVC to minimize the risk of CRBSI. References 1. 2. 3. 4. 5. 6. 7.
Merrer J, et al.: JAMA 2001, 286:700-707. Lorente L, et al.: Crit Care 2005, 9:R631-R635 O’Grady NP, et al.: MMWR 2002, 1:1-29 Marschall J, et al.: Infect Control Hosp Epidemiol 2008, 29:S22-S30 Garnacho-Montero J, et al.: Intensive Care Med 2008, 34:2185-2193 Lorente L, et al.: Eur J Clin Microbiol Infect Dis 2009, 28:1141-1145 Lorente L, et al.: Infect Control Hosp Epidemiol 2010, 31:311-313.
P229 Polyhexanide anti-infective coating of central venous catheters in prevention of catheter colonization and bloodstream infection: Study HC-G-H-0507 I Krikava1, M Kolar2, B Garajova1, T Balik2, A Sevcikova1, J Pachl2, P Sevcik1, R Trubac3 1 University Hospital Brno, Czech Republic; 2University Hospital Kralovske Vinohrady, Prague, Czech Republic; 3B. Braun Medical s.r.o., Prague, Czech Republic Critical Care 2011, 15(Suppl 1):P229 (doi: 10.1186/cc9649) Introduction Internal and external anti-infective coating of central venous catheters (CVCs) may reduce the rate of catheter colonization (CC) and bloodstream infection (BSI) [1]. Our objective was to evaluate the efficacy of a protective nonleaching polyhexanide coating on the rate of CC and BSI in ICU settings. Methods A prospective, randomized, controlled, double-blind clinical trial was performed on multidisciplinary ICUs of two university hospitals in the Czech Republic between 2005 and 2010. A total of 680 patients were randomized to receive either coated CVC (Certofix® protect; B.
P228 Higher incidence of catheter-related bloodstream infection in femoral venous access than in subclavian venous access in the presence of tracheostomy L Lorente, S Palmero, JJ Jiménez, I Roca, C Naranjo, J Castedo, S Huidobro, L Lorenzo, JL Iribarren, ML Mora Hospital Universitario de Canarias, La Laguna, Spain Critical Care 2011, 15(Suppl 1):P228 (doi: 10.1186/cc9648) Introduction A higher incidence of catheter-related bloodstream infection (CRBSI) in femoral than in subclavian catheter sites has
Figure 1 (abstract P229).
Critical Care 2011, Volume 15 Suppl 1 http://ccforum.com/supplements/15/S1
Braun Melsungen AG) or standard CVC (Certofix®; B. Braun Melsungen AG). Primary objectives were the difference of the incidence of both CC and BSI between groups. Catheter colonization was defined as the growth of >1,000 colony-forming units using the sonication method. Results A total of 674 catheters were evaluated among which 58 catheters were excluded due to short indwelling time <3 days (an exclusion criterion). The two groups were similar with respect for the insertion site, place of insertion (ICU or surgical theatre), indwelling time, ICU stay and demographic indices. The coated CVC displayed similar incidence of CC as the standard CVCs (17.36% vs. 18.67%, P = 0.747) as well as incidence of catheter-related BSI (1.33% vs. 1.94%, P = 0.752). The rate of BSI was significantly lower in protected CVCs (2.00% vs. 6.47%, P = 0.008), and the incidence of BSI/1,000 catheterdays was lower in coated catheters (3.21 vs. 8.30, P = 0.036) as well (Figure 1). Conclusions Our results suggest that the use of external/internal polyhexanide-coated CVCs is associated with significant reduction of BSI but not with the reduction of colonization rate. Reference 1.
Niël-Weise BS, et al.: Intensive Care Med 2007, 33:2058-2068.
P230 Central line change in potential catheter-related bloodstream infection: target for intervention to reduce harm R Davies, M Lowings, AT Jones, CJ Langrish St Thomas’ Hospital, London, UK Critical Care 2011, 15(Suppl 1):P230 (doi: 10.1186/cc9650) Introduction Central venous catheterization is routine in critical care, but a potential source of harm. Forty-two per cent of bloodstream infections in England are central-line related [1], at a substantial cost to the health service. Early catheter removal is vital for source control where catheter-related bloodstream infection (CRBSI) is suspected. Furthermore, a model encompassing daily review and removal of unnecessary catheters has been shown to reduce the risk [2]. We studied the time from decision to removal of existing central venous catheters (CVCs), and evaluated potential reasons for delay. Methods This is a retrospective review of practice at a 43-bed medical/ surgical ICU at a London teaching hospital, using computerized patient records. All patients requiring a change of CVC over a 2-month period in 2010 were included. Change of CVC was defined as the time from decision to removal of the old CVC, incorporating new CVC insertion. Sepsis was defined as rising inflammatory markers, an impression of local/systemic infection, or emergency (unsterile) insertion. Routine was defined as no signs of infection, usually at 5 to 7 days or if accidentally dislodged/blocked. Results Seventy-eight CVC changes were performed, 45 (57.7%) for sepsis and 33 (42.3%) as routine. The median time to change a septic CVC was 742.5 minutes (106 to 2,038 minutes). The median time for a routine change was 611 minutes (130 to 1,759 minutes). On average, 70% of the time taken to change a CVC involved new catheter insertion. Where the tip position was confirmed with a chest X-ray scan, it took a median of 182 minutes longer (–97 to 946 minutes) to change the CVC. Check X-ray review was documented in 28 (45.1%) of 62 internal jugular/subclavian CVCs and only five X-ray scans resulted in repositioning. Where inotropes/vasopressors were administered, it took a median of 209 minutes longer (106 to 599 minutes) for CVC change. Where coagulation products were administered, it took a median of 168.5 minutes longer (209 to 279 minutes) for CVC change. Conclusions Our data suggest that in our unit the duration of catheter change in the critically ill is a prolonged process, and took longer where potential harm is greatest. Check X-ray scans infrequently result in CVC repositioning, contribute to delays and could be performed after oldCVC removal. We plan to audit the changes we have made, and believe that the timely exchange of old CVCs should be incorporated into models aiming to reduce the impact of CRBSI. References 1. 2.
Smyth ETM, et al.: J Hosp Infect 2006, 69:230-248. Pronovost PJ, et al.: N Engl J Med 2006, 335:2725-2732.
S81
P231 Clostridium difficile-associated diarrhoea in a tertiary referral neurocritical care centre S Tripathy, C Kataria, PV Nair Walton Centre of Neurosciences, Liverpool, UK Critical Care 2011, 15(Suppl 1):P231 (doi: 10.1186/cc9651) Introduction Clostridium difficile-associated diarrhoea (CDAD) is associated with a mortality of up to 25% in susceptible patients. It occurs following long-term hospitalisation and prolonged antibiotic usage, particularly cephalosporins. Neurointensive care unit (NICU) patients on average have higher bed days, greater incidence of ventilator-associated pneumonia (VAP) and higher antibiotic use. We aimed to study the aetiology, acquisition rate and outcome of NICUacquired CDAD. Methods Intensive care admission and hospital infection control databases from April 2008 to August 2010 were studied and the case notes reviewed retrospectively. Patients who acquired CDAD within 48 hours of NICU admission were excluded. Diarrhoea was classified as mild, moderate or severe based on frequency and volume. Information on use of antibiotics, frequency, duration and type was gathered. Admission diagnosis, days of NICU stay and incidence of complications were noted. Results Of the 2,212 patients with a total of 10,825 bed-days, nine patients developed CDAD. The mean NICU stay was 26 (11 to 103) days. The median duration between ICU admission and development of CDAD was 11 (3 to 93) days (7 in other neurocritical care units). Median age of the patients was 55 (20 to 72) years. Patients had a mean 6.7 (±5.2) days of diarrhoea prior to a positive assay. At the time of diagnosis, four (44%) patients had moderate disease. Three patients had a perceived delay in discharge from the ICU (1 to 8 days) due to their infective status. Concurrent infections occurred in 77% of patients, 33% of which were VAP. Of the antibiotics used prior to CDAD diagnosis, 44% were cephalosporins. There were no major complications or mortality attributed to CDAD. Identified risk factors for ICU-acquired CDAD included age >65 (22%), antibiotics (67%), laxatives (100%), steroids (33%), proton pump inhibitors (88%) and medical device requirement (100%). All patients were emergency admissions, of which eight were neurosurgical. The one patient who had the most protracted disease was isolated with C. difficile ribotype 027. Conclusions In spite of a patient population who is at high risk of CDAD, the rate of infection in our unit is 8.3 per 10,000 bed-days or 0.4% incidence, which is below the average incidence for general intensive care (10.6 per 10,000 bed-days) and neurocritical care units (0.6%) in the UK. This may be attributed to the presence of an efficient infection control team, isolation practices with patients immediately being isolated to barrier nursing and a protocol for CDAD detection as well as a high degree of awareness amongst the medical and nursing staff. P232 A creep in the vancomycin minimum inhibitory concentration for Staphylococcus aureus in a tertiary care hospital in India A Bhakta, M Bhattacharyya, S Todi AMRI Hospitals, Kolkata, India Critical Care 2011, 15(Suppl 1):P232 (doi: 10.1186/cc9652) Introduction Vancomycin minimum inhibitory concentration (MIC) creep has been observed in studies from western countries. Staphylococcus aureus strains with increased MIC to vancomycin are associated with worse outcomes compared with more susceptible strains. Recognition of this phenomenon – the development of reduced susceptibility to vancomycin, and the subsequent glycopeptide MIC creep – is important, since it may be a precursor to heterogeneous vancomycin intermediate S. aureus (hVISA) and VISA. Methods In a study carried out in a tertiary care hospital in India, 176 clinically significant Gram-positive bacterial isolates were collected from January 2009 to October 2009. MICs were determined for vancomycin, teicoplanin, linezolid, daptomycin and cefoxitin (to screen for methicillin-resistant S. aureus) using the E strips. Results Out of 176 isolates, 72 were MSSA, 16 MRSA, 68 Enterococcus spp. and 20 coagulase-negative staphylococcus. No VISA or VRSA was
Critical Care 2011, Volume 15 Suppl 1 http://ccforum.com/supplements/15/S1
detected. Sixteen MRSA and 12 MSSA isolates have MIC 2. The MIC50 values of MRSA and MSSA were 1.5 and 1, respectively. The MIC90 values of MRSA and MSSA were 2 and 1.5, respectively. A total 80.5% of MSSA isolates have MIC of vancomycin ≥1. Enterococcus spp. had MIC50 of 1 and MIC90 of 3, whereas coagulase-negative staphylococci had MIC50 of 1 and MIC90 of 2. MIC90 of all the isolates for teicoplanin was between 2 to 3, for linezolid 1.5 to 3 and for daptomucin 0.50 to 0.75. Conclusions A significant creep in the vancomycin MIC for S. aureus has occurred in an Indian hospital, which is of important concern as it may lead to treatment failure with vancomycin. References 1. 2.
Wang G, et al.: J Clin Microbiol 2006, 44:3883-3886. Chang FY, et al.: Medicine (Baltimore) 2003, 82:333-339.
P233 Prognostic impact of imported and newly-isolated methicillinresistant Staphylococcus aureus in the ICU S Ohshimo, K Ota, T Tamura, Y Kida, J Itai, K Suzuki, T Inagawa, Y Torikoshi, T Otani, T Sadamori, R Tsumura, Y Iwasaki, N Hirohashi, K Tanigawa Hiroshima University, Hiroshima, Japan Critical Care 2011, 15(Suppl 1):P233 (doi: 10.1186/cc9653) Introduction Methicillin-resistant Staphylococcus aureus (MRSA) is a leading pathogen of hospital-acquired pneumonia. The difference in outcome between patients with imported and newly-isolated MRSA in the ICU has not been well investigated. The aim of our study was to explore the incidence, risk factors and outcome in patients with imported and newly-isolated MRSA. Methods Patients admitted to the ICU in our university between April 2009 and May 2010 were prospectively studied. Nasal swabs were collected from all patients on admission and subsequently collected weekly during the ICU stay. When patients were intubated, intratracheal aspirates were concurrently collected. The correlations of positive culture of MRSA with clinical variables were analyzed. Results A total of 1,270 consecutive patients were enrolled. The median follow-up period was 404 days (range, 187 to 609). There were 803 males and 467 females. Median age was 63 (range, 1 to 97). Of these, imported MRSA was found in 124 (10%) patients, and newly-isolated MRSA in 57 (4%) patients. The incidence of imported MRSA was associated with the co-morbidity of cardiovascular disease or malignancy and long hospital stay before admission to the ICU, whereas the incidence of newly-isolated MRSA was associated with the positive culture in intratracheal aspirates or blood/intravenous catheter, the co-morbidity of shock, pneumonia, neurological diseases or trauma, increased number of isolated sites, higher APACHE II score, prolonged ICU stay and higher mortality during ICU stay. Although no statistical significance was found in total patients, the subset analysis of the male patients demonstrated that the outcome of newly-isolated patients was significantly poor compared with those of imported MRSA (P = 0.005). Multivariate analysis revealed that the new isolation of MRSA in the ICU (P = 0.03; hazard ratio (HR), 2.62), negative culture of MRSA in nasal swab (P = 0.02; HR, 4.18), ≥2 isolated sites (P = 0.01; HR, 4.59) and co-morbidity of ARDS (P = 0.002; HR, 4.63) were the independent poor prognostic factors. Conclusions New isolation of MRSA during the ICU stay was associated with poor outcome particularly in male patients compared with imported MRSA. Clinicians should be aware of the high-risk group of MRSA infection. Strict hand hygiene plus a careful assessment of the patient, applying aggressive procedures such as patient isolation, staff cohorting, and active surveillance cultures should be indicated. P234 Increased mortality associated with methicillin-resistant Staphylococcus aureus infection in the ICU: results from the EPIC II study H Hanberger, S Walther, for the EPIC II participants Clinical and Experimental Medicine, Linköping, Sweden Critical Care 2011, 15(Suppl 1):P234 (doi: 10.1186/cc9654) Introduction Controversy continues regarding whether methicillin resistance increases mortality risk in Staphylococcus aureus infections.
S82
We assessed the role of methicillin resistance on survival of patients in the EPIC II study cohort with S. aureus infection. Methods The EPIC II point-prevalence study of infection in critically ill patients was performed on 8 May, 2007. Demographic, physiological, bacteriological and therapeutic data were collected for all adult patients in 1,265 participating ICUs from 75 countries on the study day. ICU and hospital outcomes were recorded. We compared characteristics of patients with methicillin-sensitive (MSSA) and methicillin-resistant (MRSA) S. aureus infection. Co-morbidities, age, simplified acute physiology system (SAPS) II score, site of infection, geographical region, and MRSA/MSSA were entered into a multivariable model and adjusted odds ratios (ORs) (95% CI) were calculated for ICU and hospital mortality rates. Results On the study day, 7,087 of the 13,796 patients (51%) were classified as infected. There were 494 patients with MRSA and 505 patients with MSSA infections. There were no significant differences between the two groups in use of mechanical ventilation or hemofiltration/hemodialysis. Cancer and chronic renal failure were more prevalent in MRSA than in MSSA patients. ICU mortality rates were 29.1% and 20.5%, respectively (P <0.01) and corresponding hospital mortality rates were 36.4% and 27.0% (P <0.01). Multivariable analysis of hospital mortality for MRSA infection showed an adjusted OR of 1.48 (1.05 to 2.10), P = 0.03. Conclusion In ICU patients, MRSA infection is more common in patients with co-morbid conditions, such as cancer and chronic renal failure, and is independently associated with an almost 50% higher odds of hospital death compared with MSSA infection. Reference 1.
Vincent JL, et al.: JAMA 2009, 302:2323-2329.
P235 Intrathecal (intraventricular) polymyxin B in the treatment of patients with meningoencephalitis by Acinetobacter baumanii and Pseudomonas aeruginosa SK Macedo, IP Gonçalves, GVdO Bispo, LRd Almeida, LBdA Brito São José do Avaí Hospital, Itaperuna, Brazil Critical Care 2011, 15(Suppl 1):P235 (doi: 10.1186/cc9655) Introduction Intraventricular therapy (IVT) with polymyxin B (PolyB), an antibiotic with similar pharmacological action to colistin (PolyE), by external ventricular derivation (EVD) has the main goal of offering major bioavailability of the drug, since its use by intravenous and direct action are restricted by the blood–brain barrier, with penetration of only 25%. Pseudomonas aeruginosa is a Gram-negative bacterium, multidrug resistant, which has a characteristic of secreting exotoxin A. Along with Acinetobacter baumannii, it has expressed a great risk to the lives of patients with meningoencephalitis. The patient of the present report had arterial venous malformations followed by hemorrhagic stroke, which caused elevated intracranial pressure. The objective is to show an example of the effect of IVT PolyB in a patient with meningoencephalitis infection by multidrug-resistant Gram-negative bacteria (A. baumannii and P. aeruginosa), common in the ICU. Methods A literature review was made on the subject of therapy with PolyB about the pharmacological characteristics, nephrotoxicity and neurotoxicity. A comparative table of the profile of resistance of the strain treated in this study was created, with the intrinsic resistance of the species. Also, the development of liquor evolution (culture and routine) of the patient before the treatment was monitored, until negative liquor. We analyzed the life and effectiveness of EVD, the colonizer germ and monitoring of the serial aspect of the liquor. Results The patient was treated with intravenous and intrathecal administration of PolyB (IVT) between 14 November and 28 November 2008. On 14 November 2008, therapy was started with PolyB intravenous administration of 1,500,000 UI (20,000 UI/kg/day) once a day, on every day of treatment, and IVT by EVD: 50,000 UI in solution once a day during the first 3 days, and on alternate days for all of the treatment. As a result of the use of intrathecal PolyB intravenously, effectiveness was proven in the routines of liquor negative for such germs, showing no reports of neurotoxicity and nephrotoxicity. Conclusions IVT PolyB proved to be very efficient, treating this meningoencephalitis quickly. No toxic effect was associated with the drug.
Critical Care 2011, Volume 15 Suppl 1 http://ccforum.com/supplements/15/S1
Reference 1. 2.
Munoz LS, Price MD, et al.: Current concepts – Acinetobacter infection. N Engl J Med 2008, 358:1271-1281. Falagas ME, Kasiakou SK: Toxicity of polymyxins: a systematic review of the evidence from old and recent studies. Crit Care 2006, 10:R27.
P236 Effects of tigecycline and doxycycline in porcine endotoxemia M Von Seth1, J Sjölin2, A Larsson2, M Eriksson1, M Lipcsey1 1 Department of Surgical Sciences, Uppsala University, Uppsala, Sweden; 2 Department of Medical Sciences, Uppsala University, Uppsala, Sweden Critical Care 2011, 15(Suppl 1):P236 (doi: 10.1186/cc9656) Introduction Tigecycline, the first drug in a new class of antibiotics, the glycylcyclines, is used in the treatment of severe abdominal and connective tissue infections. Tetracyclines, having a structure–activity relationship with tigecycline, exert anti-inflammatory effects [1]. Some laboratory studies suggest that tigecycline may have anti-inflammatory properties in sepsis, but this has not previously been explored in a large animal integrative intensive care model. Methods Eighteen piglets weighting 25.0 ± 2.2 (mean ± SD) were randomized to receive tigecycline 100 mg, doxycycline 200 mg or placebo and subjected to 6 hours of endotoxin infusion of 2 μg/kg/hour. We measured inflammatory, hemodynamic and respiratory variables. Results TNFα was lower in the doxycycline group compared with the tigecycline and placebo groups during the experiment 0 to 6 hours (P <0.05). The mean arterial pressure decline from baseline was greater during the experiment in the placebo group compared with the tigecycline group 0 to 6 hours (P <0.05), but not the doxycycline group. Conclusions Doxycycline demonstrated anti-inflammatory properties. Tigecycline counteracted emerging circulatory deterioration without affecting the proinflammatory cytokine response in this model. Reference 1.
Milano S, et al.: Antimicrob Agents Chemother 1997, 41:117-121.
P237 Blood transfusions: an independent risk factor for the development of Candida infections in critically ill surgical patients G Burghi, G Ortiz, H Bagnulo Hospital Maciel, Montevideo, Uruguay Critical Care 2011, 15(Suppl 1):P237 (doi: 10.1186/cc9657) Introduction Blood transfusions are associated with infectious complications. Despite this, only a few studies link the use of blood transfusions with the development of fungal infections. This study was performed to assess risk factors associated with Candida colonization and infection. Methods A retrospective study including all patients admitted to the ICU due to severe abdominal sepsis or severe pancreatitis between July 2005 and July 2010. Factors analyzed were: shock, insulin use, number of surgeries, mechanical ventilation, days of central catheters, treatment with corticosteroids, parenteral nutrition, red blood cell transfusions, and use of antibiotics. Risk factors for Candida colonization and infection were identified by multivariate logistic regression. Results We analyzed 86 patients with severe abdominal sepsis and severe pancreatitis. Mean age 62 ± 16, SAPS II 47 ± 25, 70% required invasive ventilation, and 61% presented shock. Twenty patients (23%) were colonized by Candida. Independent risk factors for Candida colonization were the use of parenteral nutrition (OR, 3.6; 95% CI, 1.0 to 12.6; P = 0.03) and transfusion of at least 4 volumes of red blood cells (OR, 12.8; 95% CI, 2.0 to 79; P = 0.006). Seven patients (8%) had invasive candidiasis. Independent risk factors associated with this infection were: prior colonization by at least two sites (OR, 10.6; 95% CI, 1.8 to 61; P = 0.008), and transfusion of at least 4 volumes of red blood cells (OR, 9.7; 95% CI, 1.6 to 59; P = 0.01). Mortality in the Candida infection group was 71% versus 53% in non-infected nor colonized patients (P = 0.3). Conclusions Candida infection is always preceded by colonization. The need for antifungal treatment should be based on the degree of colonization. Restrictive transfusional strategies should be established in these patients to reduce invasive Candida infections.
S83
P238 Demographic and outcome differences in ICU patients with proven invasive candidiasis, possible invasive candidiasis and probable candida colonization: analysis of the EPIC II study population D Kett1, G Dimopoulos2, E Azoulay3, P Echeverria1, JL Vincent4 1 University of Miami Miller School of Medicine, Miami, FL, USA; 2University Hospital ‘ATTIKON’ Medical School, University of Athens, Greece; 3Medical ICU, St-Louis Hospital and Paris VII University, Paris, France; 4Erasme University Hospital, Brussels, Belgium Critical Care 2011, 15(Suppl 1):P238 (doi: 10.1186/cc9658) Introduction To evaluate differences in ICU patients with proven invasive candidiasis (Proven-IC), possible invasive candidiasis (PossibleIC), probable Candida colonization (colonized), and non-infected, noncolonized (non-infected) patients. Methods EPIC II recruited 1,265 ICUs in 76 countries. Patient characteristics were collected on the study day. Outcome data were assessed at ICU and hospital discharge. Patients infected or colonized with non-Candida pathogens were excluded from this analysis. Patients with positive candida cultures may have had concurrent bacterial infections or colonization (*P <0.05 compared with the non-infected group). Numerical values are reported as mean ± SD and length of stay (LOS) data as median (IQ). Results A total of 13,796 adult patients were in a participating ICU on the study day. Of these, 110 had Proven-IC, 278 had Possible-IC, and 371 were colonized. In total, 6,507 patients were non-infected. Differences in patient characteristics and outcomes (Table 1) are reported. Table 1 (abstract P238) Proven-IC Possible-IC Colonized Non-infected (n = 110) (n = 278) (n = 371) (n = 6,509) SAPS II mean (SD)*
58 (14)
41 (15)
40 (16)
31 (14)
Mechanical ventilation (n, %)* 77 (71%)
204 (73%)
255 (70%) 2,822 (44%)
Vaspressors (n, %)*
87 (31%)
129 (35%) 1,251 (19%)
37 (34%)
ICU mortality (n, %)*
45 (42%)
93 (34%)
102 (29%)
649 (11%)
ICU LOS median (IQ)*
33 (18,52)
30 (16,52)
23 (11,41)
4 (1,4)
Conclusions ICU patients with proven invasive candidiasis, possible invasive candidiasis and candida colonization were more acutely ill and undergoing more ICU interventions than non-infected patients. The ICU mortality and LOS were also greater. Reference 1.
Vincent JL, et al.: JAMA 2009, 302:2323-2329.
P239 Chinese survey of candidasis in ICUs: China-SCAN study HB Qiu, for China-Scan Study Group Zhongda Hospital of Southeast University, Nanjing, China Critical Care 2011, 15(Suppl 1):P239 (doi: 10.1186/cc9659) Introduction This is the first national multicenter epidemiology study of invasive candida infections (ICIs) within ICUs in China. The objectives included describing the epidemiology, patient characteristics and management of these ICIs. Methods The study used a prospective observational design. A total of 68 ICUs in China participated. The study was initiated on 1 November 2009 and will close on 30 April 2011. During the study period all consecutive patients above 18 years diagnosed as proven ICI after being admitted into the ICUs were eligible for enrollment. For each episode of ICI, demographic data, underlying diseases, severity of illness, risk factors, diagnosis, reported pathogen of fungal infection, process of treatment and survival at discharge were recorded. A total of 203 ICI cases were identified by the end of October 2010; since CRF collection and data management for part of the cases are ongoing, here we report the interim analysis results of 145 proven ICIs. Results Among 145 eligible ICI patients, 134 (92.4%) had isolated candidemia, two (1.4%) had invasive candidiasis with candidemia, and
Critical Care 2011, Volume 15 Suppl 1 http://ccforum.com/supplements/15/S1
nine (6.2%) had invasive candidiasis without documented candidemia. The median time ICI occurred was 9 days after ICU admission. The mean APACHE II was 26.6 at ICU admission (SD 7.2). The frequency of risk factors within 2 weeks before ICI were 107 patients (73.8%) with central venous catheterization, 117 (80.7%) with antibiotic therapy >5 days, 112 (77.2%) with invasive mechanical ventilation and 62 (42.8%) with total parenteral nutrition. The case fatality ratio of ICI in the ICU was 34.5% (50/145). A total of 156 isolates were collected, C. albicans accounted for 48.1% (75/156) of the isolates, followed by C. parapsilosis (14.1%), C. tropicalis (14.1%) and C. glabrata (9.6%). Seventy-five patients were reported with C. albicans infection (51.7%), among them five patients were reported as co-infected with other candida. Forty-three patients (29.7%) received initial antifungal therapy before or on the day of first positive sample drawn, 81 patients (55.9%) initiated therapy after the ICI diagnosis was proven. Initial treatment was mainly based on the use of a single antifungal agent (98.4%), and the treatment protocol was modified in 64 patients (44%) due to identification of causative Candida species, susceptibility reports or other reasons. Conclusions In China more than 90% of ICIs in the ICU were diagnosed by candidemia. Non-albicans Candida species accounted for onehalf of the Candida isolates. Mortality of ICIs in the ICU remains high; however, targeted therapy accounted for more than 50% of initial antifungal therapy.
P240 Anidulafungin for candidemia/invasive candidiasis in non-neutropenic ICU patients M Ruhnke1, J Paiva2, W Meersseman3, J Pachl4, I Grigoras5, G Sganga6, F Menichetti7, P Montravers8, G Auzinger9, G Dimopoulos10, M Borges Sá11, P Miller12, T Marček13, M Kantecki13 1 Charité University Hospital, Berlin, Germany; 2Hospital São João, Porto, Portugal; 3University Hospital Leuven, Belgium; 4University Hospital Královské Vinohrady, Prague, Czech Republic; 5University Hospital Sf Spiridon, Iaśi, Romania; 6University Hospital A Gemelli, Rome, Italy; 7University Hospital Pisa, Italy; 8Hospital Bichat Claude Bernard, Paris, France; 9King’s College Hospital, London, UK; 10University Hospital Attikon, Haidari, Greece; 11Hospital Son Llatzer, Palma de Mallorca, Spain; 12Pfizer, Sandwich, UK; 13Pfizer, Paris, France Critical Care 2011, 15(Suppl 1):P240 (doi: 10.1186/cc9660) Introduction A recent study found anidulafungin (ANI) safe and effective for candidemia/invasive candidiasis (C/IC) in selected populations of ICU patients [1]. A post hoc analysis of this study was performed to evaluate the efficacy of ANI in the same populations, but in non-neutropenic C/IC patients only. Methods A prospective, open label, multinational, phase 3b study in adult ICU patients (APACHE II score <25) with ≥1 of the following: postabdominal surgery; age ≥65 years; renal/hepatic insufficiency; solid organ transplant; neutropenia; and/or solid tumor. C/IC was confirmed from 96 hours before to 48 hours after the start of study treatment. Patients received i.v. ANI (200 mg on day 1, 100 mg/day thereafter) for ≥10 days, with optional oral azole step-down therapy, for a total treatment duration of 14 to 56 days. Primary efficacy endpoint was global response at end of all therapy (EOT) in the evaluable modified intent-to-treat (eMITT) population; that is, excluding patients with missing/unknown responses. For the present analysis, all patients with neutropenia were excluded. Results The total MITT population (that is, confirmed C/IC and ≥1 dose of ANI) included 170 patients, 157 (92.4%) of whom were nonneutropenic. In these patients at baseline, 69.4% had candidemia, mean APACHE II score was 16.3 (range 4 to 26) and mean SOFA score 7.4 (range 0 to 20). In non-neutropenic eMITT patients, global response at EOT was 71.1% (95% CI = 62.9, 78.4). At the end of i.v. therapy, 2 weeks post-EOT and 6 weeks post-EOT the global response was 72.4%, 61.2% and 52.0%, respectively. When missing/unknown responses were included and classed as failures, global success was 64.3% at EOT. The 90-day Kaplan–Meier survival estimate was 55.0% (95% CI = 47.2, 62.9). Among all non-neutropenic patients with ≥1 dose of ANI, treatmentrelated (due to ANI and/or azole) AEs and serious AEs occurred in 29/201 (14.4%) and 3/201 (1.5%) of patients, respectively. The most
S84
common treatment-related AE was erythema in four patients (2.0%). Other treatment-related AEs occurred in ≤1.5% of non-neutropenic patients. Conclusions ANI was effective and safe for the treatment of C/IC in selected populations of non-neutropenic ICU patients. Reference 1.
Paiva JA, et al.: Anidulafungin (ANID) for treatment of candidemia/invasive candidiasis (C/IC) in selected intensive care unit (ICU) populations. Crit Care Med 2010, 38(12 Suppl):297.
P241 Pharmacokinetics of micafungin in patients with severe burn injuries J Sasaki1, S Kishino2, S Hori1, N Aikawa1 1 Keio University School of Medicine, Tokyo, Japan; 2Meiji Pharmaceutical University, Tokyo, Japan Critical Care 2011, 15(Suppl 1):P241 (doi: 10.1186/cc9661) Introduction Micafungin (MCFG), an echinocandin antifungal agent, exhibits more potent antifungal activity against a broad spectrum of clinically important Candida and Aspergillus species [1]. However, there are few pharmacokinetic data of antifungal agents for burned patients, and determination of the dosage for these populations requiring initially a large quantity of fluid therapy can trouble burn surgeons and intensivists. The purpose of this study is to obtain the pharmacokinetic data for MCFG in severe burned patients. Methods In six patients with severe burn injuries within 14 days after injuries (19 to 82 years old, 36 to 85% TBSA), we measured the plasma concentration of MCFG by high-performance liquid chromatography [2] after drip infusion of MCFG, at 200 to 300 mg/day over a 1-hour period. Blood samples were collected at the end of the initial administration of MCFG (peak value after initial administration; A point), immediately before the second dosing (trough value after initial administration; B), at the end of the fourth dosing (steady-state peak value; C), and immediately before the fifth dosing (steady-state trough value; D). The control value of plasma concentration of MCFG assumed the pharmacokinetics value obtained from healthy volunteers. Results The plasma concentration of MCFG at the A point were 10.1 to 24.2 μg/ml, 1.8 to 6.1 μg/ml at B, 11.3 to 27.9 μg/ml at C, and 2.3 to 7.9 μg/ml at D. In both peak and trough values there was a good correlation between the plasma concentration of MCFG and the dose of MCFG per kilogram body weight the same as cases of healthy volunteers (Figure 1). Conclusions These results suggest that MCFG can be administered safely to burned patients without adjusting the dose. References 1. 2.
Aikawa N, et al.: J Infect Chemother 2009, 15:219-227. Yamato Y, et al.: Jpn J Chemother 2002, 50(Suppl 1):80-87.
Figure 1 (abstract P241). Correlation between the plasma concentration of MCFG and the dose of MCFG (mg/kg).
Critical Care 2011, Volume 15 Suppl 1 http://ccforum.com/supplements/15/S1
P242 Invasive aspergillosis in critically ill hematology patients: outcomes and prognostic factors associated with mortality G Burghi, V Lemiale, E Azoulay Hopital Saint-Louis, Université Paris VII, Paris, France Critical Care 2011, 15(Suppl 1):P242 (doi: 10.1186/cc9662) Introduction Invasive aspergillosis (IA) is documented in up to 15% of critically ill hematology patients admitted for acute respiratory failure. The disease is believed to be mostly deadly. Because diagnostic, preventive and therapeutic strategies for IA have changed over the past decade, we sought to appraise outcomes in hematology patients receiving mechanical ventilation for IA. Methods Determinants of hospital mortality were identified in hematology patients admitted to the ICU for acute respiratory failure from proven or probable IA. Results Fifty-nine patients received mechanical ventilation for IA over the 10-year study period. Thirty-six (62%) were neutropenic, 19 (32%) were receiving long-term steroids, and 13 (22%) were recipients of allogeneic BMT. Diagnosis was based on clinical and radiographic features, associated with either Aspergillus isolation (48 patients, including 25 bronchial aspiration, 17 BAL, six BAL + bronchial aspiration) or circulating galactomanan alone (11 patients). In 33 patients positive galactomanan was associated with Aspergillus isolation. Five cases were proven on autopsy. Associated bacterial infection was documented in 21 (35.6%) patients. Antifungal therapy included conventional amphotericin (50%), voriconazole (49%), liposomal amphotericin (32%), or caspofungin (19%). Seventeen (28.8%) patients had two lines of therapy and nine patients received a combination of voriconazole and caspofungin. Hospital mortality was 73% overall, 85% in patients with associated bacterial infection, and 44% in patients treated with voriconazole. Associated bacterial infection was independently associated with increased mortality (OR = 5.91 (1.04 to 33.5)), whereas the use of voriconazole (OR = 0.19 (0.04 to 0.91)) and localized disease (OR = 0.12 (0.03 to 0.59)) were associated with lower mortality. Conclusions The use of mechanical ventilation in patients with IA complicating HM is associated with a high, yet not constant, mortality of 73%. Early management at a time where the disease is localized, as well as the use of voriconazole, translate into survival benefits. P243 Effects of endotoxin on pacemaker funny current in HEK 293 cells VP Papaioannou1, A Van Ginneken2, AV Verkerk2, JB De Bakker2 1 Alexandroupolis University Hospital, Alexandroupolis, Greece; 2Academic Medical Center, Amsterdam, the Netherlands Critical Care 2011, 15(Suppl 1):P243 (doi: 10.1186/cc9663) Introduction Different animal in vitro studies have concluded that lipopolysaccharide (LPS) can alter electrophysiological properties of ionic currents in cardiac myocytes. There is only one study in the literature that found reduced activation of the pacemaker funny current (IF), encoded by the hyperpolarization-activated cyclic nucleotide modulated-4 (HCN4) gene family, in human atrial cells after administration of LPS. Methods Twenty human embryonic kidney (HEK) 293 cells were transfected with Toll-like receptors-4 (TLR4), CD14 and HCN4 cDNAs and after 24 hours were incubated with 1 μg/ml (10 cells) or 10 μg/ml (10 cells) of LPS (from Escherichia Coli; Sigma, St Louis, USA). In addition, 50 pM soluble MD-2 protein was added to the culture medium for enhancing the responsiveness of TLR4 to LPS. Twenty-four hours after LPS addition, electrophysiological recordings were performed at 36°C with the whole-cell patch clamp technique, using an Axopatch 200B amplifier (Molecular Devices, Sunnyvale, CA, USA). IF current properties were measured during 6-second hyperpolarizing steps (range –30 to –120 mV), from a holding potential of –30 mV. Voltage control, data acquisition and analysis were accomplished using custom software. Results Incubation of cells with both 1 and 10 μg/ml LPS was found to significantly impair IF related to controls, by suppressing the current at membrane potentials between –60 and –90 mV and slowing down current activation. Funny current in LPS-treated cells showed more negative half-maximum activation voltage (V1/2) values and slope
S85
factor (k), derived from voltage-dependent activation curves after Boltzmann fitting to experimental data (1 μg/ml: V1/2 = –80 ± 3.7 mV and k = –14.9 ± 3.4 mV, 10 μg/ml: –96 ± 4.5 and –31.2 ± 6.7, respectively), than the control cells (V1/2 = –75 ± 2.8, k = 9.7 ± 2.3, P <0.001 for all comparisons). IF current densities between –60 and –90 mV were significantly higher in untreated cells (0.67 ± 0.5 pA/pF) than in 1 and 10 μg/ml incubated LPS cells (0.43 ± 0.3 and 0.09 ± 0.05, respectively, P <0.001 for all comparisons). Conclusions In conclusion, this study showed in HEK 293 cells a negative impact of LPS upon activation properties of the pacemaker IF current, confirming findings from previous studies on human atrial cells. Reference 1.
Zorn-Pauly K, et al.: Endotoxin impairs the human pacemaker current IF. Shock 2007, 28:655-661.
P244 Influence of an immunoglobulin-enriched (IgG, IgA, IgM) solution on activation and immunomodulatory functions of peripheral blood mononuclear cells in a LPS second-hit model C Duerr, A De Martin, M Sachet, T Konrad, S Baumann, A Spittler Medical University of Vienna, Austria Critical Care 2011, 15(Suppl 1):P244 (doi: 10.1186/cc9664) Introduction Immunoglobulin molecules have opposing functions by inducing proinflammatory and anti-inflammatory responses in innate immune effector cells. In the setting of acute inflammation, Toll-like receptors sense the presence of microbial components within minutes. TLR signalling in monocytes and macrophages leads to the production of numerous proinflammatory cytokines which accumulate in the activation of both the innate and adaptive immune system. It is well established that repeated endotoxin stimulation triggers immunological hyporesponsiveness of the monocytic lineage, which is demonstrated by a reduced capacity to produce TNFα upon LPS stimulation. In an in vitro model we investigated the impact of immunoglobulins on activation of mononuclear cells obtained from healthy probands and from patients suffering Gram-negative sepsis. Methods Whole blood (n = 5) and PBMCs (n = 5) from healthy volunteers as well as whole blood from patients in the early (n = 8) and in the late (n = 8) phase of sepsis were treated with an immunoglobulin-enriched solution containing IgG, IgA, and IgM (IgGAM). Cells were challenged with various concentrations of LPS in a second-hit model and TNFα secretion was measured by ELISA. In addition, monocyte HLA-DR, CD64 and CD11b expression as well as phagocytosis and oxidative burst were analysed by flow cytometry. Proliferation and cytokine release of ConA and/or IL-2 stimulated lymphocytes were undertaken. Results In healthy donors upon two-time LPS stimulation IgGAM incubation resulted in a significant decrease of TNFα secretion administration in a time-dependent and dose-dependent manner. Similar effects were observed in whole blood from patients in the early phase of sepsis. HLA-DR, CD11b and CD64 expression from monocytes of healthy probands declined significantly after LPS expression, which was not observed in septic patients. Interestingly in both groups the administration of IgGAM had no effects on phagocytosis and oxidative burst. Lymphocyte proliferation and cytokine release were significantly impaired in both groups. Conclusions The immunoglobulin-enriched solution possesses a distinct immune modulatory effect in vitro on monocytes/monocytederived macrophages and lymphocytes from both septic patients and healthy volunteers, especially upon short-term LPS exposure and in the early phase of sepsis. P245 Lipopolysaccharide induces mitochondrial dysfunction in rat cardiac microvascular endothelial cells M Vuda, M Chiusa, SM Jakob, J Takala, C Zuppinger, S Djafarzadeh Bern University Hospital and University of Bern, Switzerland Critical Care 2011, 15(Suppl 1):P245 (doi: 10.1186/cc9665) Introduction Endothelial injury and dysfunction are key pathophysiological processes in sepsis. The aim of the study was to evaluate
Critical Care 2011, Volume 15 Suppl 1 http://ccforum.com/supplements/15/S1
S86
Figure 1 (abstract P245). Cardiac microvascular endothelial cells’ oxygen consumption.
Figure 2 (abstract P245). CMEC cells under control and LPS treatment conditions.
the effects of bacterial lipopolysaccharide (LPS) on cellular respiration of rat primary cardiac microvascular endothelial cells (CMEC). Methods CMEC were isolated from adult (250 to 300 g) male Wistar rats and cultured. Cells were exposed to LPS (1 μg/ml) for 4, 8, 16 hours and cellular respiration was measured by high-resolution respirometry (Oxygraph-2k; Oroboros Instruments, Innsbruck, Austria). Activation of caspase-3 protein as an early apoptotic event was examined by western blot analysis. Electron microscopy was performed to reveal any alterations in mitochondrial morphology. Results After 4 and 8 hours of LPS incubation (1 μg/ml) no significant changes in CMEC mitochondrial respiration was observed. However, cells treated with LPS for 16 hours exhibited a significant reduction in the maximal complex I-dependent (control: 146 ± 45 pmol/ (second*million cells) vs. LPS: 127 ± 38 pmol/(second*million cells)) and IV-dependent (control:148 ± 89 pmol/(second*million cells) vs. LPS: 108 ± 80 pmol/(second*million cells)) mitochondrial respiration (n = 16) (Figure 1). Relatively little, if any, processing of procaspase-3 to active caspase-3 was detected in untreated cells or in cells treated with LPS (1 μg/ml, 16 hours of incubation) (data not shown), and electron microscopy examination revealed no major alterations in cellular and mitochondrial ultrastucture under LPS treatment (Figure 2). Statistical analysis for cellular respiration was performed using a paired t test. Conclusions The data suggest that prolonged exposure to LPS impairs CMEC complex I-dependent and IV-dependent respiration slightly but significantly, without apparent signs of apoptosis or mitochondrial ultrastructural damage. P246 Monocyte subset recruitment to the peritoneum following abdominal surgical incision in mice N Bunker1, KP O’Dea2, JM Handy1, M Takata2 1 Chelsea & Westminster Hospital, London, UK; 2Imperial College, London, UK Critical Care 2011, 15(Suppl 1):P246 (doi: 10.1186/cc9666) Introduction The current gold standard animal model for sepsis is CLP [1]; however, this model does not allow segregation of the immune responses to infection from those due to surgical incision/trauma. We hypothesised that surgical incision of the peritoneal wall in mice would be a potent stimulus for the recruitment of monocytes, particularly
the inflammatory Gr-1Hi subset [2], to the peritoneal space where they would be capable of mounting a proinflammatory response to subsequent septic challenges. Methods Sterile laparotomy (incision of peritoneum of ~1 cm) was performed on C57B6 mice under isoflurane anaesthesia and closed in two layers. Control groups were skin incision only, or i.p. injection of 20 ng LPS. At least three mice per group were euthanised at intervals up to 48 hours and lavage samples were obtained. For determination of monocyte responses in situ, five mice received an i.p. injection of LPS (20 ng) 24 hours post-surgery. Monocyte subset numbers and their expression of the proinflammatory cytokine, TNF, were quantified by flow cytometry. Results In laparotomised mice, migration of Gr-1Hi subset monocytes became evident in lavage fluid at 8 hours, with numbers peaking at 16 hours (7.27 ± 3.25 x 10⁵). Numbers of the Gr-1Lo subset counterpart did not increase until 16 hours but remained high until 48 hours. The peak numbers of both subsets in peritoneal lavage were considerably higher than those observed after i.p. LPS (Gr-1Hi 2.45 ± 1.11 x 10⁵ and Gr-1Lo 2.69 ± 0.54 x 10⁵). By contrast, skin incision alone did not induce detectable monocyte migration. In response to secondary i.p. LPS challenge, these monocytes recruited by laparotomy responded vigorously, expressing high levels of cell-associated TNF that did not differ significantly between subsets (Gr-1Hi MFI: 146.1; Gr-1Lo MFI: 93.6). Conclusions Monocytes were recruited to the peritoneum in large numbers and for a prolonged period by abdominal surgical incision. The early appearance of the Gr-1Hi followed by Gr-1Lo subset monocytes may represent a delayed kinetic of the latter or the in situ maturation of Gr-1Hi to Gr-1Lo monocytes. In view of the numbers recruited and their substantial response to a septic stimulus, monocyte infiltration to the peritoneum could represent a significant risk factor for the development of local and systemic inflammatory conditions following abdominal surgery. References 1. 2.
Hubbard WJ, et al.: Shock 2005, 24(Suppl 1):52-57. Geissmann F, et al.: Immunity 2003, 19(1):71-82.
P247 Influence of body mass index on the innate immune response during human endotoxemia R Van der Pluijm UMC St Radboud, Nijmegen, the Netherlands Critical Care 2011, 15(Suppl 1):P247 (doi: 10.1186/cc9667) Introduction Accumulating data suggest a protective effect of obesity in the case of severe infections. Higher baseline levels of the proinflammatory cytokine TNFα as well as more pronounced TNFα release following whole blood stimulation with endotoxin are reported in patients with a higher body mass index (BMI). This more pronounced proinflammatory response in obese patients may enable a rapid and more effective clearance of microbial pathogens. The effect of the body mass index on the innate immune response in vivo has not been assessed.
Critical Care 2011, Volume 15 Suppl 1 http://ccforum.com/supplements/15/S1
S87
Methods The immune response and BMI of 69 healthy subjects that were included in several experimental endotoxemia studies were analyzed. Endotoxemia was induced by the administration of 2 ng/kg Escherichia coli lipopolysaccharide. Concentrations of TNFα and IL-10 were serially determined (Luminex assay). Areas under the curve of cytokine levels were calculated and analyzed with unpaired t tests. All data are expressed as mean ± SEM of n subjects. Results All subjects showed increased production of both proinflammatory cytokine TNFα and anti-inflammatory cytokine IL-10 (Figure 1). The area under the curve of TNFα levels was related to the BMI (Figure 2) as subjects with BMI >24 kg/m2 released more TNFα than those with BMI <21 kg/m2 (P = 0.04). An opposite trend of IL-10 levels was observed in association with higher BMI (P = 0.12). The quotient of TNFα/IL-10 AUC levels, serving as a readout of the pro/anti-inflammatory balance of a subject, showed a more proinflammatory response in subjects with a higher BMI compared with those with a lower BMI (P = 0.03) (Figure 2). Conclusions This study is the first to demonstrate that a higher BMI is associated with a shift in the pro/anti-inflammatory balance towards a more pronounced proinflammatory immune response in humans in vivo.
Figure 1 (abstract P247). Effects of 2 ng/kg Escherichia coli endotoxin (LPS) (administered at 0 hours) in subjects with BMI <21 and BMI >24 kg/ m2 on the production of TNFα and IL-10. Data expressed as mean ± SEM.
P248 Effect of bacterial load versus duration of exposure to bacteria on plasma TNFα concentrations in porcine fecal peritonitis T Correa, L Brander, S Djafarzadeh, R Schröder, J Takala, A Reintam Blaser, M Vuda, S Mathias Jakob University Hospital Bern – Inselspital and University of Bern, Switzerland Critical Care 2011, 15(Suppl 1):P248 (doi: 10.1186/cc9668)
Figure 2 (abstract P247). AUC of TNFα and IL-10 and the TNFα/IL-10 ratio in subjects with BMI <21, BMI 21 to 24 and BMI >24 kg/m2. Data expressed as mean ± SEM.
Introduction The clinical relevance of preclinical sepsis research has been questioned [1]. This may in part be the result of varying degrees of experimental inflammatory insults. The objective of this study was to quantify inflammation based on plasma TNFα levels after exposure to two different bacterial loads, and after different lengths of bacterial incubation in the peritoneal cavity. Methods We retrospectively evaluated plasma TNFα concentrations measured before and 24 hours after fecal peritonitis induced by 1 g/ kg autologous feces (16 anesthetized pigs, median weight: 40.0 kg) and after 6, 12 and 24 hours of fecal peritonitis induced with 2 g/kg autologous feces (24 anesthetized pigs (n = 8/group); median weight: 41.0 kg). All animals were resuscitated with fluids, norepinephrine and antibiotics, and were mechanically ventilated according to standardized protocols. Differences along time after fecal peritonitis induced with 2 g/kg feces were assessed by ANOVA for repeated measures. Comparison between the two models (1 g/kg vs. 2 g/kg) after 24 hours of peritonitis was performed with an independent t test. Results TNFα increased from baseline to 6, 12 and 24 hours of peritonitis induced with 2 g/kg feces (P <0.001 for time–group interaction) (Figure 1). The mean (± SD) plasma TNFα levels measured 24 hours after fecal peritonitis induced with 1 and 2 g/kg were 255 ± 178 pg/ml and 233 ± 124, respectively (P = 0.75; 95% CI for the difference: –124 to 169 pg/ml).
Critical Care 2011, Volume 15 Suppl 1 http://ccforum.com/supplements/15/S1
S88
P250 IFNγ prolongs survival in experimental Escherichia coli pyelonephritis: implications for favorable phagocytosis M Katsaris1, T Adamis1, M Georgitsi1, A Pistiki1, M Chrisofos1, E Giamarellos-Bourboulis2 1 University of Athens, Medical School, Athens, Greece; 2Attikon University Hospital, Athens, Greece Critical Care 2011, 15(Suppl 1):P250 (doi: 10.1186/cc9670)
Figure 1 (abstract P248). Mean (95% CI) TNFα levels.
Conclusions The magnitude of inflammation expressed as plasma TNFα concentrations was associated with the duration of bacterial incubation in the peritoneal cavity but not with the amount of bacterial load. This has implications for the interpretation of experimental sepsis findings. Reference 1.
Lamontagne F: Systematic review of reviews including animal studies addressing therapeutic interventions for sepsis. Crit Care Med 2010, 38:2401-2408.
P249 Does leukocyte apoptosis play any role in the pathogenesis of experimental pancreatitis? D Zotos1, T Adamis1, A Pistiki1, K Louis1, E Giamarellos-Bourboulis2 1 University of Athens, Medical School, Athens, Greece; 2Attikon University Hospital, Athens, Greece Critical Care 2011, 15(Suppl 1):P249 (doi: 10.1186/cc9669) Introduction The role of apoptosis of leukocytes for the final outcome of necrotizing pancreatitis remains to be elucidated. Methods Experimental pancreatitis was induced in rabbits after ligation of the common pancreatic duct. Animals were assigned into sham-operated (group A, n = 8) infused 0.3 ml of ethanol 99% above the ligation; into nine infused 0.3 ml of one 10% solution of taurocholic acid above the ligation (group B, n = 9); and into 10 infused 0.3 ml of one 20% solution of taurocholic acid above the ligation (group C, n = 10). Blood was sampled at serial time intervals; apoptosis of lymphocytes, monocytes and neutrophils was assessed after staining for annexin V and for propidium iodine and flow cytometric analysis. On death or on sacrifice the pancreas was removed. Fat necrosis was assessed by histology; quantitative tissue cultures were done. Results Median survival of group A was 28 days; of group B was 5 days (log-rank vs. group A: 4.155, P = 0.042); and of group C was 1.5 days (log-rank vs. group A: 10.356, P = 0.001). Mean percentage pancreatic necrosis of groups A, B and C was 2.5, 45.0 and 42.0%, respectively. Respective mean log10 of bacteria in the liver was 1.00, 3.13 and 2.48 cfu/g; in the lung 1.26, 2.90 and 2.56 cfu/g; in the spleen 1.00, 3.72 and 2.37 cfu/g; and in the right kidney 1.00, 2.88 and 2.85 cfu/g. Respective median apoptosis of lymphocytes within the first 24 hours from induction of pancreatitis was 22.58, 23.45 and 24.19% (P = NS) whereas respective median apoptosis of monocytes was 41.02, 43.66 and 47.92% (P = NS) and of neutrophils was 76.84, 79.49 and 83.94% (P = 0.034). Conclusions Survival in experimental necrotizing pancreatitis depends on the density of taurocholate. In spite of the existence of marginal differences in apoptosis of neutrophils occurring early during the course of the disease, it seems that apoptosis is not a major driver to death; instead, bacterial translocation seems to be the main route to death.
Introduction IFNγ is a promising immunomodulator in sepsis because it is thought it may reverse immunoparalysis and improve phagocytosis. Its effect was investigated in experimental pyelonephritis and sepsis. Methods Experimental pyelonephritis by Escherichia coli was induced in 18 rabbits after ligation of the right pelvo-ureteral junction and infusion of one 1 x 10⁷ log-phase cfu/ml inoculum above the ligation. Animals were assigned into 10 controls (group A) and into eight administered intravenously 0.1 μg/kg IFNγ 30 minutes after bacterial challenge (group B). Blood was sampled at serial time intervals; quantitative cultures were done; apoptosis of lymphocytes and of monocytes was assessed by flow cytometry; malondialdehyde (MDA) was estimated by the thiobarbiturate assay and passage through an HPLC system. After death, quantitative tissue cultures were done. Results Median survival of group A was 3 days and of group B was 18 days (log-rank: 4.858, P = 0.028). Mean log10 of bacteria in blood for groups A and B at 2 hours was 1.59 and 1.21 (P = NS); at 4 hours 1.61 and 1.97 (P = NS); at 24 hours 1.28 and 1.02; and at 48 hours 1.29 and 1.00 (P = NS). Respective rates of apoptosis of lymphocytes at 2 hours were 17.1 and 22.2% (P = NS); at 4 hours 17.9 and 24.0% (P = NS); at 24 hours 18.3 and 21.9% (P = NS); and at 48 hours 20.5 and 22.8% (P = NS). Respective rates of apoptosis of monocytes at 2 hours were 32.8 and 36.0% (P = NS); at 4 hours 42.8 and 39.3% (P = NS); at 24 hours 54.5 and 62.1% (P = NS); and at 48 hours 52.5 and 64.3% (P = 0.042). Respective median serum MDA of groups A and B were 1.05 and 2.06 μmol/ml at baseline (P = NS); 0.93 and 2.54 μmol/ml at 2 hours (p: 0.028); 2.30 and 1.02 μmol/ml at 4 hours (P = NS); 1.47 and 2.05 μmol/ml at 24 hours (P = NS); and 1.71 and 1.85 μmol/ml at 48 hours (P = NS). Mean log10 of bacterial growth in the liver of group A and of group B on sacrifice was 3.47 and 1.32, respectively (P = 0.043); and in the right kidney was 5.78 and 1.94, respectively (P = 0.004). Conclusions IFNγ prolongs survival when administered after induction of experimental pyelonephritis by E. coli. Its effect is mediated through: enhanced phagocytosis as evidenced by increase of oxidant stress and decrease of tissue bacterial load; and modulation of inflammation as evidenced by increase of apoptosis of monocytes. P251 Regulation of endothelial function by coagulation proteases in sepsis JN McLaughlin1, R Ramachandran2, AM Kaynar1, SD Shapiro1, DC Angus1, AB Malik2 1 University of Pittsburgh School of Medicine, Pittsburgh, PA, USA; 2University of Illinois at Chicago, IL, USA Critical Care 2011, 15(Suppl 1):P251 (doi: 10.1186/cc9671) Introduction Thrombin and activated protein C (aPC) are two pleiotropic proteases whose opposing functions in hemostasis and endothelial function are dysregulated during sepsis. Exogenous supplementation of aPC, the ligand for endothelial protein C receptor (EPCR), is the only known therapeutic shown to reduce mortality in severe septic patients. Paradoxically, both thrombin and aPC signal the endothelium via the same receptor, protease-activated receptor-1 (PAR-1), by cleaving its N-terminus to produce an identical tethered ligand, yet result in opposing signaling networks. Once activated, PAR-1 triggers at least three separate signaling pathways (Gi, Gq, G13) and it is the relative contribution of each pathway that determines the endothelial response. Thrombin is a potent proinflammatory, endothelial barrier disruptive agonist, while aPC induces an antiinflammatory and barrier protective phenotype, thought to be important to its therapeutic mechanism. We hypothesized that when bound to its ligand, aPC, EPCR functionally dimerizes with activated PAR-1, thereby altering its specificity for Gq, an important mediator of proinflammatory pathways in endothelial cells.
Critical Care 2011, Volume 15 Suppl 1 http://ccforum.com/supplements/15/S1
Methods We used bioluminescent resonance energy transfer to dynamically monitor the interaction of recombinant PAR-1 and EPCR in HEK cells. The effect of EPCR on PAR-1 G-protein selectivity was determined by EPCR siRNA knock down in cultured endothelial cells. Relative activation of Gq was determined by assaying agonist-induced intracellular calcium mobilization. G13 activation was determined by monitoring agonist-induced changes transendothelial electrical resistance across monolayers. Results We found that in the absence of protease ligands, unactivated PAR-1 dimerizes with EPCR. However, proteolytically activated PAR-1/ EPCR interaction was maintained with aPC but not thrombin. Both aPC and thrombin induced G13 signaling; however, aPC failed to activate Gq compared with thrombin. aPC-induced PAR-1/Gq signaling appears to be impaired by aPC-bound EPCR and is relieved when EPCR is depleted using siRNA. Conclusions aPC-bound EPCR neutralizes the proinflammatory function of PAR-1 signaling by maintaining interaction with activated PAR-1, thereby abrogating Gq signaling. Thus it is not the difference in protease activation between thrombin and aPC, but rather the ability of aPC to direct PAR-1/EPCR dimerization that controls PAR-1 signaling, and thereby provides the therapeutic barrier protective/antiinflammatory effects associated with aPC treatment. P252 Effect of HO-3089 PARP inhibitor on inflammatory response M Nemeth1, T Leiner1, K Tanczos1, A Mikor1, Z Molnar2, K Kovacs1 1 University of Pecs, Hungary; 2University of Szeged, Hungary Critical Care 2011, 15(Suppl 1):P252 (doi: 10.1186/cc9672) Introduction The activation of poly-ADP-ribose-polymerase enzyme (PARP) plays an important role in the pathophysiology of sepsis [1]. In previous animal models, lipopolysaccharide-induced systemic inflammatory response was significantly reduced by the inhibition of PARP [2]. The aim of our study was to investigate the effect of PARP inhibition on systemic inflammation in a septic animal model. Methods In a prospective, randomized study, anaesthetized CFY rats were divided into four groups (five/group): cecal ligation group (CL), cecal ligation and punction group (CLP), CLP with PARP inhibition (CLP+Pi) group and sham group. PARP inhibition was performed by HO-3089 (a novel PARP inhibitor) given intraperitoneally (10 mg/kg). Heart rate, invasive blood pressure and the rectal temperature were monitored. Data were recorded every 15 minutes. To identify the inflammatory response, IL-6 and TNFα were measured by quantitative sandwich enzyme immunoassay technique. Blood samples were taken before the CLP (t0), 2 hours (t1) and 6 hours (t2) after the CLP. Results IL-6 and TNFα were significantly higher in the CLP and CLP+Pi groups at t2 as compared with t0 (CLP: PIL-6 <0.001, PTNFα <0.001; CLP+Pi: PIL-6 = 0.002, PTNFα <0.001), and also as compared with the CL and sham groups at t2 (CL vs. CLP: PIL-6 <0.001, PTNFα = 0.002; CL vs. CLP+Pi: PIL = 0.008, PTNFα = 0.002; sham vs. CLP: pIL-6 <0.001, PTNFα = 0.002; sham vs. 6 CLP+Pi: PIL-6 = 0.011, PTNFα = 0.002). Although in the CLP+Pi group the IL-6 level was lower than in the CLP group at t2, but the difference was not significant (P = 0.074). There was no significant difference in TNFα between the CLP and CLP+Pi groups either. Conclusions The initial results of this study could not show a significant effect of the HO-3089 PARP inhibitor in CLP caused systemic inflammatory response. However, the tendency of lower IL-6 in the treated group warrants the completion of the experiment. References 1. 2.
Lobo SM, et al.: J Surg Res 2005, 129:292-297. Veres B, et al.: Biochem Pharmacol 2003, 65:1373-1382.
S89
septic patients. The aims of this study were to compare the influence of specific or selective polymeric adsorbents on endothelial cell activation and to test various adsorbents for binding of high mobility group box 1 (HMGB1), a late mediator in sepsis. Methods Human umbilical vein endothelial cells (HUVEC) were activated with a conditioned medium that was obtained by stimulation of monocytic THP-1 cells with 10 ng/ml lipopolysaccharide from Pseudomonas aeruginosa [1]. Mediator modulation was performed with either a specific adsorbent for TNFα, which is based on sepharose particles functionalized with anti-TNFα antibodies, or a selective albumin-coated polystyrene divinylbenzene copolymer (PS-DVB). Endothelial cell activation was monitored for up to 15 hours by measuring secretion of IL-6 and IL-8, as well as surface expression of the adhesion molecules ICAM-1 and E-selectin. In addition, PS-DVB beads and cellulose sulphate beads were screened for the binding of HMGB1. Results Adsorption of inflammatory mediators from the conditioned medium either with the specific TNFα adsorbent or with the selective PS-DVB beads resulted in decreased endothelial cell activation, as shown by statistically significant reduction of IL-6 and IL-8 secretion from HUVEC, as well as statistically significant reduction of surface expression of the adhesion molecules ICAM-1 and E-selectin. In the screening experiments, both PS-DVB beads and cellulose sulphate exhibited strong adsorption of HMGB1. Studies to test the effect of HMGB1 removal on endothelial activation in the cell culture model are underway. Conclusions Inflammatory mediator modulation with specific or selective adsorbents reduces endothelial cell activation and thus may support the development of new therapies for sepsis. Hydrophobic PSDVB resins as well as cellulose sulphate exhibit strong adsorption of HMGB1, a late mediator of sepsis. Reference 1.
P254 Honokiol attenuates the severity of acute pancreatitis-associated lung injury by acceleration of acinar cell apoptosis T Weng National Taiwan University, Taipei, Taiwan Critical Care 2011, 15(Suppl 1):P254 (doi: 10.1186/cc9674) Introduction Acute pancreatitis (AP) is a complicated immunological response that leads to multiple organ failure. Apoptosis is a beneficial form of cell death in AP. Acute lung injury is the most severe complication. Honokiol (HK) is a component of Asian herbal teas. It displays an anti-inflammatory and apoptotic induction effect. In the experiments, we investigated the therapeutic efficacy of HK in AP. Methods Adult BALB/c mice were divided into one control and five AP groups. Mice received six injections of cerulein at 1-hour intervals then on intraperitoneal injection (i.p.) of LPS for the induction of AP. Mice in the other groups had injections of cerulein and LPS as described above, but also received an i.p. of the different doses of HK 10 minutes after the first cerulein injection. Cytokine levels for the early and late inflammatory markers were obtained at 3 hours and 24 hours after the end of experiments. Results HK protected against the severity of AP in serum amylase/ lipase, TNFα, IL-6, HMGB1, and pancreas and lung pathological injury (Figure 1A). Acinar cell apoptosis was increased in the pancreas. Treatment with HK caused markedly increased acinar cell apoptosis (Figure 1B). Conclusions HK attenuates the severity of AP and lung injury by acceleration of acinar cell apoptosis. Reference 1.
P253 Inflammatory mediator modulation with specific or selective adsorbents A Schildberger, T Buchacher, V Weber, D Falkenhagen Danube University Krems, Austria Critical Care 2011, 15(Suppl 1):P253 (doi: 10.1186/cc9673) Introduction Modulation of inflammatory mediators with specific or selective adsorbents may represent a promising supportive therapy for
Schildberger et al.: Innate Immun 2010, 16:278-287.
Fried LE, et al.: Antioxid Redox Signal 2009, 11:1139-1148.
Critical Care 2011, Volume 15 Suppl 1 http://ccforum.com/supplements/15/S1
S90
perfusion of the muscular and mucosal layers of the intestinal wall was significantly reduced (for example, longitudinalis muscular layer: SHAM 143.5 ± 7.6 cm/cm2, CASP 77.1 ± 7.2 cm/cm2). Treatment of CASP animals with the CB1 receptor agonist ACEA reduced leukocyte adhesion (V1 venules: 107.4 ± 5.1 n/mm2), whereas CB2 receptor stimulation did not affect leukocyte adhesion. However, CB2 receptor inhibition by AM630 reduced leukocyte activation significantly (V1 venules: 60.0 ± 14.1 n/mm2) and restored capillary perfusion (longitudinal muscular layer: 114.1 ± 7.6 cm/cm2). Conclusions The data suggest that ECS signaling is involved in the impairment of the intestinal microcirculation during sepsis. Blocking CB2 receptor signaling reduces leukocyte activation and improves capillary perfusion in sepsis in rats. The long-term effect of ECS modulation needs further investigation. References 1. 2.
Varga K, et al.: FASEB J 1998, 12:1035-1044. Spronk PE, et al.: Crit Care 2004, 8:462.
P256 Desmopressin improves intestinal functional capillary density and decreases leucocyte activation in experimental endotoxemia in the rat L Wagner1, I Drzymulski1, D Pavlovic1, D Henzlers2, M Wendt1, C Lehmann2 1 Greifswald University, Greifswald, Germany; 2Dalhousie University, Halifax, Canada Critical Care 2011, 15(Suppl 1):P256 (doi: 10.1186/cc9676)
Figure 1 (abstract P254).
P255 Impact of modulation of the endocannabinoid system on the intestinal microcirculation in experimental sepsis C Lehmann, R Kuschnereit, I Kiister, J Zhou, S Whynot, O Hung, R Shukla, D Henzler, V Cerny, D Pavlovic, M Kelly Dalhousie University, Halifax, Canada Critical Care 2011, 15(Suppl 1):P255 (doi: 10.1186/cc9675) Introduction The endocannabinoid system (ECS) is upregulated during sepsis [1]. However, the functional outcomes of modulating endocannabinoid signaling during sepsis are currently unclear. Impairment of the intestinal microcirculation during sepsis may cause a breakdown of gut epithelial barrier function and bacterial translocation into the systemic circulation, increasing the systemic inflammatory response [2]. The aim of the present study was to examine the effects of CB1 and CB2 receptor modulation on the intestinal microcirculation in a model of polybacterial sepsis (colon ascendens stent peritonitis (CASP)) using intravital microscopy (IVM). Methods We studied six groups of animals (Lewis rats, n = 10 per group): sham operated controls (SHAM), septic controls (CASP), CASP animals treated with CB1 agonist ACEA (2.5 mg/kg i.v.), CASP animals treated with CB1 antagonist AM281 (2.5 mg/kg i.v.), CASP animals treated with CB2 agonist HU308 (2.5 mg/kg i.v.), and CASP animals treated with CB2 antagonist AM630 (2.5 mg/kg i.v.). All treatments were performed immediately after sepsis induction. IVM of the intestinal microcirculation was performed 16 hours following sepsis induction. Leukocyte adhesion and functional capillary density were measured in a blinded fashion. Results Following 16 hours of CASP-induced experimental sepsis, a significant increase of leukocyte adhesion in the intestinal submucosal venules (for example, collecting venules (V1): SHAM 35.7 ± 6.2 n/ mm2, CASP 214.4 ± 22.6 n/mm2, P <0.05) was observed. Capillary
Introduction The vasopressin analogue desmopressin (DDAVP), a selective agonist of the vasopressin V2 receptor, is known to cause vasodilatation in addition to its haemostatic effects. To verify whether desmopressin could be beneficial in sepsis we investigated its effects on intestinal microcirculation in experimental endotoxemia in rats. Methods In Lewis rats (six groups, 10 animals each) the effects of vasopressin (VAS) (0.06 U/340 g/minute) and DDAVP (1 μg/kg/ml) on the terminal ileum microcirculation 2 hours after introducing endotoxemia (5 mg/kg lipopolysaccharide (LPS), i.v.) were examined using intravital fluorescence microscopy. Results Although desmopressin administration (DES-group) increased the number of rolling leucocytes in V3 venules (P <0.05 vs. CON-group), the number of firmly adhering leucocytes in V1 venules of the LPSgroup was significantly reduced (LPS-group: 259 ± 25.7 vs. LPS+DESgroup: 203 ± 17.2 n/mm2; P <0.05) (Figure 1). Additionally, DDAVP treatment improved impaired functional capillary density (FCD) following LPS in all examined intestinal layers (P <0.001 vs. LPS-group), while the density of nonfunctional capillaries was significantly reduced (P <0.001 vs. LPS-group). Vasopressin administration deteriorated FCD in endotoxemic and non-endotoxemic rats (P <0.05 vs. CON-group or LPS-group). Three hours after LPS challenge, TNFα levels were
Figure 1 (abstract P256). Number of adherent leucocytes in venules (n/mm2). *P <0.001 for all LPS vs. all controls; #P <0.05 for LPS+DES vs. LPS.
Critical Care 2011, Volume 15 Suppl 1 http://ccforum.com/supplements/15/S1
reduced in both DDAVP-treated and vasopressin-treated LPS-groups (LPS-group: 429 ± 119; LPS+DES-group: 262 ± 21.9; LPS+VAS-group: 249 ± 46.5 pg/ml; P <0.05). Conclusions Desmopressin administration improved microvascular perfusion and reduced inflammatory response in experimental endotoxemia. P257 Hypoxic NO-donor nitrite protects sGC-dependently against morbidity and mortality associated with sterile inflammatory shock in mice A Cauwels1, B Vandendriessche1, E Rogge1, S Shiva2, P Brouckaert1 1 UGent & VIB, Gent, Belgium; 2University of Pittsburgh, PA, USA Critical Care 2011, 15(Suppl 1):P257 (doi: 10.1186/cc9677) Introduction For a long time nitrite (NO2–) was believed to be an inert metabolite of the endogenous vasodilator NO. Recently, however, nitrite was identified as an important biologic NO reservoir in vasculature and tissues, contributing to hypoxic signaling, vasodilation and cytoprotection after ischemia–reperfusion injury. Reduction of nitrite to NO may occur enzymatically at low pH and oxygen tension by deoxyhemoglobin or deoxymyoglobin, xanthine oxidase, mitochondria or NO synthase. Considering that NO may exert protective effects in inflammatory and septic shock, and that circulating nitrite may function as a source of NO in hypoxic and/or acidic conditions present in ischemic microvasculature of vital organs during shock, we decided to test the protective capacity of nitrite on toxicity associated with inflammatory shock. Methods We studied sterile models of shock (induced by intravenous TNF or LPS) and a septic CLP model in female C57Bl/6 mice. NaNO2 treatments were done intravenously. To monitor morbidity, rectal body temperatures were measured and mortality was recorded. In addition, mice were sacrificed 2 or 6 hours after challenge to analyze serum markers for organ damage, as well as mitochondrial parameters, ATP
S91
production and infiltration of myeloid cells. Hemodynamic parameters were determined in conscious mice via radiotelemetry, using PA-C10 probes (Data Sciences International). Results Low doses of nitrite significantly ameliorated hypothermia, organ damage and mortality induced by a lethal TNF challenge. Mechanistically, nitrite-dependent protection was associated with improved mitochondrial functioning, demonstrated by complex I, complex IV and aconitase activities in the liver and heart. In addition, nitrite protection was largely abolished in mice deficient for the α1-subunit of soluble guanylate cyclase (sGCα1), one of the principle intracellular NO receptors and signal transducers in the cardiovasculature. Interestingly, nitrite delayed and attenuated TNFinduced bradycardia and hypotension as well. In addition, higher doses of nitrite could also protect against toxicity induced by Gram-negative LPS, but not against mortality induced by CLP. Conclusions We show that nitrite can protect against mitochondrial and organ damage in inflammatory sterile shock via sGC-dependent signaling. This may include hypoxic vasodilation, necessary to maintain microcirculation and organ function, as well as cardioprotection.
P258 Interplay between the innate immune response and heart rate variability in healthy human volunteers M Kox, BP Ramakers, JC Pompe, JG Van der Hoeven, CW Hoedemaekers, P Pickkers Radboud University Nijmegen Medical Centre, Nijmegen, the Netherlands Critical Care 2011, 15(Suppl 1):P258 (doi: 10.1186/cc9678) Introduction The autonomic nervous system (ANS) and innate immunity are intimately linked. Heart rate variability (HRV) analysis is a widely employed method to assess cardiac ANS activity, and changes in HRV indices may correlate with inflammatory markers. Here, we investigated whether baseline HRV predicts the innate immune
Figure 1 (abstract P258). Association between basal HRV indices (calculated at t = 0, just prior to LPS administration) and area under curve of the LPSinduced proinflammatory cytokine response (TNFα and IL-6, log pg/ml/hour) of 40 subjects. ms, milliseconds; AU, arbitrary units. Solid and dashed lines, TNFα and IL-6 regression lines, respectively. Pearson correlation coefficients (none statistically significant) indicated.
Critical Care 2011, Volume 15 Suppl 1 http://ccforum.com/supplements/15/S1
response. Second, we investigated whether the magnitude of the inflammatory response correlated with HRV alterations. Methods Forty healthy volunteers received a single intravenous bolus of 2 ng/kg endotoxin (lipopolysaccharide (LPS), derived from Escherichia coli O:113). Of these, 12 healthy volunteers were administered LPS again 2 weeks later. HRV was determined at baseline (just prior to LPS administration) and hourly thereafter until 8 hours post LPS. Plasma cytokine levels were determined at various time points. Results Baseline HRV indices did not correlate with the magnitude of the LPS-induced inflammatory response. Despite large alterations in HRV following LPS administration, the extent of the inflammatory response did not correlate with the magnitude of HRV changes. In subjects that were administered LPS twice, inflammatory cytokines were markedly attenuated following the second LPS administration, while LPS-induced HRV alterations were similar. See Figure 1. Conclusions HRV indices do not predict the innate immune response in a standardized model of systemic inflammation. The innate immune response results in HRV changes; however, no correlations with inflammatory cytokines were observed. These findings suggest that cardiac ANS activity may not reflect ANS outflow to other organs involved in the innate immune response. Furthermore, the magnitude of endotoxemia-related HRV changes does not reflect the extent of the inflammatory response.
P259 Dysregulation of immune monocyte responses during sepsis D Fiume, G Caiazza, V Tsekeuli, A Sinistro, C Almerighi, F Calo’-Carducci, E Baffari, A Bergamini, S Natoli, F Leonardis Policlinico Roma Tor Vergata, ICU, Rome, Italy Critical Care 2011, 15(Suppl 1):P259 (doi: 10.1186/cc9679) Introduction Despite intense efforts, sepsis remains a serious clinical problem, accounting for thousands of deaths every year. Many findings have shown that immune dysfunction in septic patients plays a very important role. Thus, a better understanding of the basic immune alterations in sepsis is needed to appropriately direct therapy. Here we sequentially measured TNFα, IL-1B, IL-6 and IL-10 de novo synthesis by monocytes via multiparametric flow cytometry and monocyte expression of surface molecules that allow effective antigen presentation, in patients with severe sepsis and septic shock up to 12 days after admission. Methods Twenty-five patients and 15 healthy, age and sex matched control subjects were enrolled. Each patient met the following criteria: an identifiable site of infection; two or more systemic inflammatory response syndrome criteria. Septic shock was defined as severe hypotension that lasts 1 hour, despite adequate fluid resuscitation and pharmacologic intervention with vasopressor agents. Cell stimulation PBMC from patients and controls were cultured for 18 hours in the presence of 100 ng/ml LPS and analysed by FACS to determine cell surface antigen expression and intracellular cytokine production. Results Cytokine production by monocytes during sepsis Monocytes from septic patients produced significantly higher amounts of IL-1B, TNFα and IL-6, but not IL-10 as compared with controls. In addition, monocytes from patients with septic shock responded to LPS stimulation with increased IL-1B, TNFα and IL-6 production with respect to cells from patients without septic shock. Serum cytokine levels All cytokines were readily detectable in septic patients. Effect of sepsis on surface molecule expression Monocyte CD80, CD86 and HLADR expression was significantly decreased in patients with sepsis as compared with healthy subjects. As opposed, the expression of ILT4 was significantly increased in septic patients as compared with healthy controls. Conclusions It has been postulated that the immune response in sepsis represents the interplay of two contrasting phenomena: the early systemic inflammatory response syndrome followed by the late appearance of a compensatory anti-inflammatory response syndrome. The findings reported here suggest a scenario, characterized by the contemporary development of an intense proinflammatory reaction and a marked alteration of the phenotype of antigen-presenting cells.
S92
P260 Different correlations between lymphocyte subsets from patients with intra-abdominal sepsis and pneumonia-derived sepsis TS Skirecki, UZ Zielińska-Borkowska, MZ Złotorowicz, JK Kawiak, GH Hoser Medical Center of Postgraduate Education, Warsaw, Poland Critical Care 2011, 15(Suppl 1):P260 (doi: 10.1186/cc9680) Introduction Although there has been progress in understanding the immunopathology of sepsis, the mortality rates remain high and there is still a lack of effective immunomodulatory therapies. Possible reasons include heterogeneity of septic patients and inefficiency of methods of monitoring the immune system status [1]. Most of both the experimental and clinical studies do not distinguish sepsis based on the primary sites of infection. Therefore, we studied the differences in the cellular immune response during sepsis originating from pneumonia and peritonitis. Methods Blood samples were obtained from 34 patients treated in our ICU in the first days of sepsis, severe sepsis or septic shock. Intraabdominal sepsis (IAS) was diagnosed when SIRS symptoms with intra-abdominal, postoperative infection source occurred. Pneumoniaderived sepsis (PDS) diagnosis was based on SIRS accompanied by CXR lung consolidation. Samples were stained with the panel of antibodies against: CD45/CD14, CD3/CD19, CD3/CD4, CD3/CD8, CD3/CD16+56 and isotypic control. Cells were analysed by flow cytometry and total cell count per microliter was calculated. Comparative and simple regression statistical analyses were performed. Results Fourteen patients were diagnosed with IAS and eight with PDS. Etiology of most IAS was Gram-negative, while Gram-positive in PDS. The mortality rate was higher in PDS. Monocyte absolute number and white blood count were the only variables with statistically significant differences between IAS and PDS. The correlations between number of lymphocytes and monocytes, CD3+, CD4+ and CD19+ were high in both groups of patients. However, in IAS no correlation was found between the number of either cytotoxic CD8 lymphocytes and NK cells with lymphocyte count. Interestingly, a high correlation for the number of CD8+ and NK cells exists in both IAS and PDS patients. Conclusions Our results indicate differences in the immune response during sepsis originating from respiratory and abdominal infections. Independent correlations between NK cells and cytotoxic lymphocytes suggest existence of shared mechanisms of their regulation. Reference 1.
Monneret G, et al.: Mol Med 2008, 14:64-78.
P261 AZD9773 is a novel and potent anti-TNFα polyclonal ovine immune Fab P Newham, P Ceuppens, G Davies, J Growcott AstraZeneca, Macclesfield, UK Critical Care 2011, 15(Suppl 1):P261 (doi: 10.1186/cc9681) Introduction The release of cytokines into the circulation is an essential part of the inflammatory cascade that underlies sepsis. Experimental and clinical data have shown that the proinflammatory cytokine TNFα is a principal mediator of this cascade [1-3]. The investigational drug AZD9773, intended for intravenous infusion, contains ovine immune fragments (Fabs) of IgG that bind to human (hu)-TNFα. Here we describe the in vitro and in vivo pharmacology of AZD9773. Methods AZD9773 binding to human TNFα was assessed using surface plasmon resonance (SPR) technology. AZD9773 functional potency was profiled versus recombinant human (r-hu)-TNFα and natural (WHO International Standard) (n)-TNFα in TNFα-mediated cytotoxicity assays using the L929 cell line. Finally, humanised mice (Tg1278/TNF–/–: hu-TNFα transgenic, murine TNFα null) were used to assess AZD9773 effects on endotoxin-induced serum cytokines, chemokines and related factors. Results SPR assays revealed that r-hu-TNFα bound to immobilised AZD9773 total Fabs with an equilibrium dissociation constant (Kd) of ~60 nM. AZD9773 neutralised both r-hu-TNFα and n-TNFα biological activity in the L929 cytotoxicity assays. AZD9773 neutralised r-hu-TNFα with an apparent inhibitory constant (Ki) of approximately 40 pM. In humanised mice, AZD9773 produced a statistically significant
Critical Care 2011, Volume 15 Suppl 1 http://ccforum.com/supplements/15/S1
S93
reduction in 29 out of 60 serum cytokines and related factors (including hu-TNFα and murine IL-6). Conclusions AZD9773 is a potent TNFα neutralising ovine immune Fab and, considering the modest AZD9773:TNFα binding affinity, these data indicate that there is significant synergy in neutralising TNFα bioactivity between the polyclonal anti-TNFα species that comprise AZD9773. The in vivo suppression of 29 out of 60 induced serum cytokines, chemokines and related factors confirms the significant role for TNFα in eliciting acute endotoxin responsiveness. References 1. 2. 3.
Marshall: Nat Rev Drug Discov 2003, 2:391-405. Balk et al.: Crit Care Clin 1989, 5:1-8. Bone et al.: Crit Care Med 1989, 17:389-393.
P262 Preclinical pharmacodynamics and safety profiling of AZD9773: a novel anti-TNFα polyclonal immune ovine Fab similar to D-CytoFab P Newham1, J Yates1, S Das1, J Kemp1, J Young1, P Ceuppens1, F Brennan2, R Knight1, J Growcott1 1 AstraZeneca, Macclesfield, UK; 2Present address: Novartis, Basel, Switzerland Critical Care 2011, 15(Suppl 1):P262 (doi: 10.1186/cc9682) Introduction The critical pathophysiological trigger of sepsis is thought to be a disturbance in the equilibrium between the proinflammatory response and concomitant anti-inflammatory mechanisms. Data show that the proinflammatory cytokine TNFα is a principal mediator of sepsis [1,2]. AZD9773 is a sterile lyophilised powder for solution for i.v. infusion containing ovine immune fragments (Fabs) of IgG that bind to human TNFα. We explored the PD and safety profile of AZD9773 in cynomolgus monkeys. AZD9773 PD data are compared with D-CytoFab (a similar ovine anti-TNFα IgG immune Fab product) that showed clinical benefit in a phase IIb study [3]. Methods AZD9773 binding and neutralisation of primate TNFα were assessed using surface plasmon resonance and TNFα-mediated cytotoxicity assay using L929 cells, respectively. AZD9773 did not show any unexpected binding to frozen primate tissue. The in vivo ability of either AZD9773 or D-CytoFab to suppress TNFα-mediated effects was determined by the inhibition of endotoxin-induced TNFα and IL-6 production in cynomolgus monkeys. A mathematical (PK-PD) model was constructed to describe the cytokine PD profile. Safety assessments included monitoring electrocardiogram outputs, heart rate, blood pressure and toxicology indices in cynomolgus monkeys administered with AZD9773. Results There was no significant difference between AZD9773 and D-CytoFab in the binding of primate TNFα in vitro, and AZD9773 and D-CytoFab neutralised recombinant primate TNFα with only a twofold and 1.8-fold reduction in potency, respectively, compared with recombinant human TNFα. Both AZD9773 and D-CytoFab at equivalent doses with comparable exposure significantly suppressed endotoxininduced IL-6 production in cynomolgus monkeys to a similar extent. PK-PD analysis revealed the effect of AZD9773 and D-CytoFab on serum TNFα and IL-6 levels and estimated model parameters were not significantly different. No toxicologically significant findings were observed in cynomolgus monkeys with AZD9773 at doses significantly higher than those currently under clinical investigation. Conclusions Preclinical data indicate that AZD9773 has a good safety profile and is a well-tolerated anti-TNFα immune Fab product with PD characteristics similar to D-CytoFab.
References 1. 2. 3.
Crit Care Clin 1989, 5:1. Crit Care Med 1989, 17:389. Crit Care Med 2006, 34:2271.
P263 Safety and tolerability of an ovine-derived polyclonal anti-TNFα Fab fragment (AZD9773) in patients with severe sepsis P Morris1, B Zeno2, A Bernard3, X Huang4, S Simonson5, G Bernard6 1 Wake Forest University School of Medicine, Winston Salem, NC, USA; 2 Riverside Methodist Hospital, Columbus, OH, USA; 3University of Kentucky, Lexington, KY, USA; 4AstraZeneca Charnwood, Loughborough, UK; 5 AstraZeneca, Wilmington, DE, USA; 6Vanderbilt University, Nashville, TN, USA Critical Care 2011, 15(Suppl 1):P263 (doi: 10.1186/cc9683) Introduction Sepsis remains a significant medical problem. TNFα is a central cytokine in sepsis pathophysiology. We conducted a phase IIa trial in patients with severe sepsis to assess the safety and tolerability of an intravenously infused ovine-derived polyclonal anti-TNFα Fab fragment (AZD9773). Methods This was a double-blind, placebo-controlled, dose-escalation trial (NCT00615017) with 2:1 randomisation (active:placebo). Two single-dose cohorts (50 units/kg and 250 units/kg) and three multipledose cohorts (250 units/kg followed by nine doses of 50 units/kg every 12 hours, 500 units/kg followed by nine doses of 100 units/kg, 750 units/kg followed by nine doses of 250 units/kg) were studied. Safety was assessed by monitoring adverse events (AEs), mortality, and laboratory safety measures, including formation of human anti-sheep antibodies (HASA) and their association with AEs. Results A total of 70 patients were studied. The mean age was 56 years, 46% were male, and the mean APACHE II score was 26. About 50% of patients had two organ failures (both respiratory and cardiovascular). Multiple doses of AZD9773 reduced circulating TNFα towards the limit of detection in most patients throughout the 5 days of dosing. The most common serious AEs were mainly related to the underlying illness and included: sepsis, pneumonia, septic shock and respiratory failure across all groups. Table 1 summarises the safety outcomes. Development of HASA did not appear to be associated with either decreased TNFα reduction or specific AEs. Conclusions Administration of AZD9773 in patients with severe sepsis reduced circulating TNFα levels and had a safety profile similar to placebo administration. A larger randomised phase IIb clinical trial (NCT01145560) is ongoing to further characterise the safety and efficacy of AZD9773 in patients with severe sepsis. P264 Evaluation of eritoran tetrasodium (E5564), a TLR4 antagonist, on the QTc interval in healthy subjects CF Nagy, M Lynn, J Gogate Eisai, Inc., Woodcliff Lake, NJ, USA Critical Care 2011, 15(Suppl 1):P264 (doi: 10.1186/cc9684) Introduction Eritoran tetrasodium (E), a TLR4 antagonist, is currently being evaluated in phase 3 as a treatment for severe sepsis and has been well tolerated in clinical trials [1]. The primary objective of this study was to evaluate the effect of E on QTc in healthy subjects. Methods This was a single 12-hour intravenous infusion, double-blind, placebo-comparator and active-comparator controlled, parallel-group
Table 1 (abstract P263). Safety outcomes with AZD9773 administration Single-dose cohorts combined (n = 17) Mortality, n (%) Any treatment-emergent AEs
Multiple-dose cohorts combined (n = 30)
Placebo (n = 23)
6 (35%)
7 (23%)
6 (26%)
17 (100%)
27 (90%)
23 (100%)
Treatment-emergent AEs related to study drug
2 (12%)
7 (23%)
10 (43%)
Patients with any serious AEs
9 (53%)
14 (47%)
13 (57%)
Critical Care 2011, Volume 15 Suppl 1 http://ccforum.com/supplements/15/S1
study. Subjects were randomized to: Arm A, E 2.3 mg/hour (a therapeutic (T) total dose of 28 mg); Arm B, E 7 mg/hour (a supratherapeutic (S) total dose of 84 mg); Arm C, placebo; or Arm D, placebo + moxifloxacin (M) 400 mg p.o. The primary outcome parameter was the placebocorrected change from baseline in QTcF (ΔΔQTcF) based on the largest time-matched mean difference 10, 12, 14, 16, 18, 24, 36, and 48 hours after the start of infusion. Categorical and pharmacokinetic (PK)/ pharmacodynamic (PD) evaluations were performed. Adverse events were reported. Results Two hundred subjects (mean age 33.4 years; 81.5% male) were randomized. In the M group, the increase in QTcF from baseline (ΔQTcF) consistently exceeded placebo (maximum ΔΔQTcF 11.4 ms at 4 hours postdose). The lower bound of the one-sided 95% confidence limit was >5 ms at each time point between 2 and 8 hours postdose, indicating the study’s sensitivity to demonstrate small QTc effects. The largest mean ΔΔQTcF for E was 2.1 ms (84 mg, 12 hours) and 1.6 ms (28 mg, 48 hours). The upper limit of the two-sided 90% CI (one-sided 95% CI) for the mean difference did not exceed 4.6 ms and all 90% CIs were inclusive of zero. No subject in either E group had a ΔQTcF exceeding 30 ms and only one subject in the E 84 mg group had a single QTcF >450 ms at 16 hours. QTcB, QTci, categorical, and PK/PD results all confirmed those from the primary analysis. There was no obvious correlation between QTcF and plasma E concentration. E 28 mg or 84 mg was safe and well tolerated, with mild headache most frequently reported in the placebo (9.6%) and E 28 mg (8.7%) groups, injection site hemorrhage in the E 84 mg group (6.1%), and nausea in the M group (3.8%). Conclusions At either a T or S dose of E, a QTc effect exceeding 5 ms could be excluded. The upper bound of the 95% one-sided CI for ΔΔQTcF was <10 ms at both the S and T doses of E, indicating this is a negative thorough QT/QTc study. Reference 1.
ACCESS: A Controlled Comparison of Eritoran Tetrasodium and Placebo in Patients with Severe Sepsis [http://clinicaltrials.gov/ct2/show/NCT00334828 ?term=eritoran&rank=2]
S94
subjects. Eritoran was distributed mainly to the HDL fraction in both Japanese and Caucasian subjects. Conclusions Eritoran was safe and well tolerated in healthy Japanese and Caucasian subjects. The data do not indicate any need for clinical dose adjustment for possible ethnic-based differences in drug distribution or metabolism. References 1. 2. 3.
Opal SM: Int J Med Microbiol 2007, 297:365-377. Kim HM, et al.: Cell 2007, 130:906-917. ACCESS: A Controlled Comparison of Eritoran Tetrasodium and Placebo in Patients with Severe Sepsis [http://clinicaltrials.gov/ct2/show/NCT00334828 ?term=eritoran&rank=2]
P266 Dipyridamole modulates the innate immune response during human endotoxemia B Ramakers, NP Riksen, TH Stal, S Heemskerk, P Van den Broek, JG Van der Hoeven, P Smits, P Pickkers Radboud University Nijmegen Medical Centre, Nijmegen, the Netherlands Critical Care 2011, 15(Suppl 1):P266 (doi: 10.1186/cc9686) Introduction Previous studies have shown that the endogenous nucleoside adenosine is able to modulate inflammation and to prevent associated organ injury. Dipyridamole, an adenosine reuptake inhibitor, increases extracellular adenosine concentrations during unfavorable conditions (for example, inflammation), and as such may modulate the inflammatory response. We examined the effects of dipyridamole treatment on innate immunity during human experimental endotoxemia. Methods In a randomized double-blind placebo-controlled study, 20 healthy subjects received 2 ng/kg Escherichia coli endotoxin
P265 Safety, pharmacokinetics, and pharmacodynamics of 4-hour intravenous infusion of eritoran tetrasodium in healthy Japanese and Caucasian males Y Okubo1, N Aikawa2, M Lynn1, DP Rossignol1, YN Wong3, E Schuck3, Y Kitahara4, T Nakano4, O Sivak5, KM Wasan5, C Nagy1 1 Eisai, Inc., Woodcliff Lake, NJ, USA; 2Emergency and Critical Care Medicine, School of Medicine, Keio University, Tokyo, Japan; 3Eisai, Inc., Andover, MA, USA; 4Eisai Co., Ltd, Tokyo, Japan; 5The University of British Columbia, Vancouver, Canada Critical Care 2011, 15(Suppl 1):P265 (doi: 10.1186/cc9685) Introduction Activation of TLR4 signaling by endotoxin is believed to be a primary mediator of sepsis and septic shock, via excessive production of cytokines and proinflammatory mediators [1]. Eritoran tetrasodium (hereafter eritoran), a synthetic analog of the endotoxin constituent lipid A, binds to the TLR4/MD-2 complex and thereby blocks the interaction of endotoxin with TLR4 [2]. Eritoran is being investigated for the treatment of severe sepsis [3]. We report results of a study conducted to assess the single-dose safety and tolerability, as well as pharmacokinetics and pharmacodynamics, of eritoran infusion in Japanese and Caucasian healthy adult males. Methods This was a double-blind, randomized, single-center, placebocontrolled, ascending single-dose, sequential-group study. Sixty-four subjects (aged 20 to 45 years; BMI 18 to 30 kg/m2) were randomized to four groups: 4 mg total dose (n = 12); 12 mg total dose (n = 24); 28 mg total dose (n = 12); placebo (n = 16). Adverse events were recorded by the investigator. Laboratory assessments included standard hematology and clinical chemistry, lipid analysis, and urinalysis. Results There were no serious adverse events. Eritoran in single doses up to 28 mg over 4 hours was well tolerated, with no apparent ethnic differences noted. Plasma concentrations were slightly higher, while clearance and volume of distribution were lower, in Japanese versus Caucasian subjects; these differences were not significant after adjustment for differences in body weight. The ex vivo endotoxin inhibitory activity of eritoran was similar in Japanese and Caucasian
Figure 1 (abstract P266). Cytokine response following endotoxemia.
Critical Care 2011, Volume 15 Suppl 1 http://ccforum.com/supplements/15/S1
intravenously following 7-day pretreatment with dipyridamole, 200 mg retard twice daily, or placebo. Results Nucleoside transporter activity was significantly reduced by dipyridamole treatment with 89 ± 2% (P <0.0001) and resulted in significantly augmented endogenous adenosine levels. Plasma concentrations of dipyridamole correlated with the peak adenosine concentration 2 hours after LPS administration (r = 0.82, P = 0.0038) and significantly augmented the anti-inflammatory IL-10 response during endotoxemia (P <0.0001; Figure 1), an effect that correlated with the dipyridamole-induced increase in adenosine (r = 0.82; P = 0.0035). Finally, IL-10 peak concentrations were associated with a more pronounced decline in TNFα (r = 0.54, P = 0.018). Conclusions Dipyridamole treatment increases adenosine concentrations during systemic inflammation associated with an augmented anti-inflammatory response and a faster decline in TNFα during human experimental endotoxemia. P267 Use of statins in community-acquired pneumonia in intensive care settings: is there a survival advantage? A Khanna, R Gibbs, S Webster, H Al-shather Musgrove Park Hospital, Somerset, UK Critical Care 2011, 15(Suppl 1):P267 (doi: 10.1186/cc9687) Introduction Use of statins in community-acquired pneumonia (CAP) and exacerbation of COPD has been widely studied [1-3]. Whilst there may be some outcome benefit with the use of statins in exacerbation of COPD, their role in CAP remains less clear. There are no studies looking at outcome benefits from statin use in patients with CAP who are admitted to the intensive therapy unit (ITU). Therefore, we conducted a retrospective cohort analysis looking at statin use and outcomes in patients with CAP admitted to our ITU. Methods We retrospectively analysed 200 consecutive admissions to our ITU who had an admission diagnosis of CAP. Use of statins in those diagnosed with CAP was determined and its relation to length of stay and in-patient mortality was assessed. Baseline patient characteristics, disease severity scores, dose and type of statin prescribed were also considered. Results Out of the total 200 patients with a coded diagnosis of CAP, 108 patients (54%) had CAP on notes review. Statins were prescribed in 43 (39.8%) of these patients. Statins were prescribed more often in patients >65 years old. Baseline characteristics were similar in both groups (>60 years: 62% vs. 65%, P = 0.7; CURB 65 2 to 3: 48% vs. 50%, P = 0.8; APACHE II <10: 16% vs. 20%, P = 0.5; APACHE II 10 to 20: 43% vs. 42%, P = 1.00, APACHE II >20: 41 vs. 38, P = 0.7). The male:female ratio in our cohort was 1:1.3 (43% vs. 57%). Overall, in-hospital mortality in this CAP cohort was 45% (n = 48). This was higher than the previously reported studies [4]. We believe this represents the higher average age of the population with more accumulated co-morbidities that we cater for. Simvastatin was the most commonly prescribed statin (66% patients) in varying dosages (10 to 80 mg OD). There was no statistically significant difference in mortality between those who received statins and those who did not (55% vs. 47%, P = 0.29). Length of stay amongst survivors was similar in both groups (<7 days: 58% vs. 61%, P = 0.7; 7 to 14 days: 39% vs. 33%, P = 0.4; >14 days: 3% vs. 6%, P = 0.4). Conclusions According to this retrospective cohort study, use of statins in patients admitted to the ITU with a diagnosis of communityacquired pneumonia does not seem to provide any statistically significant survival benefit. Also, there seems to be no benefit in terms of total length of stay amongst survivors. References 1. 2. 3. 4.
Hothersall E, et al.: Thorax 2006, 61:729-734. Mortensen EM, et al.: Resp Res 2009, 10:45. Siempos II, et al.: J Antimicrob Chemother 2008, 62:661-668. Laterre P-F, et al.: Crit Care 2008, 12(Suppl 6):S1.
S95
P268 Atorvastatin for preventing the progression of sepsis to severe sepsis (ASEPSIS Trial): a randomised, double-blind, placebocontrolled trial (ISRCTN64637517) JM Patel, C Snaith, D Thickett, L Linhortova, T Melody, P Hawkey, T Barnett, A Jones, T Hong, G Perkins, M Cooke, F Gao-Smith Heart of England NHS Foundation Trust, Birmingham, UK Critical Care 2011, 15(Suppl 1):P268 (doi: 10.1186/cc9688) Introduction Statins have pleiotrophic effects independent of their lipid-lowering properties and may modulate the pathophysiology of sepsis, prevent sepsis progression and improve outcomes [1]. This study evaluated the acute use of Atorvastatin in reducing sepsis progression compared with placebo in statin-naive individuals. Methods A single-centre, randomised placebo-controlled, doubleblind trial (RCT). Ethical approval and consents were obtained. Patients with sepsis, based on the Surviving Sepsis Campaign Guidelines (SSCG), were randomised to Atorvastatin 40 mg daily or placebo for length of hospital stay or 28 days if earlier. Patients on statins were excluded. Primary outcome was progression to severe sepsis, defined by the SSCG. Results One hundred patients were consented and randomised, 49 to Atorvastatin and 51 to placebo. Both were well matched for all baseline characteristics. The Atorvastatin group had a lower rate of sepsis progression P = 0.007 (Figure 1). The 28-day and 1-year mortalities were similar with an overall 12% mortality. There was no difference in 28day readmissions (P = 0.83); however, 1-year readmissions were higher in the placebo group (P <0.001). A rise in matrix metallopeptidase 9 (P = 0.01) at day 4 was observed in the Atorvastatin group.
Figure 1 (abstract P268). Percentage of patients progressing to severe sepsis (%).
Conclusions This is the first RCT to show that the acute use of Atorvastatin can prevent sepsis progression in statin-naive individuals. A multicentred RCT is required to elucidate the mechanisms and clinical applications of these findings. Reference 1.
Janda S, et al.: J Crit Care 2010, 25:656e7-656e22.
P269 Kinetics of immunoglobulins in septic shock patients C Siqueira, C David, C David University Hospital, Rio de Janeiro, Brazil Critical Care 2011, 15(Suppl 1):P269 (doi: 10.1186/cc9689) Introduction The mechanisms of sepsis are not understood in all aspects. We decided to measure the IgG and IgM serum level in these patients and tried to correlate our results with the mortality rate and also to establish the medium time in the blood of these immunoglobulins.
Critical Care 2011, Volume 15 Suppl 1 http://ccforum.com/supplements/15/S1
Methods We selected patients according to the Bonne and colleagues classification of septic shock. As soon as the patients were selected we took samples at entrance, day 1, day 4 and day 8. We measured the serum level of IgG and IgM of all patients. There were 189 patients studied from 360 with septic shock. We excluded 171 patients for three reasons: they were neutropenic, had transfusions for <1 month or had recently undergone chemotherapy. Septic patients represented 17% of all patients in the ICU. Results From these 189 selected patients we had a mortality rate of 59 patients, which means 31%. From these patients 29 had combined deficiency of IgG and IgM levels, 17 had only IgG deficiency and 13 had IgM deficiency. We considered a deficient value as levels less than the minimum level for immunoglobulins according to our nephelometry measurement. Conclusions Despite the fact that we had a small number of patients we can conclude that these measurements could be considered good prognostic markers, not only in terms of mortality rate but also to demonstrate that IgG and IgM levels do not have the 21 and 7 days of medium time in the circulation we can see in normal patients. Probably in the near future we could include immunoglobulin determination on a routine basis for septic shock patients. References 1. 2.
Marshall J, Cohen J: Immune Response in the Critically Ill. Springer Verlag; 2002. Ulevitch RL: Endotoxin opens the tollgates to innate immunity. Nat Med 1999, 5:144-145.
P270 Whole blood lactate kinetics in patients undergoing quantitative resuscitation for septic shock MA Puskarich1, S Trzeciak2, N Shaprio3, A Heffner1, JA Kline1, AE Jones1 1 Carolinas Medical Center, Charlotte, NC, USA; 2Cooper University Hospital, Camden, NJ, USA; 3Beth Israel Deaconess Medical Center, Boston, MA, USA Critical Care 2011, 15(Suppl 1):P270 (doi: 10.1186/cc9690) Introduction We sought to compare the association of whole blood lactate kinetics with survival in patients with septic shock undergoing early quantitative resuscitation. Methods Preplanned analysis of a multicenter emergency department (ED)-based randomized control trial of early sepsis resuscitation targeting three physiological variables: central venous pressure, mean arterial pressure, and either central venous oxygen saturation or lactate clearance. Inclusion criteria: suspected infection, two or more systemic inflammatory response syndrome criteria, and either SBP <90 mmHg after a fluid bolus or lactate >4 mmol/l. All patients had a lactate measured initially and subsequently at two hours. Normalization of lactate was defined as a lactate decline to <2.0 mmol/l in a patient with an initial lactate ≥2.0. Absolute lactate clearance (initial – delayed value), and relative ((absolute clearance) / (initial value) x 100) were calculated if the initial lactate was ≥2.0. The primary outcome was in-hospital survival. Receiver operating characteristic (ROC) curves were constructed and the area under the curve (AUC) was calculated. Differences in proportions of survival between the two groups at different lactate cutoffs were analyzed using 95% confidence intervals and Fisher exact tests. Results Of 272 included patients, median initial lactate was 3.1 mmol/l (IQR 1.7, 5.8), and median absolute and relative lactate clearance were 1 mmol/l (IQR 0.3, 2.5) and 37% (IQR 14, 57). An initial lactate >2.0 mmol/l was seen in 187/272 (69%), and 68/187 (36%) patients normalized their lactate. Overall mortality was 19.7%. AUCs for initial lactate, relative lactate clearance, and absolute lactate clearance were 0.70, 0.69, and 0.58, respectively. Lactate normalization best predicted survival (OR = 6.1, 95% CI = 2.2 to 21), followed by lactate clearance of 50% (OR = 4.3, 95% CI = 1.8 to 10.3), initial lactate of <2 mmol/l (OR = 3.4, 95% CI = 1.5 to 7.8), and initial lactate <4 mmol/l (OR = 2.3, 95% CI = 1.3 to 4.3), with lactate clearance of 10% not reaching significance (OR = 2.3, 95% CI = 0.96 to 5.6). Conclusions In ED sepsis patients undergoing early quantitative resuscitation, normalization of serum lactate during resuscitation was more strongly associated with survival than any absolute value or absolute/ relative change in lactate. Further studies should address whether strategies targeting lactate normalization leads to improved outcomes.
S96
P271 Plasma DNA concentration as an early predictor of outcome in critically ill septic patients H El-Akabawy, W Radwan, S Gengeehy, A Rezk, A Sisi Cairo University, Cairo, Egypt Critical Care 2011, 15(Suppl 1):P271 (doi: 10.1186/cc9691) Introduction Sepsis is associated with cell necrosis and apoptosis. Indeed, plasma DNA levels have been shown to be increased in patients with sepsis [1]. So we investigated the prognostic value of circulating levels of cell-free DNA in critically ill septic patients regarding the clinical course and final outcome. Methods A total of 80 critically ill septic patients were included in a prospective, randomized, single-center study. All were subjected to the measurement of cell-free plasma DNA concentrations (by realtime PCR assay for the β-globin gene), CRP levels and procalcitonin concentrations, all measured on ICU admission. APACHE II and SOFA scores were calculated. Clinical outcome (duration of ICU stay, need for MV, need for inotropic/vasopressor support, need for haemodialysis, and final outcome of survival/mortality rates) were recorded for all patients. Results The median plasma DNA concentration in critically ill septic patients was 195.7 ng/ml and this was significantly (approximately sevenfold) higher than the DNA concentration in healthy subjects 27 ng/ml (P <0.001). The median DNA concentration was significantly higher in those who need MV (205.6 ng/ml vs. 123.7 ng/ml; P = 0.006), in those who were on inotropic/vasopressor support (234.6 ng/ml vs. 114.7 ng/ml; P <0.001) and in those who required renal supportive therapy (haemodialysis) (244.2 ng/ml vs. 181.1 ng/ml; P = 0.001). DNA concentration demonstrated a highly significant correlation with CRP concentration (r = 0.661, P <0.001), procalcitonin concentration (r = 0.820, P <0.001), SOFA score (r = 0.710, P <0.001), and APACHE II score (r = 0.559, P <0.001). The median plasma DNA concentration in nonsurvivors (38 of 80 patients, 47.5%) was 234.8 ng/ml, and this was significantly (approximately twofold) higher than that in survivors (115.5 ng/ml, P <0.001). Receiver operator characteristic analysis of the data indicated a sensitivity of 95% and a specificity of 81% when DNA concentration of 186.5 ng/ml was taken as a predictor of ICU mortality. Conclusions Plasma cell-free DNA may be a potentially useful marker for the evaluation of ICU septic patients and for the prediction of their adverse outcomes. The ability for rapid risk stratification may allow clinicians to make more rational therapeutic decisions to ensure that the hospital resources are used efficiently and appropriately. Reference 1.
Zeerleder S, Zwart B, et al.: Elevated nucleosome levels in systemic inflammation and sepsis. Crit Care Med 2003, 31:1947-1951.
P272 C-reactive protein as an early marker of sepsis resolution: results from the Portuguese Community-acquired Sepsis Study (SACiUCI study) P Povoa1, A Teixeira-Pinto2, A Carneiro3 1 Hospital Sao Francisco Xavier, CHLO, Lisboa, Portugal; 2Faculty of Medicine, University of Porto, Portugal; 3Hospital Santo Antonio, Porto, Portugal Critical Care 2011, 15(Suppl 1):P272 (doi: 10.1186/cc9692) Introduction To assess the value of C-reactive protein (CRP) after prescription of antibiotics in order to define clinical resolution of community-acquired sepsis (CAS) admitted to the ICU. Methods During 12 months a cohort multiple-centre observational study was conducted in 17 Portuguese ICUs segregating adults with CAS consecutively admitted. Patients were followed-up during the first 5 ICU days, the day of ICU discharge or death and hospital outcome. Comparison between survivors and nonsurvivors was performed. Results Eight hundred and ninety-one patients (age 60 ± 17 years, hospital mortality 38%) were studied. At D1, CRP of survivors and nonsurvivors was not statistically different, 19.8 ± 12.5 mg/dl vs. 20.7 ± 12.8 mg/dl (P = 0.367). When we compared CRP of survivors and nonsurvivors at the different time points, we found that CRP of nonsurvivors was significantly higher since D3 onwards (P <0.001, for D3, D4 and D5). After adjusting for SAPS II and severity of sepsis
Critical Care 2011, Volume 15 Suppl 1 http://ccforum.com/supplements/15/S1
S97
(sepsis, severe sepsis and septic shock), the initial value of CRP was not significantly associated with hospital mortality (ORinitial = 1.01, 95% CI = (0.99, 1.02), P = 0.297). On the other side, the course of CRP, measured as the relative change, obtained from a patient’s specific linear model for the 5-day measurement of CRP generated two new variables, an intercept (describes the initial CRP value) and a slope (describes the CPR rate of change per day for a specific patient). We found that the slope was significantly associated with hospital mortality (OR CPR ratio = 1.03, 95% CI = (1.02, 1.04), P <0.001). A patient with an average decrease of the CRP concentration of 10% per day has 32% less chance of dying when compared with a patient with the same SAPS II and the same severity of sepsis but with no decrease of the CRP. The area under the ROC curve for the model including SAPS II, severity of sepsis, initial CRP and CRP course, was 0.77. No significant differences between survivors and nonsurvivors were found on daily monitoring of temperature and white cell count, both at the first day (P = 0.799 and P = 0.496, respectively) and in the course of subsequent days (P = 0.360 and P = 0.594, respectively). Conclusions Daily CRP measurement after antibiotic prescription was useful in identification, as early as day 3, of CAS patients with poor outcome. The slope of CRP course was markedly associated with prognosis. Reference
P274 Prognostic value of routinely assessed serum biomarkers in septic shock E Lafuente, E Viegas, E Filipe, E Tomas, M Fernandes, J Gomes da Silva, F Santos, F Moura, R Lopes, P Santos, N Ribeiro, I Terra Centro Hospitalar Tamega e Sousa, Penafiel, Portugal Critical Care 2011, 15(Suppl 1):P274 (doi: 10.1186/cc9694)
1.
SAPS II/mortality (%) 53.9 ± 19.1/52
Povoa P: Eur Respir J 2005, 25:804.
Introduction The objective of this study was to assess the usefulness of routinely admission measured biomarkers. Methods From a sample of 256 patients enrolled between October 2009 and November 2010, 193 had sepsis and 63 had septic shock based on the ACCP/SCCM criteria, and for each of them we measured reactive protein C (RPC), total cholesterol, protein C activity (PC), albumin, arterial lactate and the levels of IL-6 at admission. Results Levels of lactate, IL-6 and PC (<40%) showed the best accuracy for prediction mortality in all of the study patients as much as in the arm of the septic shock patients (AUROC 0.76; 0.80; 0.75, respectively; and AUROC 0.86; 0.86; 0.75, respectively). See Table 1. Table 1 (abstract P274) Septic shock
No septic shock P value
No sepsis
35.1 ± 14.4/10
0.0001
30.2 ± 16/6.6
RPC
208 ± 115
185 ± 118
0.83
108 ± 105
P273 Effect of including procalcitonin and C-reactive protein in the Mortality in Emergency Department Sepsis risk prediction model C Lee1, J Liu2, S Chen3, S Chen1 1 National Taiwan University Hospital, Taipei, Taiwan; 2Harvard School of Public Health, Boston, MA, USA; 3Beth-Israel-Deaconess Hospital, Boston, MA, USA Critical Care 2011, 15(Suppl 1):P273 (doi: 10.1186/cc9693)
Protein C
35.5 ± 17.8
56.1 ± 24
0.0001
65.8 ± 32.8
Albumin
2 ± 0.2
1.8 ± 0.6
0.5
2.3 ± 0.6
Introduction The Mortality in Emergency Department Sepsis (MEDS) score has been gradually accepted as a reliable tool for bedside risk prediction of sepsis patients in the emergency department. Despite its clinical usefulness, the MEDS score did not take advantage of the prognostic information of biomarkers. Methods We compared the clinical utility of MEDS score with and without CRP or PCT among participants in a prospective cohort of patients. All adult patients fulfilling the criteria for SIRS with a presumed infectious etiology were eligible for inclusion. Serum PCT and CRP were evaluated at admission. Initial severity was assessed with the MEDS score. Each patient was followed for at least 30 days for the 30-day survival. We built three extended models, including MEDS plus natural log PCT model (MEDS-LnPCT), MEDS plus natural log CRP model (MEDSLnCRP), and MEDS plus natural log PCT and natural log CRP model (MEDS-LnPCT & LnCRP) for comparison. The values of CRP and PCT were transformed to natural log scale to normalize the distributions. We assessed whether adding CRP, PCT or both biomarkers to the MEDS model significantly reclassified patients into more appropriate risk categories. The reclassification was then evaluated by comparison of the observed incidence of events in the cells of the reclassification table with the predicted probability from the original MEDS model. Results The 63 patients who died (10.6%) had significantly increased levels of PCT and CRP. Adjusting for MEDS predictors, either high levels of CRP or PCT was independently associated with 30-day mortality. We fitted PCT-incorporated (MEDS-PCT), CRP-incorporated (MEDS-CRP), and PCT & CRP incorporated (MEDS-PCT & CRP) models for comparison. The MEDS-PCT model was the favored model as it improved model fit and calibration as measured by the Net Reclassification Improvement (NRI) score (14.1%, P = 0.047). MEDS-CRP and MEDS-CRP & PCT models improved model fit (likelihood ratio test P = 0.03, 0.009, respectively) but did not improve calibration (NRI 5.4%, P = 0.204; 13.2%, P = 0.055). All three models did not improve model discrimination as measured by c-statistics. Conclusions Adding PCT levels to the MEDS score reclassified patients into groups that better predict actual 30-day mortality. Inclusion of CRP or both biomarkers offers limited additional predictive value. Further validation studies are needed to corroborate these findings.
Conclusions Biomarkers at ICU admission revealed different accuracies in predicting septic shock mortality. Maximal lactate, mean IL-6 and minimum PC levels were associated with the higher mortality found in this ICU population. Reference
Lactate
4.5 ± 2.9
2.6 ± 2.6
0.0001
1.9 ± 1.8
Total cholesterol
77.8 ± 54
97.1 ± 48
0.02
136 ± 81
42,252 ± 9,131
2,732 ± 725
0.001
1,434 ± 586
IL-6
1.
Marshal JC; International Sepsis Forum: Biomarkers of sepsis. Crit Care Med 2009, 37:2290-2298.
P275 N-terminal pro-BNP predicts mortality better than procalcitonin in abdominal severe sepsis and septic shock N Ruiz-Vera1, MJ Antolino-Martinez2, A Gonzalez-Lisorge2, C Garcia-Palenciano2, T Sansano-Sanchez2, F Acosta-Villegas2 1 University Hospital, Murcia, Spain; 2University Hospital ‘Virgen de la Arrixaca’, Murcia, Spain Critical Care 2011, 15(Suppl 1):P275 (doi: 10.1186/cc9695) Introduction N-terminal pro-BNP (pBNP) could be useful to predict outcome in severe sepsis. We have conducted a study to compare pBNP and procalcitonin (PCT) in the setting of abdominal severe sepsis or septic shock. Methods We performed a prospective study of 51 consecutive patients with abdominal severe sepsis or septic shock. Age, gender, APACHE II score at admission, in-unit survival, presence of septic shock and serum PCT and pBNP levels during 4 days after admission were determined. Statistics: chi-square test, Student’s t test, Mann–Whitney’s test for samples without normal distribution and Cox’s logistic regression. P <0.05 was considered statistically significant. Results The mean APACHE II score at admission was 20.52 ± 5.07. This value was found to be significantly higher in nonsurvivors (18.38 ± 4.56 vs. 24.00 ± 4.03, P <0.05). Values of pBNP were significantly higher in nonsurvivors from the first day of the study. PCT levels were higher in nonsurvivors, but only reached statistically significance on day 2 (Table 1). These results were not found to be influenced by age, gender or presence of shock in multivariate analysis.
Critical Care 2011, Volume 15 Suppl 1 http://ccforum.com/supplements/15/S1
S98
Table 1 (abstract P275). Values of pBNP and PCT during the study period Day 1
Day 2
Day 3
Day 4
2,256.50 (1,071 to 2,832)*
1,598.00 (1,412.75 to 3,918.25)
2,102.50 (1,323.50 to 6,166.50)
1,809,00 (939.25 to 5,495.75)
4,090.50 (3,064 to 32,147.75)
8,994,00 (4,911 to 27,860.25)
9,528.00 (3,747.75 to 25,793.2)
5,498,00 (1542 to 19,947.25)
Survivors
10.13 ± 13.02
11.68 ± 18.29*
12.75 ± 23.16
11.90 ± 24.24
Nonsurvivors
19.81 ± 23.32
25.91 ± 26.87
26.82 ± 26.46
9.89 ± 8.87
pBNP (median and Q25 to 75) (pg/ml) Survivors Nonsurvivors PCT (mean ± SD) (ng/ml)
*P <0.05.
Conclusions Our results shown that pBNP could be more useful than PCT to discriminate the patients with abdominal severe sepsis and worse outcome. References 1. 2. 3.
Phua J, et al.: Shock 2008, 29:328-333. Verdier B, et al.: Ann Fr Anesth Reanim 2008, 27:135-140. Delerme S, et al.: Biomark Insights 2008, 3:203-217.
P276 Prognostic value of proadrenomedullin in severe sepsis and septic shock patients with community-acquired pneumonia B Suberviola, A Castellanos, L García Astudillo, D Iglesias, F Ortiz Melon University Hospital Marques de Valdecilla, Santander, Spain Critical Care 2011, 15(Suppl 1):P276 (doi: 10.1186/cc9696) Introduction Community-acquired pneumonia (CAP) is the leading cause of death from infectious disease in western countries and supposes an important consumption of healthcare resources. Several studies suggest that proADM is possibly as good as validated severity scores in detecting critically ill patients with CAP and probably better than other biomarkers like procalcitonin (PCT). Methods A single-centre prospective study between January 2009 and September 2009. Eligible patients were all consecutive adult patients, age 17 or older, admitted to the ICU with both a clinical and radiologic diagnosis of pneumonia as per Fine and colleagues, and meeting criteria for severe sepsis or septic shock. Venous blood samples were obtained at admission on the ICU and collected in tubes containing EDTA. After centrifugation, they were kept frozen at –80°C until assayed. MR-proADM, PCT and C-reactive protein (CRP) were measured in these samples. Results In all cases, proADM values at ICU admission were pathological. ProADM consistently rose as PSI class advanced from II to V (P = 0.02). Differences across PSI class were not significant for CRP (P = 0.73) and PCT (P = 0.12). Median proADM levels were higher (P = 0.007) in hospital nonsurvivors (8.1 ± 9.2 nmol/l) versus survivors (3.0 ± 3.2 nmol/l). These differences were also significant with respect to ICU mortality (9.9 ± 10.4 vs. 3.2 ± 3.2 nmol/l; P = 0.001). The receiver-operating characteristic curve for proADM yielded an AUC of 0.72; better than the AUC for PCT and CRP (0.40 and 0.44, respectively) and similar to PSI (0.74).The optimal prognostic cut-off (maximum combined sensitivity and specificity) related to in-hospital mortality for proADM was 4.86 nmol/l, with a sensitivity of 0.53, specificity of 0.84, positive likelihood ratio of 3.39, negative likelihood ratio of 0.56, positive predictive value of 64.3 and negative predictive value of 77.1. Those patients with a proADM level higher than 4.86 nmol/l on ICU admission had an inhospital mortality significantly higher than those with lower value. Conclusions ProADM levels on ICU admission predict the severity and outcome of severe sepsis and septic shock CAP with a similar prognostic accuracy as the PSI and a higher prognostic accuracy compared with commonly measured laboratory parameters.
P277 Influence of TIMP-1/MMP-9 ratio on the severity and mortality in sepsis L Lorente1, MM Martín2, J Solé-Violán3, J Blanquer4, L Labarta5, C Díaz6, JM Borreguero-León1, JA Páramo7 1 Hospital Universitario de Canarias, La Laguna, Spain; 2Hospital Universitario Nuestra Señora de Candelaria, Santa Cruz de Tenerife, Spain; 3Hospital Universitario Dr Negrín, Las Palmas de Gran Canaria, Spain; 4Hospital Clínico Universitario de Valencia, Spain; 5Hospital San Jorge, Huesca, Spain; 6Hospital Insular, Las Palmas de Gran Canaria, Spain; 7CIMA-Universidad de Navarra, Pamplona, Spain Critical Care 2011, 15(Suppl 1):P277 (doi: 10.1186/cc9697) Introduction The role of matrix metalloproteinases (MMPs) and tissue inhibitors of matrix metalloproteinases (TIMPs) in sepsis remains unclear. MMPs play a role facilitating the recruitment of leucocytes from the bloodstream (by proteolysis of the basement membrane) and modulating inflammatory response [1]. Besides, there has been reported a positive association between circulating levels of TIMP-1 and plasminogen activator inhibitor (PAI)-1 in healthy adults [2] and myocardial infarction [3]. In addition there are in vitro studies showing that MMP-9 inhibits platelet aggregation [4,5]. Thus a high TIMP-1/ MMP-9 ratio could contribute to a prothrombotic state, and the development of organ dysfunction and finally death in septic patients. The objectives of this study were to investigate the time course of MMP-9, MMP-10 and TIMP-1 levels, and the association with sepsis severity and PAI-1 levels. Methods This was a multicenter, observational and prospective study carried out in six Spanish ICUs. We included 192 (125 surviving and 67 nonsurviving) patients with severe sepsis. We obtained blood samples at three moments (time of diagnosis, 72 hours and 7 days) for the determination of MMP-9, TIMP-1, TNFα, IL-10 and PAI-1 levels. We assessed survival at 30 days as the endpoint. Results Nonsurvivor patients showed at the three moments lower MMP-9 levels, higher TIMP-1 levels and higher TIMP-1/MMP-9 ratios than survivors. There were at the three moments an association of the TIMP-1/MMP-9 ratio with lactic acid levels, SOFA score, PAI-1 levels, TNFα and IL-10. Logistic regression analysis showed that TIMP-1 levels, lactic acid levels and SOFA score were associated with death at 30 days. Conclusions To our knowledge, this study includes the largest series reporting data on MMP levels in sepsis. The novel findings of our study are that nonsurviving septic patients showed a persistent higher TIMP1/MMP-9 ratio during the first week than survivors. From a therapeutic perspective, the development of modulators of MMP/TIMP activity could be used as a new class of drugs for the treatment of severe sepsis. References 1. 2. 3. 4. 5.
Elkington PT, et al.: Clin Exp Immunol 2005, 142:12-20. Aznaouridis K, et al.: Atherosclerosis 2007, 195:212-215. Cavusoglu E, et al.: Am Heart J 2006, 151:1101.e1-1101.e8. Sheu JR, et al.: Br J Pharmacol 2004, 143:193-201. Lee YM, et al.: Eur J Pharmacol 2006, 537:52-58.
Critical Care 2011, Volume 15 Suppl 1 http://ccforum.com/supplements/15/S1
P278 Impact of pro-domain stability of matrix metalloproteinase-8 on the outcome of sepsis J McLaughlin1, J Rella2, A Bakan1, L Kong1, L Zhu1, D Frederick3, S Yende1, R Ferrell1, I Bahar1, S Shapiro1, D Angus1, A Kaynar1 1 University of Pittsburgh, PA, USA; 2University of Vienna, Austria; 3University of Tulane, New Orleans, LA, USA Critical Care 2011, 15(Suppl 1):P278 (doi: 10.1186/cc9698) Introduction Animal studies suggest matrix metalloproteinase-8 (MMP8) (neutrophil collagenase) impairs neutrophil (PMN) recruitment in inflammation; in humans, MMP8 has been associated with inflammation. We hypothesized that septic patients with single nucleotide polymorphisms (SNPs) in the MMP8 promoter region will have a survival advantage, and this advantage is due to differences in MMP8 enzymatic activity and not MMP8 levels. Methods We examined data from patients with CAP-associated sepsis (GenIMS), analyzed three functional SNPs (rs3765620, rs1940475, rs11225395) in 1,567 Caucasians and tested associations with 60-day and 90-day mortality and severe sepsis incidence. We simulated functional MMP8 SNPs using anisotropic network modeling. Modeling suggested pro-domain structural stability affecting zymogen activation. Based upon the predictions, we then studied zymogen activation using bioluminescent resonance energy transfer (BRET). We generated recombinant pro-MMP8 with a pro-domain tag of luciferase and carboxy terminus tag of green fluorescent protein. BRET signal was generated when luciferase-cleaved substrate produced a photon transferring energy to the GFP acceptor. GFP in turn emitted a green light signal when the donor/acceptor pairs were spatially close. Upon MMP activation, pro-domain is cleaved causing a loss in BRET signal. Results The rs1940475 genotype causing an amino acid mutation in the pro-domain was significantly associated with 90-day mortality (AA: 8.5%, AG: 11.1%, GG: 14.7%, P = 0.007). Cumulative incidence showed that the A allele was associated with better 90-day survival. Computer simulation of the mutation suggests a delayed activation. BRET assay confirmed that pro-domain mutation of MMP8 (K87E) rendered it less amenable to activation. Conclusions Our results suggest altering the structural stability of the inhibitory MMP8 pro-domain impacts enzyme activation. Therapeutics targeting pro-domain could be used to modulate MMP function and control downstream inflammatory processes in sepsis. P279 Pentraxin 3 levels from bronchoalveolar lavage of critically ill patients predict lung infection T Mauri1, A Pradella1, A Confalonieri1, G Bellani1, D Ferlicca1, M Bombino2, I Cuccovillo3, N Patroniti1, A Mantovani3, A Pesenti1 1 Universita degli Studi di Milano-Bicocca, Monza, Italy; 2San Gerardo Hospital, Monza, Italy; 3Humanitas Clinical Institute, Rozzano, Italy Critical Care 2011, 15(Suppl 1):P279 (doi: 10.1186/cc9699) Introduction Timely diagnosis of lung infection in critically ill patients is key to guide therapy and avoid futile antibiotic prescription. The gold standard for diagnosis is microbiological culture of bronchoalveolar lavage fluid (BALf ). However, it takes up to 48 hours to disclose results. Pentraxin 3 (PTX3) is an acute phase mediator of infection that can be assayed in a few hours. We described a relationship between BALf PTX3 presence and lung infection in acute respiratory distress syndrome patients. The aim of this study was to validate BALf PTX3 as an early marker of lung infection in critically ill patients. Methods We collected 40 consecutive BALfs from 36 adult patients admitted to our general ICU. BALfs were collected by standard technique and cultured when lung infection was clinically suspected (that is, pulmonary infiltrate + presence of fever, leukocytosis or leukopenia and purulent secretions). We collected plasma samples at the same time as BALf sampling. We assayed PTX3 in BALf and plasma by ELISA (detection limit 0.1 ng/ml) and we recorded BALf microbiology results. We defined lung infection when noncontaminant microbe was identified in ≥104 cfu/ml. Analyses were performed by simple regression, chi-square or Fisher exact test and ROC curve analysis, as appropriate.
S99
Results Lung infection was diagnosed in 14/40 cases (35%). Three out of 14 (21%) were defined as community-acquired pneumonia, 4/14 (28%) were hospital-acquired, while 7/14 (50%) were ventilatorassociated. PTX3 was detectable in 22/40 BALfs (55%, mean value 5.66 ± 8.89 ng/ml). Plasma PTX3 was not significantly correlated with BALf PTX3. Circulating PTX3 was not higher when lung infection was present (83.07 ± 126.42 ng/ml vs. 104.7 ± 166.16 ng/ml, P = 0.65). At the opposite, PTX3 was more likely to be detectable in culture-positive BALfs in comparison with negative samples (13/14 (93%) vs. 9/26 (34%), P = 0.001). The ROC curves analysis showed that alveolar PTX3 was able to diagnose lung infection (AUC = 0.815 (95% CI = 0.675 to 0.954), P = 0.001) and that a value of alveolar PTX3 = 0.95 ng/ml predicted pneumonia with 77% specificity and 93% sensitivity. Conclusions BALf PTX3 levels predicted lung infection presence in a relatively large population of critically ill patients. Enrolment of more patients in the present study may disclose the BALf PTX3 role in the diagnosis of pneumonia in the critical care clinical setting.
P280 Increased levels of soluble triggering receptor expressed on myeloid cells sTREM1 in ICU patients with cardiovascular disease and associated organ dysfunction S Dewan, A Varma, M Talegaonkar Fortis Escorts Heart Institute, New Delhi, India Critical Care 2011, 15(Suppl 1):P280 (doi: 10.1186/cc9700) Introduction sTREM1, a new receptor of the immunoglobulin superfamily, is expressed on neutrophils and monocytes/macrophages. It has been reported to be a useful marker in infectious inflammatory conditions such as sepsis, pneumonia and pancreatitis. Cardiovascular disease with shock and associated organ dysfunction in the form of acute kidney injury (AKI) and acute liver damage (LD) is a unique subset of disease conditions mediated by the inflammatory process and there may be a role of sTREM1 levels in assessing the severity of disease and prognostication of the patient. We hypothesized that the sTREM1 level may be increased in patients with cardiovascular disease and organ dysfunction and it can be used as a prognostic marker. Methods A retrospective analysis of sTREM1 levels of 139 (99 males, 40 females) (P <0.004) patients admitted between October 2009 and January 2010 to the ICU of our hospital. Patients with cardiovascular disease and organ dysfunction like AKI and LD were analysed. sTREM1 level >25 pg/ml was taken as abnormal. Results A total of 139 patients were analysed. sTREM1 was abnormal in 82 (59%) of the patients (mean ± SD 63.26 ± 54.58) and normal in 57 (41%) patients (15.35± 6.10), which is highly significant (P <0.0001) and correlates well with total leucocyte counts, which are (mean ± SD) 15,283 ± 6,126 for patients with abnormal sTREM1 and 13, 001 ± 6,518 for normal patients (P <0.05). Out of 75 patients with coronary artery disease (CAD), 50 (61%) patients had abnormal sTREM1 levels as compared with 25 (43.9%) with normal levels (P <0.046). Out of 18 patients with AKI, 15 (83.3%) had abnormal sTREM1 levels and three (16.6%) had normal levels (P <0.020). Out of 15 patients with LD, 13 (84.1%) had abnormal value and two (15.9%) had normal levels (P <0.017). Although patients with abnormal sTREM1 had higher mortality it was not statistically significant due to the small number of patients. Conclusions sTREM1 levels rise significantly in all kinds of cardiovascular disease and associated organ dysfunction like AKI and LD. Abnormal levels are also related to higher mortality, although not statistically significantly. The level of sTREM1 can be used as a prognostic marker for patients with this kind of disease scenario. These results confirm the usefulness of sTREM1 as a biological marker for diagnosing the severity of disease. References 1. 2.
Soluble TREM1 and the diagnosis of pneumonia. N Engl J Med 2004, 350:451-458. Increase level of sTREM1in patients with acute pancreatitis. Crit Care Med 2008, 36:2048-2053.
Critical Care 2011, Volume 15 Suppl 1 http://ccforum.com/supplements/15/S1
P281 Bronchoalveolar lavage/blood ratio of surface TREM-1 on CD14-positive monocytes is diagnostic of ventilator-associated pneumonia V Grover1, P Kelleher2, D Henderson2, P Pantelidis2, F Gotch3, N Soni1, S Singh1 1 Chelsea and Westminster NHS Foundation Trust, London, UK; 2Imperial College Healthcare NHS Trust, London, UK; 3Imperial College, London, UK Critical Care 2011, 15(Suppl 1):P281 (doi: 10.1186/cc9701) Introduction Biomarkers offer the possibility to speed up diagnosis of ventilator-associated pneumonia (VAP) and differentiate it from nonpulmonary infection. One such marker, the triggering receptor expressed on myeloid cells-1 (TREM-1), exists as a soluble protein and a surface receptor expressed on monocytes and neutrophils [1]. The purpose of the study was to determine the diagnostic utility of surface TREM-1 levels in VAP. Methods Paired bronchoalveolar lavage (BAL) and blood were obtained from 25 VAP patients, 15 ventilated non-infected controls, 10 ventilated patients with nonpulmonary infection and 25 nonventilated controls. VAP diagnosis was by clinical pulmonary infection score (CPIS) and semiquantitative microbiology. BAL and blood monocytic and neutrophilic levels of surface TREM-1 and CD11b (leukocyte activation marker) were assessed using flow cytometry. Monocytes were CD14positive. Soluble TREM-1, IL-1β, IL-6 and IL-8 were measured using ELISA. BAL dilution was corrected by urea assay. Results See Figure 1. The BAL level of monocytic surface TREM-1 was elevated in VAP. For ventilated patients, the area under the ROC curve (AUC) was 0.87 for diagnosing VAP, with sensitivity 72% and specificity 80%. Blood levels did not differ between the groups. However, the BAL/ blood ratio improved diagnostic accuracy further. The AUC was 0.97, sensitivity 84%, specificity 92% and positive likelihood ratio 10.5. The ratio differentiated pulmonary from nonpulmonary infection. The BAL/ blood ratio of monocytic CD11b was 0.78. The BAL levels of neutrophil surface TREM-1, soluble TREM-1, IL-1β and IL-8 had AUCs of 0.75, 0.76, 0.81 and 0.85, respectively. Conclusions The BAL/blood ratio of monocytic surface TREM-1 diagnoses VAP and differentiates pulmonary from nonpulmonary infection. CD14 and TREM-1 may have a role in the pathogenesis of VAP. Reference 1.
Bouchon A, et al.: J Immunol 2000, 164:4991-4995.
S100
P282 Angiotensin-converting enzyme (ACE) insertion/deletion polymorphism and circulating ACE levels are not associated with outcome in septic critically ill patients I Tsangaris1, A Tsantes2, P Kopterides3, G Tsaknis3, G Antonakos4, D Konstantonis3, A Nikolaidou4, E Vrigkou3, A Tsante2, A Anthi3, S Orfanos3, K Dima4, A Armaganidis3 1 Attiko University General Hospital, University of Athens, Greece; 2Laboratory of Haematology & Blood Bank Unit, ‘Attiko’ University General Hospital, University of Athens, Greece; 32nd Department of Critical Care Medicine, ‘Attiko’ University General Hospital, University of Athens, Greece; 4Department of Clinical Biochemistry, ‘Attiko’ University General Hospital, University of Athens, Greece Critical Care 2011, 15(Suppl 1):P282 (doi: 10.1186/cc9702) Introduction Several studies of critically ill patients have suggested an association of the D/D genotype of the insertion/deletion (I/D) angiotensin-converting enzyme (ACE) polymorphism with poor outcome probably by enhancing the inflammatory response and leading to a procoagulant state. Our aim was to evaluate the effect of both the ACE I/D polymorphism and its gene product, on the clinical outcome of critically ill septic patients. Methods The study cohort included 186 consecutive Caucasian patients with sepsis, severe sepsis or septic shock. Epidemiological, clinical data and co-morbidities along with severity scores were recorded. Measurements of serum ACE activity and genotyping for ACE I/D polymorphism were carried out in all patients. The primary outcomes were the 28-day and 90-day mortalities; secondary outcomes included the number of days without renal or cardiovascular failure, and ventilation-free days over the 28-day period following the study enrollment. One hundred and eighty healthy blood donors were genotyped and used as controls. Results The genotype distribution in the patients’ group was comparable with that observed in controls (P = 0.45). ACE I/D polymorphism and circulating ACE levels were not associated with mortality (P >0.05) or with secondary outcomes including ventilationfree days and days without cardiovascular or renal failure among septic critically ill patients (P >0.05). See Figure 1. Conclusions Neither the ACE I/D polymorphism nor the serum ACE levels seem to be significant prognostic factors of the outcome of sepsis in critically ill patients.
Figure 1 (abstract P281). BAL/blood monocytic TREM-1 ratio. Figure 1 (abstract P282). Kaplan–Meier curves of survival up to 28 days for the three ACE gene polymorphisms.
Critical Care 2011, Volume 15 Suppl 1 http://ccforum.com/supplements/15/S1
S101
P283 Comparison of the effects of recombinant human soluble thrombomodulin for systemic inflammatory response syndromeassociated coagulopathy with and without continuous hemodiafiltration SM Matsuo, T Ikeda, K Ikeda, H Ikeda, S Suda, M Hiramatsu Tokyo Medical University, Hachioji Medical Center, Tokyo, Japan Critical Care 2011, 15(Suppl 1):P283 (doi: 10.1186/cc9703) Introduction Recombinant human soluble thrombomodulin (rhs-TM) has a potent anticoagulant effect on septic disseminated intravascular coagulation (DIC) by binding to thrombin and activating protein C. The infusion dosage of rhs-TM should be reduced for patients with renal failure. The aim of this study was to compare the effects of rhsTM for systemic inflammatory response syndrome (SIRS)-associated coagulopathy (SAC) with and without continuous hemodiafiltration (CHDF). Methods The subjects were 12 patients with SAC treated with rhsTM in our ICU. Of these, six received 380 units/kg/day rhs-TM, and six who were undergoing CHDF received 130 units/kg/day for 6 to 7 days. We analyzed the changes in DIC, sequential organ failure assessment (SOFA) and SIRS scores, platelet counts, antithrombin levels, fibrin/ fibrinogen degradation products (FDP) and prothrombin time internationalized ratio (PT-INR) after each treatment with rhs-TM. The values are expressed as means ± SD and were analyzed using Student’s paired t test and the Wilcoxon t test (P <0.05). Results SOFA, DIC and SIRS scores and the values of PT-INR decreased after the administration of rhs-TM in both groups. Platelet counts increased in the group without CHDF and decreased in the group with CHDF, but these changes were not statistically significant. Antithrombin levels also increased in both groups, but these changes were not statistically significant either. FDP decreased significantly only in the group without CHDF. The changes in platelet counts were influenced by CHDF, because platelet counts were decreased only in the group with CHDF. Several reports have mentioned that rhs-TM has an effect of decreasing FDP for SAC. In this study, we observed decreased FDP only in the group without CHDF. We speculate that these results were influenced by an infusion dose of rhs-TM. Conclusions rhs-TM has a potent effect in improving septic DIC even with an infusion dose of 130 units/kg/day for patients with CHDF.
Figure 1 (abstract P284). Dynamic changes of StO2 during ischemic challenge.
(P = 0.003) and reduces arterial blood lactate (P = 0.001). HBO improves post-ischemic microcirculatory parameters: hyperemic area (P = 0.01), ΔStO2 (P = 0.02), maximum StO2 (P = 0.04) and tends to improve reperfusion slope (P = 0.1). A significant negative correlation between reperfusion slope and blood lactate was observed. No correlation between macrohemodynamic and microcirculatory parameters, including baseline StO2 with ScvO2, was observed. Conclusions If microvascular dysfunction is the key to the development of multiple organ failure in sepsis, the microcirculation should be a key therapeutic target. Our data confirm a good predictive value for outcome of the StO2 reperfusion slope at admission. Originally, we demonstrated a post-ischemic NIRS parameter improvement by HBO therapy. This microcirculatory effect, independent of the HBO action on systemic hemodynamic parameters, was associated with a significant reduction of arterial lactate, a major prognostic factor in septic patients. These variations are probably due to capillaries recruitment induced by microvascular reactivity modifications. References 1. 2.
P284 Microcirculatory effect of hyperbaric oxygen therapy in septic patients F Ferré, S Silva, J Ruiz, A Mari, O Mathe, P Sanchez-Verlaan, B Riu-Poulenc, O Fourcade, M Génestal University Teaching Hospital Purpan, Toulouse, France Critical Care 2011, 15(Suppl 1):P284 (doi: 10.1186/cc9704) Introduction Reduced microvascular perfusion has been implicated in organ dysfunction and multiple organ failure associated with severe sepsis. Near-infrared spectroscopy (NIRS) can provide a non-invasive estimation of local tissue oxygenation (StO2) related to microvascular circulation. Previous investigators have reported a prognosis value of StO2 measurements realized during severe sepsis. Hyperbaric oxygen (HBO) is recommended as an associated treatment during soft-tissue severe infection. Interestingly, a microcirculation improvement has been reportedly identified in septic animals treated by HBO. The aim of this study is to evaluate the microcirculatory effect of HBO therapy in septic patients assessing dynamics changes in StO2. Methods A prospective study over 1 year investigating 14 septic shock patients secondary to a soft-tissue infection. A concomitant microcirculation (for example, dynamic changes in StO2), macrocirculation and metabolic assessment was performed before and after each HBO session (for the first three). Thenar eminence StO2 was measured continuously by NIRS during a vascular occlusion test: a 3-minute transient ischemia inflating an arm cuff 50 mmHg above the systolic arterial pressure (Figure 1). Primary end point: StO2 reperfusion slope variation induced by HBO. Results The reperfusion slopes on day 1 were lower in nonsurvivors compared with survivors (P = 0.05). HBO increases cardiac output
Creteur J, et al.: Intensive Care Med 2007, 33:1549-1556. Payen D, et al.: Crit care 2009, 13(Suppl 5):S6.
P285 Lipid metabolism in critically ill patients: a microdialysis study M Theodorakopoulou1, N Nikitas2, S Orfanos1, I Maratou1, E Boutati1, A Diamantakis1, A Armaganidis1, I Dimopoulou1 1 Attikon University Hospital, Athens, Greece; 2Alexandra General Hospital, Athens, Greece Critical Care 2011, 15(Suppl 1):P285 (doi: 10.1186/cc9705) Introduction Microdialysis (MD) is a bedside in vivo sampling technique that permits continuous analysis of a patient’s interstitial fluid chemistry without consuming blood. As the interstitial fluid bathes the cells, its composition reflects the local metabolic activities of those cells, thus reflecting intracellular metabolic changes and disorders. In vivo MD is performed by implanting a commercially available catheter that mimics a blood capillary at the site of interest. In this study, we used MD to assess the metabolic changes of lipids in mechanically ventilated patients with sepsis. Methods Thirty-seven (21 men) mechanically ventilated septic patients were studied. All patients met the ACCP/SCCM consensus criteria for sepsis. Upon sepsis onset, an MD catheter was inserted into the subcutaneous tissue of the upper thigh. The dialysate samples were collected and analyzed immediately for glycerol using a mobile analyzer. Measurements were performed six times/day during the first 6 days from the sepsis onset. The daily mean values of the MD measurements were calculated. Blood samples were taken on the same days and were analyzed for total cholesterol, high-density lipoprotein (HDL), low-density lipoprotein (LDL), triglycerides, glycerol and free
Critical Care 2011, Volume 15 Suppl 1 http://ccforum.com/supplements/15/S1
S102
fatty acids (FFA). Results are expressed as mean ± SD. APACHE II and SOFA scores were also calculated. Results Thirty-seven (21 men) critically ill septic patients with a mean (± SD) age of 65 ± 18 years were studied. APACHE and SOFA at study entry were 22 ± 4 and 8 ± 3, respectively. Sepsis was related to SIRS (n = 1), severe sepsis (n = 7) and septic shock (n = 29). Mortality was 43%. Serum cholesterol (81 ± 42 mg/l) along with HDL (16 ± 17 mg/dl) and LDL (63 ± 37 mg/dl) were low. Serum triglycerides (158 ± 91 mg/dl) were elevated and FFAs (0.41 ± 0.27 mmol/l) were within normal limits. Serum glycerol was high (26 ± 20 mmol/l). Interstitial glycerol was also elevated (331 ± 190 μmol/l). Serum FFAs correlated with both serum (r = 0.43, P = 0.009) and interstitial (r = 0.33, P = 0.04) glycerol. Conclusions Critical care sepsis is characterized by an increase in serum and tissue glycerol and preserved FFA levels; these indicate enhanced lipolysis and an increased FFA uptake by peripheral tissues. Serum or interstitial glycerol are better indices of lipid mobilization than serum FFA levels in mechanically ventilated septic patients. P286 Does each element of the sepsis resuscitation bundle equally improve patient outcome? B Afessa, MT Keegan, GE Schramm, O Gajic Mayo Clinic, Rochester, MN, USA Critical Care 2011, 15(Suppl 1):P286 (doi: 10.1186/cc9706) Introduction The Institute for Healthcare Improvement advocates the use of bundles to implement the sepsis guidelines. There are limited data addressing which elements improve survival [1]. We analyzed the data from a previous study to determine the independent impact of each element on patient outcome. We hypothesized that not all elements of the bundle have equal impact on outcome. Methods The seven elements of the sepsis resuscitation bundle include lactate measurement, blood culture before antibiotic, timely antibiotic, adequate fluid resuscitation, appropriate vasopressor use, appropriate red blood cell (RBC) transfusion, and appropriate inotrope use. Baseline variables and the elements of the resuscitation bundle associated with mortality by univariate analyses at P <0.1 were included the propensity score. The univariate associations between the baseline variables and mortality were obtained from our previous study. The propensity scores were estimated using multiple logistic regression analysis. Results The study included 962 patients. Lactate measurement, timely blood culture and antibiotic administration, appropriate fluid resuscitation, and appropriate inotrope use were associated with increased mortality at P <0.1 using univariate analyses. Using the propensity score of each bundle element for adjustment, compliance with lactate measurement and inotrope administration were independently associated with decreased risk of death (Table 1). Timely antibiotic administration had a trend toward risk reduction, the P value did not reach statistical significance. Obtaining blood culture before antibiotic administration, vasopressor administration, and RBC transfusion were not associated with decreased risk of death. Table 1 (abstract P286) Bundle element
OR (95% CI)
P value
Lactate
0.581
0.022
Antibiotic
0.706
0.085
Inotrope
0.678
0.033
Conclusions Using the propensity score to adjust for compliance with each bundle element, lactate measurement and inotrope administration were independently associated with reduced risk of death. Reference 1.
Ferrer R, et al.: JAMA 2008, 299:2294-2303.
P287 Multicenter trial of a perioperative protocol to reduce mortality in critically ill patients with peptic ulcer perforation: the PULP trial M Hylander Møller University Hospital Bispebjerg, Copenhagen, Denmark Critical Care 2011, 15(Suppl 1):P287 (doi: 10.1186/cc9707) Introduction The aim of the present intervention study was to evaluate the effect of a multimodal and multidisciplinary perioperative care protocol on mortality in patients with peptic ulcer perforation (PPU). Sepsis is frequent and a leading cause of death in PPU patients, and morbidity and mortality is substantial [1,2]. Methods An externally controlled multicenter trial using historical and concurrent national controls in seven gastrointestinal departments in Denmark. Participants were 117 consecutive patients surgically treated for gastric or duodenal PPU between 1 January 2008 and 31 December 2009. The intervention was a multimodal and multidisciplinary perioperative care protocol based on the Surviving Sepsis Campaign. The main outcome measure was 30-day mortality. Results Demographic characteristics were not different between the groups. The 30-day mortality proportion following PPU was 17% in the intervention group, compared with 27% in all three control groups; P = 0.005 (Figure 1). This corresponds to a relative risk (95% confidence interval) of 0.63 (0.41 to 0.97), a relative risk reduction of 37% (5 to 58) and a number needed to treat of 10 (6 to 38).
Figure 1 (abstract P287). Thirty-day mortality in the intervention group compared with the controls.
Conclusions The 30-day mortality in patients with PPU was reduced by more than one-third after the implementation of a multimodal and multidisciplinary perioperative care protocol based on the Surviving Sepsis Campaign, as compared with conventional treatment. References 1. 2.
Boey J, et al.: Am J Surg 1982, 143:635-639. Moller MH, et al.: Scand J Gastroenterol 2009, 44:15-22.
P288 Effect of organ failure on outcomes in neutropenic sepsis D Bareisiene, R Kapoor East Kent Hospitals University NHS Foundation Trust, Canterbury, UK Critical Care 2011, 15(Suppl 1):P288 (doi: 10.1186/cc9708) Introduction The objective was to assess correlation between organ failure and outcomes in patients admitted with neutropenic sepsis to an adult ICU in a district general hospital. Methods Retrospective data were collected for admissions with neutropenic sepsis to the ICU over a 3-year period. The Ward Watcher electronic system was used to collect data on the level of organ support on the ICU. Outcomes assessed were 30-day and 1-year mortality. Results Twenty-nine neutropenic patients were admitted during the study period; 93% had haematological malignancy while 7% showed
Critical Care 2011, Volume 15 Suppl 1 http://ccforum.com/supplements/15/S1
S103
of dispatchers regarding their assistance skills (+44%). The training provided a significant improvement in staff perceptions on applicability of the approach on the field, and impacts for the victims. Participants (96%) were generally satisfied with the training. Finally, participants’ knowledge on public health issues (33%), basic life support (+17%) and dispatching protocol (+19%) was significantly improved. Conclusions French-language federal training in the 100/112 dispatching centers significantly improves dispatchers’ perceptions and knowledge of assistance to resuscitation by the ALERT protocol. Such results reinforce the pivotal role of standardized protocols and training in art and science medical dispatching. Reference 1.
Ghuysen A, Collas D, Stipulante S, et al.: Dispatcher-assisted telephone cardiopulmonary resuscitation using a French-language compressiononly protocol in volunteers with or without prior life support training: a randomized trial. Resuscitation 2011, 82:57-63.
Figure 1 (abstract P288). Outcomes depending on support level.
no evidence of malignancy. The mean neutrophil count was 0.2 x 10⁹/l and 52% had zero count during their ICU stay. A total of 41.3% had positive blood cultures. Mortality with negative blood cultures was 73%. Overall 30-day mortality was 58.6% and 1-year mortality was 79.3%. Ventilator support was needed in 83% with a mortality of 88%. Inotropes were required in 48.2% and there was a 71% 30-day mortality. Renal support was commenced in 27.5% with 100% mortality. The 30day mortality was 100% in patients requiring invasive ventilation and renal support. Mortality was also 100% in those requiring three-organ support (Figure 1). Conclusions Our data suggest a significant mortality in mechanically ventilated patients with neutropenic sepsis. This rises to 100% if two or more organs are supported, especially if one of them is the kidney. Early recognition and intervention to prevent progression to multiorgan failure is paramount to improve outcomes. Reference 1.
Darmont M, et al: Intensive care in patients with newly diagnosed malignancies and a need for cancer chemotherapy. Crit Care Med 2005, 33:2488.
P289 Belgian dispatchers’ telephone cardiopulmonary resuscitation protocol training: an evaluation study A Ghuysen1, M El FAssi1, S Stipulante2, V D’orio1 1 CHU Liège – ULG, Liege, Belgium; 2SPF Public Health Services, Liege, Belgium Critical Care 2011, 15(Suppl 1):P289 (doi: 10.1186/cc9709) Introduction Early bystander cardiopulmonary resuscitation (CPR) is one of the most effective interventions in improving outcome from sudden out-of-hospital cardiac arrest. However, despite large-scale community training programs, citizen-CPR rates have been persistently low. Therefore, a recent report of the 2010 European Resuscitation Council guidelines has re-emphasized the need for dispatchers to be specifically trained in starting telephone CPR protocol for suspected cardiac arrest. In accordance, 112 Belgian dispatchers have been trained for resuscitation assistance by telephone, using a specific protocol named ALERT (Algorithme Liègeois d’Encadrement à la Réanimation Téléphonique). The present work evaluates the educational aspects of this recent implementation. Methods This was a prospective multicentric study including all French-speaking dispatchers in Belgium (n = 140). The aim was to assess the added value of the training, based on the model of Donald Kirkpatrick that allowed gathering information about perceptions of dispatchers, their satisfaction with the training and their actual ability to apply the protocol. Results Dispatchers had a good pre-existing overall knowledge of CPR (80%), which was nevertheless significantly increased by the training (97%). There was a significant improvement in perceptions
P290 Comparison of the Mapleson C circuit, 500 ml and 1.6 l self-inflating bags for delivering guideline-compliant ventilation during simulated adult cardiopulmonary resuscitation P Sherren, A Lewinsohn, T Jovaisa, S Wijayatilake Queens Hospital, Romford, UK Critical Care 2011, 15(Suppl 1):P290 (doi: 10.1186/cc9710) Introduction Despite all the research and education that has gone into the field of cardiopulmonary resuscitation (CPR), survival rates remain bleak. A significant problem has been the discrepancy between teachings and witnessed clinical practice. As a result of this, and the deleterious outcomes associated with hyperventilation, we conducted a manikin-based study to evaluate three different ventilating devices and their ability to provide guideline-compliant ventilation during simulated adult CPR. Methods A simulated cardiac arrest scenario was undertaken by 33 healthcare professionals (α = 0.05, power = 80%). Participants were asked to ventilate a simulated cardiac arrest patient for a period of 1 minute with all three devices, during which time various ventilatory parameters were recorded using a spirometer. The devices investigated were the Mapleson C circuit, adult (1.6 l) and paediatric (500 ml) self-inflating bags. P <0.01 was deemed statistical significant, due to multiple comparisons. Results The paediatric self-inflating bag performed best, with significant improvement in the mean minute ventilation (P = 0.003), tidal volume (P <0.001) and peak airway pressure (P <0.001). Despite the significant differences, the paediatric self-inflating bag still delivered a mean minute ventilation of 7.01 l/minute, which still exceeds the Resuscitation Council’s suggested 5 l/minute. See Table 1. Table 1 (abstract P290). Comparison of data on ventilation parameters 500 ml selfinflating bag
1.6 l selfinflating bag
Mapleson C circuit
Minute ventilation (l/minute)
7.01 (3.22)
9.68 (4.22)
9.77 (3.45)
0.003*
Tidal volume (nl)
391 (51.5)
582 (86.7)
625 (103)
<0.001*
Respiratory rate (/minute)
16.7 (6.9)
18 (6.45)
17.3 (5.46)
0.704†
Peak airway pressure (cmH2O)
14.5 (5.18)
20.7 (9.03)
30.3 (11.4)
<0.001*
P value
Data presented as mean (SD). *Statistically significant result. †Nonstatistically significant result.
Conclusions Participants were found to be hyperventilating simulated cardiac arrest patients with all devices. The paediatric self-inflating bags delivered the most guideline-compliant ventilation and its use in adult CPR may be a simple measure to ensure delivery of more guidelineconsistent ventilation.
Critical Care 2011, Volume 15 Suppl 1 http://ccforum.com/supplements/15/S1
S104
P291 Comparison of nifekalant and amiodarone for resuscitation after cardiopulmonary arrest due to shock-resistant ventricular fibrillation N Harayama, S Nihei, Y Isa, H Arai, T Shinjou, K Nagata, M Ueki, K Aibara, M Kamochi University Hospital of Occupational and Environmental Health, Kitakyushu City, Japan Critical Care 2011, 15(Suppl 1):P291 (doi: 10.1186/cc9711)
P292 Implementation of the FAST emergency vehicle pre-emption system may improve the outcomes of out-of-hospital cardiac arrests: a 7-year observational study H Inaba1, Y Tanaka2, K Fukushima3, S Tamasaku3 1 Kanazawa University Graduate School of Medicine, Kanazawa, Japan; 2 Kanazawa University Hospital, Kanazawa, Japan; 3Kanazawa City Fire Department, Kanazawa, Japan Critical Care 2011, 15(Suppl 1):P292 (doi: 10.1186/cc9712)
Introduction Nifekalant (NIF) is a pure potassium channel blocker developed in Japan and it has been used widely for treating fatal ventricular tachyarrhythmia since 1999. Because intravenous amiodarone (AMD) was approved in 2007 in Japan, there have been few studies about the comparison of the efficacy of NIF and AMD for resuscitation after cardiopulmonary arrest patients due to shockresistant ventricular fibrillation. Methods We performed a retrospective study in 32 consecutive cardiopulmonary arrest patients treated by NIF or AMD due to more than twice shock-resistant ventricular fibrillation from April 2005 to October 2010. The statistical analyses performed by chi-square test and nonpaired t test. Results The mean (± SD) age was 62.2 ± 16.1 years and 25 of 32 were male patients. All 32 patients were treated with tracheal intubation and intravenous epinephrine. Seventeen patients received NIF administration and 15 patients received AMD. The average initial administration dose of NIF was 11.1 ± 3.4 mg and that of AMD was 171.7 ± 59.7 mg. The rate of return of spontaneous circulation (ROSC) was 41.2% (7/17) in the NIF administration group and 26.7% (4/15) in the AMD group. The survived discharge rate from our hospital was 29.4% (5/17) in the NIF group and 13.3% (2/15) in the AMD group. There were no significant differences between the two groups with the rate of ROSC and survived discharge. The mean interval from the antiarrhythmic drug (NIF or AMD) administration to ROSC was 7.8 ± 6.6 minutes (NIF) and 19.9 ± 11.7 minutes (AMD). There was significant difference between the interval of NIF and that of AMD (P <0.05). Conclusions Although NIF is an anti-arrhythmic agent for lifethreatening ventricular tachyarrhythmia, it does not have negative inotropic activity. NIF changes shock-resistant ventricular fibrillation to spontaneous circulation more quickly than AMD. NIF is strongly effective for resuscitation of shock-resistant ventricular fibrillation. Reference
Introduction The interval of call to arrival is one of the major factors associated with good outcomes of out-of-hospital cardiac arrests (OHCAs). The FAST system helps emergency vehicles reach a scene quickly by controlling the traffic signals. The aim of study is to investigate whether the FAST system may improve the outcomes of OHCAs by decreasing the response time. Methods We analyzed the data from OHCAs that were witnessed or recognized by citizens from April 2003 to March 2010. The OHCA data were compared between the two groups transported by ambulances with and without FAST units. The comparisons were made in the central and peripheral areas with and without FAST-controlled signals. Results Dispatch of and transportation by FAST-loaded ambulances significantly decreased the interval of call to arrival and significantly augmented the incidence of sustained ROSC and 1-year survival only in the central area (Figure 1). Monovariate analysis followed by logistic regression analysis revealed that FAST implementation is an independent factor associated with 1-year survival (adjusted odds ratio with 95% CI = 1.306 (1.014 to 1.691)) and sustained ROSC (1.249 (1.108 to 1.410)). Conclusions The implementation of FAST may improve the outcomes of OHCAs mainly by reducing the interval of call to arrival. References
1.
Nakaya H, et al.: Br J Pharmacol 1993, 109:157-163.
1. 2. 3.
Resuscitation 2006, 69:229-234. Acad Emerg Med 2005, 12:594-600. BMJ 2001, 322:1385-1388.
P293 Responsiveness to EMT-performed basic CPR and its duration predict unachievable sustained return of spontaneous circulation and unavoidable hospital death in unwitnessed out-of-hospital cardiac arrests without bystander CPR H Inaba, Y Takei, M Enami, Y Goto, K Ohta Kanazawa University Graduate School of Medicine, Kanazawa, Japan Critical Care 2011, 15(Suppl 1):P293 (doi: 10.1186/cc9713) Introduction Various criteria to terminate resuscitation have been reported. EMTs in Japan are not permitted to terminate resuscitation in
Figure 1 (abstract P292). Effect of the FAST implementation on outcomes of OHCAs in the two regions.
Critical Care 2011, Volume 15 Suppl 1 http://ccforum.com/supplements/15/S1
S105
P294 Is intraosseous access a safe option in adult cardiac arrest? A review of the literature J Baombe, B Foex Manchester Royal Infirmary, Manchester, UK Critical Care 2011, 15(Suppl 1):P294 (doi: 10.1186/cc9714)
Figure 1 (abstract P293). Overview of out-of-hospital cardiac arrests analyzed.
the field. The aim of this study is to test the hypothesis that ECG rhythm response to basic CPR and its duration may predict hospital death. Methods The basal data were prospectively collected from 1,437 unwitnessed out-of-hospital cardiac arrests (OHCAs) that were resuscitated by EMTs without the ACLS technique in Ishikawa Prefecture (Figure 1). The cut-off points of basic CPR duration for outcomes were determined. Sensitivity and specificity were calculated. Results The improvement of the ECG rhythm by basic CPR predicted the sustained return of spontaneous circulation (SROSC) in hospital. The duration of EMT-performed CPR predicted the outcomes of the OHCAs that were unresponsive to the basic CPR (Figure 2). Conclusions Responsiveness to basic CPR and its duration may predict unavoidable death in hospital. References 1. 2. 3.
Introduction Intraosseous (IO) cannulation for the infusion of fluids and medications was first described by Drinker and colleagues in 1922 [1]. Its use in the paediatric population has previously been validated and is now widely accepted worldwide. However, adult IO drug administration has been lagging behind for various reasons. The authors reviewed the literature to determine the feasibility and safety of this underused cannulation method. Methods The MEDLINE database (1950 to week 2 August 2010) was searched using the terms intraosseous infusions, heart arrest, cardiopulmonary arrest, cardiac arrest, resuscitation, cardiopulmonary resuscitation with their appropriate combinations and truncated terms. The Embase database (1980 to week 2 August 2010) was searched using the terms intraosseous drug administration, heart arrest, resuscitation, fluid resuscitation. Both searches were limited to English language, humans and adults only. Results The MEDLINE search returned 518 papers, most of them case reports not included in our final table of summary as of low level of evidence. The two studies finally included presented encouraging results but are limited by small numbers. Seventy-seven papers were found through the Embase search but none were relevant to our specific questions. Conclusions IO access in adults appears to be a fast and reliable method to deliver drugs and fluids during cardiopulmonary resuscitation, allowing achievement of adequate drug concentrations and desired pharmacological responses. Despite the limited literature, it should probably be considered if other traditional methods for drug and fluid delivery have failed. Reference 1.
Drinker C, Drinker K, Lund C: The circulation in the mammalian bone marrow. Am J Physiol 1922, 62:1-92.
N Engl J Med 2006, 355:478-487. JAMA 2008, 300:1432-1438. Resuscitation 2010, 81:679-684.
Figure 2 (abstract P293). Duration of EMT-performed BLS determines the incidence of SROSC at hospital and 1-year survival in unwitnessed OHCAs without CPR before EMT arrival.
Critical Care 2011, Volume 15 Suppl 1 http://ccforum.com/supplements/15/S1
P295 A survey on laypersons’ willingness in performing cardiopulmonary resuscitation T Otani, S Ohshimo, T Shokawa, K Nishioka, J Itai, T Sadamori, Y Kida, T Inagawa, Y Torikoshi, K Suzuki, K Ota, T Tamura, R Tsumura, Y Iwasaki, N Hirohashi, K Tanigawa Hiroshima University, Hiroshima, Japan Critical Care 2011, 15(Suppl 1):P295 (doi: 10.1186/cc9715) Introduction Although bystander cardiopulmonary resuscitation (CPR) can improve survival from cardiac arrest, the reported prevalence of bystander CPR remains low in most countries. This study was performed to investigate factors affecting laypersons’ willingness in performing CPR. Methods Questionnaires including 10 questions regarding personnel backgrounds, knowledge regarding the use of AED, CPR training, willingness in performing CPR, and EMS dispatcher’s advice were distributed to citizens who gathered at a ball park stadium, a typical public place in Hiroshima, Japan. Results Ten thousand questionnaires were distributed and a total of 5,956 were collected for analysis. Age distributions of the respondents were: <20 years old: 13%, 20 to 49 years old: 67%, 50 to 69 years old: 16%, >70 years old: 3%. Fifty-seven percent were male. Ninety-one percent had heard of AED; however, only 45% knew how to use it. Forty-nine percent took CPR training before. As for the willingness to perform CPR, 38% answered they would start CPR, 34% would do it if any advice was available. On the other hand, 23% said they were not capable of performing CPR, and 4% were not willing to do it. Of those who were not capable of performing CPR, the reasons included lack of knowledge and/or skills to perform CPR (50%), no previous CPR training (27%), concern over harm to the victims (25%), and lack of confidence to determine cardiac arrest (19%). Of those who were willing to perform CPR, 61% answered they would prioritize rescue breathing over chest compression. In comparison of those with and without previous CPR training or knowledge of the use of AED, significant differences were found in the willingness in performing CPR (88% vs. 58%, P <0.0001; 91% vs. 58%, P <0.0001, respectively) and doing rescue breathing (55% vs. 29%, P <0.0001; 64% vs. 57%, P <0.0001, respectively). Fifty-two percent of the respondents did not know the service of dispatcherassisted CPR. Conclusions Our study indicated that proper knowledge of CPR, prior CPR training, and onsite bystander CPR assistance may enhance laypersons’ willingness in performing CPR. More emphasis should be exerted on the roles of chest compression and the EMS dispatcher assistance in CPR education. P296 Effects and limitations of an automated external defibrillator with audiovisual feedback for cardiopulmonary resuscitation: a randomized manikin study H Fischer1, J Gruber1, S Neuhold1, S Frantal1, E Hochbrugger1, B Steinlechner1, R Greif2 1 Medical University Vienna, Austria; 2University Hospital Bern and University of Bern, Switzerland Critical Care 2011, 15(Suppl 1):P296 (doi: 10.1186/cc9716) Introduction Correctly performed basic life support (BLS) and early defibrillation are the most effective measures to treat sudden cardiac arrest. Audiovisual feedback improves BLS. Automated external defibrillators (AEDs) with feedback technology may play an important role in improving CPR quality. The aim of this simulation study was to investigate whether an AED with audiovisual feedback improves CPR parameters during standard BLS performed by trained laypersons. Methods With ethics committee approval and informed consent, 68 teams (two flight attendants each) performed 12 minutes of standard CPR with the AED’s audiovisual feedback mechanism enabled or disabled. We recorded CPR quality parameters during resuscitation on a manikin in this open, prospective, randomized controlled trial. Between the feedback and control group we measured differences in compression depth and rate as the main outcome parameters and effective compressions, correct hand position, and incomplete
S106
decompression as secondary outcome parameters. An effective compression was defined as a compression with correct depth, hand position, and decompression. Results The feedback group delivered compression rates closest to the recommended guidelines (101 ± 9 vs. 109 ± 15/minute, P = 0.009), more effective compressions (20 ± 18 vs. 5 ± 6%, P <0.001), more compressions with correct hand position (96 ± 13 vs. 88 ± 16%, P <0.001), and less leaning (21 ± 31 vs. 77 ± 33%, P <0.001). However, only the control group adhered to the recommended compression depth (44 ± 7 mm vs. 39 ± 6, P = 0.003). Conclusions Use of an AED’s audiovisual feedback system improved some CPR quality parameters, thus confirming findings of earlier studies, with the notable exception of decreased compression depth, which is a key parameter that might be linked to reduced cardiac output. P297 Introduction of the 2005 cardiopulmonary resuscitation guidelines did not increase return of spontaneous circulation in a physicianstaffed prehospital emergency medical system G Gemes1, S Wallner2, G Wildner1, M Rigaud1, G Prause1 1 Medical University of Graz, Austria; 2Austrian Red Cross, Graz, Austria Critical Care 2011, 15(Suppl 1):P297 (doi: 10.1186/cc9717) Introduction Cardiopulmonary resuscitation (CPR) guidelines published by the European Resuscitation Council are intended to improve survival of cardiac arrest by implementing medical practice based on scientific findings. This study investigated whether the introduction of the 2005 CPR guidelines, which mandated several fundamental practice changes, improved the rate of return of spontaneous circulation (ROSC) in a physician-staffed prehospital emergency medical system. Methods Emergency physician protocol sheets from calls responding to cardiac arrest were reviewed and the following data were collected: bystander CPR and bystander use of a semi-automatic defibrillator, medication administered by emergency physicians, number of defibrillations, on-the-scene thrombolysis, occurrence of ROSC. These parameters were compared in a 3-year period from each before and after the introduction of the 2005 CPR guidelines. Results A total of 632 CPR protocols were analyzed, and the groups were comparable regarding age, sex, delay and initial rhythm. Bystander CPR was observed in 35% of the cases, with no difference between before and after the introduction of the 2005 guidelines and was not associated with an increase in ROSC. Bystander use of a defibrillator was rare (2.5%), but was associated with an increase in ROSC. When advanced life support by emergency physicians was conducted according to the 2000 guidelines, ROSC occurred in 29% of the cases, whereas ROSC occurred in 36% of the cases after 2005 (P = 0.058). Adrenaline and manual defibrillations were applied less frequently after 2005, whereas amiodarone and atropine were used more frequently. The application of thrombolysis was not different before and after 2005, but was associated with an increase in ROSC. Conclusions In our setting, the 2005 CPR guidelines apparently failed to reach out to laypersons, as bystander CPR was neither more frequent nor associated with an increase in ROSC. The 2005 guidelines had an impact on advanced life support practice by emergency physicians, but there was only a trend to an increase in ROSC. P298 Subarachnoid hemorrhage and cardiac arrest: should every resuscitated patient receive cranial imaging? C Leithner, D Hasper, CJ Ploner, C Storm Charite Universitaetsmedizin, Berlin, Germany Critical Care 2011, 15(Suppl 1):P298 (doi: 10.1186/cc9718) Introduction Intracranial hemorrhage, especially subarachnoid hemorrhage (SAH), may lead to cardiac arrest via a number of mechanisms. A recent prospective Japanese study found 16.2% of patients with SAH among those resuscitated from out-of-hospital cardiac arrest (OHCA) [1]. In contrast, a retrospective European study
Critical Care 2011, Volume 15 Suppl 1 http://ccforum.com/supplements/15/S1
found only 4% and the majority of patients had symptoms suggestive of SAH prior to OHCA [2]. Hence, different recommendations regarding routine cranial imaging may be obtained from the two studies. Methods We therefore evaluated retrospectively the rate of SAH in cardiac arrest patients consecutively admitted to our internal medicine ICU. For all patients, CCT and autopsy findings were obtained, if available. In addition we screened emergency room or final medical reports of SAH patients admitted to our neurosurgical ICU for OHCA and resuscitation. Results Cranial computed tomography (CCT) was performed in 129 of 421 (32.6%) cardiac arrest patients admitted to our internal medicine ICU, commonly on the day of admission (52% of CCTs) or within the first week (85%). None of the CCTs showed signs of SAH. Retrospective analysis of all autopsies (n = 18) revealed no postmortem diagnosis of SAH. A retrospective analysis of SAH patients admitted to our neurosurgical ICU revealed only one out-of-hospital resuscitation among 141 SAH patients (0.7%), in line with a recent study [3]. Conclusions Our data indicate a low rate of SAH in patients with OHCA, especially when not clinically suspected. For our patient cohort, routine CCT may not be indicated after cardiac arrest. The rate of SAH leading to OHCA seems to differ significantly between Japan and Germany. Our results have to be interpreted with care because of the retrospective study design and possible selection bias. Further prospective studies are needed to confirm the results. References 1.
2. 3.
Inamasu J, et al.: Subarachnoid haemorrhage as a cause of out-of-hospital cardiac arrest: a prospective computed tomography study. Resuscitation 2009, 80:977-980. Kürkciyan I, et al.: Spontaneous subarachnoid haemorrhage as a cause of out-of-hospital cardiac arrest. Resuscitation 2001, 51:27-32. Toussaint LG 3rd, et al.: Survival of cardiac arrest after aneurysmal subarachnoid hemorrhage. Neurosurgery 2005, 57:25-31.
P299 Predicting survival in cardiac arrest patients admitted to intensive care using the Prognosis After Resuscitation score R Porter, I Goodhart, A Temple Sheffield Teaching Hospitals NHS Trust, Sheffield, UK Critical Care 2011, 15(Suppl 1):P299 (doi: 10.1186/cc9719) Introduction Developed from meta-analysis in 1992, the Prognosis After Resuscitation (PAR) score consists of seven, relatively straightforward to calculate, variables with scores greater than 5 predicting nonsurvival [1]. The aim of this evaluation was to assess PAR scoring as a means of predicting nonsurvival of post-cardiac arrest patients admitted to the general intensive care unit (ITU) at Sheffield Teaching Hospitals NHS Trust (STH). Methods Previous local service reviews have collected data on hospital survival and PAR scoring between January 2002 and May 2008 [2,3]. In addition, from May 2008 to July 2010, post-cardiac arrest patients were identified from the admissions book and a medical notes review was carried out. Results Since 2002 a total of 225 post-cardiac arrest patients have been admitted to the ITU. Forty per cent survived until hospital discharge.
Figure 1 (abstract P299). PAR score and hospital outcome (2002 to 2010).
S107
The PAR score ranged between –2 and 18, with 0 being the most common score. Four patients from the 37 (13.5%), admitted to the ITU, with a PAR score of greater than 5 survived until hospital discharge. Forty-six per cent of patients with a PAR score of 5 or less survived to hospital discharge. See Figure 1. Conclusions Over the 8 years of review of our data we have only identified four patients where ongoing care was both appropriate and successful despite a PAR score greater than 5. We believe that these patients should have been admitted regardless of the PAR score due to the underlying pathology. The PAR score is an invaluable screening tool in justifying the decision not to admit a patient in whom it is felt critical care is not justified. However, caution must be used as the PAR score should be an aid to clinicians rather than the sole factor deciding appropriateness of critical care admission. References 1. 2. 3.
Ebell MH: Prearrest predictors of survival following in-hospital cardiopulmonary resuscitation: a meta-analysis. J Fam Pract 1992, 34:551-558. Meekings T, et al.: Audit of outcome of patients admitted to ITU following either in or out of hospital arrest. Intensive Care Med 2009, 35(Suppl 1):22. Millard C, et al.: Cardiac arrests admitted to ITU at STH between 2002 and 2006. Unpublished work, 2006.
P300 Survival after cardiac arrest: what is the situation in Lithuania? A Macas, G Baksyte, L Pieteris, A Vilke, A Peckauskas Lithuanian University of Health Sciences, Kaunas, Lithuania Critical Care 2011, 15(Suppl 1):P300 (doi: 10.1186/cc9720) Introduction Treatment of patients after sudden cardiac arrest remains a significant problem. Even after successful resuscitation, most patients have complications – one of the most serious and, unfortunately, very common being postanoxic brain injury. Aims of the study were to estimate the survival time for patients who had sinus rhythm restored after cardiac arrest but had neurological deficiency, and to estimate basic pathology that triggers cardiac arrest. Methods Retrospective data analysis was performed in the coronary care unit of Lithuanian University of Health Sciences Hospital – Kaunas Clinics. Records of 56 patients were analysed (37.5% women and 62.5% men). Age ranged from 46 to 88 years. Average age was 65.32 ± 12.59. Sinus rhythm was restored for all patients after cardiac arrest, but had a neurological deficiency. Results A total 89.28% of patients suffered out-of-hospital cardiac arrest. For 28.6% of patients it was enough to make CPR less than 15 minutes, before revival of sinus rhythm; 33.9% needed 15 to 30 minutes and 37.5% patients had to be resuscitated for more than 30 minutes. Almost one-half of patients (46.4%) did not survive 24 hours after resuscitation. The dominating basic pathology was acute myocardial infarction of the anterior wall (53.6%). The most common neurological deficiency was postanoxic coma (83.9%). Conclusions Almost one-half of patients, which had revival of sinus rhythm after cardiac arrest and had neurological deficiency, did not survive 24 hours after resuscitation. The most common basic pathology, which caused cardiac arrest, was acute myocardial infarction with dominating anterior wall infarction.
Critical Care 2011, Volume 15 Suppl 1 http://ccforum.com/supplements/15/S1
References 1. 2.
3.
Cokkinos P: Post-resuscitation care: current therapeutic concepts. Acute Cardiac Care 2009, 11:131-137. Hayakawa M, Gando S, Okamoto H, Asai Y, Uegaki S, Makise H: Shortening of cardiopulmonary resuscitation time before the defibrillation worsens the outcome in out-of-hospital VF patients. Am J Emerg Med 2009, 27:470-474. Garza AG, Gratton MC, Salomone JA, Lindholm D, McElroy J, Archer R: Improved patient survival using a modified resuscitation protocol for out-of-hospital cardiac arrest. Circulation 2009, 119:2597-2605.
P301 Prognosis after cardiac arrest O Touma, G Hadjipavlou John Radcliffe Hospital, Oxford, UK Critical Care 2011, 15(Suppl 1):P301 (doi: 10.1186/cc9721) Introduction Unconscious, mechanically ventilated survivors of cardiac arrest account for a large number of intensive care admissions. Such patients have a spectrum of outcomes, ranging from brain death to good recovery. Predicting the final neurological outcome during the early post-resuscitation phase is required and has been the centre of multiple studies. Methods We performed a literature review of studies assessing outcome predictors following cardiac arrest. We also reviewed national and international guidelines on the subject. Results In comatose adult patients after cardiac arrest, and who have not been treated with hypothermia and who do not have confounding factors, the absence of the pupillary light response and corneal reflex at day 3 provides the most reliable predictor of poor outcome. The absence of vestibulo-ocular reflexes at ≥24 hours and a GCS motor score of 2 or less at ≥72 hours are less reliable. The presence of myoclonus is not recommended for predicting poor outcome. The presence of myoclonic status epilepticus on day 1 is strongly associated with poor outcome. Several EEG findings are strongly, but not invariably associated with a poor outcome. Malignant EEG findings are associated with false predictive rate of 3%. Bilateral absence of the N2O cortical response to median nerve stimulation during somatosensory evoked potentials (SSEP) predicts poor outcome after 24 hours of cardiac arrest with FPR of 0.7%. There are no high-level studies that support the use of any imaging modality to predict outcome. There is some evidence that loss of distinction between grey and white matter on CT scan predicts poor outcome. Several studies have confirmed a relationship between serum neuron-specific enolase and poor outcome but the cut-off points are not clear. The value of serum S1000 and cerebrospinal fluid creatine kinase brain isoenzyme measurement is very limited. Therapeutic hypothermia after cardiac arrest complicates prognostication and evidence evaluating predictors of poor outcome in this situation is limited. Conclusions Reliable predictors of poor outcome after cardiac arrest are the absence of the pupillary and corneal reflexes at day 3. Bilateral absence of the N2O cortical response to median nerve stimulation during SSEP at day 1 is highly accurate. The use of EEG, CT, and neurological biomarkers is not reliable. Limited studies are available for predicting outcome after therapeutic hypothermia. References 1. 2.
Standards for the Management of Patients after Cardiac Arrest [http:// www.ics.ac.uk/intensive_care_professional/standards__safety_and_quality] Resuscitation Guidelines 2010 [http://www.resus.org.uk/pages/guide.htm]
P302 Incidence of lower respiratory tract infections in patients treated with post-cardiac arrest mild therapeutic hypothermia and selective digestive tract decontamination NA Vellinga, EC Boerma, MA Kuiper Medisch Centrum Leeuwarden, the Netherlands Critical Care 2011, 15(Suppl 1):P302 (doi: 10.1186/cc9722) Introduction Mild therapeutic hypothermia (MTH) is known to have a neuroprotective effect after cardiac arrest (CA). Among the wellrecognized side effects is an increased incidence of infections. A useful
S108
strategy in preventing lower respiratory tract infections (LRIs) during MTH is selective digestive tract decontamination (SDD). To this purpose, we examined the use of antibiotics and microbial flora in sputum in post-CA patients treated with MTH and SDD and compared this with the infection rate during MTH that has been reported in literature. Methods We examined sputum (endotracheal aspirate) of all post-CA patients who were treated with MTH (32 to 34°C) during 24 hours after ICU admission and SDD/cefotaxim (SDD/CFT) in our 16-bed mixed ICU in a teaching hospital in the Netherlands in the period January 2007 to December 2008 (n = 55; male = 44, female = 11). Sputum was collected at ICU admission and several days later as part of our SDD/CFT routine. Between 24 and 48 hours after admission, body temperature was actively held below 37°C. LRI was defined as the presence of a potentially pathogenic microorganism (PPM) and the use of antibiotics other than SDD/CFT. The presence of Candida albicans/Candida spp. was considered colonisation and was treated with aerosol antifungal medication. Results The in-hospital mortality in our cohort was 30.9%. As can be concluded from our results, in 59.5% of cases a PPM was present in the first sputum during SDD/CFT treatment after admission, with C. albicans being the most prevalent (23.6%). As compared with the sputum on admission, the cultures of the first sputum with SDD/CFT more often showed a monomicrobial isolate (25.5 vs. 40.5%). In sputum of 9/37 (24%) of our patients, a PPM (other than C. albicans/C. spp.) that justifies the use of antibiotics was present, with S. aureus being the most prevalent PPM (13.5%); 5/9 patients were treated with antibiotics, 1/9 received no additional antibiotics, 3/9 were lost to follow-up. Our results point towards a lower incidence of LRI in SDD/CFT-treated patients as compared with non-SDD/CFT-treated patients (88%) who were treated with MTH post-CA [1]. The incidence of LRI in our small cohort (24%) was also considerably lower as compared with a recent study by Nielsen and colleagues (48%) [2]. Conclusions Our results might point towards a beneficial role of SDD/ CFT in preventing LRI during treatment with MTH. References 1. 2
Nieuwendijk R, et al.: Intensive Care Med 2008, 34:S211. Nielsen N, et al.: Crit Care Med 2010. [Epub ahead of print]
P303 Earlier intra-arrest transnasal cooling may be beneficial M Castren1, P Nordberg2, FS Taccone3, JL Vincent3, L Svensson2, D Barbut4 1 Karolinska Institutet, Stockholm, Sweden; 2Södersjukhuset, Stockholm, Sweden; 3Erasme Hospital, Brussels, Belgium; 4BeneChill, Inc., San Diego, CA, USA Critical Care 2011, 15(Suppl 1):P303 (doi: 10.1186/cc9723) Introduction Animal studies suggest a life-saving benefit for intraarrest cooling. Transnasal evaporative cooling has sufficient heat transfer capacity for effective intra-arrest cooling and improves survival in swine. A 200-patient study showed transnasal cooling to be a safe and feasible method of intra-arrest cooling. The study also showed a solid trend to improved neurologically intact survival rates in those patients receiving intra-arrest transnasal cooling. Methods To determine effects on neurologically intact survival at 90 days from the addition of intra-arrest transnasal cooling compared with hospital-based cooling alone, patients in witnessed cardiac arrest of any rhythm and with CPR ≤15 minutes after a 112 call were randomized to intra-arrest transnasal cooling versus standard ACLS care in two European EMS systems. Transnasal cooling (RhinoChill (RC); BeneChill Inc., San Diego, CA, USA) was initiated using a mixture of volatile coolant plus oxygen for rapid evaporative heat transfer. In treatment patients, cooling was initiated pre-ROSC, during ongoing CPR. Patients in both groups were cooled upon hospital arrival. Results Forty-one patients have been included thus far. The median time from the 112 call for EMS to start CPR was 7 minutes and the time to initiate cooling was 17 minutes. ROSC was achieved in 8/19 (42%) of the RC group versus 8/22 (36%) of the control group. Site 1 initiated cooling at 11 minutes, and the ROSC rate at this site was 3/6 (50%) for RC and 1/9 (11%) for controls. EMS CPR was initiated at 5 minutes in RC versus 7 minutes in controls. Site 2 initiated cooling at 20 minutes, and the ROSC rate for this site was 5/13 (39%) for RC compared with
Critical Care 2011, Volume 15 Suppl 1 http://ccforum.com/supplements/15/S1
7/13 (54%) in the controls. EMS was initiated at 7 minutes in RC versus 9 minutes in controls. Conclusions Initiating transnasal cooling extremely early during arrest may be superior to later intra-arrest initiation in relation to ROSC rates. The impact of this ultra-early cooling on outcome remains to be determined. P304 Hyperoxia post cardiac arrest: experience of a UK ICU L Tameem, K Rooney, S Deep, M Thomas Bristol Royal Infirmary, Bristol, UK Critical Care 2011, 15(Suppl 1):P304 (doi: 10.1186/cc9724) Introduction A recent US multicentre study demonstrated an increased mortality in intensive care patients exposed to high arterial oxygen levels following return of spontaneous circulation (ROSC) after cardiac arrest [1]. We attempted to ascertain the incidence of hyperoxia and associated mortality in a similar cohort of patients in the UK. Methods We performed a retrospective observational study of a computerised database (Draeger Innovian) over a 14-month period (March 2009 to May 2010). All adult, nontraumatic cardiac arrests within 24 hours of admission to the ITU were included. Sixty-nine patients were identified. The following data points were analysed: FiO2, pO2 and outcome. Time to first ABG and the PaO2/FiO2 (P/F) ratio were calculated. As per the US study, hypoxia was defined as a pO2 <60 mmHg or P/F ratio <300; hyperoxia as PaO2 >300 mmHg. Normoxia was the values in between. Results Ninety per cent of patients had an arterial blood sample within the first hour after admission, compared with the US study where 27.5% of patients did not receive an arterial sample within the first 24 hours. Hyperoxia was only half as common in our population and was associated with the lowest mortality rate (50%). This is at odds with the Kilgannon study, which showed that hyperoxia was associated with the highest mortality [1]. Using their definition of hypoxia, there is no significant difference in mortality between hypoxia and normoxia in our study. If hypoxia is defined as pO2 <60 mmHg then the hypoxia rate is only 2.9% with a mortality rate of 100%. Conclusions In a single UK adult ICU attached to a cardiac arrest centre, hyperoxia after cardiac arrest was uncommon and associated with the lowest mortality. This is associated with increased vigilance in measuring arterial blood gases. Recent guidelines from the Resuscitation Council advise that inspired oxygen should be titrated to achieve a SaO2 of 94 to 98% due to potential harm from hyperoxia [2]. This assertion is not borne out by our data. The definition of hypoxia is important as there is a significant difference in both incidence of hypoxia and mortality rates dependent on whether the P/F ratio is considered. In practical terms, clinicians can only aim to optimise their arterial oxygen saturations, not the P/F ratios. References 1.
2.
Kilgannon J, et al.: Association between arterial hyperoxia following resuscitation from cardiac arrest and in-hospital mortality. J Am Med Assoc 2010, 303:2165-2171. Nolan J, et al.: UK Resuscitation Guidelines. London: UK Resuscitation Council; 2010.
S109
circulation and were admitted to an acute care unit were included. Blood ammonia and lactate levels were measured on arrival at hospital. The patients were classified into two groups: favorable outcome group (Cerebral Performance Category (CPC) 1 to 2 at 6-month follow-up), and poor outcome group (CPC 3 to 5). Basal characteristics obtained from the Utstein template and biomarker levels were compared between these two outcome groups. Independent predictors were selected from all candidates using logistic regression analysis. Results Ninety-eight patients were included. Ammonia and lactate levels in the favorable outcome group (n = 10) were significantly lower than those in the poor outcome group (n = 88) (P <0.05, respectively). On receiver operating characteristic analysis, the optimal cut-off value for predicting favorable outcome was determined as 170 μg/dl ammonia, 12.0 mmol/l lactate (area under the curve: 0.714 and 0.735, respectively). Logistic regression analysis identified ammonia (≤170 μg/ dl), therapeutic hypothermia and witnessed by emergency medical service personnel as independent predictors of favorable outcome. When both these biomarker levels were over threshold, the positive predictive value (PPV) for poor outcome was calculated as 100%. Conclusions Ammonia and lactate blood levels on arrival are independent neurological prognostic factors for OHCA. The PPV with the combination of these biomarkers predicting poor outcome is high enough to be useful in clinical settings. P306 Use of the Medicool™ cooling system to increase efficacy of therapeutic hypothermia post cardiac arrest I Goodhart, R Porter, A Temple Sheffield Teaching Hospitals NHS Trust, Sheffield, UK Critical Care 2011, 15(Suppl 1):P306 (doi: 10.1186/cc9726) Introduction Patients admitted to intensive care (ITU) at Sheffield Teaching Hospitals who have had a cardiac arrest are cooled according to the local therapeutic hypothermia (TH) protocol regardless of rhythm or location of arrest [1]. A previous audit identified poor efficacy in cooling patients to target [2]. Following this, the Medicool™ device was purchased to improve cooling. This aim of this evaluation is to assess the efficacy of cooling with Medicool™. Methods Following local audit committee approval, patients admitted between May 2008 and July 2010 were retrospectively identified from ITU admission records. The following data were collected: demographics, arrest and admission characteristics, details of TH and outcome. Previous audit data from 2008 were also examined [2]. Results Sixty-five patents were admitted to the ITU following cardiac arrest between May 2008 and July 2010. The median age was 67 years (29 to 81), 66% were male. Fifty-two per cent survived to hospital discharge. Forty-eight patients were eligible for cooling; in 43 cooling was performed: 26 were cooled using Medicool™ and 17 using traditional techniques. The median time to reach the target temperature was 4 hours with Medicool™ and 5 hours with traditional techniques. In six patients, cooling was abandoned. In patients who completed 24 hours of cooling, 57% of the Medicool™ patients and 31% of the traditionally cooled patients remained in the target temperature for the entire 24 hours. No patients (n = 20) in the previous audit were
P305 Ammonia and lactate blood levels on hospital arrival predict neurological outcome in patients with out-of-hospital cardiac arrest K Shinozaki1, S Oda2, T Sadahiro2, M Nakamura2, Y Hirayama2, E Watanabe2, Y Tateishi2, K Nakanishi3, N Kitamura4, H Hirasawa2 1 Chiba Aoba Municipal Hospital, Chiba City, Japan; 2Graduate School of Medicine, Chiba University, Chiba City, Japan; 3Narita Red Cross Hospital, Narita City, Japan; 4Kimitsu Chuo Hospital, Kisarazu City, Japan Critical Care 2011, 15(Suppl 1):P305 (doi: 10.1186/cc9725) Introduction There is no reliable predictor on arrival at hospital for neurological outcome of the patient with out-of-hospital cardiac arrest (OHCA). We hypothesize that ammonia and lactate may predict neurological outcome. Methods We performed a prospective observational study. Nontraumatic OHCA patients who gained sustained return of spontaneous
Figure 1 (abstract P306). Patients in whom the target temperature was maintained for 24 hours (P = 0.006).
Critical Care 2011, Volume 15 Suppl 1 http://ccforum.com/supplements/15/S1
S110
maintained within the target temperature for 24 hours using traditional techniques. See Figure 1. Conclusions The Medicool™ system increases both the cooling rate and the efficacy of cooling in patients undergoing TH. We would advocate the use of Medicool™ over the traditional cooling techniques. It is more effective and additionally when compared with other more invasive cooling techniques is cheaper to instigate, easy for healthcare professionals to use and is associated with less side effects. References 1. 2.
Porter R, et al.: Therapeutic Hypothermia Guidelines following Cardiac Arrest. Sheffield: Sheffield Teaching Hospitals; 2010. Meekings T, et al.: Audit of outcome of patients admitted to ITU following either in or out of hospital arrest. Intensive Care Med 2009, 35(Suppl 1):22.
P307 Choline kinetics in patients undergoing hypothermia treatment: a case observation in six cardiac arrest patients T Schröder Charité-Universitätsmedizin Berlin, Germany Critical Care 2011, 15(Suppl 1):P307 (doi: 10.1186/cc9727) Introduction Lately it has been proven that mild therapeutic hypothermia (MTH) after cardiac arrest (CA) weakens the prognostic value of both neurological tests and serum markers, established before MTH was implemented [1-3]. Current prognostication and decision criteria have to be re-evaluated as well as new markers being necessary. Whole blood choline (WBCHO) and plasma choline (PLCHO) are promising new markers in cardiac arrest patients and they are under investigation as markers for global tissue ischemia [4-6]. It is unknown whether the recommended MTH treatment in patients after CA will influence choline levels. Therefore we analyzed choline kinetics in CA patients undergoing hypothermia treatment as a feasibility trial. Methods All patients received MTH irrespective of the initial rhythm. Blood samples were taken on admission then again when reaching the therapeutic temperature of 33°C and after 12 hours of MTH at 33°C. All samples were stored at –80°C [4]. In order to determine the whole blood and plasma choline levels; high-pressure liquid chromatography combined with a mass spectrometer technique was used. Results Six patients after cardiac arrest were analyzed in this feasibility trial. Four patients were male, two female. Median age was 66.5 years (interquartile range 57.5 to 82.25). Choline analyses revealed in five patients increased choline levels (>10 μmol/l) on admission. Four patients showed a peak in both PLCHO and WBCHO when the 33°C target temperature during cooling was reached. Although MTH was maintained over 24 hours, in all cases the patients’ choline levels decreased already after 12 hours of treatment to low or even subnormal concentrations. Conclusions Both whole blood choline and plasma choline demonstrated a release pattern in patients after cardiac arrest undergoing hypothermia treatment. Larger studies have to evaluate the kinetics in detail and the potential prognostic implications of low or high choline levels in cardiac arrest patients. References 1. 2. 3. 4. 5. 6.
Nolan JP, et al.: Resuscitation 2010, 81:e1-e25. Leithner C, et al.: Neurology 2010, 74:965-969. Steffen IG, et al.: Critical Care 2010, 14:R69. Danne O, et al.: Expert Rev Mol Diagn 2010, 10:159-171. Korth U, et al.: Resuscitation 2003, 58:209-217. Brühl A, et al.: Life Sciences 2004, 75:1609-1620.
P308 Employing knowledge translation interventions to increase the use of therapeutic hypothermia post arrest: the SPARC Network Trial LJ Morrison, P Dorian, KN Dainty, S Brooks, K Thorpe, C Zhan, D Scales University of Toronto, Canada Critical Care 2011, 15(Suppl 1):P308 (doi: 10.1186/cc9728) Introduction Current guidelines recommend early institution of therapeutic hypothermia (TH) in survivors of out-of-hospital cardiac arrest (OHCA). However, recent surveys show that TH is delivered
Figure 1 (abstract P308). Successful TH across KT interventions.
inconsistently, incompletely, and with undue delay. Targeted knowledge translation (KT) strategies may increase the proportion of OHCA patients receiving TH. Methods We conducted a stepped-wedge cluster randomized trial to evaluate the effectiveness of a multi-faceted KT strategy for increasing TH use in a network of 37 hospitals. After a baseline period of 1 year, four wedges of six hospitals were randomized to receive 1 year of passive KT followed by 4 months of active KT. Passive KT included a generic protocol and order set; active KT included network events, performance feedback and ongoing nurse educator support. The primary outcome was the rate of successful TH, defined as a temperature of 32 to 34°C within 6 hours of emergency department (ED) arrival. Results During the study 4,742 OHCA patients were transported to hospital and 1,063 (22%) were eligible for TH. Overall, both KT interventions were effective at increasing the rate of successful TH (Figure 1), and passive KT led to marked improvements over baseline (96/395 vs. 30/320 patients; OR = 2.24, 95% CI = 1.54 to 3.26; P <0.05). Active KT did not improve the primary outcome compared with passive KT (86 of 348 patients with active KT; OR = 0.94, 95% CI = 0.70 to 1.28; P = 0.70); however, it did significantly increase rates of initiating TH in the ED (P = 0.04). Inappropriate TH remained rare (5 to 6% of patients) during both KT phases. Conclusions A multifaceted KT intervention markedly improved rates of TH in a large network of hospitals. Simple passive KT strategies were highly effective in increasing TH rates, whereas more active KT improved the use of TH in the ED. P309 Microvascular dysfunction in patients after successful resuscitation P Biever, T Schwab, P Roos, O Willnauer, U Denz, K Fink, C Bode, HJ Busch University Hospital Freiburg, Germany Critical Care 2011, 15(Suppl 1):P309 (doi: 10.1186/cc9729) Introduction The crucial role of the microcirculation for improved neurological outcome in patients after successful resuscitation has been discussed for many years. Near-infrared spectroscopy has been proposed as a non-invasive tool to measure continuously the haemoglobin saturation in the terminal vascularisation within the tissues (StO2) of thenar eminence and to detect microvascular dysfunction by performing a vascular occlusion test (VOT). This study’s purpose was to explore the alteration in microcirculation in patients after successful resuscitation.
Critical Care 2011, Volume 15 Suppl 1 http://ccforum.com/supplements/15/S1
Methods Since August 2010 to date, 23 successfully resuscitated patients were prospectively enrolled in an observational study in the medical intensive care department of Albert Ludwigs University, Freiburg. VOT and the time to recapillarisation were measured at admission to hospital (t1), after induction of mild therapeutic hypothermia (t2) and after re-warming (t3). The VOT was performed by stopping arterial inflow by inflating the arm cuff definitely above the systolic arterial pressure over 3 minutes and recorded with the InSpectra StO2 650 monitor (Hutchinson). The recorded StO2 alterations were analysed utilising the InSpectra StO2 Researcher´s Software V 4.01. Results Patients after successful resuscitation showed a baseline StO2 of 78.7 ± 8.3%. In all three time points a reduced occlusion slope (t1: –7.2 ± 1.8; t2: –5.8 ± 1.2; t3: 7.6 ± 2.7%/minute) as well as a reduced recovery slope (t1: 1.7 ± 1.1; t2: 1.2 ± 0.7; t3: 1.9 ± 1.7%/second) was seen. Time to recapillarisation was on average 2.7 ± 3.6 seconds. Conclusions Here we could demonstrate important alterations of the tissue-dependent microvascular capacity in patients after successful resuscitation. Considering these data, patients in the post-resuscitation phase may have severe microvascular dysfunction compared with healthy people as described in the literature. This study may highlight a new potentially critical clinical paradigm: extending the duration of mild therapeutic hypothermia may result in favourable neurological outcome by improving post-resuscitation microcirculation.
P310 Application of high-frequency jet ventilation for patients with severe traumatic brain injury DM Sabirov, RN Akalaev, MB Krasnenkova, AL Rosstalnaya Tashkent Institute of Postgraduate Medical Education, Tashkent, Uzbekistan Critical Care 2011, 15(Suppl 1):P310 (doi: 10.1186/cc9730) Introduction We carried out research of a brain blood-groove with the purpose of estimating cerebrovascular effects with high-frequency artificial ventilation of lungs in 30 patients with severe traumatic brain injury. Methods Traditional intensive therapy in conditions of various modes of respiratory support was performed: CMV – 10 patients, SIMV – 10 patients, HFJV – 10 patients. Adequacy of modes of ventilation was estimated on SpaO2 96 to 99%, and pCO2 34.7 to 35.2 mmHg. The median age was 36 ± 6 years, GCS was 7 to 9 points; the level of ICP exceeded 15 mmHg. We registered the cerebral blood flow velocity (Vm), resistance pial vessels (Pi), and dilatation reserve (Ri). Results The analysis of parameters of central and system hemodynamics with varying respiratory support revealed significant distinctions. At mode CMV: ICP – 28.6 ± 0.7 mmHg; Vm – 51.1 ± 1.4 cm/ second; Pi – 1.84 ± 0.1; Ri – 1.28 ± 0.01; CPP – 67.4 ± 1.3 mmHg. At SIMV: ICP – 31.7 ± 1.7 mmHg; Vm – 52.6 ± 4.1 cm/second; Pi – 1.60 ± 0.1; Ri – 1.23 ± 0.02; CPP – 68.0 ± 2.8 mmHg. At HFJV: ICP – 18.8 ± 2.9 mmHg; Vm – 57.8 ± 7.1 cm/second; Pi – 1.39 ± 0.2; Ri – 1.36 ± 0.01; CPP – 64.1 ± 6.1 mmHg. At CMV adverse conditions for venous return that can be accompanied by depression of intimate emission are created. Decrease in intimate emission will lead to decreased CPP that leads to spasm of pial vessels, and the dilatation reserve will not react to increased tone of pial vessels. At variance, SIMV is markedly similar to CMV interference of autoregulation parameters of the brain bloodgroove and system hemodynamics. At HFJV there are no negative phenomena inherent in traditional ventilation. Presence of the kept or increased intimate emission appears to provide more chance to keep cerebral perfusion. At HFJV an authentically lower level of resistance Pi, higher parameter of Ri and lower ICP is marked. This interferes with occurrence of the expressed spasm and ischemia of the brain. At both variants of traditional ALV, the expressed infringements of perfusion and resistance of vessels of the pial–capillary system accompanied by substantial growth are marked. Conclusions HFJV as respiratory support in severe traumatic brain injury, on a background of intracranial hypertension, has doubtless advantages before traditional methods of ALV. Its application provides preservation of active autoregulation of brain blood circulation, and promotes stabilization of intracranial pressure at a lower level.
S111
P311 Efficacy and safety of dopamine agonists in traumatic brain injury: a systematic review of randomized controlled trials AJ Frenette1, S Kanji2, L Rees2, DR Williamson1, MM Perreault3, AF Turgeon4, F Bernard1, DA Fergusson5 1 Hôpital du Sacré-Coeur de Montréal, Canada; 2Ottawa Hospital, Ottawa, Canada; 3Montreal General Hospital, Montreal, Canada; 4Hôpital Enfant-Jésus de Québec, Canada; 5Ontario Health Research Institute, Ottawa, Canada Critical Care 2011, 15(Suppl 1):P311 (doi: 10.1186/cc9731) Introduction In the ICU, dopamine agonists (DA) have been used in TBI patients to augment or accelerate cognitive recovery and rehabilitation. However, the efficacy and safety of DA in this population is not well established. Methods We conducted a systematic review of randomized controlled trials (RCT) examining the clinical efficacy and safety of DA in TBI. We searched MEDLINE, Embase and the Cochrane Central Register of Controlled studies up to June 2010. We sought trials comparing the effect of a DA with either placebo, standard treatment or another active comparator. We included trials addressing efficacy using any outcome measure as a primary outcome and/or safety. There was no restriction for age, date, or language of publication. We excluded unpublished and animal trials. Sensitivity analyses were planned to evaluate the potential effect of timing of TBI, age, drugs and year of publication on efficacy. Results Among the 790 citations identified, 20 RCTs evaluating methylphenidate, amantadine and bromocriptine were eligible. Significant heterogeneity pertaining to timing from injury to randomization, mechanism of trauma, severity of TBI and age was observed between and within trials and precluded from any pooling of data. Efficacy outcomes included mainly neuropsychological measures of cognitive functioning. A total of 76 different neuropsychological tests were used, but most of them (59%) only once. For the 12 tests used in more than one study, statistically positive results were reproduced three times. Only five studies systematically assessed safety using predefined objective measures or tools. No trend could be drawn from the analysis of efficacy and safety in any of the predefined categories of outcome. Important sources of bias in the studies were of major concern, including inappropriate use of cross-over design and underreporting of randomization methods. Conclusions We observed a variability of neuropsychological tests. This may reflect disagreement regarding clinical relevance of cognitive and behavioral outcomes and lack of a gold standard test for each domain. Considering the absence of consensus along with the high risk of bias in included trials, more research is warranted before DA can be recommended to improve cognitive recovery in critically ill TBI patients.
P312 Update on the RESCUEicp decompressive craniectomy trial PJ Hutchinson1, AG Kolias1, I Timofeev1, E Corteen1, M Czosnyka1, DK Menon2, JD Pickard1, PJ Kirkpatrick1 1 Academic Division of Neurosurgery, Addenbrooke’s Hospital & University of Cambridge, UK; 2Neurocritical Care Unit & University Department of Anaesthesia, Addenbrooke’s Hospital & University of Cambridge, UK Critical Care 2011, 15(Suppl 1):P312 (doi: 10.1186/cc9732) Introduction The fundamental pathophysiological process following head injury is the development and propagation of an escalating cycle of brain swelling, increase in intracranial pressure (ICP), reduction in blood supply and oxygen delivery, energy failure and further swelling, enhancing brain injury and poor outcome. The aim of the RESCUEicp trial (Randomised Evaluation of Surgery with Craniectomy for Uncontrollable Elevation of ICP) is to provide class I evidence as to whether decompressive craniectomy is effective for the management of patients with raised and refractory ICP following traumatic brain injury (TBI). Methods An international multicentre randomised trial comparing decompressive craniectomy with optical medical management
Critical Care 2011, Volume 15 Suppl 1 http://ccforum.com/supplements/15/S1
(including barbiturate therapy). Inclusion criteria: TBI, age 10 to 65, ICP (>25 mmHg for 1 to 12 hours, refractory to first-line treatment). Exclusion criteria: treatment with barbiturates pre-randomisation, primary decompression (during evacuation of mass lesion), bilateral fixed and dilated pupils, bleeding diathesis, devastating injury unlikely to survive >24 hours. In this study, patients are managed on ICUs using a standard protocol. The major objective of this protocol is to maintain ICP <25 mmHg by applying treatment measures in a number of stages. The total number of patients will be 400 (200 in each arm of the study) for a 15% difference in outcome (power = 80%, P = 0.05). The primary outcome measure was extended Glasgow Outcome Score at 6 months. Results Over 280 patients have been recruited to date from more than 40 centres in 17 countries. The follow-up rate at 6 months is 96%. To date, evaluation of the first 182 patients shows equal distribution of characteristics between the two arms. Median age is 33 years and 80% of patients are male. Four percent were hypoxic and 13% hypotensive at initial presentation. Seventy percent had an initial GCS of 3 to 8, 19% a GCS of 9 to 12 and 11% a GCS of 13 to 15. Conclusions Randomising patients with TBI to decompressive craniectomy versus optimal medical management is feasible. Whether this operation is effective remains to be seen. We welcome the participation of more centres. Reference 1.
RESCUEicp Study [www.rescueicp.com]
P313 Cerebral oxygen monitoring in intensive care G Hadjipavlou1, O Touma2 1 Nuffield Department of Anaesthetics, Oxford, UK; 2Oxford Radcliffe Hospitals, Oxford, UK Critical Care 2011, 15(Suppl 1):P313 (doi: 10.1186/cc9733) Introduction The purpose of this literature review is to look at the potential of cerebral oxygen monitoring in the intensive care setting and how this monitoring modality will impact our current practice. Methods A PubMed literature search was conducted using the search items ‘cerebral, oxygenation, and monitoring’. The search was limited to adults and the search items limited to the title or abstract. Articles selected were those that demonstrated a positive or negative benefit of cerebral oxygen monitoring on neurological outcome after surgery or intensive care. Results The search revealed a total of 449 possible articles when conducted in December 2010. This was narrowed down to 18 articles related to monitoring cerebral oxygen. Patient outcomes: cerebral oxygen monitoring and the aggressive treatment of cerebral hypoxia reduced mortality and improved long-term outcomes after traumatic brain injury and coronary artery bypass surgery. Near-infrared spectroscopic cerebral oxygen monitoring is capable of detecting ischaemic cerebral perfusion deficits and may be more sensitive than transcranial Doppler in assessing blood flow and detecting delayed ischaemic deficits in subarachnoid haemorrhage. Cerebral hypoxia can persist despite good cerebral perfusion and normal intracranial pressure. Cerebral oxygenation monitoring can prevent iatrogenically driven hyperoxia and hyperperfusion, and can detect cerebral hypoxia before drops in standard pulse oximetry monitoring. Conclusions The authors believe evidence is gathering suggesting that cerebral oxygen monitoring may play an important role in neurointensive and adult intensive care centres. Cerebral hypoxia worsens long-term neurological outcomes, and this modality has potential to help reduce morbidity. References 1. 2. 3. 4. 5. 6. 7.
Yokose N, et al.: World Neurosurg 2010, 73:508-513. Carrera E, et al.: J Neurol Neurosurg Psychiatry 2010, 81:793-797. McCarthy MC, et al.: Surgery 2009, 146:585-591. Terborg C, et al.: Eur Neurol 2009, 62:338-343. Narotam PK, et al.: J Neurosurg 2009, 111:672-682. Ramakrishna et al.: J Neurosurg 2008, 109:1075-1082. Murkin JM: Anesth Analg 2007, 104:51-58.
S112
P314 Optimising follow up and outcome assessments in traumatic brain injury trials LJ Murray1, JD Cooper1, JV Rosenfeld1, Y Arabi2, A Davies1, P D’Urso3, T Kossmann3, J Ponsford4, P Reilly5, I Seppelt6, R Wolfe4, S Vallance1, B Howe4, M Alkishi2 1 The Alfred Hospital, Melbourne, Australia; 2King Fahad National Guard Hospital, Riyadh, Saudi Arabia; 3Epworth Health Care, Melbourne, Australia; 4 Monash University, Melbourne, Australia; 5Adelaide University, Adelaide, Australia; 6Nepean Hospital, Sydney, Australia Critical Care 2011, 15(Suppl 1):P314 (doi: 10.1186/cc9734) Introduction Traumatic brain injury studies predominantly use an assessment of neurological function some time after hospital discharge as the primary endpoint. Recent studies have followed up patients at 6 months after injury with very variable loss to follow up [1,2]. We have established an outcome process that minimises loss to follow up and maximises the quality of the outcome assessment. Methods The DECRA trial is a prospective randomised trial of 155 patients from Australia, New Zealand, and Saudi Arabia. Patients with severe traumatic brain injury and refractory intracranial hypertension were randomly assigned to receive either a decompressive craniectomy or to continue with standard medical management. The primary outcome was patient’s neurological function using the Extended Glasgow Outcomes Scale (GOSE) at 6 months after injury. Patients were tracked following hospital discharge by the Research Coordinators at each participating site. The GOSE assessments were conducted by three blinded assessors using structured telephone questionnaires. The assessment team was led by an experienced assessor. Two assessors were located in Australia and one assessor in Saudi Arabia. Assessors were trained using a prepared training package of examples and selftesting exercises. The chief assessor reviewed the outcome assessments performed by the other assessors. Any complex assessments were referred to an assessment panel for a consensus decision. Results DECRA commenced recruitment in 2003 and the last patient was enrolled in April 2010. Research coordinators successfully tracked all surviving patients, which resulted in a 100% follow-up rate for the primary study outcome measure. Conclusions We have successfully completed a prospective randomised controlled trial with zero loss to follow up for the primary outcome measure of GOSE at 6 months. Assessments were reviewed by the chief assessor and a consensus panel if required to ensure consistency of the assessment. Acknowledgements The authors thank the DECRA Trial Investigators, the ANZICS Clinical Trials Group, and the Neurosurgical Society of Australia. Funding was received from NHMRC, TAC, VNI, VTF, ANZIC Research Foundation and WA Institute for Medical Research. References 1. 2.
Bernard SA, et al.: Ann Surg 2010, 252:959-965. Maas AI, et al.: Lancet Neurol 2006, 5:38-45.
P315 Optimising the consent process in severe traumatic brain injury trials LJ Murray1, D Cooper1, JV Rosenfeld1, Y Arabi2, A Davies1, P D’urso3, T Kossmann3, J Ponsford4, P Reilly5, I Seppelt6, R Wolfe4 1 The Alfred Hospital, Melbourne, Australia; 2King Fahad National Guard Hospital, Riyadh, Saudi Arabia; 3Epworth Healthcare, Melbourne, Australia; 4 Monash University, Melbourne, Australia; 5Adelaide University, Adelaide, Australia; 6Nepean Hospital, Sydney, Australia Critical Care 2011, 15(Suppl 1):P315 (doi: 10.1186/cc9735) Introduction Severe traumatic brain injury (TBI) is a condition often associated with grave consequences and it remains a major public health problem globally. Clinical trials to improve management and treatment of this condition are a necessity; however, there are many issues that impact on the design and conduct of such trials including the complex and sensitive issue of consent. Obtaining consent for severe TBI trials is inherently complicated and difficult because the
Critical Care 2011, Volume 15 Suppl 1 http://ccforum.com/supplements/15/S1
S113
family are being asked to make an informed decision when they are shocked, anxious, grieving and frequently physically exhausted. We established a process during the DECRA trial to minimise the difficulties and to ensure that consent was obtained with sensitivity and in an informed manner. Methods The DECRA trial is a prospective randomised trial of 155 patients from Australia, New Zealand, and Saudi Arabia. Patients with severe traumatic brain injury and refractory intracranial hypertension were randomly assigned to receive either a decompressive craniectomy or to continue with standard medical management. Surrogate consent was obtained prior to randomisation and all participating hospitals had obtained approval from their Human Research & Ethics Committee. Results Guidelines for obtaining consent were included in the protocol and manual of operations, and were discussed at the investigators’ meetings. The guidelines highlighted the importance of early communication with the patient’s medical team regarding possible recruitment into the trial, updating the family about the patient’s condition prior to the consent discussion, following a basic script to ensure all aspects of the trial were covered in the discussion, allowing time for the discussion including follow-up discussions and listening carefully to the family’s questions. DECRA commenced recruitment in 2003 and the last patient was enrolled in April 2010; 168 consent discussions were held with a 92% consent rate. Conclusions Consent rates in brain injury studies in the critical care setting can be optimised by following a protocolised consent process. Acknowledgements The authors thank the DECRA Trial Investigators, the ANZICS Clinical Trials Group, and the Neurosurgical Society of Australia. Funding was received from NHMRC, TAC, VNI, VTF, Intensive Care Foundation and WA Institute for Medical Research.
Introduction Given the burden of disability arising from severe traumatic brain injury (TBI) [1], plain assessment of mortality certainly underestimates the impact of TBI. Therefore, risk prediction models need to provide poor neurological outcome estimates other than mortality. The aim of the study was to determine whether a simple combination of early clinical indices may be predictive of disability after ICU discharge. Methods A prospective study enrolling 133 patients (109 male/76 female) with TBI (associated or not with multiple trauma) and GCS ≤8 admitted to our ICU. Demographics, acute care preadmission factors Table 1 (abstract P316) Parameter
GOS 1 to 3 (n =56)
GOS 4 to 5 (n = 77)
P value
Age (years)*
42.9 ± 22.8
31.9 ± 14.8
0.002
Hypotension (%)
28.6
9
0.03
Hypoxia (%)
23.2
5.2
0.01
ICU pupils (abnormal) (%)
35.7
1.3
0.000
64.3
37.6
0.000
ISS*
35.9 ± 14.7
23.9 ± 10.3
0.000
APACHE II*
222.2 ± 5.5
15.03 ± 5.3
0.000
GCS*
4.9 ± 1.8
6.5 ± 1.8
0.000
RTS*
4.1 ± 1.3
5.02 ± 1.3
0.04
SOFA*
6.5 ± 3.0
4.1 ± 2.1
0.005
*Data presented as mean ± SD.
1.
Husson E, et al.: J Rehabil Med 2010, 42:425-436.
P317 Prognostic value of prehospital single measurement of N-terminal pro-brain natriuretic peptide and troponin T after acute ischemic stroke S Grmec, B Kit, E Hajdinjak ZD dr. Adolfa Drolca Maribor, Slovenia Critical Care 2011, 15(Suppl 1):P317 (doi: 10.1186/cc9737)
P316 Early clinical indices predicting functional survival in severely head-injured patients M Zouka, G Tsaousi, E Anastasiou, E Geka, E Euthymiou, I Soultati, M Giannakou AHEPA University Hospital, Thessaloniki, Greece Critical Care 2011, 15(Suppl 1):P316 (doi: 10.1186/cc9736)
CT scan grade >2 (%)
(hypotension and hypoxemia), injury severity (GCS, ISS, RTS, pupil reactivity, CT scan grade) and acute physiological disturbance (APACHE II – 24 hours, SOFA) were evaluated. According to functional outcome (GOS) upon ICU discharge, two subgroups of patients were identified: GOS 4 to 5 (favorable outcome), and GOS 1 to 3 (poor outcome). Independent t test, Mann–Whitney test, logistic regression, ROC curve and chi-squared analyses were used for statistical purposes. Results Data are presented in Table 1. Overall mortality was 32.3% (n = 43). Logistic regression analysis identified APACHE II (P = 0.004), CT scan grade (P = 0.002) and pupil reactivity upon ICU admission (P = 0.01) as the strongest predictors of functional outcome. Area under the ROC curve for APACHE II score was 0.841 (95% CI: 0.767 to 0.899, P <0.0001). Conclusions Acute physiological disturbance, poor preadmission clinical data and neurological signs, presence of severe intracerebral injuries combined with additional extracerebral injuries and advanced age, seem to be powerful determinants that adversely influence the early course of recovery and functional survival of patients with sustained severe TBI. Among them APACHE II, CT scan grade and pupil reactivity upon ICU admission were identified as the strongest early prognostic indicators. References
Introduction The association between levels of N-terminal fragment of pro-brain natriuretic peptide (NT-proBNP), troponin T and prognostic outcomes in patients after ischemic stroke were tested. Acute-phase levels of NT-pro-BNP and troponin T have been associated with mortality when measured in patients with an acute ischemic stroke. However, the value of pre-interventional levels of NT-pro-BNP and troponin T measured in the field as a prognosticator of in-hospital mortality after ischemic stroke is limited. Methods This prospective study was performed in the Center for Emergency Medicine Maribor, Slovenia from June 2006 to May 2010. Blood samples for NT-proBNP and troponin T levels were collected in the prehospital setting and examined with a portable Cardiac Raeder device after acute ischemic stroke in 106 consecutive patients (204 patients with acute stroke were excluded). ECG and other variables previously associated with severity of stroke were also recorded and assessed as independent predictors of inpatient mortality. Results Troponin T was elevated (>0.04 μg/l) in 16 out of 106 patients (15.1%). Twenty-three patients died in the hospital. Raised troponin T occurred in eight patients in this group (8/23; 34.8%) versus eight patients (8/83; 9.6%) who survived until hospital discharge (P <0.01). NTpro-BNP concentrations were significantly higher in decedents (508 pg/ ml, 10th to 90th percentiles 98 to 3,000) than in the 83 survivors (153 pg/ ml, 10th to 90th percentiles 49 to 690, P <0.001). In logistic regression analyses, a rise in troponin T (odds ratio, 1.8; 95% CI, 1,03 to 8.43, P <0.01) and NT-pro BNP (odds ratio, 5.80; 95% confidence interval, 1.33 to 22.72, P <0.01) were significantly associated with a poor short-term outcome. Conclusions The NT-pro-BNP and troponin T concentrations measured during the prehospital phase of care after acute ischemic stroke are strong predictors of in-hospital mortality. References 1. 2.
Fure B, Bruun Wyller T, Thommessen B: Electrocardiographic and troponin T changes in acute ischaemic stroke. J Intern Med 2006, 259:592-597. Jensen JK, Atar D, Kristensen SR, Mickley H, Januzzi JL Jr: Usefulness of natriuretic peptide testing for long-term risk assessment following acute ischemic stroke. Am J Cardiol 2009, 104:287-291.
Critical Care 2011, Volume 15 Suppl 1 http://ccforum.com/supplements/15/S1
S114
P318 Stroke and thrombolysis: an old disease with a new approach N Catorze, L Pessoa, M Abu Hazima, F Carrilho Centro Hospitalar Médio Tejo, Abrantes, Portugal Critical Care 2011, 15(Suppl 1):P318 (doi: 10.1186/cc9738) Introduction The incidence of stroke doubles for every decade after 45 years of age, and 70% of these events occur in the over 65s. A rational approach with a thrombolysis protocol can diminish this clinical and social burden. Methods In the past 20 months all patients with acute stroke were referred to ICU staff for evaluation and compliance to effective thrombolysis until 4.30 hours from the onset of symptoms. All clinicians were advised and triage in the ED was adapted using NIHSS. Results In this period 152 patients were evaluated and 34 (22.4%) were eligible for reperfusion treatment. Men were more prevalent than women (70.6 vs. 29.4%) and age was distributed between 29 and 82 years. Risk factors were equally distributed (Table 1). Twenty-nine patients (88%) received thrombolysis within 3 hours of symptoms onset and 19 (63%) got better NIHSS after treatment. Eleven patients (37%) never recovered. Five out of 34 patients (12%) were treated in the 3 to 4.30 hours window and three received benefit. All deaths were related to ischemia progression. Table 2 presents complications during the ICU stay. Table 1 (abstract P318). Stroke risk factors Factor
n
High blood pressure
25
AF
4
>Lipids
6
Diabetes
4
>BMI
6
Smoke
10
Methods Patients fulfilling the criteria of clinical sepsis and showing at least two organ dysfunctions other than the brain were included (n = 14). Nonseptic persons without previous diseases affecting cerebral vasoreactivity served as controls (n = 20). Transcranial Doppler blood flow velocities were measured at rest and at 5, 10, 15 and 20 minutes after intravenous administration of 15 mg/kg BW acetazolamide. The time course of the acetazolamide effect on cerebral blood flow velocity (cerebrovascular reactivity) and the maximal vasodilatory effect of acetazolemide (cerebrovascular reserve capacity (CRC)) were compared among the groups. Results Mean blood flow velocity in the middle cerebral artery was lower (41.7 ± 13.3 cm/second) in septic patients at rest than in controls (58.2 ± 12.0 cm/second, P <0.01). Pulsatility indices were higher among septic patients at rest (1.56 ± 0.79) than in controls (0.85 ± 0.20, P <0.01). Assessment of the time course of the vasomotor reaction showed that patients with sepsis reacted in similar fashion and extent to the vasodilatory stimulus than did control persons. When assessing the maximal vasodilatory ability of the cerebral arterioles to acetazolamide during vasomotor testing, we found that patients with sepsis reacted to a similar extent to the drug than did control subjects (CRC controls:46.2 ± 15.9%, CRC SAE: 63.2 ± 28.4%). Conclusions Cerebral vasoreactivity to acetazolemide is not impaired in patients with severe sepsis. Our data suggest that the reaction of the cerebral arterioles to vasoactive stimuli changes along with the severity of the septic process. Reference 1.
Szatmari et al.: Crit Care 2010, 14:R50.
P320 Significance of admission temperature and impact on mortality in critically ill neurological patients F Rincon1, C Schorr2, C Hunter2, B Milcareck2, R Dellinger2, J Parrillo2, S Zanotti2 1 Thomas Jefferson University, Philadelphia, PA, USA; 2Cooper University Hospital, Camden, NJ, USA Critical Care 2011, 15(Suppl 1):P320 (doi: 10.1186/cc9740)
Table 2 (abstract P318). Complications during the ICU stay Complication
n
Bradycardia
8
Pneumonia
5
Hemorrhage
4
Death
4
Conclusions The clinicians’ compliance and patients’ reference to dedicated teams (stroke teams) resulted in the treatment of 22.4% of observed patients (1 to 11% in the literature). Some complications could be avoided with simple measures. This protocol should continue and should be emphasized. Reference 1.
Alteplase for the Treatment of Acute Ischaemic Stroke [http://www.nice. org.uk/nicemedia/live/11618/33974/33974.pdf ]
P319 Cerebral vasoreactivity is not impaired in patients with severe sepsis S Szatmári, Z Fülep, P Sárkány, C Antek, P Siró, C Molnár, B Fülesdi University of Debrecen, Hungary Critical Care 2011, 15(Suppl 1):P319 (doi: 10.1186/cc9739) Introduction In a previous report it was observed that acetazolamideinduced cerebrovascular reactivity is impaired in patients with sepsisassociated encephalopathy without organ dysfunction [1]. The aim of the present work was to assess whether patients suffering from severe sepsis also have these impaired cerebrovascular responses.
Introduction The purpose of this study is to test the hypothesis that hyperthermia is associated with increased mortality after neurological injury using a robust multicenter ICU database. Methods A multicenter cohort study using the Project IMPACT critical care database of ICUs at 120 US hospitals between 2003 and 2008. Patient inclusion criteria were age older than 17 years, acute neurological injury within 24 hours of admission (acute ischemic stroke (AIS), subarachnoid hemorrhage (SAH), intracerebral hemorrhage (ICH), subdural hematoma (SDH), and traumatic brain injury (TBI)), and admission to the ICU. Patients were divided into three main groups based on definitions of hyperthermia and hypothermia in the ICU. Hyperthermia was defined as temperature greater than 37.5°C, hypothermia as a temperature lower than 36.5°C, and normothermia, not classified as hyperthermia or hypothermia. The outcome measure was in-hospital mortality. Results Over the 8-year period, the Project IMPACT database contained data on more than 700,000 ICU admissions. We found 16,889 patients that met the inclusion criteria. The mean age was 61 ± 19 years, 9,339 (56%) were male, and 12,634 (76%) were white. Of these, 3,081 (18%) had AIS, 2,413 (14%) had SAH, 4,315 (26%) had ICH, 2,748 (16%) had SDH, and 4,317 (26%) had TBI. The mean admission temperature was 37.5 ± 3°C and the overall mortality was 3,628/16,676 (22%). Of the total cohort, 7,878 (47%) had hyperthermia, 689 (4%) had hypothermia, and 8,167 (49%) were normothermic. The hyperthermia group had a high in-hospital mortality (2,180/7,822 (28%)) compared with normothermia (1,169/8,167 (14%)) but the hypothermia group had significantly higher in-hospital mortality (279/687 (41%)). In a preliminary multivariate model controlling for potential confounders (age and gender), hyperthermia (OR, 1.2; 95% CI, 1.1 to 1.23) and hypothermia (OR, 1.9; 95% CI, 1.7 to 2.1) increased the odds of hospital mortality. Conclusions Among critically ill neurological patients admitted to the ICU, hyperthermia and hypothermia are associated with increased
Critical Care 2011, Volume 15 Suppl 1 http://ccforum.com/supplements/15/S1
in-hospital mortality compared with normothermia. The implications of these findings require further study. Reference 1.
Hutchinson JS, et al.: Hypothermia therapy after traumatic brain injury in children. N Engl J Med 2008, 358:2447-2456.
P321 Prognostic value of brain glucose levels in the outcome of patients with spontaneous cerebral hemorrhage DC Papadopoulos1, TK Zafeiridis1, M Mpakopoulou2, G Paraforos1, A Chovas1, V Christodoulou1, A Komnos1 1 General Hospital of Larisa, Greece; 2University Hospital of Larissa, Greece Critical Care 2011, 15(Suppl 1):P321 (doi: 10.1186/cc9741) Introduction Spontaneous cerebral hemorrhage is a major cause of morbidity and mortality. Bedside, multimodal cerebral monitoring is a safe and promising technique for the diagnosis and prevention of secondary brain damage. The aim of this study is to investigate whether microdialysis parameters can be used as prognostic factors in patients with spontaneous cerebral bleeding, and their association with the long-term outcome. Methods Twenty-seven patients with GCS <8 were included in the study. Mean age was 57.78 ± 9.94 years. The outcome of the patients was evaluated according to the Glasgow Outcome Scale (GOS) 3 and 6 months post-discharge. Data were evaluated using the SPSS 17.0 and P <0.05. Results In a linear statistical model that included all of the microdialysis parameters, only glucose was inversely associated with the patient outcome. Conclusions We can use microdialysis to determine cerebral glucose levels, which we found to be associated with patient outcome. References 1. 2.
Cesarini KG, et al.: Acta Neurochir (Wien) 2002, 144:1121-1131. Nilsson OG, et al.: J Neurosurg 2002, 97:531-536.
P322 Potential use of transcranial sonography in the sick patient G Hadjipavlou1, O Touma2 1 Nuffield Department of Anaesthetics, Oxford, UK; 2Oxford Radcliffe Hospitals, Oxford, UK Critical Care 2011, 15(Suppl 1):P322 (doi: 10.1186/cc9742) Introduction Transcranial sonography (TCS) is used to image brain parenchyma and vasculature. There is a growing body of evidence suggesting a possible imaging role and that Doppler reflects intracranial pressure. The authors conducted a review of this growing literature and propose potential uses of this modality in the assessment of the sick patient. Methods A search for papers of special interest was conducted using PubMed and the search items: transcranial, ultrasound, sonography, raised intracranial pressure, haemorrhage, and traumatic head injury. Articles where restricted to adults and considered relevant if they described standardisation, comparisons with other modalities, case studies or explored potential novel uses. Results TCS has been standardised and referenced to MRI imaging. It is able to identify intracerebral, and subarachnoid haemorrhage as areas of hyperechogenicity. Compared with CT, it identifies haemorrhage or infarct in 95% of cases. TCS is a reliable quantitative monitor of intracranial pressure. The pulsatility index (PI), a derived index from Doppler flow parameters of the middle cerebral artery, correlates significantly with invasive measures of intracranial pressure (ICP); R = 0.98, P <0.001. A formula can be used to convert the PI into ICP. Conclusions TCS has imaging potential, but is unlikely to replace CT for this purpose. The role for TCS in the assessment and monitoring of the sick patient starts where CT fails. It can be used as a quick screening adjunct to the primary survey looking for acute brain injury in those unstable for transfer. It can be used to monitor the size of CT-identified haemorrhage over time or with GCS removing the need for multiple trips to the scanner. It could help identify raised ICP and therefore extra risk from lumbar puncture in the meningitic patient with a normal CT.
S115
Finally it allows non-invasive monitoring of ICP in the head-injured patient in whom intubation and sedation are required, but invasive monitoring would be considered excessive. References 1. 2. 3. 3. 5. 6.
Caricato A, et al.: Intensive Care Med 2010, 36:1091-1092. Czosnyka M, et al.: J Neurosurg 1998, 88:802-808. Bellner J, et al.: Surg Neurol 2004, 62:45-51. Kern R, et al.: Ultrasound Med Biol 2005, 31:311-315. Maurer M, et al.: Stroke 1998, 29:2563-2567. Meyer-Wiethe K, et al.: Cerebrovasc Dis 2009, 27(Suppl 2):40-47.
P323 Correlation of thermal Doppler flowmetry, brain tissue oxygen and microdialysis values in patients with severe subarachnoid hemorrhage and traumatic brain injury: a preliminary report DC Papadopoulos1, A Komnos1, AS Filippidis2, T Chatzopoulos1, KN Fountas3, G Vretzakis3, K Paterakis3, D Karangelis3, TK Zafeiridis1 1 General Hospital of Larisa, Greece; 2Barrow Neurological Institute, St Joseph’s Hospital and Medical Center, Phoenix, AZ, USA; 3University Hospital of Larissa, Greece Critical Care 2011, 15(Suppl 1):P323 (doi: 10.1186/cc9743) Introduction The purpose of this study is to investigate the relationship between continuously monitored regional cerebral blood flow (CBF), brain tissue oxygen (PbrO2) and microdialysis values in subarachnoid hemorrhage and traumatic brain injury patients. Methods Advanced multimodal neuromonitoring including monitoring of PbrO2 (Licox; GMS), CBF (QFlow; Hemedex) and brain lactate, pyruvate, lactate/pyruvate ratio, glycerol and glucose values using microdialysis (CMA600; Microdialysis) was performed so far in eight patients with severe subarachnoid hemorrhage (n = 5) and traumatic brain injury (n = 3) for an average of 9.2 days. Additional recorded parameters include ICP, CPP, MABP, CVP, local brain temperature, body core temperature, PCO2, and blood glucose. The cerebral monitoring probes are inserted via a bolt (ICP, PbrO2, microdialysis) and an additional burr hole (CBF). All probes are positioned in the penumbra and location is verified by a brain CT. The study is to be conducted for an estimated total of 30 patients suffering the above pathologies. Results The data so far indicate a strong correlation between CBF and PbrO2 values. There seems to be a link between brain glucose levels and CBF values; however, it is not as clear as regards the CBF–PbrO2 correlation. This may be due to the fluctuation of brain glucose because of brain ischemia, hyperemia, hypermetabolism or hypometabolism. So far we were able to establish a correlation of CBF–PbrO2 and lactate/pyruvate ratio only in persistently low CBF–PbrO2 values (CBF <12 ml/100 g/minute, PbrO2 <10 mmHg for more than 64 minutes). Conclusions This is a preliminary report of a study in human patients with severe subarachnoid hemorrhage and traumatic brain injury. The results indicate correlations of varying significance between the pooled data. We hope that the outcome of our study will be able to clarify the pathophysiology of severe brain injury and guide us in the titration of therapy, as it is needed by each individual patient. References 1. 2. 3.
Stuart RM, et al.: Neurocrit Care 2010, 12:188-198. Tisdall MM, et al.: Br J Anaesth 2007, 99:61-67. Jaeger M, et al.: Acta Neurochir (Wien) 2005, 147:51-56.
P324 UK practice in management of patients with poor-grade subarachnoid haemorrhage H Langrick, C Hammell, E O’Callaghan, G Dempsey University Hospital Aintree, Liverpool, UK Critical Care 2011, 15(Suppl 1):P324 (doi: 10.1186/cc9744) Introduction Poor-grade subarachnoid haemorrhage patients have historically fared poorly and often been excluded from aggressive treatment. In a recent audit of practice at our ICU only 33% of these patients were transferred to a neurosurgical centre. Recent studies have demonstrated improved rates of survival with good neurological outcomes in patients receiving rapid resuscitation, control of ICP,
Critical Care 2011, Volume 15 Suppl 1 http://ccforum.com/supplements/15/S1
early surgery and treatment of cerebral ischaemia [1,2]. We wished to determine national neurosurgical practice with regards to these patients. Methods We conducted a telephone survey of all UK adult neurosurgical centres. We presented the neurosurgical registrar with two mock-up patients – one grade 5 and one grade 4. We asked questions regarding their transfer policy, surgical and medical management, estimated probability of good outcome (Glasgow Outcome Score 4 or 5), and recommendations regarding management if not for transfer. Results None of the 30 units had a policy on whom to transfer. Twentyone out of 30 (70%) advised transfer of the grade 5 patient and all 30 would transfer the grade 4 patient. Good outcome was estimated at 10% for the grade 5 patient (range <5% to 60%) and 50% for the grade 4 patient (range 20 to 90%). Of those recommending transfer of the grade 5 patient, 12 would proceed to CT angiography and endovascular coiling of the aneurysm within 24 hours. Eight centres would wake and reassess the patient and coil if the GCS improved, seven would place a prophylactic extraventricular drain and nine would routinely insert an intracranial pressure monitor. Of the nine centres that would not transfer, all would subsequently reconsider transfer if GCS improved or hydrocephalus developed. No centres recommended insertion of an intracranial pressure monitor in the referring hospital. Conclusions Treatment of poor-grade subarachnoid haemorrhage remains controversial. In the UK there are no national management guidelines and both recommendations and practice appear to vary considerably between hospitals. Further analysis of national data regarding morbidity and mortality in this patient group is needed. Debate is required to address the question of whether aggressive ICP control is warranted and if so whether this can be provided in a nonspecialist ICU. References 1. 2.
Lerch C, et al.: Neurocrit Care 2006, 5:85-92. Huang AP, et al.: Neurosurgery 2010, 67:964-974.
P325 Increased plasma neutrophil gelatinase-associated lipocalin levels in poor-grade aneurysmal subarachnoid hemorrhage at admission to the ICU M Terwiel, H De Geus, J Bakker, M Van der Jagt Erasmus MC, University Medical Center Rotterdam, the Netherlands Critical Care 2011, 15(Suppl 1):P325 (doi: 10.1186/cc9745) Introduction Neutrophil gelatinase-associated lipocalin (NGAL) and cystatin C (CyC) are powerful biomarkers predicting acute kidney injury (AKI) in the critically ill. In addition, both NGAL and CyC are related to systemic inflammation, cerebral ischemia and vascular wall damage. Aneurysmal subarachnoid hemorrhage (SAH) is frequently accompanied by cerebral ischemia and has been linked to systemic inflammation. We studied the relationship between NGAL and CyC levels and the severity grade of SAH at ICU admission. Methods Thirty-six patients with SAH were recruited from a large prospective study on NGAL and AKI between September 2007 and April 2008. Patients with non-aneurysmal SAH (n = 3) and one patient with eGFR <60 ml/minute/1.73 m2 were excluded. No subjects had AKI (RIFLE category Risk or more) or suffered from chronic kidney disease (CKD) stage 3 or more. We dichotomised patients into two groups: awake (GCS 15 to 11, n = 30) and comatose (GCS 10 to 3, n = 6), based on the Prognosis on Admission of Aneurysmal Subarachnoid Hemorrhage (PAASH) scale. Statistical comparisons were made with the Mann–Whitney U test and Spearman’s rho test. Results Plasma (p)NGAL was higher in comatose patients (median 144 ng/ml vs. 89 ng/ml, P <0.05). No differences were found in urine NGAL plasma CyC and urine CyC levels or regular inflammatory parameters (leucocyte count, CRP and temperature). A confounding effect from mechanical ventilation on pNGAL production was excluded using the correlation statistics in intubated and non-intubated patients separately. After correction the correlation between GCS and pNGAL persisted in non-intubated patients (Spearman’s rho (non-intubated, n = 29) –0.36, P <0.05, and (intubated, n = 7) –0.62, P = 0.069). We found trends towards less positive fluid balance (P = 0.06) during the first 24 hours of admission and higher serum lactate (P = 0.08) in comatose
S116
patients, which did not reach statistical significance. Angiographyrelated contrast exposure was similar in both groups. Conclusions Our results indicate that poor-grade SAH is associated with increased pNGAL levels at ICU admission not related to AKI, CKD or inflammatory parameters. Alternative mechanisms linking NGAL to SAH grade should therefore be investigated, such as increased sympathetic/catecholamine activity in poor-grade SAH patients [1]. Reference 1.
Mutoh T, et al.: Stroke 2007, 38:3218-3224.
P326 Spontaneous subarachnoid hemorrhage: clinical impact, prognostic value and complications M Mourelo-Fariña, A Aller-Fernández, P Vidal-Cortés, R Galeiras, M García University Hospital A Coruña, Spain Critical Care 2011, 15(Suppl 1):P326 (doi: 10.1186/cc9746) Introduction The aim of this study is to identify the characteristics of patients with spontaneous subarachnoid hemorrhage (SAH) and to analyze the complications, treatment, potential risk factors and prognostic value associated. Methods A retrospective observational study of all patients admitted to our hospital with SAH during 4 years (2006 to 2009). We evaluate the functional outcome using the Glasgow Outcome Scale (GOS) at discharge and 6 months later. We compare variables with the chi-square and Student’s t tests. Multiple regression analysis was performed. Results A total of 168 patients were included: age 57.5 years (SD 14.9), 62.5% women, APACHE II 12 (SD 6.7), Glasgow Coma Scale (GCS) 9.9 (SD 6.5). Punctuation in clinical grading scales was: Hunt-Hess (H-H) 2.8 (SD 1.5); Fisher 3.0 (SD 1.0); World Federation Neurosurgeons Scale (WFNS) 2.8 (SD 1.5). Personal antecedents: arterial hypertension (32.1%) followed by drug use (31.2%). Presentation was headache in 62.1%. We perform CT angiography in 9.6% and arteriography in 78.6% (delay was 1 day). We found no aneurysm in 24.6%. The embolization was complete in 63.4%. The localization of the aneurysm was more frequent in the anterior communicating artery. Surgical treatment was performed in 2.2%. Complications of SAH: vasospasm 31.5% (managed with triple-H therapy 71.7%), ischemic stroke occurred in 60.4%; 4.2% rebleeding; hydrocephalus in 23.2%. Mortality risk factors: univariate analysis found age (P = 0.004), worsening control CT (P <0.01), rebleeding (P <0.01), coma (P = 0.02), hydrocephalus (P <0.01), intracranial hypertension (P = 0.002), H-H (P <0.01), Fisher (P <0.01), WFNS (P <0.01), initial GCS (P <0.01), GOS at discharge to ICU (P = 0.002) and time to embolization (P = 0.02). Multivariate analysis predictors of mortality: GCS at admission and at discharge to ICU (P = 0.013), worsening in control CT (P = 0.004) and length of stay (LOS) in the ICU (P = 0.04). ICU LOS was 10.6 days (SD 9.9) and hospital LOS was 56.7 days (SD 26.3). Global ICU mortality was 29.2% (77.5% brain death). Conclusions The most frequent complications found were ischemic stroke, vasospasm and hydrocephalus. In our study we found that clinical grading scales predict mortality in univariate analysis. Predictors of mortality in SAH were age, GCS at admission and discharge; control CT, delay to embolization, and complications related to SAH are strong mortality predictors. In most patients, death is related to SAH complications. Reference 1.
Management of aneurismal subarachnoid hemorrhage. Crit Care Med 2009, 37:432-440.
P327 Global cerebral edema and brain metabolism after subarachnoid hemorrhage R Helbok1, J Claassen2 1 Medical University, Innsbruck, Austria; 2Columbia University Medical Center, New York, USA Critical Care 2011, 15(Suppl 1):P327 (doi: 10.1186/cc9747) Introduction Global cerebral edema (GCE) is common amongst poorgrade subarachnoid hemorrhage (SAH) patients and associated with poor outcome. Currently no targeted therapy exists largely due to an incomplete understanding of the underlying mechanisms.
Critical Care 2011, Volume 15 Suppl 1 http://ccforum.com/supplements/15/S1
Methods This is a prospective observational study including 39 consecutive poor-grade SAH patients with multimodal neuromonitoring. Levels of microdialysate lactate/pyruvate ratio (LPR), episodes of cerebral metabolic crisis (MC; LPR >40 and brain glucose <0.7 mmol/l), brain tissue oxygen tension (PbtO2), cerebral perfusion pressure (CPP), and transcranial Doppler sonography flow velocities were analyzed. Results Median age was 54 years (45 to 61) and 62% were female. Patients with GCE on admission (n = 24, 62%) had a higher incidence of MC in the first 12 hours of monitoring than those without GCE (n = 15; 15% vs. 2%, P <0.05) and during the total time of neuromonitoring (20% vs. 3%, P <0.001). There was no difference in PbtO2 and CPP between the groups; however, in patients with GCE a higher CPP was associated with lower LPR (P <0.05). Episodes of crisis were associated with poor outcome (modified Rankin Score 5 or 6, P <0.05). Conclusions In poor-grade SAH patients, GCE is associated with early brain metabolic distress. Optimizing cerebral blood flow and homeostasis early after SAH may prove beneficial for patients with GCE. Reference 1.
Claassen J, Carhuapoma JR, Kreiter KT, et al.: Global cerebral edema after subarachnoid hemorrhage: frequency, predictors, and impact on outcome. Stroke 2002, 33:1225-1232.
P328 Incidence, risk factors, and impact on mortality of status epilepticus in sepsis in the United States J Urtecho, A Seifi, M Maltenfort, M Vibbert, W McBride, M Moussouttas, J Jallo, R Bell, F Rincon Thomas Jefferson University, Philadelphia, PA, USA Critical Care 2011, 15(Suppl 1):P328 (doi: 10.1186/cc9748) Introduction We sought to determine the epidemiology of status epilepticus (SE), prevalence of risk factors and impact on hospital mortality in sepsis in the United States. We hypothesized that SE would be associated with increased mortality. Methods Data were derived from the National Inpatient Sample from 1998 to 2008. We included patients older than 18 years, with a primary diagnosis of sepsis and SE. Definitions were based on the International Classification of Diseases, Ninth Revision, Clinical Modification Codes (ICD-9). Adjusted incidence rates, prevalence odds ratios (ORs) and 95% confidence intervals (CIs) were calculated. Multivariate logistical models assessed for the impact of SE on hospital mortality. Results We identified 7,672,551 admissions with diagnosis of sepsis and 7,619 with SE from 1998 to 2008. The population-adjusted rate of sepsis increased from 72/100,000 in 1998 to 250/100,000 in 2008. In septic patients, SE was more common in older patients, in women than men, in urban academic centers than rural centers, in those with respiratory dysfunction and metabolic dysfunction. Total in-hospital mortality fell from 20% in 1998 to 18.1% in 2008, yet the number of deaths increased over the study period. Mortality was highest among
Figure 1 (abstract P328). In-hospital mortality in septic patients.
S117
SE (OR = 1.7; 95% CI = 1.4 to 1.9) (Figure 1), older patients, men, those with respiratory dysfunction, cardiovascular dysfunction, hematologic dysfunction, metabolic dysfunction, renal dysfunction and hepatic encephalopathy. Conclusions Our study demonstrates the incidence of SE in sepsis is increasing. Despite a decline in sepsis-related mortality, the presence of SE doubles the risk of in-hospital death. Further study is needed to determine whether detection and treatment of SE will impact mortality. References 1. 2.
Oddo M, et al.: Crit Care Med 2009, 37:2051-2056. Martin GS: N Engl J Med 2003, 348:1546-1554.
P329 Seizure attacks in viral encephalitis: influence on a course and outcome E Rzadkiewicz, D Lipowski Medical University of Warsaw, Poland Critical Care 2011, 15(Suppl 1):P329 (doi: 10.1186/cc9749) Introduction Although occurrence of seizures is common in the course of viral encephalitis, its influence on outcome is less known [1]. Methods The frequency and type of seizures in 229 patients with viral encephalitis were studied. We compared frequency of loss of consciousness, mental disorders, respiratory failure, need for intubation, mechanical ventilation and hospitalization in the ICU, duration of hospitalization and degree of disability at discharge from the hospital according to the Glasgow Outcome Scale (GOS). Results Patients with seizures (31), significantly more frequent in comparison with patients without attacks (198), presented: mental disorders in 17 (54.83%) versus 62 (31.31%) patients (P <0.001), loss of consciousness in 28 (90.32%) versus 16 (8%) patients (P <0.001) and need for intubation, mechanical ventilation and hospitalization in the ICU (34 versus 8 times, P <0.001). The mean total time of hospitalization was substantially longer in patients with seizures in comparison with the group without them (24.43 vs. 15.9 days, P <0.001). Patients presenting seizures were prognosticated worse in the scope of good recovery as well as every degree of disability in comparison with a group of patients without attacks (P = 0.001). Outcome after viral encephalitis according to GOS in patients with seizures (31) and without them (198) was as follows: GOS 5 (good recovery) – 19 (61.2%) versus 180 (90.9), GOS 4 (moderate disability) – 7 (22.5%) versus 12 (6%), GOS 3 (severe disability) – 4 (12.9%) versus 5 (2.5%), GOS 1 (death) – 1 (3.2%) versus 1 (0.5%). Conclusions The occurrence of single generalized seizures, epilepsy and particularly status epilepticus had substantial influence on a course of viral encephalitis and worsened the outcome. Appearance of every type of seizure attack, independent of other clinical symptoms, was a good indicator of the disease severity. Reference 1.
Misra UK, et al.: Viral encephalitis and epilepsy. Epilepsia 2008, 49(Suppl 6):13-18.
Critical Care 2011, Volume 15 Suppl 1 http://ccforum.com/supplements/15/S1
P330 Incidence, risk factors, and impact on hospital mortality of status epilepticus after subdural hemorrhage in the United States A Seifi, J Urtecho, M Maltenfort, M Vibbert, W McBride, M Moussouttas, J Jallo, R Bell, F Rincon Thomas Jefferson University, Philadelphia, PA, USA Critical Care 2011, 15(Suppl 1):P330 (doi: 10.1186/cc9750) Introduction Patients with intracranial hemorrhages are at risk of seizure activity. Small cohort studies have shown that patients with subdural hemorrhages (SDH) may be at risk of developing status epilepticus (SE). In this study, we sought to determine the epidemiology of SE, the prevalence of risk factors, and the impact on hospital mortality in SDH, using a large administrative dataset. Methods Data were derived from the National Inpatient Sample from 1988 through 2008. We searched for admissions with a primary diagnosis of SDH, and SE. Definitions were based on the International Classification of Diseases, 9th Revision. Adjusted incidence rates, prevalence odds ratios (ORs), and 95% confidence intervals (CIs) were calculated. Results Over the 20-year period, we identified 890,153 admissions with primary diagnosis of SDH and 3,214 of SE. The population-adjusted rate of SDH increased from 9/100,000/year in 1988 to 22/100,000/ year in 2008, and similarly, the adjusted rate of SE in SDH increased from 0.05/100,000/year in 1988 to 0.11/100,000/year in 2008. In SDH patients, the risk of SE was higher in older than younger patients (OR, 0.99; 95% CI, 0.99 to 1.0, P = 0.06), black than whites (OR, 1.5; 95% CI, 1.2 to 1.9), and in the presence of respiratory failure (OR, 4.3; 95% CI, 3.5 to 5.3), metabolic dysfunction (OR, 1.7; 95% CI 1.3 to 2.26), hematologic disorders (OR, 1.7; 95% CI, 1.3 to 2.26), renal failure (OR, 2.4; 95% CI, 2.1 to 3.26), or central nervous system dysfunction (OR, 2.6; 95% CI, 2.1 to 3.26). The total in-hospital mortality fell from 17% in 1988 to 11% in 2008, yet the number of deaths increased over the study period. Inhospital mortality was higher among SE (OR, 1.6; 95% CI, 1.3 to 2.0) older patients (OR, 1.01; 95% CI, 1.01 to 1.01), women (OR, 1.1; 95% CI, 1.01 to 1.1); and in those with respiratory organ dysfunction (OR, 4.9; 95% CI, 4.7 to 5.2), cardiovascular dysfunction (OR. 2.9; 95% CI, 2.7 to 3.2), hematologic dysfunction (OR, 2.2; 95% CI, 2.1 to 2.3), metabolic dysfunction (OR, 2.5; 95% CI, 2.2 to 2.8), renal dysfunction (OR, 2.0; 95% CI, 1.9 to 2.1). Conclusions Our study demonstrates that the incidence of SDH and SE in these patients is increasing in the United States. The risk of SE was higher among older patients, blacks, and in those with respiratory, metabolic, hematological, and renal system dysfunction. Despite a decline in overall SDH-related mortality, SE increased the risk of inhospital death. Reference 1.
Rubin G, et al.: Epilepsy in chronic subdural hematoma. Acta Neurochir 1993, 123:39-42.
P331 Electrographic seizures after subarachnoid hemorrhage lead to derangement of brain homeostasis in humans J Claassen, A Perotte, D Albers, J Schmidt, B Tu, N Badjatia, K Lee, S Mayer, E Connolly, L Hirsch, G Hripcsak Columbia University, New York, USA Critical Care 2011, 15(Suppl 1):P331 (doi: 10.1186/cc9751) Introduction This study intends to develop a physiologic thumbprint for nonconvulsive seizures (NCSz) after acute brain injury. Abnormal electrographic brain activity including NCSz is common after acute brain injury and is associated with poor outcome. Mechanisms underlying this phenomenon are poorly understood but in animals periods of inadequate perfusion during seizures have been documented. In the present study we hope to gain better understanding of the relationship between abnormal electrographic patterns and brain homeostasis in patients with subarachnoid hemorrhage (SAH). Methods Between June 2006 and June 2010, 51 poor-grade SAH patients underwent multimodality monitoring with microdialysis, brain oxygen tension (pbtO2), regional cerebral blood flow (rCBF), and intracranial pressure monitoring; 69% (n = 36) also with intracortical
S118
EEG (ICE; eight-contact miniature depth electrode). Each minute of EEG (total of 326,513 minutes) was categorized separately into non-ictal, on the ictal–interictal continuum (including periodic discharges at 2 Hz or faster), or seizures. We identified seizure onsets on ICE recordings and extracted the physiologic monitoring data 30 minutes pre and post seizure onset. Physiologic profiles based on standard error of the means plots were generated using high-frequency time series physiologic measurements and interpreted by visual analysis. Results Depth NCSz were recorded in 36% (13/36) of patients with ICE recordings (depth seizures in 11,017 minutes). NCSz were preceded by an increase in rCBF starting 15 minutes prior to onset of depth NCSz that stayed elevated throughout the observation period. Heart rate, mean arterial, intracranial, and cerebral perfusion pressures were elevated surrounding NCSZ. There was a small transient drop in PbtO2 and a drop in jugular bulb oxygen saturation seen between 1 and 3 minutes following seizure onset. There was a small rise in brain temperature but no change in bladder temperature associated with the NCSZs, but water temperature of the cooling device dropped following seizure onset. Conclusions These findings confirm in comatose human beings that NCSz detected by ICE are associated with hyperemia, increased metabolism, and possibly brain tissue hypoxia, which serve as surrogates for secondary brain injury. Future research should implement novel approaches for ICU time-series data analysis, evaluate surface seizures, and utilize other surrogates of brain metabolism such as microdialysis. P332 Continuous electroencephalography in the surgical ICU A Wahl1, P Kurtz2, R Bauer1, L Hirsch1, J Claassen1 1 Columbia University Medical Center, New York, USA; 2Casa de Saúde São José, Rio de Janeiro, Brazil Critical Care 2011, 15(Suppl 1):P332 (doi: 10.1186/cc9752) Introduction The objective of this study is to investigate the prevalence, risk factors, and impact on outcome of electrographic seizures (ESz), nonconvulsive status epilepticus (NCSE), and periodic epileptiform discharges (PEDs) in surgical ICU (SICU) patients. Methods This was a retrospective study of 156 consecutive SICU patients (mean age 65 years old (IQR 54 to 74); 40% women) who underwent continuous electroencephalography (cEEG) monitoring for altered mental status. Poor outcome was defined as death or severe disability (Glasgow Outcome Score 4 or 5). Results The majority of patients were admitted following abdominal surgery (36%) and post liver transplant (24%). Sepsis developed in 102 (65%) patients, almost all patients were mechanically ventilated (94%) and approximately one-half were comatose at the time of EEG monitoring (55%). Sixteen percent (n = 25) had ESz, 5% (n = 8) NCSE, and 29% (n = 45) had PEDs. All eight patients with NCSE were septic. Comatose patients and those with previous liver disease were more likely to have ESz or PEDs compared with noncomatose and those with normal liver function (42% vs. 19%; P = 0.002 and 25% vs. 9%; P = 0.007, respectively). After controlling for age, coma, and organ dysfunction, the presence of ESz was independently associated with death at hospital discharge (75% with vs. 43% without ESz; adjusted OR = 3.4 (95% CI = 1.04 to 10.9); P = 0.04). Conclusions In patients admitted to the SICU, ESz and PEDs are frequent and associated with poor outcome. P333 Continuous electroencephalography in the medico-surgical intensive care setting in Brazil: initial experience after 4 months of implementation P Kurtz1, D Santos1, P Horta Gomes2, C Andre1, R Lima2, J Kezen2, L Lopes1, M Kalichsztein1, G Nobre1 1 Casa de Saúde São José, Rio de Janeiro, Brazil; 2Hospital Samaritano, Rio de Janeiro, Brazil Critical Care 2011, 15(Suppl 1):P333 (doi: 10.1186/cc9753) Introduction The objective of this study was to analyze the prevalence, risk factors and impact on outcome of electrographic seizures (ESz),
Critical Care 2011, Volume 15 Suppl 1 http://ccforum.com/supplements/15/S1
nonconvulsive status epilepticus (NCSE), and periodic epileptiform discharges (PEDs) in critically ill patients admitted to two mixed medico-surgical ICUs. Methods This was a retrospective study of 58 consecutive ICU patients (mean age 68 ± 23 years old; 50% women) who underwent continuous electroencephalography (cEEG) monitoring for altered mental status. Outcome was assessed as hospital mortality. Results Sixteen patients (28%) were admitted with a primary neurological diagnosis. Mean duration of cEEG was 12 ± 17 hours. Thirtyfour patients (59%) were comatose and 32 patients were mechanically ventilated (55%) during cEEG monitoring. Seventeen percent (n = 10) had ESz, 10% (n = 6) had NCSE, 19% (n = 11) had periodic lateralized epileptiform discharges and 26% (n = 15) had epileptiform discharges. Conclusions In a mixed population of medical and surgical patients, ESz and NCSE are frequent and associated with increased hospital mortality. P334 Nursing environment and delirium in ICU patients IJ Zaal, LM Peelen, CF Spruyt, J Kesecioglu, AJ Slooter University Medical Centre Utrecht, the Netherlands Critical Care 2011, 15(Suppl 1):P334 (doi: 10.1186/cc9754) Introduction Delirium is a common and serious disorder in the ICU. It has been suggested that the ICU environment may play a role in the development of ICU delirium, but this has never been investigated. In this study we aimed to investigate the relationship between the nursing environment and the duration, incidence and severity of ICU delirium. Methods This prospective observational before/after study was performed in the 32-bed, mixed adult ICU of the University Medical Centre Utrecht. All patients admitted to the ICU were daily assessed on delirium by research physicians. Exclusion occurred when patients remained unresponsive (RASS <–3) during admission or when they were unable to understand Dutch and English. ICU delirium was compared between a ward-like setting, and a setting with singlepatient, noise-reduced rooms with diurnal light variation. Results A total of 55 patients (449 observations) were included in the old setting and 75 patients (468 observations) in the new setting. Demographic characteristics were similar for both groups. However, co-morbidity was more severe and emergency admissions were more frequent in the new setting. Delirium occurred in 28 (51%) patients in the old setting versus 34 (45%) patients in the new setting (P = 0.53). After adjusting for confounding, the days patients spent in delirious state decreased with 0.4 days in the new environment (P = 0.005). No difference could be observed in the severity of delirium or in the medications prescribed. Conclusions The number of days patients spent delirious during ICU admission was found to be shorter in patients who were treated in separate noise-reduced rooms with diurnal light variation despite a similar incidence and severity of ICU delirium. P335 Development and validation of an eight-step flowchart based on the CAM-ICU: a quick and highly adaptable tool to determine the presence of delirium in ICU patients IJ Zaal, LM Peelen, D Van Dijk, AJ Slooter University Medical Centre Utrecht, the Netherlands Critical Care 2011, 15(Suppl 1):P335 (doi: 10.1186/cc9755) Introduction Delirium is a frequent and serious disorder in the ICU. Several tools have been developed for standardized delirium testing, of which the Confusion Assessment Method for the ICU (CAM-ICU) is the best validated and most widely used. The main limitations of the CAMICU are, however, that it is a very brief assessment of a highly fluctuating disorder, and that the test may lack sensitivity when administered in daily practice. For research purposes, we extended the CAM-ICU. Methods This ongoing prospective validation study was performed in a 12-bed, mixed adult ICU of the University Medical Centre Utrecht. All patients admitted to the ICU were assessed daily and independently on
S119
delirium by two means: a junior doctor or neurologist (gold standard); and an eight-item flowchart, based on the CAM-ICU, the reports of the bedside nurses and the administration of haloperidol. Exclusion occurred when patients remained unresponsive (RASS <–3) during admission or when they were unable to understand Dutch and English. With both assessment methods, patients were classified as either awake without delirium, delirious for one or more moments in the past 24 hours, or comatose during the whole past 24 hours. Results A total of 55 patients (35 men, 63.6%; mean age 60.0, SD 17.9; mean APACHE II score 18.7, SD 6.1) were included and 379 assessments were made. The form, which excludes patients with neurological pathology for further analysis, showed a sensitivity of 85%, a specificity of 88%, a positive predictive value of 81% and a negative predictive value of 91%. Conclusions While the CAM-ICU is a tool to assess delirium during a brief observation period, this extension can be used to classify the presence of delirium in the previous hours in an ICU where the CAMICU is already implemented. The tool appeared to be easy in use and highly adaptable with good test characteristics. P336 Delirium assessment in daily critical care with the CAM-ICU: a multicenter study MM Van Eijk1, M Van den Boogaard2, AJ Slooter1 1 University Medical Center Utrecht, the Netherlands; 2Radboud University Nijmegen Medical Center, Nijmegen, the Netherlands Critical Care 2011, 15(Suppl 1):P336 (doi: 10.1186/cc9756) Introduction Delirium occurs frequently in the ICU and is associated with poor outcome. Screening for delirium in ICU patients is recommended by several medical organizations to improve prognosis by early diagnosis and treatment. The Confusion Assessment Method for the ICU (CAM-ICU) has high sensitivity and specificity for delirium when administered by research nurses. However, the test characteristics of the CAM-ICU as performed in routine practice are unclear. The objective of this study is to investigate the diagnostic value of the CAM-ICU in daily practice. Methods Teams of three alternating delirium experts including psychiatrists, geriatricians and neurologists visited 10 ICUs twice. Based on cognitive examination, inspection of medical files and DSM-IV-TR criteria for delirium, the expert teams classified patients as awake and not delirious, delirious or comatose. This classification served as the gold standard to which the CAM-ICU as performed by the bedside ICU nurses was compared. Assessors were unaware of each others’ conclusions. Results Thirteen delirium experts assessed 282 patients, of whom 101 (36%) were classified as comatose and excluded. In the remaining 181 (64%) patients, delirium was diagnosed in 75 by the experts of whom 35 scored CAM-ICU positive. This yielded a sensitivity of 47% (95% CI = 35 to 58%), specificity of 98% (95% CI = 93 to 100%), positive predictive value of 95% (95% CI = 80 to 99%) and negative predictive value of 72% (95% CI = 64 to 79%). Conclusions Specificity of the CAM-ICU as performed in routine, daily practice appears to be high but sensitivity low. The low sensitivity hampers early detection of delirium by the CAM-ICU. P337 Assessment of delirium in intensive care using the CAM-ICU R Shetty, K Reid BHR Hospitals, London, UK Critical Care 2011, 15(Suppl 1):P337 (doi: 10.1186/cc9757) Introduction Delirium remains a common but poorly diagnosed condition in the ICU [1]. Delirium is an independent predictor of cognitive decline and mortality [2]. The aims of this audit were: to measure the incidence of delirium in our unit; to consider the practicalities of using the CAM-ICU; whether a positive CAM-ICU test would change management; and the attitude of senior intensive care staff regarding the usefulness of CAM-ICU. Methods The CAM-ICU was used for 5 weeks in a mixed general ICU (14 beds) at Queen’s Hospital, Romford. Patients were included into the
Critical Care 2011, Volume 15 Suppl 1 http://ccforum.com/supplements/15/S1
Figure 1 (abstract P337). What is the incidence of delirium?
S120
long-term differences on these aspects between critically ill patients with and without delirium during their ICU stay, differences between delirium subtypes on HRQoL and the effect of delirium duration on HRQoL. Methods At 18 months after ICU discharge an HRQoL survey was sent to 1,292 ICU survivors with (n = 272) and without (n = 1,020) delirium during their ICU stay. The survey consisted of the Short Form (SF)-36, the Checklist Individual Strength (CIS)-fatigue and the Cognitive Failure Questionnaire (CFQ). Covariance analysis was performed to adjust for gender, sepsis, APACHE II score and length of stay. Results A total of 915 (71%) patients responded, of which 171 patients were delirious during their ICU stay (median age 65 (IQR 58 to 85), APACHE II score 17 (IQR 14 to 20)) and 745 patients were not (median age 65 (IQR 57 to 72), APACHE II score 13 (IQR 10 to 16)). After adjusting for covariates, no differences were found between delirious and nondelirious ICU survivors on the SF-36 and CIS-fatigue. However, delirious ICU survivors were significantly more absent-minded (P = 0.02), suffered a more pronounced change in cognitive function compared with prior to their ICU stay (P <0.01), and their total CFQ score was significantly (P = 0.03) lower compared with ICU survivors that had not been delirious. Hypoactive delirious survivors performed significantly better on several domains of the SF-36 than mixed and hyperactive delirious patients. Duration of delirium tended to correlate with changed health condition after ICU stay (r = –0.15; P = 0.06). Conclusions ICU survivors that were delirious during their ICU stay experience significantly more cognitive failure than those who were not, even after adjusting for relevant covariates. Hypoactive delirious patients are less affected compared with other subtypes of delirium. Duration of delirium appears to relate to HRQoL.
Figure 2 (abstract P337). Do positive CAM-ICU tests change management?
study after 24 hours of admission; they were tested once daily. If the test was positive, a senior physician responsible for the patient’s care was asked whether they would change the management of the patient. A survey was conducted to understand the attitude of intensive care consultants regarding the usefulness of the CAM-ICU test. Results Fifty-six patients were included, 10 of which tested positive for delirium (17.9%). Seven were found to be delirious within the first 48 hours of admission. Eight patients had just one episode of delirium. Average length of delirium was 1.75 days. On no occasion did a positive CAM-ICU test result in a change of management. We were unable to assess 22% of patients because they were too sedated (8), not cooperative (7) or for other reasons (8). Surprisingly the survey revealed that more than 75% of the consultants believed a positive CAM-ICU test would result in change in the management of the patient. See Figures 1 and 2. Conclusions The incidence in our unit was lower than in other studies. Daily assessment with the CAM-ICU had no effect on management. It is possible to implement use of the CAM-ICU daily after a short period of training. There is a difference in attitude and practice in senior staff with regard to use of the CAM-ICU. As most cases are short lived and occurred in the first 48 hours, prevention should be emphasized before admission to critical care. References 1. 2.
Ely et al.: Crit Care Med 2010, 38:1513-1520. Ely EW, et al.: JAMA 2001, 286:2703-2710.
P338 Impact of delirium in critically ill patients on long-term health-related quality of life and cognitive functioning M Van den Boogaard1, L Schoonhoven2, A Evers3, J Van der Hoeven1, TH Van Achterberg2, P Pickkers1 1 Radboud University Nijmegen Medical Centre, Nijmegen, the Netherlands; 2 Scientific Institute for Quality of Healthcare, Radboud University Nijmegen Medical Centre, Nijmegen, the Netherlands; 3Department of Medical Psychology, Radboud University Nijmegen Medical Centre, Nijmegen, the Netherlands Critical Care 2011, 15(Suppl 1):P338 (doi: 10.1186/cc9758) Introduction Delirium is associated with long-term cognitive decline and poor health-related quality of life (HRQOL). Little is known about
P339 Effect of rivastigmine as an adjunct to usual care with haloperidol on duration of delirium and mortality in critically ill patients: a multicentre, double-blind, placebo-controlled randomised trial MM Van Eijk1, KC Roes1, ML Honing2, MA Kuiper3, A Karakus4, M Van der JAgt5, PE Spronk6, WA Van Gool7, RC Van der Mast8, J Kesecioglu1, AJ Slooter1 1 University Medical Center Utrecht, the Netherlands; 2Medical Center Alkmaar, the Netherlands; 3Medical Center Leeuwarden, the Netherlands; 4 Diakonessenhuis Utrecht, the Netherlands; 5Erasmus Medical Center, Rotterdam, the Netherlands; 6Gelre Hospitals, Apeldoorn, the Netherlands; 7 Academic Medical Center, Amsterdam, the Netherlands; 8Leiden University Medical Center, Leiden, the Netherlands Critical Care 2011, 15(Suppl 1):P339 (doi: 10.1186/cc9759) Introduction Delirium is frequently diagnosed in critically ill patients and is associated with adverse outcome. Impaired cholinergic neurotransmission seems to have an important role in the development of delirium. We aimed to establish the effect of the cholinesterase inhibitor rivastigmine on the duration of delirium in critically ill patients. Methods Patients (aged ≥18 years) who were diagnosed with delirium were enrolled from six ICUs in the Netherlands, and treated between November 2008 and January 2010. Patients were randomised (1:1 ratio) to receive an increasing dose of rivastigmine or placebo, starting at 0.75 ml (1.5 mg rivastigmine) twice daily and increasing in increments to 3 ml (6 mg rivastigmine) twice daily from day 10 onwards, as an adjunct to usual care based on haloperidol. The trial pharmacist generated the randomisation sequence by computer, and consecutively numbered bottles of the study drug according to this sequence to conceal allocation. The primary outcome was the duration of delirium during hospital admission. Analysis was by intention to treat. Duration of delirium was censored for patients who died or were discharged from hospital while delirious. Patients, medical staff, and investigators were masked to treatment allocation. Members of the data safety and monitoring board (DSMB) were unmasked and did interim analyses every 3 months. Results Although a sample size of 440 patients was planned, after inclusion of 104 patients with delirium who were eligible for the intention-to-treat analysis (n = 54 on rivastigmine, n = 50 on placebo), the DSMB recommended that the trial be halted because mortality in the rivastigmine group (n = 12, 22%) was higher than in the placebo
Critical Care 2011, Volume 15 Suppl 1 http://ccforum.com/supplements/15/S1
group (n = 4, 8%; P = 0.07). Median duration of delirium was longer in the rivastigmine group (5.0 days, IQR 2.7 to 14.2) than in the placebo group (3.0 days, IQR 1.0 to 9.3; P = 0.06). Conclusions Rivastigmine did not decrease duration of delirium and might have increased mortality so we do not recommend use of rivastigmine to treat delirium in critically ill patients. Acknowledgements This trial is registered with ClinicalTrials.gov, number NCT00704301. Funded by ZonMw, the Netherlands Brain Foundation, and Novartis. P340 Biomarkers of delirium in critically ill patients M Van den Boogaard1, L Schoonhoven2, K Quinn3, M Kox1 1 Radboud University Nijmegen Medical Centre, Nijmegen, the Netherlands; 2 Scientific Institute for Quality of Healthcare, Radboud University Nijmegen Medical Centre, Nijmegen, the Netherlands; 3Departments of Anesthesia and Critical Care, St Michael’s Hospital, Toronto, Canada Critical Care 2011, 15(Suppl 1):P340 (doi: 10.1186/cc9760) Introduction Delirium occurs frequently in critically ill patients and is associated with disease severity and infection. Although several pathways for delirium have been described, biomarkers associated with delirium in ICU patients are unknown. We examined differences in levels of several biomarkers in matched delirious and nondelirious patients admitted to the ICU. Methods Delirium in adult ICU patients was diagnosed using the Confusion Assessment Method-ICU (CAM-ICU). Delirious and nondelirious patients were meticulously matched for age, APACHE II score, presence or absence of infection or SIRS criteria, and length of ICU stay at the moment of blood withdrawal. Neurology and trauma patients were excluded. Within 24 hours after the development of delirium, blood was drawn for determination of biomarkers. Covariate analyses were performed using the C-reactive protein (CRP) level to adjust for severity of infection. Results Fifty delirious and 50 nondelirious ICU patients were included. Levels of TNFα, IL-6, IL-8, MIF, IL-1ra, IL10, MCP-1, PCT, cortisol, and the brain-specific protein amyloid-β truncated-40 were significantly higher in delirious ICU patients. The ratio of amyloid-β 42/40 and truncated 42/40 were significantly lower in delirious compared with nondelirious ICU patients, suggesting more deposition of amyloid-β in the brain. In a multivariate logistic analysis adjusted for severity of infection, levels of TNFα, IL-8, IL-1ra, IL-10, MCP-1 and PCT were significantly higher in the delirious group. The ratio of amyloid-β 42/40 and truncated 42/40 (both P = 0.056), IL-6 (P = 0.057) and MIF (P = 0.081) tended to be different in delirious ICU patients. Conclusions In ICU patients, delirium is associated with significantly increased concentrations of TNFα, IL-8, IL-1ra, IL-10, MCP-1, PCT and a decreased ratio of amyloid-β 42/40, even after adjusting for severity of infection. We conclude that several proinflammatory and anti-inflammatory cytokines, PCT and amyloid-β are associated with delirium in ICU patients, and could therefore serve as possible biomarkers.
P341 Is delirium associated with pain and administered morphine in patients in the ICU after cardiac surgery? L Van Gulik1, H Brouwer2, SJ Ahlers1, W Van Boven1, CA Knibbe1, E Van Dongen1, P Bruins1 1 St Antonius Hospital, Nieuwegein, the Netherlands; 2University of Utrecht, the Netherlands Critical Care 2011, 15(Suppl 1):P341 (doi: 10.1186/cc9761)
S121
Methods In a retrospective observational study, pain and delirium scores in patients admitted to the ICU after cardiac surgery via sternotomy during a 2-month period were analyzed. Delirium was scored using the Intensive Care Delirium Screening Checklist (ICDSC, range 0 to 8, ≥4 was deemed delirious). Pain was scored on the Numeric Rating Scale (NRS, range 0 to 10, ≥4 was deemed unacceptable). Morphine was administered according to a pain titration protocol. Results ICDSC ≥4 was recorded at least once for 32 (26%) of the 121 included patients. These patients received significantly less morphine than patients with all ICDSC scores <4 (mean dose 23 ± 8 mg/ day vs. 29 ± 13 mg/day, P <0.01), without difference in pain scores between the groups (mean NRS 1.3 vs. 1.4, P <0.3 and 34% vs. 28%, P <0.51 experienced at least one unacceptable pain score). Delirious patients were older (70 ± 9 vs. 66 ± 11 years, P <0.03), and ventilation time and length of stay in the ICU were significantly longer (26 ± 34 vs. 14 ± 20 hours, P <0.001 and 77 ± 53 vs. 48 ± 38 hours, P <0.001 respectively). In-hospital mortality was significantly higher for this group (3 vs. 0 patients, P <0.02). Conclusions While delirious patients received significantly less morphine than nondelirious patients, there was no significant relation between delirium and pain in patients following cardiac surgery in the ICU.
P342 Modified Lund concept versus cerebral perfusion pressure-targeted therapy: a randomized controlled study in patients with secondary brain ischaemia MA Hamdan1, K Dizdarevic2 1 Newcastle University, Newcastle upon Tyne, UK; 2Clinical Centre University of Sarajevo, Sarajevo, Bosnia and Herzegovina Critical Care 2011, 15(Suppl 1):P342 (doi: 10.1186/cc9762) Introduction Secondary brain ischaemia (SBI) usually develops after aneurysmal subarachnoid haemorrhage (SAH) and severe traumatic brain injury (TBI). The current management strategies are based on intracranial pressure-targeted therapy (ICP-targeted) with cerebral microdialysis monitoring (modified Lund concept) or cerebral perfusion pressure-targeted therapy (CPP-targeted) [1-3]. We present a randomised controlled study to compare the two management strategies. Methods Sixty comatose operated patients with SBI following aneurysmal SAH and severe TBI were randomized into ICP-targeted therapy with cerebral microdialysis monitoring and CPP-targeted therapy groups. Mortality rates in both groups were calculated and biochemical signs of cerebral ischaemia were analysed using cerebral microdialysis. Outcome for cerebral microdialysis was measured as poor outcome (Glasgow Outcome Scale score 1, 2 and 3) or good outcome (Glasgow Outcome Scale score 4 and 5). Results Patients treated by ICP-targeted therapy with cerebral microdialysis monitoring had a significantly lower mortality rate compared with those treated by CPP-targeted therapy (P = 0.03). Patients undergoing cerebral microdialysis with poor outcome had lower mean values of glucose and higher mean values of glycerol and lactate/pyruvate ratio as compared with those with good outcome (glucose: P = 0.003; glycerol: P = 0.02; lactate/pyruvate ratio: P = 0.01). There was no difference in the outcome between aneurysmal SAH and severe TBI in the two groups. Conclusions The ICP-targeted therapy based on modified Lund concept showed better results compared with CPP-targeted therapy in the treatment of comatose patients sustaining SBI after aneurysmal SAH and severe TBI. References 1.
Introduction Delirium after cardiac surgery is associated with a prolonged length of stay in the ICU, prolonged ventilation time and higher in-hospital mortality. Although the exact pathophysiology of delirium is unknown, both the use of analgesics and the experience of pain have been suggested to be associated with the occurrence of delirium. The aim of the study was to evaluate the association between delirium and analgesics and pain in the ICU.
2.
3.
Belli A, Sen J, Petzold A, et al.: Metabolic failure precedes intracranial pressure rises in traumatic brain injury: a microdialysis study. Acta Neurochir 2008, 150:461-469. Grände PO: The ‘Lund Concept’ for the treatment of severe head trauma – physiological principles and clinical application. Intensive Care Med 2006, 32:1475-1484. Nordström CH: The ‘Lund concept’: what it is and what it isn’t [correspondence]. Intensive Care Med 2007, 33:558.
Critical Care 2011, Volume 15 Suppl 1 http://ccforum.com/supplements/15/S1
P343 Brain midline shift assessment using sonography in neurocritical care patients J Motuel, I Biette, C Cognard, O Fourcade, T Geeraerts University Hospital, Toulouse, France Critical Care 2011, 15(Suppl 1):P343 (doi: 10.1186/cc9763) Introduction Brain midline shift (MLS) is a life-threatening condition that requires urgent diagnosis and treatment [1]. Bedside MLS assessment with sonography has been proposed as a valuable method in stroke patients [2]. We aimed to validate this method in neurocritical care patients by comparing it with the brain CT gold standard method. Methods This prospective study was conducted in a single neurocritical care unit. Patients who underwent brain CT scan were included and a concomitant brain sonography with MLS measurement was performed. Using sonography, the midline was determined bilaterally with a 2 to 4 MHz probe using the temporal window by visualizing the third ventricle, with a double hyperechogenic image above the mesencephalon. MLS was calculated as the difference between both sides for midline line measurements. CT MLS was independently calculated by a specialist in neuroradiology as the maximal difference between the ideal midline and the actual interventricular septum. A significant MLS was defined on brain CT as >0.5 cm. Results Fifty-five patients (with a total of 67 paired measured) were included (72% male with a median IGS II of 35.5 ranging from 12 to 65) (35 TBI, eight subarachnoidal hemorrhage, five intracerebral hematoma, seven postoperative care). The mean (± SD) MLS was 0.34 ± 0.34 cm using sonography and 0.48 ± 0.68 cm using CT. The linear regression showed an r value at 0.64 between sonographic and CT MLS (P <0.0001). Bland–Altman plot showed a mean bias of 0.09 cm and three values out of the limits of agreement (4% of the total measures) (Figure 1). For sonography, the area under ROC curve for the detection of significant MLS was 0.80 (0.68 to 0.89) with a best cut-off value of 0.46 cm with 74% sensitivity and 89% specificity. Conclusions MLS measurement using sonography appears to have interesting performances for the detection of significant MLS (that is, >0.5 cm on brain CT). As the regression between sonographic and CT values for MLS was not very strong, and as the agreement between both methods showed relatively large limits of agreements, sonography would not replaced the gold standard CT method. However, the bedside estimate could be used as a detection tool in emergency in neurocritical care patients. References 1. 2.
Maas A, et al.: Neurosurgery 2005, 57:1173. Seidel G, et al.: J Neuroimaging 1996, 6:227.
S122
P344 Hypernatremia in neurointensive care: results of a 5-year prospective study V Spatenkova1, A Kazda2, P Suchomel1 1 Regional Hospital, Liberec, Czech Republic; 21st Faculty of Medicine, Charles University, Prague, Czech Republic Critical Care 2011, 15(Suppl 1):P344 (doi: 10.1186/cc9764) Introduction Hypernatremia is a common medical complication in neurointensive care that is associated with worse outcome. It can be caused by water diuresis due to anti-diuretic hormone insufficiency in central diabetes insipidus (cDI) or from different mechanisms: osmotherapy, furosemide or renal failure. The aim of this prospective study was to analyse hypernatremias in neurointensive care over a period of 5 years. Methods We evaluated all hypernatremias defined as serum sodium (SNa+) >150 mmol/l in patients with acute brain disease hospitalised in the neurologic–neurosurgical care unit (NNICU). cDI was diagnosed according to serum and urine osmolality, hourly diuresis, electrolytefree water clearance (EWC) and response to desmopressin. The remaining hypernatremias were called non-cDI. We compared these groups in Glasgow Coma Scale (GCS) on onset of hyponatremia, incidence of cerebral complications, Glasgow Outcome Scale (GOS) upon discharge from the NNICU and mortality in the NNICU, and EWC. Results There were 133 hypernatremic patients (mean SNa+ 154.9 ± 4.5 mmol/l) with mean age 60.6 years; male 72; diagnoses: stroke 88 patients, tumour 19 patients, trauma 19 patients, infection four patients, others three patients. The mean GCS on onset of hypernatraemia was 9.4 ± 4.3, the mean GOS upon discharge from the NNICU was 2.4 ± 1.2. We diagnosed cDI in 16 patients, the majority (117 patients) was filed as the non-cDI group. Patients with cDI had significantly higher SNa+ (160.1 ± 8.4 mmol/l, P <0.001), diuresis (P <0.001), EWC (P <0.001), mortality in the NNICU (P = 0.012) than patients in the non-cDI group. There were no differences in GCS (P = 0.192), GOS (P = 0.079), cerebral complications (P = 0.809), and anti-edematic therapy (P = 0.221). Patients in the non-cDI group (SNa+ 154.4 ± 3.4 mmol/l) received more diuretics (P = 0.001) and 18 patients had renal failure. Conclusions In this study cDI was not a common type of hypernatremia in neurointensive care, but it had higher mortality in the NNICU than other types of hypernatremias, which are caused mostly by diuretics and by renal failure. Reference 1.
Aiyagari V, Deibert E, Diringer M: Hypernatremia in the neurologic intensive care unit: how high is too high? J Crit Care 2006, 21:163-172.
P345 Paracetamol-induced skin blood flow and blood pressure changes M Boyle1, A Lau2, L Nicholson1, M O’Brien1, G Flynn1, D Collins1, W Walsh2, D Bihari1 1 Prince of Wales Hospital, Randwick, NSW, Australia; 2University of NSW, Randwick, NSW, Australia Critical Care 2011, 15(Suppl 1):P345 (doi: 10.1186/cc9765)
Figure 1 (abstract P343). Bland–Altman plot: agreement between sonography and CT for MLS assessment.
Introduction Paracetamol given for fever is associated with hypotension [1]. Spectral analyses (Fourier, wavelet) can be used to identify low-frequency oscillations of skin blood flow (skBF) [2]. The relationship of paracetamol to skBF and blood pressure (BP) in febrile patients was studied. Methods Twenty-nine adults, 58 ± 15 years, were treated with enteral or intravenous paracetamol for fever. Forty-one percent (n = 12) were medical, 31% (n = 9) surgical, and 28% (n = 8) neurological. APACHE II score was 17.2 ± 8.3. Frequency domain analyses of the laser Doppler flowmetry (LDF) waveforms of two patients were undertaken. Both patients (A and B) had good LDF waveforms, both increased skBF whilst BP fell in patient B. Results Temperature, BP and skBF were recorded 15 minutes prior to paracetamol, at administration (T0) and then every 15 minutes for 60 minutes. Thirty datasets were recorded. Temperature at T0 was 38.7 ± 0.6°C. BP decreased over the study period whilst skBF and cutaneous vascular conductance (CVC = skBF / mean arterial pressure)
Critical Care 2011, Volume 15 Suppl 1 http://ccforum.com/supplements/15/S1
S123
of 11 mg/l is achieved in neonates (28 to 44 weeks) given a standard dose of paracetamol of 10 mg/kg/6 hours. Based on these estimates, we suggest a loading dose of 20 mg/kg followed by 6-hourly dosing (10 mg/kg) within the age range evaluated. References 1. 2. 3.
Figure 1 (abstract P345).
increased (repeated-measures ANOVA, P <0.05). Systolic BP decreased (P <0.01) at all post-administration times and was 90 ± 13% of T0 at 60 minutes (Figure 1). CVC was 128 ± 48% of T0 at 60 minutes. Systolic BP fell significantly (≥15%) in 17 patients (59%). Normalised average power spectral density (PSD) increased substantially in the 0.40 to 2.0 Hz band in patient A, corresponding to an increase in cardiac output (CO). Wavelet scalograms showed increased relative energy for <0.012 Hz (patients A and B) consistent with cutaneous vasodilation and around 0.02 Hz (patient A) consistent with increased sympathetic activity [2]. Conclusions Paracetamol induced increases in skBF consistent with its antipyretic action. Changes in PSD and wavelet analysis were consistent with cutaneous vasodilation. References 1. 2.
Boyle M, et al.: Aust Crit Care 1997, 10:120-122. Kvandal P, et al.: Microvasc Res 2006, 72:120-127.
P346 Intravenous paracetamol pharmacokinetics in neonates: a pooled analysis K Allegaert1, G Palmer2, B Anderson3 1 University Hospitals Leuven, Belgium; 2Royal Children’s Hospital, Melbourne, Australia; 3University of Auckland, New Zealand Critical Care 2011, 15(Suppl 1):P346 (doi: 10.1186/cc9766) Introduction The aim of this study was to describe paracetamol pharmacokinetics in neonates, to determine its covariates and suggest a dosing regimen for neonates (28 to 44 weeks postmenstrual age (PMA)). Methods A population PK analysis of paracetamol time–concentration profiles (943 observations) from 158 neonates (27 to 45 weeks PMA) was undertaken using nonlinear mixed-effects models. Data from three earlier published studies involving neonates given either i.v. propacetamol or paracetamol were pooled with newly collected observations during repeated i.v. paracetamol administration (n = 60, 343 observations, PARANEO study) [1-3]. Results A two-compartment linear disposition model was used. Population parameter estimates (between-subject variability, %) were central volume (V1) 51.9 (21.6%) l/70 kg, peripheral volume of distribution (V2) 22.7 l/70 kg, clearance (CL) 5 (40%) l/hour/70 kg and inter-compartment clearance (Q) 16.2 l/hour/70 kg. About one-half (60.9%) of the overall CL variance is predictable from covariates. Weight was used to predict size and this was the major covariate (57.5%). Clearance expressed as mg/kg/hour increases only slightly with PMA (0.138 at 28 weeks, 0.167 l/hour/kg at 44 weeks PMA), contributing only 2.2% of variance within this cohort. Unconjugated bilirubin contributed only an additional 1.2% of variance. Conclusions An increased volume of distribution supports the use of a loading dose when instigating paracetamol therapy in neonates while size is the major covariate of clearance. Clearance matured slowly in this cohort and a mean paracetamol serum concentration
Allegaert K, et al.: Arch Dis Child Fetal Neonatal Ed 2004, 89:F25-F28. Allegaert K, et al.: Eur J Clin Pharmacol 2004, 60:191-197. Palmer G, et al.: Br J Anaesth 2008, 101:523-530.
P347 Tramadol and O-demethyltramadol disposition in humans: a pooled study K Allegaert1, U Stamer2, B Anderson3, S Holford3, A Rochette4, I Troconiz5, R Pedersen6, N Holford3 1 University Hospitals Leuven, Belgium; 2University of Bonn, Germany; 3 University of Auckland, New Zealand; 4Hopital Lapeyronie, Montpellier, France; 5University of Navarra, Pamplona, Spain; 6University of Southern Denmark, Odense, Denmark Critical Care 2011, 15(Suppl 1):P347 (doi: 10.1186/cc9767) Introduction To study the use of size, maturation and CYP2D6 genotype score as predictors of i.v. tramadol (M) disposition throughout human life, published observations were pooled [1-6]. Methods M and O-demethyltramadol (M1) observations in 295 subjects (25 weeks postmenstrual age to 84.8 years) were available for population PK analysis (NON-MEM, two-compartment model for M and two additional compartments for M1). Covariates were weight, age, sex, disease (healthy/patient) and CYP2D6 genotype score. A sigmoid maturation model was used to describe changes in M (CLPO + CLPM), M1 formation (CLPM) and M1 elimination (CLMO) clearance. Phenotype-based and genotype-based models were used to distinguish poor CLPM subjects. Results Differences in M disposition between children and adults were largely accounted for by maturation and size. CKLPM (TM50 40.3 weeks, Hill 9.09) and CLPO (TM50 39.1 weeks, Hill 5.8) display fast maturation, while CLMO matures slower. The phenotype-based mixture model estimated that 8.6 were slow metabolizers (18.3% of normal CLPM). Genotype-based estimates were also lower (68%) but not all subjects with a low CYP2D6 score were in the poor metabolizer group. Conclusions Maturation of M elimination occurs early with 50% of adult values at full-term age. Maturation and age are key predictors, while CYP2D6 genotype score only explains some of the variability in M disposition. References 1. 2. 3. 4. 5. 6.
Allegaert K, et al.: Br J Anaesth 2008, 100:525-532. Bressolle F, et al.: Br J Anaesth 2009, 102:390-399. Garrido MJ, et al.: Pharm Res 2006, 23:2014-2023. Lintz W, et al.: Int J Clin Pharmacol Ther 1999, 37:175-183. Murthy BV, et al.: Br J Anaesth 2000, 84:346-349. Stamer UM, et al.: Clin Pharmacol Ther 2007, 82:41-47.
P348 Bispectral index monitoring reduces sedative and vasopressor requirements during percutaneous tracheostomy P Hampshire, A Guha, I Welters, J Murphy, L Poole Royal Liverpool and Broadgreen University Hospital, Liverpool, UK Critical Care 2011, 15(Suppl 1):P348 (doi: 10.1186/cc9768) Introduction Bispectral index (BIS) monitoring measures depth of anaesthesia, using electroencephalography (EEG). It has been validated against sedation scales used in intensive care. We hypothesized that using BIS during percutaneous tracheostomies would reduce sedation doses, resulting in fewer episodes of haemodynamic instability. Methods Patients undergoing percutaneous tracheostomy were randomised to the control or intervention groups. Norepinephrine was administered to prevent a fall of more than 20% in mean arterial blood pressure. Patients in the control group were sedated with a propofol infusion at a dose chosen by the operator. All personnel performing the tracheostomy were blinded to the BIS score. In the intervention group, patients were sedated with a propofol infusion adjusted so that the BIS
Critical Care 2011, Volume 15 Suppl 1 http://ccforum.com/supplements/15/S1
was maintained between 45 and 60. Patients with encephalopathy or brain injury, and patients who had received sedative drugs other than alfentanil and propofol were excluded. All patients or their advocates gave written, informed consent. The primary outcome was the number of episodes of haemodynamic instability. Secondary outcomes were the dose of propofol administered to patients, BIS scores, time of recovery from sedation, total norepinephrine administered to patients, and time taken to do the procedure. Results Twenty patients entered the study. Results are presented as mean ± SD. There was no significant difference in the incidence of hypotension (4.5 ± 6.8 events and 5.6 ± 6.9 events in control and intervention groups, respectively, P = 0.25). There were fewer episodes of hypertension in the intervention group (2.5 ± 4.6 events in the control group and 0.9 ± 2.2 events in the intervention group) (P = 0.12). The dose of propofol and norepinephrine dose were lower in the intervention group: 5.4 mg/kg/hour cf. to 6.8 mg/kg/hour for propofol (P = 0.21); 0.05 μg/kg/hour cf. to 0.09 μg/kg/hour for norepinephrine (P = 0.14). The mean time to waking was significantly shorter in the intervention group (54 minutes) as compared with that in the control group (96 minutes), P = 0.04. Conclusions BIS monitoring did not significantly reduce sedation requirements, or improve haemodynamics during percutaneous tracheostomy, although there was a trend to both reduced sedation requirements and improved haemodynamic stability. The time to waking was significantly reduced. P349 How is sedation provided for percutaneous dilatational tracheostomy in English ICUs? P Hampshire, L McCrossan Royal Liverpool and Broadgreen University Hospital, Liverpool, UK Critical Care 2011, 15(Suppl 1):P349 (doi: 10.1186/cc9769) Introduction Percutaneous dilatational tracheostomy (PDT) is commonly performed at the bedside in the ICU. Patients in the ICU often have multiple organ dysfunction, causing alterations in drug effects and metabolism. Alterations in sedative drug handling may make them vulnerable to awareness during PDT. Up to 40% of patients in the ICU report some awareness whilst receiving neuromuscular receptor blocking drugs [1] – these drugs are usually employed when performing PDT. Depth of anaesthesia monitoring may prevent awareness and has been used during PDT [2]. Various depths of anaesthesia monitors are available, including the bispectral index monitor (BIS), the Narcotrend Index and the State and Response Entropy, derived from the EEG. We report the results of a telephone survey on the sedation given for PDT in English ICUs. Methods We contacted 240 adult ICUs in England by telephone. Two hundred and twenty-four units (93%) participated. Results Two hundred and fourteen units (95%) perform PDT as their first-choice technique. Units that do not practice PDT (n = 10, 5%) perform open surgical tracheostomy. Most ICUs use simple infusions of propofol via standard infusion pumps during PDT (n = 202, 94%), and give additional boluses of propofol if necessary. In seven units (3.3%) anaesthesia is provided using intermittent boluses of propofol, without a background infusion. This may be of concern given that one study reported awareness during rigid bronchoscopies [3] and all the patients who reported awareness were anaesthetized using intermittent boluses of propofol. Nine units (4.2%) reported using a BIS during PDT. Three ICUs have used a BIS on a trial basis, but have discontinued. One reason given for discontinuing using a BIS was that it ‘made no difference to the amount of sedation’ during PDT. Conclusions Depth of anaesthesia monitoring is not widely used in English ICUs during PDT. It is unclear whether a BIS is effective for monitoring depth of anaesthesia during PDT, and further studies are needed to clarify this. References 1. 2. 3.
Wagner et al.: Patient recall of therapeutic paralysis in a surgical critical care unit. Pharmacotherapy 1998, 18:358-363. Phukan et al.: Percutaneous tracheostomy: a guide wire complication. Br J Anaesthesia 2004, 92:891-893. Bould et al.: Bispectral index values during elective rigid bronchoscopy: a prospective observational pilot study. Anaesthesia 2007, 62:438-445.
S124
P350 Meta-analysis of detection of respiratory events during procedural sedation JB Waugh, YA Khodneva, CA Epps University of Alabama at Birmingham, AL, USA Critical Care 2011, 15(Suppl 1):P350 (doi: 10.1186/cc9770) Introduction The use of procedural sedation and analgesia (PSA) has increased in frequency and scope, including emergent settings inside and outside the hospital. Although end-tidal CO2 (EtCO2) monitoring is routinely used during general anesthesia to monitor ventilatory status, this is not the case for PSA. Pulse oximetry and visual inspection, both with inherent limitations, represent the current standards of care for monitoring ventilatory status during PSA. EtCO2 monitoring may be a preferable method for detecting alveolar hypoventilation and preventing hypoxemia during PSA but is not widely used in this setting. Our study objective was to determine whether capnography in addition to standard monitoring improved detection of respiratory events compared with standard monitoring alone. Methods A literature search was conducted using the electronic databases PubMed, CINAHL, and Cochrane Library (Cochrane Reviews, CENTRAL) for studies published between 1995 and 2009 reporting adverse respiratory events during procedural sedation and analgesia with clearly defined EtCO2 threshold, clear study design, P-value calculation, similar outcome and predictor variable definitions, and binary independent and dependent variable raw data. To limit threats from variations in practice, only reports of adults in the USA were included. Five such studies were evaluated independently. A metaanalysis of these studies was performed. Results During PSA, cases of respiratory depression were 17.6 times more likely to be detected if monitored by capnography, versus cases not monitored by capnography (95% CI, 2.5 to 122.1; P <0.004). Conclusions This analysis suggests that EtCO2 monitoring is an important addition for detecting respiratory depression during PSA.
P351 Decreased postoperative nausea and vomiting with dexmedetomidine after off-pump coronary artery bypass grafting H Okawa, T Ono, E Hashiba, T Tsubo, H Ishihara, K Hirota Hirosaki University Graduate School of Medicine, Hirosaki, Japan Critical Care 2011, 15(Suppl 1):P351 (doi: 10.1186/cc9771) Introduction Postoperative nausea and vomiting (PONV) is one of the factors that affect the quality of postoperative patient care. We would like to report possible antiemetic effects of dexmedetomidine (DEX), a selective α2-agonist sedative, in patients after off-pump coronary artery bypass grafting (OPCAB). Methods Local Research Ethics Committee approval and written informed consent from patients or next of kin were obtained before this study. Patients after OPCAB were allocated into two groups (sedated with DEX; DEX(+), n = 123 and no sedation; DEX(–), n = 134). The incidence of PONV, postoperative morphine consumptions and amount of gastric fluid drained via a nasogastric tube were compared in the two groups. Results There were no significant differences in the patients’ profiles and intraoperative opioid consumptions. Eight patients in the DEX(+) group had PONV whereas 35 patients had PONV in the DEX(–) group (6.5% vs. 26.1%, P <0.01) during a postoperative observation period of 12.5 (3.2) and 11.8 (2.4) hours, respectively (mean (SD)). The ratio of patients who required morphine for postoperative pain relief was lower in the DEX(+) group than the DEX(–) group (67.5% vs. 83.6%, P <0.01), presumably due to analgesic effects of DEX. Analysis of individual patients revealed that five out of eight patients and 12 out of 35 patients had PONV after morphine use in the DEX(+) and DEX(–) groups, respectively. Repeated analysis without those patients revealed the same tendency (3.4% vs. 18.2% had PONV in the DEX(+) and DEX(–) groups, respectively; P <0.01) as obtained in all the patients, suggesting antiemetic effects of DEX per se. There were no significant differences in the amount of gastric fluid drained via a nasogastric tube between groups.
Critical Care 2011, Volume 15 Suppl 1 http://ccforum.com/supplements/15/S1
S125
Conclusions DEX is reported to inhibit gastrointestinal transit and gastric emptying like morphine. According to this report, the decreased incidence of PONV in the DEX(+) group in our study is not likely to be caused by peripheral effects of DEX on the gastrointestinal tract. It is widely recognized that morphine induces PONV, and we analyzed the incidence of PONV without patients who had any suspicion of morphine-induced PONV, obtaining the same result. According to these considerations, we would like to conclude that DEX could have antiemetic effects per se. Reference 1.
Br J Anaesth 1979, 78:301-307.
P352 Heart rate variability during infusion of dexmedetomidine T Imabayashi, K Ikoma, T Kikuchi, Y Kakihana, Y Kanmura Kagoshima University Hospital, Kagoshima, Japan Critical Care 2011, 15(Suppl 1):P352 (doi: 10.1186/cc9772) Introduction Dexmedetomidine is an α2-agonist, used for sedation in the ICU, although much remains to be learned about the effects on the autonomic nervous function. We therefore investigated them in the real-time monitoring of heart rate variabilities. Methods From May through November 2010, 20 patients were selected if they were treated on total mechanical ventilatory support and they were treated with continuous infusion of dexmedetomidine in our ICU. The exclusion cases were with arrhythmia or pacemaker or other treatment during the measure time. Heart rate (HR) variability analysis was recorded using the MemCalc system (MemCalc/Tonam16C; Suwa Trust, Tokyo, Japan). The spectral bands were 0.04 to 0.15 Hz (low frequency (LF)), 0.15 to 0.40 (high frequency (HF)) and others. The HF component was an indicator of sympathetic balance, and LF/HF was that of parasympathetic balance. We measured the HR, CV-RR, HF, LF/HF, systemic blood pressure (SBP), CV-SBP, SBP-HF and SBP-LF/HF. The CV-RR was SD of RR intervals, and the CV-SBP was SD of systemic blood pressure. We compared them between before and after 30 minutes administration of dexmedetomidine. The Wilcoxon signedranks test was used to compare the differences. P <0.05 was considered statistically significant. Results The HR was significantly decreased (P = 0.017), and the CVRR was in a tendency of decrease (P = 0.085). Although the SBP was not significantly changed, the CV-SBP was significantly decreased (P = 0.038). Other parameters (HF, LF/HF, SBP-HF and SBP-LF/HF) were not significantly changed. Conclusions We investigated the autonomic nervous functions in 20 patients treated with dexmedetomidine. The HR and the CV-SBP were significantly decreased. Dexmedetomidine was affected with depression of sympathetic nerve system to the HR, the CV-RR and CV-SBP. References 1.
2.
Hogue CW Jr, Talke P, Stein PK, et al.: Autonomic nervous system responses during sedative infusions of dexmedetomidine. Anesthesiology 2002, 97:592-598. Papaioannou VE, Dragoumanis C, Theodorou V, et al.: Relation of heart rate variability to serum levels of C-reactive protein, interleukin 6, and 10 in patients with sepsis and septic shock. J Crit Care 2009, 24:625.e1-625.e7.
P353 Pharmacokinetics of long-lasting, high-dose dexmedetomidine infusions in critically ill patients T Iirola1, R Aantaa1, R Laitio1, E Kentala1, M Lahtinen1, A Wighton2, C Garratt2, T Ahtola-Sätilä2, KT Olkkola1 1 University of Turku and Turku University Hospital, Turku, Finland; 2Orion Pharma, Nottingham, UK Critical Care 2011, 15(Suppl 1):P353 (doi: 10.1186/cc9773) Introduction The aim of this study was to characterize the pharmacokinetics of long dexmedetomidine (dexmed) infusions and assess the dose linearity of high doses.
Figure 1 (abstract P353). Dexmedetomidine concentration profiles of the 13 patients.
Methods Dexmed was infused to critically ill intensive care patients for 12 hours using a constant infusion rate determined by the prestudy dose of propofol or midazolam. After the first 12 hours, the infusion rate of dexmed was titrated between 0.1 and 2.5 μg/kg/hour using prefixed levels to maintain sedation in range of 0 to –3 on the Richmond Agitation–Sedation Scale (RASS). Dexmed was continued as long as required to a maximum of 14 days. Safety and tolerability were assessed by adverse events, heart rate, blood pressure, ECG and laboratory tests. Results Dexmed concentration profiles of the 13 patients during the infusion and 48-hour follow-up are depicted in Figure 1. The geometric mean values (CV%) for length of infusion, dexmed half-time, clearance and volume of distribution (elimination) were 91 hours (117%), 3.7 hours (38%), 41 l/hour (47%) and 223 l (35%), respectively. There was a linear relationship (r2 = 0.95; P <0.001) between the areas under the dexmed plasma concentration–time curves and cumulative doses of dexmed. All but one patient needed propofol to keep the RASS value in the target zone. The most common adverse events were tachycardia, hypotension and hypertension. Conclusions The pharmacokinetics of dexmed was linear up to the dose of 2.5 μg/kg/hour. Despite the high dose and long-lasting infusions, safety findings were as expected for dexmed and the patient population.
P354 Hemodynamic, metabolic and inflammatory effects of dexmedetomidine in a pig model of septic shock P Carnicelli1, D Fantoni1, D Otsuki2, A Monteiro Filho1, M Kahvegian2, J Noel-Morgan2, J Auler Jr2 1 Faculdade de Medicina Veterinária e Zootecnia da Universidade de São Paulo, Brazil; 2Faculdade de Medicina da Universidade de São Paulo, Brazil Critical Care 2011, 15(Suppl 1):P354 (doi: 10.1186/cc9774) Introduction The use of dexmedetomidine to achieve sedation, analgesia and mechanical ventilation has increased in critically ill patients, although little is known about its effects in septic shock. The aim of this study was to assess hemodynamic, metabolic and inflammatory effects of dexmedetomidine in a pig model of septic shock. Methods Eighteen pigs were anesthetized, mechanically ventilated and randomly allocated into three groups of six animals: sham group, shock group (intravenous infusion of live Escherichia coli over 1 hour) and shock+dex group (E. coli + bolus and constant rate infusion treatment with dexmedetomidine). Both shock groups received fluid therapy with lactated Ringer’s (LR) and norepinephrine to reach central venous pressure of 8 to 12 mmHg and mean arterial pressure ≥65 mmHg. T0 was considered the end of bacterial infusion and animals were monitored hourly for 240 minutes. Hemodynamic parameters were assessed with a pulmonary artery catheter and femoral arterial catheter. Blood gases, intestinal tonometry and inflammatory cytokines were also measured. Two-way ANOVA and Tukey test were used for statistical analysis (P <0.05).
Critical Care 2011, Volume 15 Suppl 1 http://ccforum.com/supplements/15/S1
Results E. coli infusion resulted in cardiovascular collapse, acute lung injury and metabolic acidosis. At T0, oxygen consumption was significantly greater in the shock+dex group (149.9 ± 25.6 ml/minute/m2) than in the shock group (111.5 ± 21.6 ml/minute/m2), as was Pr–Pa (53 ± 14 mmHg and 35 ± 11 mmHg, respectively). At T180, SvO2 in the shock+dex group was statistically lower than in the shock group (62.5 ± 9.0 vs. 74.2 ± 9.1%, respectively). At T240, cardiac index in the shock+dex group was lower than that in the shock and sham groups (2.8 ± 0.5 vs. 3.6 ± 1.7 vs. 4.7 ± 1.1 ml/minute/m2, respectively) while the oxygen extraction rate was larger in the shock+dex group (43 ± 20%) than in the shock group (25 ± 11%). TNFα levels were similar in both groups. Although plasma levels of IL-1β, IL-6 and IL-10 were elevated in the shock group, there was no statistical significance with the shock+dex group. No statistical difference was found in treatment with LR or norepinephrine, nor in urine output. Conclusions Dexmedetomidine is likely to cause a mismatch between oxygen delivery and consumption by affecting microcirculation in critically ill patients, despite treatment with crystalloids and vasoactive agents. Its effects on the inflammatory response remain unclear. Acknowledgements Grant from FAPESP 08/58875-4.
P355 Dexmedetomidine improves attention and recall in agitated critically ill patients MM Mirski, RG Gill, PM Murakami, CT Thompson, JL Lewin Johns Hopkins Medicine, Baltimore, MD, USA Critical Care 2011, 15(Suppl 1):P355 (doi: 10.1186/cc9775) Introduction It is of clinical interest to maintain patient comfort in the ICU and yet preserve their intellectual function, arousal and interaction. Recently, dexmedetomidine (DEX) was demonstrated in the ANIST Trial to preserve intellectual function as compared with propofol (PRO) when used as conscious sedation in both agitated neurologically intact and brain-injured critically ill patients [1]. The purpose of this study was to further understand whether selective areas of cognition were specifically affected by PRO and DEX through sub-analysis of the Trial’s results on each of the five subscales of the Adapted Cognitive Exam (ACE). Methods We preformed a post-hoc analysis of the prospective randomized, double-blinded cross-over designed ANIST trial that compared cognitive differences between PRO and DEX on the validated 100-point Hopkins ACE. This current study further investigated differences by analyzing the five subscales of the ACE, which consist of Orientation, Language, Registration, Attention/Calculation and Recall. Analysis included a generalized estimating equations approach to estimate differences between drugs while accounting for withinsubject correlation arising from the crossover design. We examined unadjusted and adjusted models both with and without inclusion of potential period effects. We also accounted for period effects, and robust variance estimates were used to calculate standard errors. Results Sedation with PRO diminished adjusted scores on four of the ACE subscales (P <0.01), while DEX improved adjusted scores on two of the subscales (Attention/Calculation 2.35, 95% CI: 0.11 to 4.59; Recall: 2.03, 95% CI: 0.03 to 4.04). The other estimates for the effects of PRO and DEX on the ACE subscales were not statistically significant using a significance level of 0.05. The positive and significant difference in the change of ACE score between DEX versus PRO held up in all of the subscales. Conclusions Our findings indicate that DEX not only preserved but also improved Attention/Calculation and Recall in ICU patients who were awake, agitated and required sedation. This was evident by higher mean ACE subscale scores when compared with their baseline. Our findings suggest that DEX improved overall cognitive function without significantly compromising the ability to focus and recall events. Reference 1.
Mirski MA, Lewin JJ 3rd, Ledroux S, et al.: Cognitive improvement during continuous sedation in critically ill, awake and responsive patients: the Acute Neurological ICU Sedation Trial (ANIST). Intensive Care Med 2010, 36:1505-1513.
S126
P356 Skin conductance variability in ICU patients: an observational study of the relation to pain and Motor Activity Assessment Scale level AC Günther1, AR Schandl1, H Storm2, P Rossi1, PV Sackey1 1 Karolinska Institutet, Stockholm, Sweden; 2 Rikshospitalet University Hospital, Oslo, Norway Critical Care 2011, 15(Suppl 1):P356 (doi: 10.1186/cc9776) Introduction Many patients describe pain and other adverse feeling from their ICU stay and the impact of such feelings impacts long-term psychological morbidity. Presently no objective method for detecting pain or distress is available. Skin conductance variability has been investigated as a monitor of perioperative pain. The method has not been studied in adult ICU patients. Methods Twenty-five (13 intubated and 12 non-intubated) patients were included in this observational study. Patients were monitored with the MED-STORM Stress Detector for 1 hour of intensive care treatment and care. Skin conductance variability (number of skin conductance fluctuations per second (NSCF)) was measured and patients were observed in parallel during rest and during procedures and staff–patient interactions. The sedation–agitation level was monitored with the Motor Activity Assessment Scale. Pain was monitored with the Numeric Rating Scale (0 to 10) in communicating patients and by observation of expressions of pain in patients unable to communicate verbally. Results In non-intubated patients, NSCF values were low when patients were unstimulated and comfortable and increased with increasing stimulation but also with increasing agitation without any apparent pain. The highest NSCF values were noted during combined pain and agitation. In intubated patients, a similar pattern was observed but with generally lower values, most likely due to sedation. Sensitivity and specificity of NSCF at a cut-off value >0.13 for detecting expressed pain/discomfort were 74% and 55% for non-intubated patients and 61.5% and 68% for intubated patients. Conclusions Skin conductance variability increases in critically ill patients with increasing stimulation but is also affected by the level of sedation/agitation, making the method unsuitable for detecting pain alone in critically ill patients, but possibly of value to more generally monitor emotional stress with different etiology. Further studies of the method in critically ill patients, over longer time and with validated pain instruments are warranted. Conflicts of interest HS is a co-owner of Med-Storm AS, the company responsible for the production and distribution of the Med-Storm Stress Detector. The other authors declare that they have no conflicts of interest. P357 Change in hypnotic sedative choice over time as a surrogate marker of improved performance T Hughes, F Hanks, P Hopkins Kings College Hospital, London, UK Critical Care 2011, 15(Suppl 1):P357 (doi: 10.1186/cc9777) Introduction Daily sedation holds, particularly when combined with protocolised spontaneous breathing trials, are one of the only strategies available to intensivists that produce an outcome benefit [1]. This evidence has also provoked a renewed interest in the choice of both hypnotic and analgesic agents. Midazolam is known to produce unpredictable awakening and may prolong time to extubation when infusions continue longer than 48 to 72 hours. In contrast, propofol may enhance the benefit to critically ill patients of the daily sedation hold due to its pharmacokinetic properties [2]. This study examines the hypothesis that the ratio of propofol/midazolam use can be used as a surrogate marker of good practice and utilises the potential of the pharmacy procurement database. Methods The amount of propofol and midazolam supplied in grams per month was obtained from the pharmacy database for both the surgical and medical critical care units for the period April 2006 to July 2009. These data were compared with the number of monthly admissions, average monthly length of stay, APACHE II score (May 2008 to July 2009) and standardised mortality rate (SMR) for that period. Sigmaplot 11.0 was used to determine statistical significance.
Critical Care 2011, Volume 15 Suppl 1 http://ccforum.com/supplements/15/S1
Results There was a statistically significant increase in propofol use per patient (r = 0.512; P = 0.0007) and reduction in midazolam use per patient (r = –0.384; P = 0.014) between April 2006 and July 2009. The mean ± SD monthly admission rate was 142 ± 15.3 patients. The use of propofol/midazolam was independent from length of stay and APACHE II score. Statistical significance was not reached when correlating propofol/midazolam use to fall in SMR (1.11 to 0.77) due to the limited number of data points. Conclusions Although a clear relationship between reduced midazolam use and improved outcome could not be demonstrated, information from the pharmacy database remains an important means to review prescribing practice. Monthly supply may not always accurately reflect use but over time will indicate significant changes in practice such as the reduced use of midazolam at this institution. References 1.
2.
Girard TD, et al.: Efficacy and safety of a paired sedation and ventilator weaning protocol for mechanically ventilated patients in intensive care. Lancet 2008, 371:126-134. Chamorro C, et al.: Comparative study of propofol versus midazolam in the sedation of critically ill patients. Crit Care Med 1996, 24:932-939.
P358 What happens to all that propofol during prolonged sedation? N Cowley, TH Clutton-Brock University Hospital Birmingham, UK Critical Care 2011, 15(Suppl 1):P358 (doi: 10.1186/cc9778) Introduction There are few published data on the pharmacokinetics of propofol infusion for prolonged periods in critical care. Propofol is frequently infused for days or weeks in critically ill patients with organ dysfunction. We aimed to determine whether propofol concentrations in critically ill patients are predictable during constant rate infusion, and whether significant organ failure might lead to accumulation when compared with conventional pharmacokinetic models. Methods We compared blood propofol levels with total dose and duration of propofol infusion in 53 samples from 43 patients on a mixed critical care unit undergoing prolonged sedation. Estimated propofol concentration was calculated using the Marsh algorithm. The Richmond Agitation Scale at the point of propofol measurement was recorded, and the Sequential Organ Failure Assessment (SOFA) score was recorded for assessment of its impact on propofol levels. Results Propofol was infused for a mean of 33 hours (14 to 44 interquartile range). The mean measured propofol concentration was 1.37 μg/ml (range 0.29 to 2.60). There was fairly good correlation between estimated propofol concentrations (based on the Marsh model) and measured levels with a R2 value of 0.500, shown in Figure 1. The level of organ failure did not impact significantly on the accuracy of predicted propofol levels.
S127
Conclusions We were able to demonstrate a correlation between predicted propofol levels and those measured in blood. Predicted propofol levels were on average lower than measured levels, suggesting a reduced capacity to metabolise propofol in critical illness, although this effect was not marked, and we were unable to demonstrate an association between severity of organ failure and deviation of measured from predicted propofol levels. Acknowledgements The authors thank Sphere Medical Ltd for use of the novel blood propofol analyser. References 1. 2.
Cavaliere F: Br J Anaesth 2005, 94:453-458. McMurray TJ, et al.: Anaesthesia 2004, 59:636-641.
P359 Psychological long-term effects of a no-sedation protocol in critically ill patients T Strøm, M Stylsvig, P Toft Odense University Hospital, University of Southern Denmark, Odense, Denmark Critical Care 2011, 15(Suppl 1):P359 (doi: 10.1186/cc9779) Introduction A protocol of no sedation has been shown to reduce the time patients receive mechanical ventilation and reduce intensive care and total hospital length of stay [1]. The long-term psychological effect of this strategy has not yet been described. Methods We contacted all surviving patients who had been randomized to our original trial that compared a no-sedation strategy with a traditional strategy of sedation and daily wake-up trial. Patients were offered a follow-up interview with a neuropsychologist. The neuropsychologist was blinded to the randomized treatment. All patients were assessed with the same validated psychological tests. Post-traumatic stress disorder (PTSD) was evaluated with three tests: Revised Impact of Event Scale, State Anxiety Inventory Scale and PostTraumatic Stress Syndrome 10-Questions Inventory scale (PTSS-10). The generic quality of life was evaluated using the Medical Outcomes Study 36-item short-form health survey (SF-36). Depression was evaluated using the Beck Depression Inventory-2 score (BDI-II). Patients were also assessed with a modified version ICU memory tool. Results A total of 26 patients were interviewed (13 from each group). The time span between randomization and interview was 2 years (nosedation group 1.78 (1.46 to 2.10) years vs. sedated group 2.04 (1.55 to 2.29) years, P = 0.32). No difference was found with respect to baseline data. Very few patients suffered from PTSD and no significant difference was found between the two groups. No difference was found with respect to generic quality of life (SF-36). A very low rate of depression was found in both groups with no significant difference. The modified ICU memory tool showed that two-thirds of patients from both groups had experienced nightmares during their ICU stay. Very few patients remembered pain or breathing difficulties in the ICU (NS). Conclusions Our data disprove the popular supposition that a protocol of no sedation applied to critically ill patients undergoing mechanical ventilation increases the risk of long-term psychological sequelae after intensive care compared to standard treatment with sedation. With the reduced ventilator days, reduced ICU and hospital length of stay, this psychological follow up further supports the benefits from a no-sedation strategy applied to critically ill patients undergoing mechanical ventilation. Reference 1.
Strom T, Martinussen T, Toft P: Lancet 2010, 375:475-480.
P360 Cannabinoid receptor-1 inhibition causes anesthetic-induced excitation in septic rats R Kuschnereit, C Lehmann, S Whynot, O Hung, R Shukla, D Henzler, V Cerny, D Pavlovic, M Kelly Dalhousie University, Halifax, Canada Critical Care 2011, 15(Suppl 1):P360 (doi: 10.1186/cc9780) Figure 1 (abstract P358). Correlation between measured and estimated propofol levels in critically ill patients.
Introduction In systemic inflammation and sepsis, the endocannabinoid system is upregulated [1]. While it is known that neuronal
Critical Care 2011, Volume 15 Suppl 1 http://ccforum.com/supplements/15/S1
cannabinoid signalling via cannabinoid receptor-1 (CB1) in the central nervous system represents an intrinsic neuroprotective response [2] and exerts anti-epileptic activity [3], inhibition of CB1 (CB1inh) has been suggested as an experimental target for sepsis therapy [4]. We studied the effects of CB1inh in rats with experimental sepsis during anesthesia induction with pentobarbital. Methods Five groups of Lewis rats were included in the study: Group 1 – sham-operated controls treated with CB1inh (AM281, 2.5 mg/kg i.v., n = 12), Group 2 – animals with colon ascendens stent peritonitis (CASP)-induced sepsis treated with CB1inh (n = 12). As additional control groups we administered in CASP animals the CB1 agonist ACEA (2.5 mg/kg i.v.; Group 3; n = 4) or the solvent DMSO (Group 4; n = 4). In Group 5 we administered 50 mg/kg ketamine for induction of anesthesia 14 hours following the CASP treated by CB1inh. All other groups received a standard dose of pentobarbital (40 mg/kg i.v.) 14 hours following CASP procedure. Results In five out of 12 septic animals (42%) with CB1inh (Group 2) we observed tonic–clonic seizures immediately after induction of anesthesia with a standard dose of pentobarbital. In sham-operated animals (Group 1) or CASP animals without CB1inh (Group 4) we did not observe anesthetic-induced excitation. Replacement of the barbiturate by ketamine (Group 5) avoided seizures as well as treatment with the CB1 agonist (Group 3). Conclusions CB1 inhibition in sepsis may increase the incidence of anesthetic-induced excitation and reduce CB1-mediated intrinsic neuroprotective response. References 1. 2. 3. 4.
Varga K, et al.: FASEB J 1998, 12:1035-1044. Hwang et al.: Life Sci 2010, 86:615-623. Pacher et al.: Pharmacol Rev 2006, 58:389-462. Kadoi et al.: Br J Anaesth 2005, 94:563-568.
P361 Introduction of a remifentanil-based analgo-sedation protocol leads to a reduction of duration of mechanical ventilation and ICU stay in critically ill patients J Van den Bosch, J Van Bommel, J Bakker, D Gommers Erasmus MC, Rotterdam, the Netherlands Critical Care 2011, 15(Suppl 1):P361 (doi: 10.1186/cc9781) Introduction Conventional sedation strategies in the ICU are based on the use of propofol or benzodiazepines for sedation in combination with morphine or other opioids for analgesia. An alternative strategy is based on analgo-sedation with remifentanil, a potent and very shortacting opioid agent. However, evidence is scarce that such a strategy is more efficacious. Methods In January 2010 we introduced a remifentanil-based analgosedation protocol in our 32-bed academic general ICU. To evaluate the efficacy, we performed a retrospective comparison of all patients admitted between 1 April and 30 June 2010 with a control group consisting of patients admitted between 1 February and 30 September 2009 who underwent a conventional sedation strategy. Exclusion criteria were mechanical ventilation <24 hours, brain trauma, any other neurologic pathology, and moribund. Results In total, 596 patients were selected in the conventional group (C) and 214 in the remifentanil group (R); after exclusion, group C consisted of 163 patients and group R of 70 patients for analysis. Both groups were identical in age, sex and APACHE II score. The mean duration of mechanical ventilation was significantly lower in group R (P = 0.01); time to successful detubation was significantly shorter in group R (log-rank P = 0.0026, HR = 0.57 (0.40 to 0.82). Overall ICU stay was shorter in group R; time to discharge to the ward was shorter in group R as well (log-rank P = 0.01, HR = 0.63 (0.44 to 0.90). ICU and hospital mortality as well as overall hospital stay were comparable in both groups. Conclusions Introduction of a remifentanil-based analgo-sedation protocol significantly decreased duration of ventilation and ICU stay, most probably due to its short half-time, the easy titration of sedation and the absence of prolonged oversedation in critically ill patients.
S128
P362 Validity and reliability of the Johns Hopkins Adapted Cognitive Exam for critically ill patients MM Mirski, JL Lewin, SL Ledroux, KS Shermock, CT Thompson, HG Goodwin, EM Mirski, RG Gill Johns Hopkins Medicine, Baltimore, MD, USA Critical Care 2011, 15(Suppl 1):P362 (doi: 10.1186/cc9782) Introduction Assessment of cognition in ICU patients is a critical component of evaluating cerebral dysfunction. Several cognitive tools also exist for assessment of delirium in the ICU. However, few are simple to use and none has been specifically designed to focus on cognition in ICU patients. The Johns Hopkins Adapted Cognitive Exam (ACE) is an examination tool on a 100-point scale specifically designed for the assessment and quantification of cognition in critically ill patients. Methods A prospective cohort study to establish the criterion, construct, and face validity, as well as inter-rater reliability and interitem reliability of the ACE. Results A total of 106 patients were assessed, 46 intubated and 60 non-intubated, resulting in 424 ACE measurements and 240 MMSE measurements. ACE and MMSE were performed by 76 different raters over the study period. For criterion validity we compared ACE with a neurointensivist’s assessment of cognitive status (rs = 0.83, P <0.001). In addition we utilized an ordinal logistic regression model to establish optimal predicted cut-off points for cognitive status classification (<28 = severely impaired, 29 to 55 = moderately impaired, >56 = mildly impaired or normal). Utilizing these cut-off points, the ACE appropriately classified cognitive status 90% of the time as compared with the neurointensivist assessment. Construct validity was established by comparing ACE with MMSE in non-intubated patients (rs = 0.81, P <0.001). Face validity was assessed by surveying raters who used both the ACE and MMSE during the study, and indicated the ACE was an accurate reflection of the patient’s cognitive status, was more sensitive a marker of cognition than the MMSE, and was easy to use. The ACE demonstrated excellent inter-rater reliability (ICC = 0.997, 95% CI = 0.997 to 0.998). In addition, inter-item reliability of each of the five subscales of the ACE and MMSE was also assessed (Cronbach’s alpha: range for ACE = 0.83 to 0.88; range for MMSE = 0.72 to 0.81), demonstrating a higher degree of internal consistency across subscales for the ACE. Conclusions The ACE is the first valid and reliable examination for the assessment and quantification of cognition in critically ill patients. It provides a useful, objective tool that can be utilized by any member of the interdisciplinary critical care team to support clinical assessment and research efforts. Reference 1.
Mirski MA, Lewin JJ 3rd, Ledroux S, et al.: Cognitive improvement during continuous sedation in critically ill, awake and responsive patients: the Acute Neurological ICU Sedation Trial (ANIST). Intensive Care Med 2010, 36:1505-1513.
P363 UDP glucuronosyltransferase 2B7 single nucleotide polymorphism (rs7439366) influences heat pain response in human volunteers after i.v. morphine infusion KM Meissner1, HM Meyer zu Schwabedissen1, CG Göpfert2, MD Ding2, JB Blood2, KF Frey2, HK Kim2, EK Kharasch2 1 Universitätsklinikum Greifswald, Germany; 2Washington University in St Louis, MO, USA Critical Care 2011, 15(Suppl 1):P363 (doi: 10.1186/cc9783) Introduction Morphine remains the most widely used intravenous opioid in the perioperative setting worldwide. Maintaining therapeutic CNS concentrations of many opioids is confounded by considerable variability in disposition. Recent findings indicate a role for the UGT2B7 expressed in the liver, for variability of substrate effects. This phenomenon is attributed to genetic and environmental factors. However, evidence for effect variation due to UGT2B7-mediated glucuronization of morphine in humans is lacking. Methods We tested the hypothesis that variations of morphine effects could be explained in part by genetic variation in the UGT2B7
Critical Care 2011, Volume 15 Suppl 1 http://ccforum.com/supplements/15/S1
S129
Figure 1 (abstract P363). Miosis (mm) after the start of the morphine injection.
Figure 1 (abstract P364). Muscle lactate level with saline or metformin infused by reverse microdialysis.
Figure 2 (abstract P363). Maximally tolerable temperatures (°C) hours after morphine injection.
gene by pupil diameter change and heat pain response in 35 healthy volunteers, who were given 0.2 mg/kg morphine i.v. over 2 hours. This abstract reports the results for the UGT2B7 (rs7439366) SNP on chromosome 4, coding for a histidine or a tyrosine at position 268, resulting in decreased enzyme activity. Results Ten subjects exhibited the wildtype, 20 were heterozygous and five were homozygous carriers of the allele. Peak effects of miosis did not differ for the three variants (Figure 1). However, while the results for heat pain response indicate almost no effect at all for wildtype subjects, carriers of the T allele experience a higher peak and an extended analgesia (Figure 2). Neither the parent drug nor the 3-glucuronide and 6-glucuronide serum concentrations differed significantly among the research subjects. Conclusions While morphine effects might be influenced in part by UGT2B7 genotype, there is a differential effect on pupil contractility and heat pain response. This cannot be readily explained by drug or metabolite serum concentration and warrants further investigation, including different enzyme product effects on cerebral morphine levels. P364 Metformin increases skeletal muscle lactate production in pigs: a microdialysis study A Protti1, P Properzi2, S Magnoni2, A Santini1, T Langer1, S Guenzani1, P Bertoli3, N Stocchetti1, L Gattinoni1 1 Università degli Studi di Milano, Milan, Italy; 2Fondazione IRCCS Ca’ Granda, Ospedale Maggiore Policlinico, Milan, Italy; 3Università degli Studi di Milano, Centro Ricerche Chirurgiche Precliniche, Milan, Italy Critical Care 2011, 15(Suppl 1):P364 (doi: 10.1186/cc9784) Introduction Lactic acidosis during metformin intoxication is mainly attributed to impaired hepatic lactate clearance [1]. The aim of this present work was to clarify whether metformin at high dose also increases skeletal muscle lactate production. Methods Reverse microdialysis was used in six healthy, sedated and mechanically ventilated pigs, equipped with two skeletal muscle catheters (CMA Microdialysis AB, Sweden). Following a baseline
recording, a continuous infusion of saline (control) or metformin diluted in saline (1 mol/l) began. Outflow lactate concentration was measured every 3 hours, up to 12 hours. Results Data are presented as the mean and standard deviation in Figure 1. The interaction between infusion (saline vs. metformin) and time was statistically significant (P = 0.02; two-way repeated-measures ANOVA). Conclusions In skeletal muscle, a high dose of metformin increases interstitial lactate levels, a finding consistent with local lactate overproduction. Reference 1.
Lalau JD: Drug Saf 2010, 33:727-740.
P365 Bilirubin and carboxy-hemoglobin concentrations in critically ill patients: prognostic significance of free heme metabolites H Morimatsu, F Takatsu, J Matsumi, M Tani, Y Moriya, J Kosaka, K Morita Okayama University Hospital, Okayama, Japan Critical Care 2011, 15(Suppl 1):P365 (doi: 10.1186/cc9785) Introduction Serum bilirubin is routinely measured in the ICU. Physiologically, bilirubin is one of three heme metabolites such as iron and carbon monoxide (CO), but this fact is almost completely ignored in our daily physiological assessments. In this study, we examined the prognostic significance of these two heme metabolites (T-Bil and CO-Hb) in general ICU populations. Methods We retrospectively studied 723 patients with 12,458 blood gas measurements. Finally, we analyzed paired samples of 1,882 blood gas measurements and laboratory results from 491 ICU patients. We specifically assessed the prognostic significance of serum T-Bil and CO-Hb and their combination. Results Our ICU patients had a mean age of 61.8 (SD: 16.1), APACHE II score of 12.1 (4.4). Their hospital mortality was 5.5%. The nonsurvivors had a significantly higher T-Bil compared with the survivors (4.43 (5.30) vs. 1.31 (1.51) mg/dl; P = 0.005). On the other hand, a mean of arterial CO-Hb did not differ significantly between the groups (1.52 (0.39)% vs. 1.54 (0.35)%; P = 0.86). When patients were divided by four groups according to T-bil (high or low) and CO-Hb (high and low) values, the high-high group had worst outcome (11.1%), but the low-high group had best outcome in the four groups (1.19%) (Figure 1). Finally, prognostic discrimination of T-Bil was significantly improved when arterial CO-Hb was included in the model (area under the ROC curve 0.701 to 0.754). Conclusions Serum T-Bil values were significantly higher in the nonsurvivors than the survivors. Prognostic significance of T-Bil significantly improved when taking into account the CO-Hb levels. These results imply that, even in the general ICU patients, metabolites of heme protein had prognostic significance and importance.
Critical Care 2011, Volume 15 Suppl 1 http://ccforum.com/supplements/15/S1
S130
morbidity and mortality. Further clinical studies could be elucidated for this subject. P367 Effects of CoQ10 on the erythrocyte and heart tissue cholinesterase, nitric oxide and malondialdehyde levels in acute organophosphate toxicity A Bayır1, H Kara2, Ö Köylü3, R Kocabaş4, A Ak1 1 Selçuk University, Selçuklu Faculty of Medicine, Konya, Turkey; 2State Hospital, Konya, Turkey; 3Meram Trainin Hospital, Konya, Turkey; 4Selçuk University, Meram Faculty of Medicine, Konya, Turkey Critical Care 2011, 15(Suppl 1):P367 (doi: 10.1186/cc9787)
Figure 1 (abstract P365). Hospital mortality divided by T-Bil and CO-Hb levels.
Reference 1.
Larsen R, et al.: Sci Transl Med 2010, 2:51ra71.
P366 Effects of N-acetylcysteine on the erythrocyte and liver cholinesterase, nitric oxide and malondialdehyde levels in acute organophosphate toxicity A Bayır1, H Kara2, Ö Köylü3, R Kocabaş4, A Ak1 1 Selçuk University, Selçuklu Faculty of Medicine, Konya, Turkey; 2Konya State Hospital, Konya, Turkey; 3Meram Educating and Training Hospital, Konya, Turkey; 4Selçuk University, Meram Faculty of Medicine, Konya, Turkey Critical Care 2011, 15(Suppl 1):P366 (doi: 10.1186/cc9786) Introduction The aim of this study was to investigate the effects of N-acetylcysteine (NAC) on the levels of erythrocyte and liver cholinesterase (CE), nitric oxide (NO) and malondialdehyde (MDA) in acute organophosphate poisoning (AOP) and to compare with pralidoxime (PAM)–atropine treatment. Methods Twenty rabbits were divided into sham (n = 8), PAM–atropine (n = 6), and NAC groups (n = 6). The basal blood samples were taken from each test subject to measure plasma and erythrocyte CE, NO, and MDA values before toxicity. All of the groups were given 50 mg/ kg DDVP orogastrically. The rabbits in the sham group did not receive treatment. The test subjects in the PAM–atropine and NAC groups were given 0.05 mg/kg atropine with repeated doses when required and 30 mg/kg i.v. bolus, then 15 mg/kg PAM i.v. every 4 hours. In addition to PAM and atropine, the NAC group received 30 mg/kg NAC i.v. every 6 hours. Blood samples were taken from the rabbits in all groups in the first, 12th and 24th hours to measure plasma CE, NO and MDA. Laparatomy was performed on all subjects in the 24th hour and liver tissue samples were obtained to evaluate CE, NO and MDA values in the tissues. Results The erythrocyte CE levels of the NAC group were considerably higher than the sham and PAM–atropine groups in the 12th hour (P = 0.001, 0.015, respectively). It was established that serum NO and MDA levels of the NAC group were significantly lower than the sham and PAM–atropine groups in the 12th hour (P = 0.043, 0.041, respectively). The erythrocyte CE levels of the NAC group in the 24th hour was significantly higher than the PAM–atropine group (P = 0.015). The erythrocyte NO and MDA levels of the NAC group in the 24th hour were significant lower than the PAM–atropine group (P = 0.037, 0.028, respectively). No significant difference was determined between the NAC group and PAM–atropin group for liver tissue CE and NO levels (P = 0.055, 0.109, respectively). The liver tissue MDA levels of the NAC group were significantly lower than the sham and PAM–atropine groups (P = 0.004, 0.004, respectively). Conclusions In the treatment of AOP, NAC has a favorable effect on both blood and liver tissue CE activity, NO levels and lipid peroxidation. Adding to antidote treatment of NAC could reduce organ damage,
Introduction The aim of this study was to examine the effects of CoQ10 on malondialdehyde (MDA) and nitric oxide (NO) levels and on the choline esterase (CE) activity in the heart tissue and erythrocytes in acute organophosphate poisoning (AOP) and to compare it with antidote treatment. Methods Twenty rabbits were divided into three groups as sham (n = 8), PAM–atropine (n = 6), and CoQ10 groups (n = 6). The blood samples were taken from each test subject to measure plasma and erythrocyte CE, NO, and MDA values before toxicity. To all of the groups were given 50 mg/kg DDVP by orogastric tube. After toxicity, venous blood samples were taken to establish post-toxicity plasma and erythrocyte CE, NO, and MDA levels in the first, 12th and 24th hours. The rabbits in the sham group did not receive treatment. The test subjects in the PAM–atropine group were given 0.05 mg/kg atropine with repeated doses when required and 30 mg/kg i.v. bolus, then 15 mg/kg PAM i.v. every 4 hours. The subjects in the CoQ10 group received 50 mg CoQ10 i.v. Thoracotomy was performed in the 24th hour on the subjects in all groups and heart tissue samples were obtained to evaluate CE, NO and MDA values in the tissues. The test subjects were given high-dose i.v. anesthesia and were sacrificed at the end of the study. Results In the 12th and 24th hours erythrocyte CE levels of the CoQ10 group were considerably higher than the PAM–atropine group (P = 0.007, 0.017, respectively). It was established that erythrocyte MDA and NO levels of the CoQ10 group were significantly lower than the PAM–atropine group in the 12th and 24th hours (P <0.05). Heart tissue CE levels of the CoQ10 group were considerably higher than the sham and PAM–atropine groups (P = 0.001). Heart tissue MDA and NO levels of the CoQ10 group were significantly lower than the sham and PAM– atropine groups (P = 0.000, 0.000, 0.001, 0.000, respectively). Conclusions Treatment of AOP with CoQ10 plus PAM–atropine has a therapeutic effect on both erythrocyte and heart tissue lipid peroxidation and CE activity. Using CoQ10 with PAM–atropine in AOP patients with cardiac damage could reduce morbidity and mortality. Further clinical studies would be of benefit to clarify this matter. P368 Natriuretic peptide-induced hyponatremia in a patient with left atrial myxoma D Ramnarain1, N Mehra2 1 St Elisabeth Ziekenhuis, Tilburg, the Netherlands; 2University Medical Centre Utrecht, the Netherlands Critical Care 2011, 15(Suppl 1):P368 (doi: 10.1186/cc9788) Introduction In addition to the renin–angiotensin–aldosterone system, natriuretic peptides act as regulators of blood pressure. Natriuretic peptides increase sodium and water excretion, increase the glomerular filtration rate, and are vasodilatators. We report a case in which a large atrial myxoma induced overproduction of natriuretic peptides, causing clinically relevant hyponatriemia, hypotension and polyuria. Methods We present a 74-year-old Caucasian female who was referred by her cardiologist for resection of a large left atrial myxoma. Results The patient’s medical history was unremarkable except for irritable bowel syndrome, mild hypertension, and recently paroxysmal atrial fibrillation due to growth of her myxoma. A month preoperatively a laboratory study indicated a mild hyponatriemia. Clinical investigation postoperatively showed a hypovolemic patient, with a blood pressure of 85/32 mmHg, a heart rate of 54 bpm, and CVD <5 mmHg. There were
Critical Care 2011, Volume 15 Suppl 1 http://ccforum.com/supplements/15/S1
no signs of heart failure. Urine production was 200 ml/hour without any diuretic therapy, and remained high during 2 days after surgery. Laboratory investigation showed increased ANP levels during the patient’s stay. Sodium was 129 mmol/l and decreased to 127 mmol/l, GFR >60 ml/minute, serum osmolarity was 262 mOsmol/kg. Natriuresis was 175 mmol/l, urine osmolarity was 563 mOsmol/kg. Pathological examination showed a large myxoma, connected to the fossa ovalis (4.3 x 4.5 x 3 cm). On the third day her urine production decreased to 70 ml/hour. Hyponatremia persisted and 10 days later her sodium level normalised. Conclusions We propose a mechanism of hyponatremia caused by overproduction of physiologically active natriuretic peptides by atrial stretch and ventricular stretch caused by a large intracardial tumour. Atrial stretch releases ANP and ventricular stretch releases BNP from myocardial cells. Normally increased intracardial stretch implies a volume expansion, and release of natriuretic peptides act to regulate blood pressure by increasing sodium and water excretion. A large intracardial tumour attached to the embryonic remnant of the fossa ovalis caused intracardial stretch, mimicking a hypervolemic state. Overproduction of natriuretic peptides is seen in different clinical aetiologies such as intracerebral haemorrhage, lung cancer and pneumonia, linking natriuretic peptides to cerebral salt wasting and SIADH. We provide evidence of a rare cause of hyponatremia and polyuria caused by overproduction of the physiological natriuretic peptide system by a large myxoma. P369 Hypophosphatemia of prognostic value in acute exacerbation of COPD N Makhoul1, R Farah2, L Jacobson3 1 Western Galilee Hospital, Naharya, Israel; 2Ziv Hospital, Zfat, Israel; 3Naharia Hospital, Naharia, Israel Critical Care 2011, 15(Suppl 1):P369 (doi: 10.1186/cc9789) Introduction Phosphorus is the most important anion and it is important to cell function, necessary to create the ATP energy, and an essential component of nucleic acids. Low levels of phosphorus in the blood may be due to a change in functioning of organs participating in the phosphorus balance and affecting the performance of different systems. A low level of phosphorus in the blood increases the exacerbation and the severity of COPD, increasing the need for mechanical ventilation. Methods All patients were hospitalized in our hospital due to acute COPD exacerbation during 6 months. Comparison was made between the group with normal blood phosphorus and the group with a low phosphorus level. We checked the length of hospital stay, the need for ventilation, ventilation duration, mortality and morbidity rates. Results We examined 242 patients, 73% men 27% women, average age 66.6 years. One hundred and ninety-four patients (80%) were
S131
hospitalized in the internal medicine department and 48 (20%) needed mechanical ventilation in the ICU. On admission, 95% of patients had a normal phosphorus level, 5% had a low phosphorus level, in 3.3% the phosphorus level was low, and 1.7% had a very low level of phosphorus. In the group of 48 ventilated patients, in 10% we observed a mild to moderate low phosphorus value and in 8% of patients a very low phosphorus level. See Figure 1. Conclusions Low blood phosphorus levels contribute to increased severity of COPD and the need for ventilation, significantly increase the duration of hospital stay in the ICU, and increase mortality. Correction of these disorders may increase the survival rate of patients with COPD and may improve prognosis. P370 Investigation and management of hypocalcaemia amongst critically ill patients A Carins1, M Mogk2, ID Welters1 1 Royal Liverpool University Hospital, Liverpool, UK; 2Moredata GmbH, Giessen, Germany Critical Care 2011, 15(Suppl 1):P370 (doi: 10.1186/cc9790) Introduction There is a growing body of evidence linking the presence of hypocalcaemia with greater morbidity and mortality in the critically ill [1]. At present, no national guidelines for the treatment of hypocalcaemia in critically ill patients exist. The purpose of this investigation was to determine the prevalence of hypocalcaemia on admission to critical care, to assess the current diagnosis and treatment regime and to attempt to identify any correlation between severity of illness and the prevalence of hypocalcaemia. Methods Data were collected for all patients admitted to a 13-bed ICU of a tertiary referral centre in September 2010 for at least three consecutive days of their stay. Three patients were subsequently excluded, as their data were incomplete. Serum and ionized calcium levels were reviewed for the presence of hypocalcaemia on admission and evidence of improvement over time. Sepsis was assessed according to the ACCP/SCCM Consensus definitions and APACHE II scores were calculated. Calcium levels were compared using the Wilcoxon test. Results Fifty-three patients, 62% men and 38% women, were included. Ionized calcium levels on admission showed 75.0% of patients to be hypocalcaemic, while serum calcium levels revealed hypocalcaemia in only 72.6%. Supplementation of calcium gluconate based on daily serum calcium levels was found to be an effective treatment for hypocalcaemia and led to a significant increase in both ionized and serum calcium concentrations on day 3 (P = 0.001 and 0.020). On the third day of their stay on the ICU, 43.1% and 34.7% of patients still had low ionized and serum calcium levels. Serum calcium levels generally mirrored ionized calcium levels; however, compared with ionized calcium levels, hypocalcaemia remained undetected in two out of 53 patients (3.8%). There was no correlation between the severity of disease and the occurrence of hypocalcaemia. Similarly, a diagnosis of sepsis, severe sepsis and septic shock was not associated with hypocalcaemia. Conclusions Serum calcium levels tend to underestimate hypocalcaemia compared with ionized calcium. Although the existing treatment strategy was found to be effective in general, the use of ionized calcium levels for detection and treatment of hypocalcaemia might be more effective [2]. References 1. 2.
Zivin JR, et al.: Am J Kidney Dis 2001, 37:689-698. Byrnes MC, et al.: Am J Surgery 2005, 189:310-314.
P371 Seasonal vitamin D variability and its effects on the innate immune response during human endotoxemia MJ Van den Berg1, M Kox1, AJ Van der Ven1, JP Wielders2, P Pickkers1 1 Radboud University Nijmegen Medical Centre, Nijmegen, the Netherlands; 2 Meander Medical Centre, Amesfoort, the Netherlands Critical Care 2011, 15(Suppl 1):P371 (doi: 10.1186/cc9791) Figure 1 (abstract P369). Phosphate level at admission.
Introduction In the past several years, an important immunomodulatory role for vitamin D has been identified. At high latitudes,
Critical Care 2011, Volume 15 Suppl 1 http://ccforum.com/supplements/15/S1
S132
seasonal vitamin D deficiency is common due to due to low UV-B radiation exposure, which is necessary for the synthesis of vitamin D. In this retrospective study we investigated whether vitamin D levels are subject to seasonal variation and whether plasma levels of vitamin D correlate with the extent of the innate immune response during human endotoxemia. Methods Plasma levels of 25-hydroxyvitamin D3 were determined in samples obtained just prior to administration of an intravenous bolus of 2 ng/kg endotoxin (lipopolysaccharide derived from Escherichia coli O:113) in 114 healthy male young volunteers. Plasma levels of the inflammatory cytokines TNFα, IL-6, IL-1RA and IL-10 were determined serially after endotoxin administration. Correlation analysis was performed to investigate the relationship between vitamin D status and inflammatory cytokine levels. Results Vitamin D levels were not subject to seasonal variation in the studied population. Furthermore, vitamin D levels did not correlate with peak cytokine levels or areas under the curve of cytokine time courses. Finally, vitamin-D-deficient subjects (<40 nmol/l) displayed an identical innate immune response compared with vitamin-D-sufficient subjects. Conclusions Vitamin D levels in young healthy males appear to be stable throughout the year. Plasma levels do not correlate with the extent of the innate immune response during human endotoxemia. These findings question the role of vitamin D in modulation of the innate immune response. P372 High bone turnover in critically vitamin-D-deficient patients K Amrein, H Sourij, A Holl, C Schnedl, TR Pieber, H Dobnig Medical University of Graz, Austria Critical Care 2011, 15(Suppl 1):P372 (doi: 10.1186/cc9792) Introduction Vitamin D deficiency, hypocalcemia and acute immobilization negatively affect bone metabolism and are present in the majority of critically ill patients. Although high bone turnover is highly prevalent in the ICU and might compromise long-term outcome, there are currently no data on fracture risk after critical illness. Methods We assessed bone turnover comparing placebo (P) with a cholecalciferol loading dose (VITD) over a 1-week observation period in critically ill medical patients with vitamin D deficiency (25(OH)D ≤20 ng/ml). Markers of bone and mineral metabolism (β-CTx, 0.06 to 0.35 ng/ml, C-terminal telopeptide of type I collagen; OC, osteocalcin, 1.0 to 35.0 ng/ml) were analysed. Analyses were repeated at days 3 and 7 after 540,000 IU cholecalciferol or matched placebo were given enterally. Results Twenty-five critically ill patients with an expected ICU stay of more than 48 hours were included (76% male, age 62 ± 16 years, 84% mechanically ventilated). Bone turnover was accelerated indicating bone loss and further deteriorated during the ICU stay. Calcium levels increased significantly in the vitamin D group only (Table 1), the mean serum 25(OH)D increase in the intervention group was 25 ng/ml. Conclusions Increased bone resorption is frequent in patients in the medical ICU. Intravenous bisphosphonates have been suggested to mitigate bone loss in patients at risk; however, correction of vitamin D Table 1 (abstract P372). Biochemical markers of bone turnover (7-day observation) Day 0
Day 3
Day 7
0.68 0.57
0.89 0.76
0.97* 0.81*
P VITD
13.7 17.9
15.1 19.9
13.9 20.3
Ca ion P VITD
1.02 1.07
1.04 1.13*
1.09 1.17*
β-CTx P VITD OC
*P <0.05.
deficiency might be a prerequisite for optimal efficacy in this vulnerable population. P373 Low whole blood selenium level is associated with higher mortality and longer ICU and hospital stay in patients undergoing elective cardiac surgery G Koszta1, Z Kacska1, K Szatmári1, T Szerafin1, C Mitre2, B Fülesdi1 1 University of Debrecen, Hungary; 2University of Cluj, Romania Critical Care 2011, 15(Suppl 1):P373 (doi: 10.1186/cc9793) Introduction It has been shown that low selenium intake is a risk factor for mortality in several diseases and conditions. In the present study we assessed the association between preoperative selenium levels and outcome parameters in patients undergoing elective cardiac surgical procedures. Methods Whole blood selenium levels were assessed in preoperatively sampled blood in 197 patients. Selenium levels were dichotomized according to the national reference values into low (< 100 μg/l = LS group) and normal (>100 μg/l = NS group). Preoperative risk factors and postoperative outcome parameters (such as mortality, ICU and hospital length of stay, postoperative complications) were compared among the two selenium groups. Results The mean age of the patients in the LS group was 67.9 ± 8.9 years, significantly higher than the NS group’s mean age of 62.05 ± 9.4 years (P <0.01). The mean EuroSCORE was 0.0560 ± 0.069 in the LS group, while it was 0.1071 ± 0.1192 in the NS group (P <0.01). The relative risk of mortality in the LS group was 5.01. The ICU length of stay was longer in the LS group (4.55 ± 7.1 days) compared with the NS group (2.54 ± 4.5 days, P <0.01). Similar to this, the hospital length of stay was also longer in the LS group (12.46 ± 10.4 days) than in the NS group (8.44 ± 4.81 days, P <0.01). LS patients were more frequently presented in the postoperative phase with low cardiac output syndrome, atrial fibrillation, postoperative renal failure and postoperative confusion. Conclusions We conclude that low selenium levels are associated with higher mortality and longer hospital stay in our Central-European cohort of cardiac surgical patients. Prospective randomized studies performed on homogeneous patient groups are encouraged to prove whether the postoperative outcome of the patients may be improved by preoperative normalisation of selenium levels. P374 Effects of high doses of selenium on the antioxidant status after liver resection O Obukhova, S Kashiya, E Gorojanskaya, J Chekini, S Sviridova N.N.Blokhin Russian Cancer Research Center, Moscow, Russia Critical Care 2011, 15(Suppl 1):P374 (doi: 10.1186/cc9794) Introduction Selenium (Se) levels in serum for patients with colorectal liver metastasis are significantly lower than normal. The use of standard doses of Se has no effect on serum concentrations of Se or the antioxidant status (AS) indicators. It is assumed that the use of high doses of Se for patients undergoing extensive liver resection can improve their condition by enhancing antioxidant protection. The objective of this study was therefore to evaluate the effect of high doses of selenium on AS indicators, biochemical markers of hepatic failure and treatment results. Methods Forty patients (M:F = 18:22, mean age 56) who were due to have a liver resection for metastatic colorectal carcinoma were recruited and were randomized into two groups. Patients of group 1 (G1, n = 20) received standard perioperative therapy. Patients of group 2 (G2, n = 20) additionally received sodium selenite according to the protocol: 2 mg on the first postoperative day, 1 mg in the next 4 days. The concentration of Se in serum, biochemical parameters (total bilirubin, AST, ALT), AS (toxic metabolites of nitrogen oxide (NOx), superoxide dismutase (SOD) and malondialdehyde (MDA)) and clinical data were assessed before surgery and on the fifth day after surgery. The significance of differences was assessed by Student’s t test and the chi-square test. Results There were no differences in the concentrations of biochemical markers of hepatic failure, duration of hospitalization, and 28-day
Critical Care 2011, Volume 15 Suppl 1 http://ccforum.com/supplements/15/S1
S133
survival after surgery. Before surgery Se levels were low (75.8 ± 8.7 vs. 72.8 ± 3.9). The NOx, MDA and SOD levels were elevated (respectively 35.1 ± 1.2 vs. 35.2 ± 1.8; 6.4 ± 0.4 vs. 6.6 ± 0.38; 106 ± 8.7 vs. 107 ± 8.8). After Se supplementation, Se levels were significantly higher in G2 compared with G1 (90.8 ± 7.42 vs. 75.7 ± 9.91, P <0.05). On the fifth day the NOx, MDA and SOD levels decreased in G2 compared with G1 (respectively 29.5 ± 1.2 vs. 39.3 ± 2.2; 6.59 ± 0.9 vs. 9.8 ± 1.2; 84 ± 10.1 vs. 123 ± 7.7, P <0.05). In G2, postoperative encephalopathy was significantly less (P = 0.013). Conclusions Even in the early postoperative period, administration of high doses of sodium selenite in patients with colorectal liver metastasis who underwent extensive liver resection helps to improve AS. However, a small number of observations does not allow one to assess accurately the clinical effect of high doses of Se for these patients. P375 Nutritional support in severe traumatic brain injury MN Cote, F Lauzier, V Bibeau, P Labbe, AF Turgeon CHA-Hôpital de l’Enfant-Jésus, Université Laval, Quebec, Canada Critical Care 2011, 15(Suppl 1):P375 (doi: 10.1186/cc9795) Introduction Clinical guidelines recommend full caloric replacement within 7 days after severe traumatic brain injury (TBI) since it may improve clinical outcomes. However, enteral feeding is often poorly tolerated in this population. We hypothesized that most patients with severe TBI do not receive adequate caloric and protein intake. Methods We performed a retrospective cohort study of randomly selected patients with severe TBI (GCS ≤8) identified with ICD-10 codes and admitted to a 24-bed ICU of a Canadian level 1 trauma center between January 2005 and December 2006. We excluded patients <16 years old, with penetrating TBI or mechanically ventilated for <48 hours. Using a standardized pretested case report form, we collected daily kilocalories and proteins (ordered and received), sedation, use of prokinetic drugs and post-pyloric access. The primary endpoint was achievement of ≥90% of caloric and protein requirement within 7 days. Secondary endpoints were factors associated with achievement of nutritional goals and with gastric intolerance (one episode of residuals ≥250 ml/4 hours). A sample size of 100 patients was required to obtain a margin of error of 9%. Student t and chi-square tests were used to compare continuous data and proportions. We obtained ethics approval. Results Among the 109 patients included, 82.6% were men (mean age 40.5 ± 20.5 years, GCS 3.7 ± 1.3 and BMI 25.3 ± 5.1 kg/m2). Patients had 1,204 potential feeding days. Ninety-six patients (88.1%) were fed by day 3. Mean caloric and protein orders were 32.6 ± 4.8 kcal/kg and 1.4 ± 0.2 g/kg, respectively. Two patients never received enteral nutrition. Nutrition was started at a mean rate of 32.6 ± 9.3% of the nutritional goal using the stomach as the initial access in 97.2%. The achievement of caloric, protein and both requirements was successful in 48 (44.0%, 95% CI = 34.7 to 53.4%), 64 (58.7%, 95% CI = 49.5 to 68.0%) and 42 (38.5, 95% CI = 29.4 to 47.7%) patients during the first week. The most associated factor with unsuccessful nutrition was gastric intolerance (RR = 1.40. 95% CI = 1.11 to 1.88, P <0.01), which occurred in 49.5% patients. Factors associated with gastric intolerance were young age (P <0.001), increased intracranial pressure (P <0.001), high opioid doses (P = 0.004) and nonuse of prokinetic drugs (P = 0.05). Conclusions Most patients with severe TBI did not achieve nutritional goals within 7 days, partially due to high gastric residuals. Although we identified factors associated high gastric residuals, improving feeding tolerance is unlikely to be the only intervention to significantly improve nutritional intakes.
P376 Energy deficit and hospital length of stay can be reduced by quality management of nutrition therapy: the ICU dietitian is essential L Soguel1, JP Revelly2, C Longchamp2, MD Schaller2, MM Berger2 1 HES-SO, Geneva, Switzerland; 2CHUV, Lausanne, Switzerland Critical Care 2011, 15(Suppl 1):P376 (doi: 10.1186/cc9796) Introduction Several studies show that nutrition delivery is insufficient, resulting in large energy deficits during the ICU stay [1]: the problem persists despite the diffusion of guidelines. The barriers to guideline implementation are known [2]. This study aimed at measuring the clinical impact of a two-step interdisciplinary quality nutrition program incorporating knowledge of the barriers. Methods A prospective interventional study over three periods (A: baseline, B and C: intervention periods) in the mixed ICU of a university teaching hospital. Inclusion: patients requiring >72 hours of ICU. Intervention was a two-step quality program after baseline analysis: first, implementation of feeding guidelines; and second, additional presence of an ICU dietitian. Variables: anthropometry, severity scores, energy delivery and balances (daily, day 7, discharge), feeding route, length of stay, and mortality. Results In total, 604 admissions and 6,073 days were analyzed. Patients in period A were less sick (lower SAPS and less rapidly fatal McCabe scores) than those of periods B and C. Energy delivery and balance increased gradually: impact was particularly marked in the cumulated energy balance on day 7 (P <0.001). The feeding technique changed: use of EN increased from A to B (stable in C); combined and PN increased progressively. Oral intakes were uniformly low (305 kcal/day). Hospital mortality paralleled severity in periods B and C. The hospital stay was shorter in period C (P = 0.048). See Table 1. Conclusions A bottom-up protocol improved nutritional support. The ICU dietitian further improved the process (early introduction, feeding route), achieving better early energy balance. References 1.
2.
Villet S, Chioléro RL, Bollmann MD, et al.: Negative impact of hypocaloric feeding and energy balance on clinical outcome in ICU patients. Clin Nutr 2005, 24:502-509. Jones NE, Suurdt J, Ouelette-Kuntz H, Heyland DK: Implementation of the canadian clinical practice guidelines for nutrition support: a multiple case study of barriers and enablers. Nutr Clin Pract 2007, 22:449-457.
P377 Enteral feed absorption during therapeutic hypothermia following out-of-hospital cardiac arrest C Smith, J Nolan, M Williams Royal United Hospital, Bath, UK Critical Care 2011, 15(Suppl 1):P377 (doi: 10.1186/cc9797) Introduction Enteral feeding is the preferred nutrition method in critically ill patients, with early administration leading to improved outcome [1]. There are no studies documenting the feasibility of enteral feeding during therapeutic hypothermia following cardiac arrest and, in our experience, many intensive care clinicians withhold enteral feed during the hypothermic period. Methods Data were collected retrospectively from patients admitted to the Royal United Hospital ICU for therapeutic hypothermia following out-of-hospital cardiac arrest between 2002 and 2008. We recorded the total enteral feed input, total volume of gastric aspirate, total volume of gastric aspirate that was discarded and the number of vomiting episodes for 72 hours. The first 24 hours was the period of
Table 1 (abstract P376) Period A: baseline
Period B: new protocol
Period C: protocol + dietitian
P value
Cumulated energy balance day 7
–5,870 ± 3,314
–5,307 ± 3,131
–3,946 ± 3,682*
<0.001
Discharge energy balance
–6,972 ± 4,994
–5,996 ± 3,711*
–5,380 ± 4,998*
0.002
14.8 ± 12.8
17.1 ± 12.7*
17.8 ± 12.6*
<0.0001
Energy delivery (kcal/kg/day) * Significant post hoc difference.
Critical Care 2011, Volume 15 Suppl 1 http://ccforum.com/supplements/15/S1
S134
cooling, the second 24 hours included 14 hours of re-warming and 10 hours of normothermia, and the third 24 hours was normothermia. Feed balance was calculated by subtracting the volume of discarded aspirate from the volume of enteral input. Results Thirty-two patients were included in the study. The median feed balance, percentage of patients with a positive feed balance, number of vomiting episodes and percentage of patients vomiting for each day is given in Table 1. Table 1 (abstract P377). Median feed balance (MFB), positive feed balance (PFB) and vomiting episodes Day
MFB (ml) (IQR)
PFB (n (%))
Vomiting (n (%))
1
265 (53 to 788)
25 (78.1)
8 (9.4)
2
400 (69 to 1,229)
24 (82.6)
6 (10.3)
3
572 (122 to 1,131)
22 (84.6)
6 (7.7)
Conclusions Absorption of enteral feed increased with increasing core temperature. Even during hypothermia, the median feed balance was positive by 265 ml and 78% of patients had a positive feed balance and 9.4% of patients experienced vomiting. This implies that at a core temperature of 33°C there is sufficient gastrointestinal function to enable some enteral feed to be absorbed in most patients without a significant increase in vomiting. This suggests that it may be appropriate to feed patients undergoing therapeutic hypothermia following cardiac arrest. Reference 1.
Heyland DK, et al.: Impaired gastric emptying in mechanically ventilated, critically ill patients. Intensive Care Med 1996, 22:1339-1344.
P378 Enteral nutrition in mechanically ventilated patients with cervical spinal cord injury S OConnor1, Y Yau1, R Yandell1, K Lange2, J Alexander1, B Freeman1, M Chapman1 1 Royal Adelaide Hospital, Adelaide, South Australia, Australia; 2University of Adelaide, Australia Critical Care 2011, 15(Suppl 1):P378 (doi: 10.1186/cc9798) Introduction The aim of this study was to assess the adequacy of nutrition provision to mechanically ventilated patients in the acute phase after cervical cord injury. High spinal cord injury is associated with reduced gastric emptying due to excessive sympathetic activity from the isolated thoracolumbar cord [1], which is believed to compromise nasogastric delivery of nutrition and worsen clinical outcomes. However, the success of feeding early after high spinal cord injury has not been formally evaluated. Methods A retrospective cohort study. Success of enteral feeding and associated factors were reviewed for 28 days (or until ICU discharge) in all patients mechanically ventilated for at least 48 hours with cervical cord injury in a mixed, level 3 ICU, over a 2-year period. Adequacy of nutrition was defined as net calories delivered (including propofol) as a percentage of goal calories prescribed. Energy requirements were determined using the Schofield equation or a weight-based method (25 kcal/actual body weight). Data are presented as median and range. Results Seventeen patients were recruited (14 male, aged 37 years (18 to 78), BMI 27 (23 to 35), APACHE II 14 (8 to 26), ASIA score A – 13, B – 4, ICU length of stay (LOS) 40 days (14 to 78), hospital LOS 82 days (34 to 219), of which two died. Six patients were discharged prior to day 28. Goal calories were 2,140/day (1,867 to 3,400). Patients commenced enteral feeding 44 hours (1 to 107) after ICU admission and received a mean 73% (SD = 19%) of nutritional goals over the 28-day study period. Energy delivery by day 4 reached 88% of goals. There was a significant relationship (r = 0.564; P = 0.029) between feed volume and hospital LOS. Feeding did not influence any other clinical outcomes including ICU LOS and mortality. Eleven (65%) patients received prokinetics for 7 days (2 to 20). No patients received TPN or post-pyloric feeding. Conclusions Despite a high proportion of patients requiring prokinetics, most received adequate nasogastric nutrition during their
stay in the ICU. Anecdotal evidence of weight loss and wasting after cervical spinal cord injury suggests that there are complex nutritional requirements in this group of patients and will form the basis for further studies. Reference 1.
Lin VW, et al., editors. Spinal Cord Medicine: Principles and Practice. New York: Demos Medical Publishing; 2003.
P379 Nasogastric feeding intolerance in the critically ill S OConnor1, J Rivett1, A Poole1, A Deane1, K Lange2, R Yandell1, Q Nguyen1, R Fraser3, M Chapman1 1 Royal Adelaide Hospital, Adelaide, South Australia, Australia; 2University of Adelaide, South Australia, Australia; 3Repatriation Hospital, Adelaide, Australia Critical Care 2011, 15(Suppl 1):P379 (doi: 10.1186/cc9799) Introduction The aims of this study were to determine when patients develop feed intolerance, the prevalence of feed intolerance in subgroups, and other factors that influence feed intolerance. Nasogastric delivery of nutrition commonly fails in critically ill patients. However, studies to date have been underpowered to formally define the determinants of feed intolerance. Methods A prospective observational study. Data were collected for 14 days (or until ICU discharge/or death) after commencement of gastric feeding in consecutive, ventilated patients. Gastric aspirates were performed 6 hourly. Feed intolerance was defined as ≥1 gastric aspirate(s) ≥250 ml. Data are presented as median (range). The association between feed intolerance and LOS was calculated using the Mann–Whitney U test. The ANCOVA test was used to test for a difference between groups in LOS adjusting for covariates. Results In 214 patients (138 male:76 female, 56 (18 to 90) years, APACHE II 21 (5 to 46), ICU LOS 9 (1 to 94) days, hospital LOS 29 (3 to 177) days), feed intolerance occurred in 78 (37%). The first occurrence of feed intolerance was within 5 days of commencing feeding (97%). Patients with trauma (60%), traumatic brain injury (57%) and sepsis (42%) had higher incidence of intolerance than the total population. The neurological group had significantly lower incidence of intolerance (17%; P = 0.02). Prokinetics were administered to 29%; duration 1 (1 to 7) day. Feed intolerance was not associated with ICU or hospital mortality (ICU; intolerant 48% vs. tolerant 52% died, P = 0.08: hospital; intolerant 40% vs. tolerant 60% died, P = 0.31), but was associated with longer ICU and hospital LOS (ICU; intolerant 13 (1 to 94) days vs. tolerant 7 (1 to 51) days, P ≤0.001: hospital; intolerant 32 (10 to 120) days vs. tolerant 26 (3 to 177) days, P = 0.02). There was no difference in APACHE II score between intolerant and tolerant groups (intolerant = 23 (7 to 46), tolerant = 21 (5 to 35), P = NS). Conclusions The majority of feed intolerance occurred early in the patient’s illness. While mortality was unaffected, ICU and hospital LOS were longer in feed-intolerant patients that were not explained by severity of illness on admission. Further research is needed to determine whether increasing calorie delivery improves clinical outcomes in feedintolerant patients. P380 Enteral nutrition products in ICUs: data from NutritionDay B Mora1, M Mouhieddine1, P Singer2, S Ruiz-Santana3, M Hiesmayr1 1 Medical University of Vienna, Austria; 2Rabin Medical Center, Tel Aviv University, Tel Aviv, Israel; 3Hospital Universitario de Gran Canaria Dr Negrín, Las Palmas de Gran Canaria, Spain Critical Care 2011, 15(Suppl 1):P380 (doi: 10.1186/cc9800) Introduction Pharmaceutical companies have introduced to the market many products for enteral nutrition. The different products offer a wide variety of compositions or have specific macronutrients or micronutrients added and are marketed for specific patient groups or conditions. Thus an individualised therapy may be associated with the use of a wide variety of products. For practical reasons, easier stock management, economic reasons, increased experience and error prevention, a standardised nutritional care would be more common practice. It is unknown to which extent these two options are applied in
Critical Care 2011, Volume 15 Suppl 1 http://ccforum.com/supplements/15/S1
Figure 1 (abstract P380). Relationship products/ICU.
Figure 2 (abstract P380). Relationship patients/ICU.
clinical practice. We have investigated the uses and behaviours about nutritional products in different ICUs from the data of NutritionDay (ND). Methods The ICU ND is an ECCRN-supported cross-sectional audit in 10 languages. We have analysed from the 4-year database which enteral products were received by patients enrolled from 2007 to 2010 in the ND study. The aim of our study was to find which and how many different enteral products are given in each ICU. Results Two hundred different enteral products have been used in 237 ICUs. Nearly 50% of ICUs used one or two products (Figure 1). Most ICUs recruited 10 to 30 patients during the ICU ND audits (Figure 2). Conclusions There is a very huge offer of enteral nutrition products but it is very common that in most ICUs (almost 70%) only one to three different products have been given. Individualisation of nutrition therapy in terms of diet composition is not common practice. P381 Protein losses and nitrogen balance during continuous renal replacement therapy H Hayami, O Yamaguchi, M Shimosaka, H Fujimoto, S Tsuboi, M Satou Yokohama City University Medical Center, Yokohama, Japan Critical Care 2011, 15(Suppl 1):P381 (doi: 10.1186/cc9801) Introduction Acute renal failure (ARF) is a highly catabolic state and mean normalized catabolic rates of 1.5 g/kg/day protein have been reported. In hemodynamically unstable ARF patients, continuous
S135
renal replacement therapy (CRRT) has become a popular treatment modality, but may have the disadvantage of producing substantial protein losses, reported to be as high as 1.3 g/l. In the USA and Europe, CRRT outputs reach 50 l/day, and this value would amount to protein losses of up to 65 g/day. ASPEN and ESPEN guidelines recommend that these patients should receive increased protein, up to a maximum of 2.5 g/kg/day, and that protein should not be restricted in patients with ARF as a means to avoid or delay initiation of dialysis therapy. But most previous studies were conducted in the era when energy requirements were adjusted by stress factors, and without intense glucose control therapy. So the optimal amount of protein supplementation in ARF patients in recent nutritional control is still unknown. In Japan, due to the limitation of doses of dialysate by health insurance it remains only 15 l/day, and protein losses are expected to be smaller than western countries. We measured the amount of nitrogen concentration in dialysate/ultrafiltrate samples, and calculated the nitrogen balance in such patients. Methods We analysed eight critically ill patients requiring CRRT in the ICU in a university hospital retrospectively. Patients received NPC 25 kcal/ kg/day increasing to the target over the next 2 to 3 days, preferably by enteral (postpyloric) route if possible. The dose of protein intake differed mainly due to BUN concentration (70 mg/dl was acceptable). Results Of eight patients, six died (D) and two survived (S). Days of CRRT treatment were 11.7 ± 5.2 (4 to 20) in group D versus 9.0 ± 5.7 (5 to 13) in group S, and 24 hours creatinine clearance of CRRT was 9.6 ± 2.9 versus 10.5 ± 3.6 ml/minute/m2, dialysate/ultrafiltrate nitrogen loss was 6.4 ± 3.3 versus 8.5 ± 4.1 g/day, and nitrogen balance was –0.08 ± 0.48 versus –0.034 ± 0.44 g/kg/day (–5.7 ± 6.6 vs. 2.6 ± 6.1g/day), retrospectively. The estimated amount of protein loss was expected to be almost 40 g/day. Conclusions Nitrogen losses in dialysate/ultrafiltrate samples were larger than previously reported even in a smaller dialysate/ultrafiltrate dose. In ICU patients with ARF, protein requirements can differ and have to be assessed individually. Large, prospective, randomized, controlled studies are needed to optimize the dosing of protein in critically ill patients with ARF who are treated with CRRT and the effects on patient morbidity and mortality. P382 Impact of cumulative calorie and protein deficits in critically ill patients R Dey, M Bhattacharyya, S Todi AMRI Hospitals, Kolkata, India Critical Care 2011, 15(Suppl 1):P382 (doi: 10.1186/cc9802) Introduction This study aims to assess the outcome of cumulative protein and calorie deficits in critically ill patients. Methods A prospective observational study conducted in a mixed medical–surgical ICU in a tertiary care hospital in India. Patients receiving nutritional support for 2 days were included. Requirements of calories and protein were fixed as per the ASPEN guidelines. Calorie and protein deficits were calculated daily by subtraction of delivered from prescribed calories and protein in each patient. This deficit (<80% of prescribed were given to the patient) was correlated with outcome and complications. Results A total of 768 patients of age 61 (SD ±17.67) were analyzed, of which 66.54% were male. In total, 530 (69%) were calorie deficient and 696 (90%) were protein deficient during the whole ICU stay. The correlation coefficient of ICU length of stay (LOS) was –0.443 and –0.465, and of days on mechanical ventilation of alive patients was –0.338 and –0.392 for calorie and protein deficit, respectively (P <0.001). Infectious complications were also significantly correlated (–0.346 for calorie deficit, –0.298 for proteins, P <0.001). The mean calorie deficit of the patients discharged alive from the ICU was –2,135.62 ± 1,918.63, which was less compared with patients who expired (–2,564.44 ± 2,173.45 (P = 0.027)). This was also seen in hospital outcome. The mean calorie deficit of patients discharged from hospital was –2,039.36 ± 1,888.82, which was less than the patients who expired after discharge from the ICU (–2,603.99 ± 2,126.53 (P = 0.002)). See Tables 1 and 2 overleaf. Conclusions The cumulative nutrient deficits (calorie and protein) were correlated with increasing number of complications in critically ill patients.
Critical Care 2011, Volume 15 Suppl 1 http://ccforum.com/supplements/15/S1
S136
Table 1 (abstract P382). Correlation of complications with calorie and protein deficits Variable
Correlation with calorie deficit (r)a (n = 530)
Correlation with protein deficit (r)a (n = 696)
P value
LOS (ICU)
–0.443
–0.465
<0.001
Days on mechanical ventilationb
–0.338
–0.392
<0.001
Number of infectious complications
–0.346
–0.298
<0.001
Cumulative calorie deficit
Cumulative protein deficit
P value
Alive in ICU
–2,135.62 ± 1,918.63
–258.48 ± 205.58
0.027
Expired in ICU
–2,564.44 ± 2,173.45
–274.44 ± 241.33
0.392
Discharged alive from ICU
–2,039.36 ± 1,888.82
–257.27 ± 208.33
0.002
Expired in hospital
–2,603.99 ± 2,126.53
–271.67 ± 226.85
0.395
a
Correlation coefficient. bMechanical ventilation days only in alive patients.
Table 2 (abstract P382). ICU and hospital outcome related to cumulative calorie and protein deficits
Data presented as mean ± SD.
P383 Lipid-enriched and protein-enriched enteral nutrition limits inflammation in a human endotoxemia model M Kox1, T Lubbers2, JJ De Haan2, JW Greve3, JC Pompe1, BP Ramakers1, P Pickkers1, WA Buurman2 1 Radboud University Nijmegen Medical Centre, Nijmegen, the Netherlands; 2 Maastricht University Medical Centre, Maastricht, the Netherlands; 3Atrium Medical Center, Heerlen, the Netherlands Critical Care 2011, 15(Suppl 1):P383 (doi: 10.1186/cc9803) Introduction Enteral administration of lipid-enriched nutrition was previously shown to attenuate inflammation and organ damage via a cholecystokinin-mediated vagovagal reflex in animal studies. The current proof-of-principle study investigates the immunomodulatory potential of enteral lipid-enriched and protein-enriched nutrition during experimental human endotoxemia. Methods After an overnight fast, 18 healthy male subjects received an intravenous bolus of Escherichia coli lipopolysaccharide (LPS; 2 ng/kg). Subjects in the fasted group (n = 6) were deprived of food throughout the study, while subjects in the intervention groups were fed either enriched (n = 6) or isocaloric control nutrition (n = 6) via a
Figure 1 (abstract P383). Plasma cytokine levels in the three experimental groups.
nasojejunal tube, starting 1 hour prior to LPS administration until 6 hours afterwards. Results LPS administration resulted in a marked inflammatory response. Continuous postpyloric administration of nutrition increased plasma cholecystokinin levels. Enriched nutrition attenuated circulating levels of the proinflammatory cytokines TNFα and IL-6 and the IL-1 receptor antagonist compared with control nutrition (all: P <0.01) and fasted subjects (all: P <0.05). Additionally, enriched nutrition augmented the anti-inflammatory response, reflected by increased IL-10 release compared with fasted subjects (P <0.0001). See Figure 1. Conclusions The current study establishes the anti-inflammatory potential of enriched nutrition in humans. The immediate antiinflammatory effect of enriched nutrition suggests that the beneficial effects are mediated via a cholecystokinin-dependent vagovagal reflex. Enteral administration of enriched nutrition is a promising intervention to modulate the immune response in the early course of systemic inflammation. P384 Inflammation causes arginine to become an essential amino acid in critically ill children CT De Betue1, DA Van Waardenburg2, KF Joosten1, NE Deutz3 1 Erasmus MC, Rotterdam, the Netherlands; 2MUMC, Maastricht, the Netherlands; 3UAMS, Little Rock, AR, USA Critical Care 2011, 15(Suppl 1):P384 (doi: 10.1186/cc9804) Introduction In critically ill children we previously found decreased plasma levels of arginine (Arg) and its precursor citrulline (Cit), with a strong inverse relation to C-reactive protein (CRP) [1]. Cit is the sole precursor of Arg de novo synthesis in the body. We hypothesized that Arg becomes an essential amino acid, because Cit availability is reduced during inflammation. Therefore we studied Cit and Arg production, using stable isotope technology, in relation to the severity of inflammation in critically ill children. Methods Twenty-two critically ill children (age 0.89 ± 0.04 years) with different levels of inflammation were studied on day 3 post-admission; viral bronchiolitis (group 1, n = 9), infectious disease without shock (group 2, n = 6) and septic shock (group 3, n = 7). A 2-hour stable isotope tracer protocol was performed after at least 4 hours fasting to determine Arg and Cit kinetics. Data presented as mean ± SE. Statistics by ANOVA, Spearman’s correlation. Results See Figure 1 for results per group. CRP was significantly different between groups. Cit production was significantly lower in the group with highest inflammation compared with the group with lowest inflammation. Cit production was inversely correlated with plasma CRP (r = –0.58, P <0.001). Conclusions Our data show that with increasing rate of inflammation the production of Arg’s precursor Cit is severely depressed. Previously we found that de novo Arg production is almost equal to Cit production
Critical Care 2011, Volume 15 Suppl 1 http://ccforum.com/supplements/15/S1
S137
Figure 1 (abstract P384). CRP, Cit and Arg production. CRP, P <0.01 between all groups (a, b, c); d, P <0.05.
[2]. As a consequence, Arg availability becomes fully dependent on tissue protein breakdown and nutrition. Inflammation causes Arg to become an essential amino acid in critically ill children. References 1. 2.
Van Waardenburg et al.: Am J Clin Nutr 2007, 86:1438-1444. Luiking et al.: Am J Clin Nutr 2009, 89:142-152.
P385 Comparison of the effects of intravenous, enteral and enteral + intravenous supply of glutamine on malnutrition in sepsis G Koksal, G Karaören, H Akarcay, E Karabulut, Y Tunali, S Vehid, H Oz I.U Cerrahpasa Medical Faculty, Istanbul, Turkey Critical Care 2011, 15(Suppl 1):P385 (doi: 10.1186/cc9805) Introduction Our aim was to compare the effects of intravenous, enteral and intravenous + enteral supplemented glutamine on prediction of positive feeding parameters (transferrin, nitrogen balance and creatine/height index) for malnutrition in septic patients. Methods This was a prospective, randomized, controlled, single-blind, clinical study. Forty septic patients with malnutrition were randomly divided into four groups (n = 10 each group). All patients were receiving enteral access, and had a clinical diagnosis of either severe sepsis or septic shock. All patients received enteral nutrition during 15 days. Enteral feeding was delivered at a constant rate to achieve energy expenditure (Harris–Benedict equation). Blood and urine samples were obtained for transferrin, nitrogen balance and creatine/height index at least at baseline and on study days 7 and 15. Group 1: received 30 g/day intravenous glutamine, Group 2: received 30 g/day enteral glutamine, Group 3: received 15 g/day enteral + 15 g/day intravenous glutamine, Group 4: control group, without glutamine only enteral feeding. Data were compared by the Tukey HSD test. Results Nitrogen balance levels were not significantly different between groups on the first 7 and 15 days. The transferrin level was higher in Group 2 than Group 4 on the first 7 days (P <0.001). Transferrin levels were not significantly different between the other groups. Transferrin levels were higher in Group 3 than Group 2 (P <0.05) and Group 4 (P <0.001) in 15 days. Creatine/height index was higher in Group 3 than Group 4 (P <0.05) in 15 days. Conclusions Enteral plus intravenous supplemented glutamine has more beneficial effects on transferrin and creatine/height index than only enteral or intravenous supply of glutamine. Also, we observed that enteral feeding of supplemented glutamine has beneficial effects on transferrin, nitrogen balance and creatine/height index in Groups 1, 2 and 3 when compared with Group 4. Reference 1.
Novak F, Heyland DK, et al.: Glutamine supplementation in serious illness: a systematic review of the evidence. Crit Care Med 2002, 30:2022-2029.
P386 Insufficient activation of autophagy allows accumulation of cellular damage and may contribute to sustained organ failure in prolonged critically ill patients J Gunst1, S Derde1, I Derese1, M Boussemaere1, F Güiza1, W Martinet2, JP Timmermans2, A D’Hoore1, PJ Wouters1, G Van den Berghe1, I Vanhorebeek1 1 KULeuven, Leuven, Belgium; 2Universiteit Antwerpen, Antwerp, Belgium Critical Care 2011, 15(Suppl 1):P386 (doi: 10.1186/cc9806) Introduction Prolonged critically ill patients face a high risk of death, which is most often due to nonresolving multiple organ failure and muscle weakness. Increased oxidative stress, accumulation of damaged proteins and mitochondrial dysfunction contribute to cellular and organ dysfunction, and persistence of these abnormalities may trigger additional damage. Autophagy is the only degradation pathway able to remove toxic protein aggregates and damaged mitochondria. Feeding and insulin are two powerful suppressors of autophagy. We therefore hypothesized that in fed, prolonged critically ill patients receiving insulin, the required activation of autophagy to clear cellular damage could be impaired. Methods We studied autophagy in liver and skeletal muscle biopsies from fed, prolonged critically ill patients, in whom hyperglycemia was tolerated or treated with insulin in the context of two randomized, clinical studies on intensive insulin therapy [1,2], as compared with biopsies from matched controls. We quantified (ultra)structural abnormalities and hepatic and skeletal muscle protein levels of key players in autophagy. Results Morphologically, both liver and muscle revealed an autophagydeficiency phenotype. Proteins involved in initiation and elongation steps of autophagy were induced 1.3-fold to 6.5-fold by critical illness (P ≤0.01), but mature autophagic vacuole formation was 62% impaired (P = 0.05) and proteins normally degraded by autophagy accumulated up to 97-fold (P ≤0.03). Markers of mitophagy (selective autophagy of mitochondria) were unaltered or downregulated (P = 0.05). Although insulin preserved hepatocytic mitochondrial integrity (P = 0.05), it further reduced the number of autophagic vacuoles by 80% (P = 0.05). Conclusions Activation of autophagy appeared insufficient in liver and skeletal muscle biopsies from prolonged critically ill patients and may be further suppressed by insulin treatment. Incomplete clearance of cellular damage inflicted by illness and aggravated by hyperglycemia could explain lack of recovery from organ failure in critically ill patients. These data open perspectives for therapies that activate autophagy during critical illness. References 1. 2.
Van den Berghe G, et al.: N Engl J Med 2001, 345:1359-1367. Van den Berghe G, et al.: N Engl J Med 2006, 354:449-461.
Critical Care 2011, Volume 15 Suppl 1 http://ccforum.com/supplements/15/S1
P387 Glucose absorption following gastric and small intestinal nutrient administration in the critically ill M Chapman, A Deane, A Di Bartolemeo, A Zaknic, M Summers, N Nguyen, L Besanko, C Burgstad, M Horowitz Royal Adelaide Hospital, Adelaide, Australia Critical Care 2011, 15(Suppl 1):P387 (doi: 10.1186/cc9807) Introduction Glucose absorption from the stomach is abnormal related to slow gastric emptying and impaired in critically ill patients (CIP) with normal gastric emptying, suggesting that small intestinal (SI) factors may also be responsible. Small intestinal absorption of nutrient has not been formally quantified in this group. The aim was to quantify and compare glucose absorption following gastric and SI administration in CIP and healthy volunteers (HV). Methods Data from studies where glucose absorption had been measured were analysed. Sixty-six CIP (age: 51 ± 2, APACHE II: 17 ± 1) and 50 HV (age: 43 ± 3) were administered 100 ml Ensure (liquid nutrient 1.06 kcal/ml), labelled with 3 g 3-O-methylglucose (3-OMG) to evaluate glucose absorption. Nutrient was administered via nasogastric (n = 44; CIP = 24; HV = 20) or SI (n = 72; CIP = 42; HV = 30) catheters. Plasma 3-OMG concentrations were measured at intervals for 240 minutes; peak, time to peak and area under the concentration curve (AUC) were calculated. Feed-intolerant patients were defined by gastric residual volume >250 ml in the 24 hours prior to study or requiring prokinetics for pre-existing feed intolerance. Data are mean ± SEM or median (range) and were analysed using nonpaired Student’s t tests. Results Glucose absorption was markedly reduced in patients following both intragastric (AUC 0 to 240: CIP: 49 ± 7 vs. HV: 80 ± 4 mmol/l/ minute; P <0.001; peak concentration CIP: 0.32 (0.004 to 0.804) vs. HV: 0.51 (0.343 to 0.679) mmol/l; P <0.001; time to peak CIP: 140 (30 to 240) vs. HV: 74 (45 to 120) minutes; P <0.001) and SI nutrient (AUC 0 to 240: CIP: 57 ± 4 vs. HV: 72 ± 4 mmol/l/minute; P = 0.008; peak concentration CIP: 0.37 (0.01 to 0.88) vs. HV: 0.47 (0.28 to 0.88) mmol/l; P = 0.02; time to peak CIP: 87 (15 to 240) vs. HV: 54 (15 to 120) min; P = 0.01). Gastric glucose absorption was delayed when compared with SI administration in CIP (time to peak; gastric: 140 (30 to 240) vs. SI: 86 (15 to 240) minutes; P = 0.005); however, there was no difference in overall glucose absorption when comparing gastric and SI administration in both HV and CIP. Feed-intolerant patients had reduced SI glucose absorption (AUC 240: intolerant 44 (2 to 98) vs. tolerant 75 (15 to 101) mmol/l; P = 0.01). Conclusions Glucose absorption is substantially impaired in the CIP even when delivered directly into the SI. This suggests mechanisms in the SI contribute to nutrient malabsorption. Delivery of nutrient directly into the SI (particularly in those CIP who are feed intolerant) may not result in improved nutrient absorption. P388 Enhanced insulin sensitivity variability in the first 3 days of ICU stay: implications for tight glycemic control JG Chase1, AJ Le Compte1, S Penning2, KT Moorhead2, P Massion3, JC Preiser4, CG Pretty1, GM Shaw5, T Desaive2 1 University of Canterbury, Christchurch, New Zealand; 2University of Liege, Belgium; 3CHU de Liege, Belgium; 4Erasme University Hospital, Brussels, Belgium; 5Christchurch Hospital, Christchurch, New Zealand Critical Care 2011, 15(Suppl 1):P388 (doi: 10.1186/cc9808) Introduction Effective tight glycemic control (TGC) can improve outcomes, particularly in cardiovascular surgery, but is difficult to achieve. Variability in insulin sensitivity/resistance resulting from the level and evolution of stress response, particularly early in a patient’s stay, can lead to hyperglycemia and variability, which are associated with mortality. This study quantifies the daily evolution of the variability of insulin sensitivity for cardiovascular surgical and all other ICU patients. Methods Retrospective analysis of SPRINT TGC study data. Modelbased insulin sensitivity (SI) was identified hourly from data. Hourto-hour percentage changes in SI were assessed for cardiovascular surgical (CVS) patients (n = 76) and all other, noncardiovascular surgery (Non-CVS) patients (n = 317). Results are compared for days 1, 2, 3
S138
and days 4 onward. Cumulative distribution functions (CDFs), median values, and interquartile points (25th and 75th percentiles) are used to assess differences between groups and their evolution over time. Results CVS patients are more variable than Non-CVS patients on days 1 to 2 (P <0.005) and similar on days 3 and 4 onward (P ≥0.13). Variability declines by day. CVS and Non-CVS patients are both more variable on each of days 1 to 3 than the overall day 4 onward values (P <0.005). At the interquartile percentiles, CVS patients are 1.4 to 2.0 times more variable than Non-CVS patients on day 1, 1.40 to 1.44 times on day 2, and 1.1 to 1.2 times on day 3, but identical (<1.1x difference) for day 4 onward. Absolute SI increases daily for both groups, and the difference between groups shrinks from 33% to 12% over days 1 to 3 and is 4% on day 4 onward (P <0.005 for all). Glycemic control was equivalent for both groups (P >0.05) and thus these results were not due to differences in TGC achieved, but patient-specific factors instead. Conclusions All ICU patients exhibit greater insulin sensitivity variability over days 1 to 3, and cardiovascular surgery patients are more variable than others. Clinically, the results imply that TGC patients, especially cardiovascular surgery patients, will require greater measurement frequency, reduced reliance on insulin, and more explicit specification of carbohydrate nutrition in days 1 to 3 to safely minimise glycemic variability and maximise control for best outcome. P389 Endogenous insulin secretion and suppression during and after sepsis in critically ill patients: implications for tight glycemic control protocols CG Pretty1, PD Docherty1, J Lin2, L Pfeifer2, U Jamaludin1, GM Shaw3, AJ Le Compte1, JG Chase1 1 University of Canterbury, Christchurch, New Zealand; 2University of Otago, Christchurch, New Zealand; 3Christchurch Hospital, Christchurch, New Zealand Critical Care 2011, 15(Suppl 1):P389 (doi: 10.1186/cc9809) Introduction Insulin infusions over 2 U/hour can suppress endogenous insulin secretion in healthy subjects 30 to 45% [1]. Virtually all tight glycemic control (TGC) protocols deliver insulin via infusion. This study examines the impact of bolus delivery of insulin in TGC on the endogenous insulin secretion of critically ill patients. Methods Eighteen patients from the Christchurch Hospital ICU enrolled in a prospective clinical trial studying sepsis each had two sets of blood samples assayed for insulin and C-peptide. The first set was taken at the commencement of the SPRINT TGC protocol for patients with suspected sepsis. The second set was taken when their SIRS score was consistently below 2. Each set had four samples taken at: –1, 10, 40 and 60 minutes following bolus delivery of insulin as required by SPRINT to capture endogenous insulin secretion during the bolus profile. Bolus size was dictated by the protocol, but was in the range 2 to 6 units. Model-based methods [2] were used to calculate the endogenous insulin secretion rate for each set of samples. The level of suppression was calculated as the ratio of the secretion rate between 5 and 15 minutes (just after peak plasma insulin) and average of the 0 to 5 minutes (basal) and 15 to 60 minutes (return to basal) secretion rates identified. Results Median (IQR) endogenous insulin secretion rates for the first and second set of samples, respectively, were 4.0 (1.4 to 5.4) U/hour and 1.5 (1.0 to 3.3) U/hour, indicating a significant drop in secretion, postsepsis and later in stay (P <0.05). Median (IQR) level of suppression for the first set of samples of each patient was 1.08 (0.96 to 1.29), showing an increase in secretion for most patients during suspected sepsis. Second set suppression post-sepsis was 1.02 (0.83 to 1.12), indicating limited or no suppression outside C-peptide assay error of 9%. Analyses of blood glucose levels, culture-confirmed sepsis and diabetic status show no consistent trends. Conclusions TGC can be beneficial, but carries a high risk of hypoglycemia. Bolus insulin may provide more effective TGC as unsuppressed endogenous insulin supplements the exogenous dose, possibly lowering the required doses and the risk of hypoglycemia. These results suggest a comparative study between bolus and infused insulin in TGC. References 1. 2.
Argoud G, et al.: Diabetes 1987, 36:959-962. Van Cauter E, et al.: Diabetes 1992, 41:368-377.
Critical Care 2011, Volume 15 Suppl 1 http://ccforum.com/supplements/15/S1
P390 Effects of hyperglycemia and intensive insulin therapy on neurons and glial cells during critical illness R Sonneville1, H Den Hertog1, F Güiza1, I Derese1, JP Brouland2, F Gray2, F Chrétien3, T Sharshar4, D Annane4, G Van den Berghe1, I Vanhorebeek1 1 KU Leuven, Belgium; 2Lariboisière University Hospital, Paris, France; 3Pasteur Institute, Paris, France; 4Raymond Poincare University Hospital, Garches, France Critical Care 2011, 15(Suppl 1):P390 (doi: 10.1186/cc9810) Introduction Treating hyperglycemia with intensive insulin therapy (IIT) may improve outcome of critically ill patients. However, this benefit may be counteracted by the increased risk of hypoglycemic episodes with this intervention, which may cause brain damage. We determined the effects of hyperglycemia and IIT on neurons and glial cells during critical illness. Methods We performed a postmortem examination of the hippocampus and frontal cortex of 10 critically ill patients who were randomized to conventional insulin therapy (CIT, n = 5) or IIT (n = 5) in two previous studies [1,2]. Glucose levels differed between CIT (9.3 (8.5 to 11.2) mmol/l) and IIT (6.1 (5.3 to 6.2) mmol/l) patients (P <0.01). Neuronal damage and density and function of glial cells were assessed by histochemistry and western blot. Data were compared with eight age-matched controls who died suddenly from extracranial injury. Mechanisms were explored in a validated burn injury model of prolonged critical illness. Critically ill rabbits were allocated to four groups, each a combination of normal or elevated blood glucose with normal or elevated insulin levels. Brain samples were collected after 7 days of illness. Healthy rabbits were included as controls. Results In the hippocampus of CIT patients, neuronal damage (P = 0.002) and microglia activation (P = 0.003) were increased as compared with controls. Density (P = 0.02) and activation status (P = 0.03) of astrocytes were decreased. IIT did not affect neuronal damage, but reduced microglia activation (P = 0.03) and restored astrocyte function and density (P = 0.009) versus CIT. Findings in the frontal cortex were largely similar. The experimental model showed pronounced neuronal damage and microglia activation with hyperglycemia, which were restored to normal levels with normoglycemia. Astrocytes were activated only in rabbits with high insulin and normal glucose levels, without increased network formation, as assessed by connexin-43 levels. MnSOD protein expression levels suggested reduced oxidative stress by glycemic control under high insulin levels. Conclusions Critical illness is characterized by increased neuronal damage and microglia activation in the hippocampus and frontal cortex under hyperglycemia. Our data suggest that maintaining normoglycemia with IIT reduces brain inflammation and may be neuroprotective, despite the risk of brief episodes of severe hypoglycemia. References 1. 2.
Van den Berghe G, et al.: N Engl J Med 2001, 345:1359-1367. Annane D, et al.: JAMA 2010, 303:341-348.
P391 Errors in preparation of insulin infusions for critically ill patients R Pierson, I Mackenzie Queen Elizabeth Hospital, Birmingham, UK Critical Care 2011, 15(Suppl 1):P391 (doi: 10.1186/cc9811) Introduction Dysglycaemia is associated with poorer outcomes in critically ill patients. Maintenance of normoglycaemia by the administration of intravenous insulin is an important therapy in the ICU, but many factors can affect plasma glucose levels in often unpredictable ways. Even if insulin could be delivered to patients at a guaranteed rate, the process of controlling glucose levels with exogenous insulin infusions is not straightforward. The preparation and administration of any drug for infusion is potentially subject to error. Insulin infusions are of particular concern, since they must be diluted from a concentrated stock solution. Random errors in the preparation of insulin infusions could result in significant differences between the concentration of insulin prescribed and that seen in the infusion. This would affect the rate of insulin delivery and could potentially result in unstable plasma glucose levels.
S139
Methods Samples of 22 insulin infusions were taken over a 2-week period on a 14-bed adult general ICU. Each infusion had been prescribed as 1 IU/ml. After 10,000-fold dilution, samples were assayed using a two-step time-resolved fluorometric assay. To quantify the intra-assay variability, multiple aliquots were taken from a single sample of insulin. These were diluted and assayed in the same way as the ICU samples. Statistical analysis was performed via the SPSS computer package. Results The 22 insulin solutions had a mean concentration of 0.99 IU/ ml (SD 0.10, 95% CI: 0.95 to 1.03 IU/ml). The coefficient of variation was 10% (95% CI: 7.8 to 14.0%), with the insulin concentration ranging from 0.84 IU/ml to 1.16 IU/ml. Intra-assay coefficient of variation was found to be 3.6% (95% CI: 2.4 to 6.8%). Conclusions The concentration of the insulin solutions studied varied from the prescribed concentration by up to 16%. This is probably due to random errors arising from differences in the methods of preparations of infusions by different nursing staff in the ICU. Insulin solutions could be prepared more accurately in a central location (for example, pharmacy), taking advantage of standardised techniques and equipment. This may reduce some of the random errors we have demonstrated and could potentially improve glycaemic control. P392 Blood glucose variability, measured as mean absolute glucose, strongly depends on the frequency of blood glucose level measurements RE Harmsen1, F Van Braam Houckgeest2, PE Spronk3, MJ Schultz1, A Abu-Hanna1 1 Academic Medical Center, Amsterdam, the Netherlands; 2Tergooi Hospitals, Hilversum, the Netherlands; 3Gelre Hospitals, Apeldoorn, the Netherlands Critical Care 2011, 15(Suppl 1):P392 (doi: 10.1186/cc9812) Introduction Blood glucose variability (BGV) has been associated with outcome of critically ill patients [1-3]. Different BGV metrics exist, including mean absolute glucose (MAG) [4], which is the mean of absolute change per hour in glucose level. We hypothesized MAG to depend on the blood glucose level (BGL) measurement frequency, as doing more measurements could lead to more changes in the insulin infusion rate and hence in changes in the follow-up BGL. Methods We developed and implemented an evidence-based guideline for intensive insulin therapy on a mixed medical–surgical ICU in the Netherlands. The new guideline explicitly specifies when the follow-up BGL measurements should be taken, and hence influences BGL measurement frequency. We collected all BGL measurements, patient demographics and outcome information for 1 year before and 1 year after the guideline’s implementation, and analyzed the association of MAG and mortality. Results Data for 758 and 601 patients were collected 1 year before and 1 year after implementation. The two cohorts had similar baseline characteristics: median age 71 (59 to 80) years, median APACHE II scores 17 (13 to 23). Hospital mortality did not change (30.7% and 31.6%, P = 0.729). After implementation, median BGL decreased from 117 (97 to 144) to 106 (90 to 130) mg/dl (P <0.001), and the median BGL measurement frequency doubled, from 4 (3 to 6) to 8 (4 to 11) per day per patient (P <0.001). MAG increased from 4.5 (2.5 to 7.0) to 6.6 (3.6 to 9.7) mg/dl/hour (P <0.001). Both BGL measurement frequency and the APACHE II score significantly correlated with the MAG (Pearson’s correlation coefficient 0.574 and 0.19, respectively). The MAG was not independently associated with mortality when adjusting for both measurement frequency and the APACHE II score (odds ratio 1.01 (0.98 to 1.05), P = 0.42). Conclusions The association between MAG and BGL measurement frequency and severity of illness requires careful interpretation when comparing cohorts differing in BGL measurement frequencies. It also requires adjustment for these variables when investigating the association between MAG and mortality, as it did not emerge as an independent predictor in our cohort. References 1. 2. 3. 4.
Bagshaw SM, et al.: Crit Care 2009, 13:R91. Egi M, et al.: Anesthesiology 2006, 105:244-252. Krinsley JS: Crit Care Med 2008, 36:3008-3013. Hermanides J, et al.: Crit Care Med 2010, 38:838-842.
Critical Care 2011, Volume 15 Suppl 1 http://ccforum.com/supplements/15/S1
P393 Validation of a virtual patient and virtual trials method for accurate prediction of tight glycemic control protocol performance F Suhaimi1, AJ Le Compte1, S Penning2, CG Pretty1, JC Preiser3, GM Shaw4, T Desaive2, JG Chase1 1 University of Canterbury, Christchurch, New Zealand; 2University of Liege, Belgium; 3Erasme University Hospital, Brussels, Belgium; 4Christchurch Hospital, Christchurch, New Zealand Critical Care 2011, 15(Suppl 1):P393 (doi: 10.1186/cc9813) Introduction Effective tight glycemic control (TGC) can improve outcomes, but is difficult to achieve. In-silico virtual patients and trials offer significant advantages in cost, time and safety for designing effective TGC protocols. However, no such method has been fully validated. This study tests two matched cohorts from the Glucontrol trial treated with different protocols. The goal is to validate the ability of in-silico virtual patient models and methods to accurately predict patient-specific and clinical trial glycemic outcomes. Methods The analysis uses records for a 211-patient subset of the Glucontrol trial (Liege, Belgium). Glucontrol-A (n = 142) targeted 4.4 to 6.1 mmol/l and Glucontrol-B (n = 69) targeted 7.8 to 10.0 mmol/l. Cohorts were matched by APACHE II score, age and sex (P >0.3). The Glucontrol A cohort was slightly older (P = 0.04). Virtual patients are created by fitting a clinically validated model to the data, yielding time-varying insulin sensitivity profiles (SI(t)) that create in-silico virtual patients. Model fit and intra-patient (forward) prediction are used to validate individual in-silico virtual patients. Self-validation (tests A protocol on Group A virtual patients; and B protocol on B virtual patients) and cross-validation (tests A protocol on Group B virtual patients; and B protocol on A virtual patients) assess ability to predict a clinical trial result. Results Model fit errors were small (<0.25%) for Group A, Group B and the entire cohort (A + B), indicating model fitness. Median prediction errors were 4.3, 2.8 and 3.5% for Group A, Group B and (A + B), indicating individual virtual patients were accurate representations of real patients. Self-validation and cross-validation results were within 1 to 10% of the clinical data for both Group A and Group B. Self-validation indicated clinically insignificant model and compliance errors. Crossvalidation clearly showed that the virtual patients enabled by identified patient-specific SI(t) profiles can accurately predict the performance of TGC protocols different from those used to create the virtual patients. Conclusions This study validates these virtual patients and in-silico virtual trial methods, and clearly shows they can accurately simulate, in advance, the clinical results of a TGC protocol, enabling rapid in-silico protocol design and optimization. It is the first rigorous validation of a virtual in-silico patient and virtual trials methodology. P394 Intensive insulin therapy-associated costs differ substantially between ICUs RE Harmsen1, F Van Braam Houckgeest2, JP Van der Sluijs3, PE Spronk4, MJ Schultz1 1 Academic Medical Center, Amsterdam, the Netherlands; 2Tergooi Hospitals, Hilversum, the Netherlands; 3Medical Center Haaglanden, The Hague, the Netherlands; 4Gelre Hospitals, Apeldoorn, the Netherlands Critical Care 2011, 15(Suppl 1):P394 (doi: 10.1186/cc9814) Introduction Intensive insulin therapy (IIT) has been shown to reduce morbidity and mortality of critically ill patients [1,2]. A survey among ICU managers and nurse clinicians showed that <10% of participants evaluated costs surrounding the implementation of IIT [3]. We hypothesized IIT-associated costs to differ substantially between ICUs. Methods Three ICUs developed and implemented an evidence-based guideline for IIT. For 1 year before and 1 year after implementation, all disposables and devices explicitly used for IIT were identified in each hospital. Local costs were calculated, based on costs for disposables and devices. Variable cost included costs associated with disposables. Fixed cost included costs associated with syringe pumps and point-ofcare devices for blood glucose level (BGL) measurements. Results A total of 2,490 patients were subjected to IIT. Patient demographics did not differ among the three ICUs and did not change
S140
over time. Median BGL declined from 119 (99 to 150) to 105 (85 to 130) mg/dl (P <0.001). The number of BGL measurements per patient per day doubled from 4 (3 to 7) to 9 (5 to 12) per day (P <0.001). Yearly variable costs increased from €58.574 to €118.624 (P <0.001), yearly fixed costs increased from €450 to €14.282 (P <0.001). Importantly, costs differed substantially from one centre to another: variable costs per patient increased from €34 (€13 to 75) to €116 (€61 to 212) (P <0.001), from €13 (€5 to 44) to €48 (€32 to 88) (P <0.001) and from €15 (€7 to 34) to €31 (€15 to 70) (P <0.001) for the three ICUs, respectively. Fixed costs per bed per year increased from €0 to €250 (P <0.001), from €13 to €384 (P <0.001) and from €25 to €544 (P <0.001) for the three ICUs, respectively. Conclusions Glucose control-associated costs rise with the implementation of IIT. Major differences in costs are noticed when comparing ICUs with similar patient cohorts and similar blood glucose control metrics after implementation of IIT. References 1. 2. 3.
Van den Berghe G, et al.: N Engl J Med 2006, 354:449-461. Van den Berghe G, et al.: N Engl J Med 2001, 345:1359-1367. Miller M, et al.: J Diabetes Sci Technol 2007, 1:903-906.
P395 Tight glucose control managed by ICU nurses induces extremely low rates of hypoglycemia F Delodder, C Joseph, P Maravic, T Szostek, MD Schaller, M Berger, JP Revelly, P Eggimann CHUV, Lausanne, Switzerland Critical Care 2011, 15(Suppl 1):P395 (doi: 10.1186/cc9815) Introduction Recent studies failed to confirm survival benefit of tight glucose control (TGC). Moreover, they reported high rates (6 to 18%) of hypoglycemia (<2.5 mmol/l) associated with significant mortality. The protocols used for TGC may be difficult to apply. The reasons for blood glucose level variations are complex and TGC requires in-depth individualized knowledge of the patient condition. Frequent blood glucose measurements are mandatory for continue adaptations of insulin and glucose administration. We report the evolution of blood glucose level through various phases of TGC implementation, which become progressively completely nurse driven. Methods An internal audit performed in 2002, in five of our 32 adult ICU beds, showed 26% of hyperglycemia (>10 mmol). TGC was introduced in 2003 for all patients in the ICU and supported by detailed guidelines for bedside glucose control. TGC was progressively transferred from physicians to nurses since 2007. Nurses are specifically trained to adapt infusion rates of glucose (nutrition), insulin according to medically predefined targets (4.5 to 6.0; 6.0 to 8.0; >10 mmol/l). Arterial and venous glucose levels are determined by the central laboratory or by blood gas analyzers in the ICU. Glycemia (n = 750,178) was extracted from our electronic clinical information system (Metavision®) and analyzed with STATA. Results Suppression of the lowest target (4.5 to 6.0 mmol/l) in May 2009 may explain the mean increase in 2009. Improved TGC is confirmed by a continuous decrease in yearly standard deviations (IQR). The proportion of hyperglycemia decreases to less than 10% in 2008, with rates of hypoglycemia (<2.5 mmol/l) 50-fold to 100-fold lower than those reported in the literature. See Figure 1.
Figure 1 (abstract P395).
Critical Care 2011, Volume 15 Suppl 1 http://ccforum.com/supplements/15/S1
Conclusions Implementation and progressive transfer of tight glucose control to ICU nurses in a large mixed adult ICU significantly decreased the proportion of hyperglycemia to less than 10%, and maintained extremely low rates of hypoglycemia (<0.1%). P396 Investigation of the blood glucose target for mortality reduction by means of bedside-type artificial pancreas M Hoshino1, Y Haraguchi2, I Mizushima3, M Sakai4, K Oda1, S Kajiwara1, M Takagi1 1 Shisei Hospital, Saitama, Japan; 2National Hospital Organization Disaster Medical Center, Tokyo, Japan; 3Nippon Engineering College, Tokyo, Japan; 4 Tokyo Women’s Medical University Hospital, Tokyo, Japan Critical Care 2011, 15(Suppl 1):P396 (doi: 10.1186/cc9816) Introduction The blood glucose (BG) target has not been determined especially in acutely ill patients. The purpose was to investigate the BG target in order to reduce the mortality in terms of clinical phases (Early (E) phase and Late (L) phase) as well as to clarify mutual relationships among the BG parameters. Methods Patients with daily mean BG (BGm) below 200 mg/dl in whom BG was controlled by a bedside-type artificial pancreas (AP), STG22, were researched in the E phase (3.3 ± 2.5 days after admission, n = 67) and L phase (10.1 ± 3.4 days after admission, n = 77). Nutritional support for all the patients was performed by total parenteral nutrition. Studied items: BG parameters (mg/dl; BGm, daily standard deviation of BG (BGsd), daily maximal and minimal BG (BGmax, BGmin), and daily BG difference (BGd: BGmax – BGmin)), maximal value of the accuracy (%) of the BG parameters for predicting survival (AS), and correlation coefficients (r) among the BG parameters. Results AS (%): E phase/L phase; BGm below 196 (75%)/BGm below 175 (68%), BGsd below 17 (73%)/BGsd below 20 (62%), BGmax below 225 (72%)/BGmax below 218 (65%), BGmin below 172 (72%)/BGmin below 158 (73%), and BGd below 80 (70%)/BGd below 98 (68%). Strong positive correlation (r) was found in both phases (E phase/L phase) between BGsd and BGd (r = 0.87/r = 0.95), BGsd and BGmax (r = 0.79/r = 0.78), and BGd and BGmax (r = 0.77/r = 0.82). There was no significant correlation in both phases (E phase/L phase) between BGm and BGsd (r = 0.16/r = 0.37), BGm and BGd (r = 0.13/r = 0.38), and BGmax and BGmin (r = 0.07/r = 0.29). Conclusions The above-mentioned values of the BG parameters were considered to be the BG targets. Strict BG control in the E phase is significant, from the data indicating that the AS values in the E phase were greater than those in the L phase except BGmin. BGm, BG variability (BGsd, BGd), and BGmin were suggested to be independent BG parameters. AP was essential for determining the BG target. P397 Mild hypoglycemia is independently associated with increased mortality in the critically ill J Krinsley1, MS Schultz2, P Spronk2, R Harmsen2, F Van Braam Houckgeest3, J Van der Sluijs4, C Melot5, JC Preiser5 1 Stamford Hospital, Stamford, CT, USA; 2Academic Medical Center, Amsterdam, the Netherlands; 3Tergooi Hospitals, Blaricum, the Netherlands; 4 Medical Center Haaglanden, The Hague, the Netherlands; 5Erasme University Hospital, Brussels, Belgium Critical Care 2011, 15(Suppl 1):P397 (doi: 10.1186/cc9817) Introduction Severe hypoglycemia (blood glucose level (BGL) <40 mg/ dl) is independently associated with an increased risk of mortality in critically ill patients. The impact of milder hypoglycemia (BGL <70 mg/ dl) on outcome is less clear. Methods Prospectively collected data from two observational cohorts in the USA and in the Netherlands and from the prospective GLUCONTROL trial were analyzed. Hospital mortality was the primary endpoint. Results We analyzed data from 3,262 patients admitted to Stamford Hospital (ST), 2,063 patients admitted to three institutions in the Netherlands (NL; loose glycemic protocol (L, n = 1,098) and strict glycemic protocol (S, n = 965)) and 914 patients who participated in the GLUCONTROL trial (GL; control arm (C, n = 460) and intensive
S141
insulin therapy arm (IIT, n = 454)). The percentage of patients with hypoglycemia varied widely among the different cohorts. Patients with hypoglycemia experienced higher mortality than did those without hypoglycemia within each subgroup (P <0.0001 for all comparisons), even after stratification by severity of illness or diabetic status. Multivariable logistic regression analysis revealed that hypoglycemia had a greater impact on the mortality of surgical patients than of medical patients. The impact of hypoglycemia on mortality occurred independently of mean glucose level during ICU stay or glycemic variability. Conclusions Even a single episode of mild hypoglycemia was associated with a significantly increased risk of mortality in heterogeneous cohorts of critically ill patients, independently of severity of illness, diabetic status, diagnostic category and glycemic variability. P398 Malglycemia is strongly associated with increased risk of ICU-acquired infection J Krinsley1, MJ Schultz2, TS Hall1, S Krasnica1, JC Preiser3 1 Stamford Hospital, Stamford, CT, USA; 2Academic Medical Center, Amsterdam, the Netherlands; 3Erasme University Hospital, Brussels, Belgium Critical Care 2011, 15(Suppl 1):P398 (doi: 10.1186/cc9818) Introduction Infections that develop after admission to the ICU cause substantial morbidity and increases in resource utilization. The purpose of this investigation was to study the relationship of malglycemia, defined as blood glucose level (BGL) <70 or >139 mg/dl and the risk of developing ICU-acquired infection, occurring more than 2 days after ICU admission. Methods This is a retrospective evaluation of prospectively collected data from the ICU’s clinical database. Infection control nurses using standard definitions prospectively identified ICU-acquired infections. Results A total of 3,263 patients were admitted to a medical–surgical ICU between 1 December 2007 and 31 May 2010 and had at least three BGL measurements. In this group, 142 (4.4%) patients developed 171 infections. Patients who developed infection had significantly longer ICU length of stay (P <0.0001), higher scores for severity of illness (mean APACHE IV predicted mortality 34.8% vs. 18.5%, P <0.0001) and greater mortality (32.4% vs. 13.3%, P <0.0001) than did those who did not develop infection. Of 505 patients who did not have a single episode of malglycemia, none developed infection. In contrast, 16.8%, 13.1% and 7.2% of patients with lowest BGL <40, 40 to 54 and 55 to 69 mg/dl as well as 0.8%, 3.3%, 5.7% and 9.6% of patients with highest BGL 140 to 159, 160 to 179, 180 to 249 and >249 mg/dl developed infection. Multivariable logistic regression analysis identified BGL <70 and >139 mg/dl as independent predictors of the risk of developing infection (odds ratio (95% CI) 2.23 (1.45 to 3.44), P = 0.003 and 13.94 (1.91 to 101.90), P = 0.0094, respectively). Conclusions Malglycemia is strongly associated with increased risk of ICU-acquired infections. Efforts to decrease the rate of hypoglycemia and hyperglycemia may reduce morbidity in the ICU. P399 Intensive insulin therapy-induced severe hypoglycemia does not affect long-term functional and cognitive outcome or health-related quality of life RE Harmsen1, JG Hofhuis2, J Korevaar1, F Van Braam Houckgeest3, JP Van der Sluijs4, MJ Schultz1, PE Spronk2 1 Academic Medical Center, Amsterdam, the Netherlands; 2Gelre Hospitals, Apeldoorn, the Netherlands; 3Tergooi Hospitals, Hilversum, the Netherlands; 4 Medical Center Haaglanden, The Hague, the Netherlands Critical Care 2011, 15(Suppl 1):P399 (doi: 10.1186/cc9819) Introduction Intensive insulin therapy (IIT) has been shown to reduce mortality in intensive care patients [1,2]. A large study on IIT was stopped prematurely due to high incidence of severe hypoglycemia (SH) (blood glucose level (BGL) <40 mg/dl) [3]. It remains unclear, however, whether short episodes of IIT-associated SH are truly harmful [4]. We investigated long-term quality of life and functional and cognitive outcome in patients with and without IIT-associated SH.
Critical Care 2011, Volume 15 Suppl 1 http://ccforum.com/supplements/15/S1
Methods Three hospitals developed and implemented an evidencebased guideline for IIT; we collected all BGL measurements and patient demographics for the 2 years after implementation. We captured all patients with SH, and randomly selected the same number of patients without SH as controls. To evaluate long-term outcome, we used the following scores: Glasgow Outcome Scale (GOS), Short-Form (SF)-12 for health-related quality of life (HRQOL) expressed as physical (PCS-12) and mental component score (MCS-12), Informant Questionnaire on Cognitive Decline in the Elderly (IQ–CODE) and the Modified Blessed Dementia Rating Scale (MBDRS) by proxies. Results Our analysis included 93 patients, 43 patients with at least one episode of SH, and 50 control patients. Median length of an SH episode, assuming linear changes of glucose values between measurements, was 20 (10 to 50) minutes. Patient demographics (age, gender, APACHE II scores) were similar. Median length of ICU stay was longer in patients with SH, 12 (6 to 20) versus 4 (8 to 23) days (P <0.001). Median BGL was lower in patients with SH, 101 (97 to 106) versus 113 (102 to 123) mg/ dl (P <0.001). Outcome indicators were similar between patients with at least one episode of SH and control patients: GOS; 1 (1 to 1) versus 1 (1 to 2) (P = 0.173); PCS-12; 44 (33 to 50) versus 42 (34 to 52) (P = 1.000); MCS-12; 49 (38 to 56) versus 45 (35 to 52) (P = 0.093), IQ–CODE; 3.0 (3.0 to 3.3) versus 3.0 (3.0 to 3.1) (P = 0.116) and MBDRS 1; (0.5 to 1.5) versus 0.5 (0.5 to 2.5, P = 0.734). Conclusions Neither long-term functional and cognitive outcome, nor HRQOL of patients who encountered IIT-associated SH differed from patients who never had SH. However, it should be noted that the analyzed groups are small. Our data suggest IIT-associated SH not being harmful. References 1. 2. 3. 4.
Van den Berghe G, et al.: N Engl J Med 2006, 354:449-461. van den Berghe G, et al.: N Engl J Med 2001, 345:1359-1367. Brunkhorst FM, et al.: N Engl J Med 2008, 358:125-139. Vriesendorp TM, et al.: Crit Care Med 2006, 34:2714-2718.
P400 Decreased intravenous glucose intake safely prevents hyperglycemia in postsurgical children CT De Betue1, SC Verbruggen1, H Schierbeek1, S Chacko2, JB Van Goudoever3, KF Joosten1 1 Erasmus MC, Rotterdam, the Netherlands; 2Baylor College of Medicine, Houston, TX, USA; 3Academic Medical Centre University of Amsterdam/VU Medical Centre, Amsterdam, the Netherlands Critical Care 2011, 15(Suppl 1):P400 (doi: 10.1186/cc9820) Introduction Critical illness induced hyperglycemia in critically ill children can be treated with intensive insulin therapy, but hypoglycaemia is a potential serious side effect. We have investigated whether decreasing intravenous glucose intake, as an alternative method, improves plasma glucose levels without affecting glucose production and protein balance in postsurgical children. Methods Eight children (age 9.8 ± 1.9 months, weight 9.5 ± 1.1 kg) admitted to the pediatric ICU after surgical correction for nonsyndromal craniosynostosis were studied in a randomized blinded cross-over setting to receive standard glucose (SG, 5.0 mg/kg/minute) or low glucose (LG, 2.5 mg/kg/minute). A 10-hour stable isotope tracer protocol was conducted 6 hours after surgery to study glucose and protein metabolism. Results During SG, hyperglycemia (>110 mg/dl) was present, while LG resulted in normoglycemia (LG 105 ± 10 vs. SG 133 ± 30 mg/dl; P = 0.02), but not in hypoglycemia. Endogenous glucose production increased during LG (LG 2.6 ± 1.5 vs. SG 1.1 ± 1.4 mg/kg/minute; P = 0.05). Whole body protein balance was slightly negative in both groups and was not affected by glucose intake. Conclusions Standard glucose intake in postsurgical children induced hyperglycemia. Decreasing the intake by one-half of current standards resulted in normoglycemic levels, with increased endogenous glucose production. Patients were in a slight catabolic state and decreasing glucose intake did not deteriorate this. Decreasing glucose intake is a safe method to prevent hyperglycemia in critically ill postsurgical children.
S142
P401 Space GlucoseControl with the incorporated enhanced model predictive control algorithm is a safe and reliable tool for glycaemic control in medical ICU patients K Amrein1, M Ellmerer2, R Hovorka3, KH Smolle1, N Kachel2, TR Pieber4, J Plank1 1 Medical University of Graz, Austria; 2BBraun, Melsungen, Germany; 3University of Cambridge, Institute of Metabolic Science, Cambridge, UK; 4Joanneum Research, Graz, Austria Critical Care 2011, 15(Suppl 1):P401 (doi: 10.1186/cc9821) Introduction Glycaemic control remains an important therapeutic goal in critically ill patients; however, safety and workload are important concerns in its implementation. The enhanced model predictive control (eMPC) algorithm has demonstrated efficacy and safety in critically ill medical and surgical patients. It is integrated in the BBraun Space GlucoseControl system (SGC, project title: Space TGC) which consists of three Space pumps (two for nutrition, one for insulin). A central user interface (Space Control) and central hardware connected to Space Control (SGC Module) provide suggestions for insulin rate and glucose measurement interval. Methods Performance of SGC was tested in mechanically ventilated medical ICU patients for up to 14 days. It was operated by 54 trained nurses and the target range was 80 to 150 mg/dl (4.4 to 8.3 mmol/l). Patients with an expected ICU stay >3 days were recruited in this single-centre, noncontrolled trial. Results From February to November 2010, 18 patients (age 63 ± 17, BMI 29.1 ± 7.3, APACHE II 26 ± 7, 13 male, four diabetic) were included for a period of 7.0 ± 3.7 days and 1,583 blood glucose values were analysed, corresponding to a sampling interval of 2 hours. The percentage of glucose values within predefined ranges was as follows: ≤40 mg/ dl: 0.0%; >40 and <60 mg/dl: 0.3%; ≥60 and <80 mg/dl: 4.3%; ≥80 and ≤150 mg/dl: 74.7%; and >150 mg/dl: 20.7%. Mean arterial blood glucose was 127 ± 35 mg/dl (7.0 ± 2.0 mmol/l). No hypoglycaemic episodes (≤40 mg/dl) occurred during the trial. Conclusions Performance of SGC with incorporated eMPC algorithm was excellent. Seventy-five per cent of all glucose values were within the target range and no hypoglycaemic episodes occurred. SGC is a safe and reliable method to control blood glucose in critically ill patients in the medical ICU. P402 Glucose variability and ICU outcome S Todi, M Bhattacharyya AMRI Hospitals, Kolkata, India Critical Care 2011, 15(Suppl 1):P402 (doi: 10.1186/cc9822) Introduction Glycemic excursion or glucose variability (GV) was explored recently as a contributor of mortality, when studies concentrating on strict blood sugar control failed to show consistent results. The objective of this study was to determine the implication of glucose variability on ICU mortality in a heterogeneous ICU population. Methods The study was conducted in a medical/surgical ICU (45 beds) in a private teaching tertiary care hospital in India. A nurse-driven subcutaneous and intravenous insulin protocol (modified Yale) was followed for sugar control with a target CBG of ≤150 mg/dl. Blood sugar was checked as per patient requirement, both by point-of care-testing and central laboratory. The outcome measure was ICU mortality. From the prospectively collected glucose values, mean blood glucose (MBG) was measured for each patient and glycemic variability (GV) calculated as the standard deviation (SD) and glycemic lability index of MBG. GV was correlated with mortality. Results The study was conducted from January 2009 until November 2009. All consecutive patients with four or more blood sugar measurements were considered. A total of 11,335 blood sugar records were analyzed from 2,208 patients during this time. The mean age of the study population was 61 (SD ±16.71). In total, 58.96% were male and 77.8% were medical admissions. Mean APACHE IV score was 56.9. MBG of the study population was divided into five subgroups. Each subgroup had four quartiles of rising SD along with mortality. Mortality was higher in the highest quartiles of SD in each of five subgroups of patients. Mortality was highest in the subgroup with lowest range of
Critical Care 2011, Volume 15 Suppl 1 http://ccforum.com/supplements/15/S1
S143
P404 Glycemia in blood, brain and subcutaneous tissue measured by a continuous glucose monitoring system M Zourek, Z Jankovec, P Hykova Faculty Hospital, Charles University, Plzen, Czech Republic Critical Care 2011, 15(Suppl 1):P404 (doi: 10.1186/cc9824)
Figure 1 (abstract P402). Mortality rates in quartile ranges of SD within subpopulations.
MBG and who had maximum variability or highest SD. In our study cohort, 212 patients (9.6%) had hypoglycemia. In this cohort also mortality increased from 6, 10, 11, 16%, respectively, with rising SD in the same way as the whole cohort. See Figure 1. Conclusions In summary, this study demonstrated that glucose variability is associated with ICU mortality in a large heterogeneous cohort of ICU patients. This effect was particularly strong among patients in the euglycemic range. P403 Glycemic control in critically ill infants and children: achieved quality of control in daily clinical practice in Leuven after a RCT E Voets, T Van Herpe, L Desmet, D Vlasselaers, P Wouters, G Van den Berghe UZ Leuven, Belgium Critical Care 2011, 15(Suppl 1):P403 (doi: 10.1186/cc9823) Introduction A large RCT of our research group demonstrated that targeting age-adjusted normal fasting blood glucose concentrations with insulin infusion improves outcome in critically ill infants, children and adults [1-3]. Tight glycemic control according to the Leuven guideline has been implemented as a standard of care in all Leuven ICUs. This study aims to document the quality of glycemic control in daily clinical practice in the Leuven pediatric ICU (PICU). Methods We performed a retrospective data analysis on all pediatric patients admitted to the Leuven PICU over a 12-month period, from 1 January 2009 to 31 December 2009. Results One hundred and forty-two of the 333 PICU admissions (43%) were infants (<1 year) and 191 of 333 (57%) were children (1 to 16 years). We obtained a total of 12,208 blood samples in the infant group. The mean blood glucose level per infant was 98 mg/dl, the median was 86 mg/dl (interquartile range 67 to 111 mg/dl). Forty-six infants (32%) experienced at least one hypoglycemic period. Hypoglycemia (<40 mg/ dl) was noted in 168 (1.4%) of the samples, and 37 samples (0.3%) were extreme hypoglycemic (≤30 mg/dl). A total of 8,008 blood samples were taken in the children’s group. The mean blood glucose level per child was 116 mg/dl, the median was 103 mg/dl (interquartile range 88 to 125 mg/ dl). Sixteen (8%) children experienced at least one hypoglycemic period. Twenty-two samples (0.3%) were hypoglycemic (<40 mg/dl) and three samples (0.04%) were extreme hypoglycemic (≤30 mg/dl). Conclusions Even outside the setting of a RCT, the blood glucose control achieved in clinical practice mimicked that during the study on tight glycemic control in critically ill infants and children [3]. The risk of hypoglycemia was even lower than during the RCT. These outstanding results were achieved by standardized management by experienced nurses who were allowed to make anticipative decisions. The principles of managing tight glycemic control in the PICU will be shared onsite. References 1. 2. 3.
Van den Berghe G, et al.: N Engl J Med 2001, 345:1359-1367. Van den Berghe G, et al.: N Engl J Med 2006, 354:449-461. Vlasselaers et al.: Lancet 2009, 373:547-556.
Introduction Continuous glucose monitoring system (CGMS) technology provides the opportunity to measure glycemia in different tissues [1]. The aim of our study was to determine the lag-time between blood, brain and adipose tissue during rapid glucose changes. Methods Fifteen male hereditary hypertriglyceridemic rats underwent the experimental protocol. After intraperitoneal anesthesia, the internal jugular vein and carotid artery were catheterized. A CGMS sensor (Medtronic) was inserted into the brain by micromanipulators and to the abdominal subcutaneous tissue. At the beginning of the experiment (–120 minutes), basal glycemia was measured and calibration of the sensors was started. Thereafter, insulin infusion was started (50 mU/kg/minute) and 20% glucose at a variable rate of infusion. Blood glucose was measured every 5 minutes with manual correction of the glucose infusion rate to maintain the glycemia level of 6 mmol/l. At a time of –10 minutes, the calibration procedure was finished and actual glycemia was recorded to sensors. At a time of 0 minutes, a bolus of glucose 0.5g/kg was administered; and at a time of 50 minutes, a bolus of insulin 5 IU/kg was administered. Moreover glucose and insulin infusion were stopped at this time. The experiment was finished at time 130 minutes and animals were euthanized. Results After an intravenous glucose bolus of 0.5 g/kg, glycemia rose rapidly to 14 mmol/l in 5 minutes. On the contrary, the glucose content in the brain and subcutaneous tissue was increased in a slower manner, with a maximum in about 50 minutes (brain) and 60 minutes (subcutaneous tissue). Intravenous insulin bolus of 5 U/kg was followed by lowering blood glucose concentration to a minimum of 4.5 mmol/l. The brain and subcutaneous tissue glucose content decreased slowly to a minimum of 4.2 mmol/l (brain) and 5.5 mmol/l (subcutaneous tissue). The median glucose lag-time blood versus brain and blood versus subcutaneous tissue was 10 (10; 15) minutes and 15 (15; 25) minutes, respectively (P = 0.01). Conclusions Contrary to a previous study, which showed no changes in glucose dynamics after a bolus of glucose between brain, adipose tissue and muscle, our data showed that glucose in the brain follows blood excursions during acute glycemic changes more closely compared with subcutaneous tissue [2]. References 1. 2.
Penicaud L, et al.: Curr Opin Clin Nutr Metab Care 2002, 5:539-543. Nielsen JK, et al.: Diabetes 2005, 54:1635-1639.
P405 Evaluation of a continuous blood glucose monitoring system using central venous microdialysis F Möller, J Liska, A Franco-Cereceda Karolinska Institutet, Stockholm, Sweden Critical Care 2011, 15(Suppl 1):P405 (doi: 10.1186/cc9825) Introduction Glycemic control in critically ill patients has been shown to be beneficial. In this prospective study we therefore evaluated the accuracy and technical feasibility of a continuous glucose monitoring system using intravascular microdialysis. Methods Fifty patients undergoing cardiac surgery were monitored using a 4Fr intravenous microdialysis catheter (Eirus SLC®; CMA Microdialysis AB, Solna, Sweden), percutaneously placed with the tip of the catheter positioned in the superior vena cava. The catheter was connected to the Eirus monitoring system and the patients were monitored for up to 48 hours postoperatively in the ICU. As reference, arterial blood samples were taken every hour and analyzed in a blood gas analyzer (ABL800 FLEX®; Radiometer Medical, Copenhagen, Denmark). Results Data were available from 48 patients. A total of 994 paired (arterial blood gas–microdialysis) samples were obtained. The glucose correlation coefficient (R2) was 0.85. Using Clarke error grid analysis, 100% of the paired samples were in region AB and 99% in region A
Critical Care 2011, Volume 15 Suppl 1 http://ccforum.com/supplements/15/S1
S144
Methods This prospective observational study included 75 consecutive ICU patients, corresponding to 302 pairs of measures (aged 56 ± 16 years, SOFA 8 ± 4, IGS2 56 ± 20). Findings from two different methods of glucose measurement were compared with laboratory blood glucose measurements: glucose meter analysis of capillary blood (fingerstick), and glucose meter analysis of arterial blood during the first 3 days in the ICU. Agreement between measurements was assessed using the Bland–Altman method. Results The correlation coefficient between fingerstick and laboratory results was 0.91 (95% CI = 0.89 to 0.99) and 0.92 (95% CI = 0.92 to 0.94) between arterial glucose meter analysis and laboratory testing. The mean bias between fingerstick and laboratory testing was 0.16 g/l, and between arterial glucose meter and laboratory testing was 0.10 g/l. Norepinephrine used did not affect the bias between methods (P = NS for all comparisons). See Figure 1. Conclusions The agreement between methods for glucose level measurements appears not to be clinically acceptable. Either fingerstick or arterial glucose meter analysis have large limits of agreement with the gold standard laboratory testing for blood glucose measurements.
Figure 1 (abstract P405). Error grid analysis of arterial blood gas and microdialysis glucose samples.
(Figure 1). The mean glucose level was 8.3 mmol/l, bias 0.2% and the mean absolute relative difference was 5%. A total 99.2% of the paired samples were correct according to ISO criteria. Bland–Altman analysis showed bias ± limits of agreement were 0.02 ± 1.1 mmol/l. Conclusions Central venous microdialysis is a highly accurate and reliable method for continuous blood glucose monitoring up to 48 hours in ICU patients undergoing cardiac surgery. The system may thus be useful in critically ill ICU patients. P406 Accuracy of glucose measurements in critically ill patients V Claverie, L Lonjaret, B Riu-Poulenc, S Silva, T Geeraerts, O Fourcade University Paul Sabatier, Toulouse, France Critical Care 2011, 15(Suppl 1):P406 (doi: 10.1186/cc9826) Introduction The aim as to compare the accuracy of glucose measurements using a glucose meter analyser in fingerstick, arterial blood and laboratory tests in critically ill patients and to determine factors influencing the bias between these methods.
Figure 1 (abstract P406).
P407 Comparison of glucose variability measures M Bhattacharyya, S Todi AMRI Hospitals, Kolkata, India Critical Care 2011, 15(Suppl 1):P407 (doi: 10.1186/cc9827) Introduction Glycemic excursion or glucose variability (GV) is associated with short-term ICU mortality. There is a heterogeneity among studies in using measures of GV. The objective of this study was to compare different formulas used to assess GV in predicting mortality. Methods The study was done in a 45-bed medical–surgical unit. All patients admitted to the ITU and with four or more blood glucose (BG) readings were included from January 2009 to November 2009. Sugar control was protocolised with a target CBG of ≤150 mg/dl. Glucose was measured from central laboratory or point-of-care checking at an interval of 6 hours or when required. From the prospectively collected glucose values, different measures of glycemic variability have been calculated and compared among themselves. We used standard deviation (SD), glycemic lability index (GLI), maximum glucose change (MGC), mean amplitude of glucose excursion (MAGE), and average daily risk range (ADRR) as measures of GV. Results A total of 11,335 blood sugar records were analyzed from 2,208 patients during this time. Mean age of the study population was 61 (SD ±16.71). In total, 58.96% were male and 77.8% were medical admissions. The mean APACHE IV score was 56.9. All the variables of GV could predict mortality with equal power. See Figures 1 and 2. Conclusions All of the GV measures have almost the same prediction power. Any one measure can be used as a quality indicator of GV in an ICU.
Critical Care 2011, Volume 15 Suppl 1 http://ccforum.com/supplements/15/S1
S145
sensitivity score indicates that the new hospital CGM has few false alarms for untrue hyper events; and a high specificity score indicates that the new hospital CGM rarely misses a true hyper event. Conclusions Alarms are more than convenient features; they are an important component of product and patient safety. However, poor or inconsistent sensitivity and specificity can quickly diminish the value of an alarm, reducing it to little more than a nuisance. This analysis shows that the novel CGM has the potential to provide sensitivity and specificity to satisfy the demands of the hospital environment. Given the growing reliance on automated and semi-automated clinical systems and the inherent safety implications resulting from this trend, alarm performance should be an important consideration when evaluating these products. Figure 1 (abstract P407). Comparison of deciles of different GV formulas with mortality.
P409 Salivary cortisol measurements in mechanically ventilated patients D Vassiliadi1, I Mavrou1, M Tzanela2, N Nikitas3, M Theodorakopoulou1, S Orfanos1, A Armaganidis1, S Tsagarakis4, I Dimopoulou1 1 Attikon University Hospital, Athens, Greece; 2Evagelismos Hospital, Athens, Greece; 3Alexandra Hospital, Athens, Greece; 4Polyclinic Hospital, Athens, Greece Critical Care 2011, 15(Suppl 1):P409 (doi: 10.1186/cc9829)
Figure 2 (abstract P407). ROC of formulas.
P408 Alarm performance in a novel continuous glucose monitor R Gottlieb, N Yang, F Luo, C Chiu, R Joshi, S Smith Medtronic, Northridge, CA, USA Critical Care 2011, 15(Suppl 1):P408 (doi: 10.1186/cc9828) Introduction The ability of a continuous glucose monitor (CGM) to provide actionable information is of utmost importance in the critical care setting. Medtronic has developed a new CGM specifically for the hospital environment. A human feasibility trial was conducted to assess the performance of this system in the ICU. While often overlooked, alarm performance is essential to characterizing both the safety and value of any clinical system – especially in a critical care setting. An analysis was conducted on the sensitivity and specificity of the alarm algorithm to simulate the expected performance when used in the clinical setting. Methods A feasibility study was targeted to enroll 10 ICU patients for 72 hours in the surgical ICU of an academic institution. Enrollment was determined by two consecutive glucose values greater than 140 mg/ dl. The sensor data were collected while blinded to the clinicians and hourly reference glucose data were collected using a chemistry analyzer (YSI 2300D). Data analysis was performed to mimic a clinical setting that samples glucose every 6 hours. Sensors were calibrated with four reference values per day. Paired sensor glucose values and YSI values were analyzed for sensitivity and specificity of alarm setting (100 to 140 mg/dl) based on a target range of 100 to 140 mg/dl. For sensitivity and specificity, hypoglycemia was defined as 90 mg/dl or less, and hyperglycemia was defined as 160 mg/dl or greater. This analysis was repeated for paired sensor glucose values and point-ofcare meter values in the same alarm settings and target range. Results Two patients completed 72 hours at the time of this abstract. There were not enough paired points in the hypoglycemic range (<90 mg/dl) to complete an analysis (8/136). In the hyperglycemic range (101/136), the algorithm showed an average sensitivity of 91% and an average specificity of 93% against hourly reference. A high
Introduction Salivary cortisol is a reliable tool to evaluate the normal or disordered control of the hypothalamic–pituitary–adrenal (HPA) axis. Despite this, salivary cortisol has been rarely assessed in the setting of intubated, critically ill patients. The purpose of the current study was to investigate the utility of salivary cortisol measurements in an intensive care population. Methods Thirty-nine (25 men) consecutive, critically ill patients with a mean (± SD) age of 65 ± 22 years having various illnesses were included in the present study. Sixteen patients had sepsis. Mean APACHE II and SOFA scores were 17 ± 10 and 7 ± 3, respectively. Mean albumin was 3.0 ± 0.7 g/dl. Within 48 hours of ICU admission, morning cosyntropin stimulation tests (250 μg, i.v.) were performed. Serum total cortisol and salivary cortisol were measured before and 30 minutes after consyntropin administration. In eight healthy controls, baseline salivary cortisol was also measured. Results Patients had higher baseline salivary cortisol than healthy controls (1.13 ± 0.80 μg/dl vs. 0.33 ± 0.80 μg/dl, P = 0.002). Baseline and cosyntropin-stimulated serum total cortisol were 21 ± 11 μg/dl and 31 ± 13 μg/dl, respectively (P <0.001). Baseline and cosyntropin-stimulated salivary cortisol were 1.13 ± 0.80 μg/dl and 1.4 ± 0.90 μg/dl, respectively (P = 0.004). Baseline serum total cortisol correlated with baseline salivary cortisol in patients with albumin values >2.5 g/dl (r = 0.60, P = 0.01). In contrast, there was no correlation between these variables in patients having albumin concentrations ≤2.5 g/dl. Stimulated serum total cortisol did not correlate with stimulated salivary cortisol in either of the two subgroups. Conclusions Salivary cortisol measurement is easy to obtain in critically ill patients. Salivary cortisol is higher compared with healthy controls and increases significantly following stimulation with cosyntropin. Whether salivary cortisol is superior to serum total cortisol measurements in the assessment of the HPA axis activity requires further investigation. P410 Plasma free cortisol and b-type natriuretic peptide in septic shock D Sturgess, B Venkatesh The University of Queensland, Brisbane, Australia Critical Care 2011, 15(Suppl 1):P410 (doi: 10.1186/cc9830) Introduction Previous studies of patients with septic shock have independently demonstrated alterations in plasma concentrations of b-type natriuretic peptide (BNP) and plasma free cortisol (PFC). Previous data suggest that a reciprocal relationship might exist. However, the relationship between these hormones in patients with septic shock is unclear. We sought to compare paired measurement of both BNP and PFC in a preliminary study of septic shock patients. Methods Twenty-one consecutive adult patients from a tertiary-level, multidisciplinary ICU underwent blood collection within 72 hours of developing septic shock.
Critical Care 2011, Volume 15 Suppl 1 http://ccforum.com/supplements/15/S1
S146
Results Mean ± SD APACHE III score was 80.1 ± 23.8. Hospital mortality was 29%. Log PFC demonstrated positive correlation with log BNP (r = 0.55; P = 0.019). Log PFC also correlated with APACHE III (r = 0.67; P <0.001) and norepinephrine dose (r = 0.55; P = 0.01). APACHE III (P = 0.001) and norepinephrine dose (P = 0.02) were independent predictors of PFC. A model incorporating both variables explained 68% of variation in PFC (R2 = 0.682). Conclusions This preliminary study of patients with septic shock demonstrates a modest positive correlation between PFC and BNP concentration. The APACHE III score and norepinephrine dose were independent predictors of PFC. P411 Interstitial cortisol levels obtained by adipose tissue microdialysis in mechanically ventilated septic patients: correlations with total and free serum cortisol M Theodorakopoulou1, N Nikitas2, I Ilias3, M Tzanela4, D Vassiliadi1, P Kopterides1, N Maniatis1, A Diamantakis1, S Orfanos1, I Perogamvros5, A Armaganidis1, U Ungerstedt6, K Keevil7, T Tsagarakis8, D Dimopoulou1 1 Attikon University Hospital, Athens, Greece; 2Alexandra Hospital, Athens, Greece; 3E. Venizelou Hospital, Athens, Greece; 4Evagelismos Hospital, Athens, Greece; 5Christie Hospital, Manchester, UK; 6Karolinska Institute, Stockholm, Sweden; 7University Hospital of South Manchester, Manchester, UK; 8Polyclinic Hosital, Athens, Greece Critical Care 2011, 15(Suppl 1):P411 (doi: 10.1186/cc9831) Introduction The aim of this study was to measure cortisol in the interstitial fluid of mechanically ventilated septic patients using MD and to examine the correlation between interstitial cortisol levels and total along with free serum cortisol. Methods A prospective study including 31(20 men) septic patients. All patients met the ACCP/SCCM criteria for sepsis. Upon sepsis an MD catheter was inserted in the subcutaneous tissue of the upper thigh. MD sampling was done on days 1 and 2, six times/day. The collected samples were analyzed for free cortisol, glucose, pyruvate, lactate, glycerol and lactate/pyruvate ratio. Blood samples were collected for routine hematology and biochemistry on the same days. Age, gender, sepsis stage, administration of vasopressors, death in the ICU and 28-day mortality were recorded. APACHE II scores for day 1 and SOFA scores for days 1 and 2 were calculated. Results Seventeen patients were given norepinephrine. Albumin on day 1 was uniformly low. One-third of patients died. Cortisol values in the interstitial fluid remained constant (P = 0.480). Serum total cortisol (P = 0.116) and serum total cortisol/albumin ratio (P = 0.127) were also constant. On day 2 serum-free cortisol was higher than MD-free cortisol. Log MD cortisol correlated strongly with the log serum total cortisol and serum-free cortisol on day 2 correlated well with serum total cortisol. Day 1 log MD cortisol correlated positively with log MD pyruvate and log APACHE II. Day 2 log MD cortisol correlated positively with norepinephrine dose and log SOFA score. There were no other significant correlations of MD cortisol. Conclusions Adipose tissue cortisol is strongly correlated with serum total and free cortisol, suggesting that serum cortisol reflects tissue cortisol availability. The utility of MD in studying cortisol dynamics needs to be further investigated. P412 Early administration of hydrocortisone replacement after advent of septic shock is a major determinant of final outcome C Katsenos1, I Tsagkaris2, A Antonopoulou2, A Savva2, A Michaloglou1, E Giamarellos-Bourboulis3, A Armaganidis2, K Mandragos1 1 Korgialeneio Benakeio Hospital, Athens, Greece; 2University of Athens, Medical School, Athens, Greece; 3Attikon University Hospital, Athens, Greece Critical Care 2011, 15(Suppl 1):P412 (doi: 10.1186/cc9832) Introduction The CORTICUS trial doubts the value of hydrocortisone replacement for final outcome of septic shock [1]. We hypothesized that the time of starting hydrocortisone may impact on the final outcome. Methods Retrospective analysis was made of prospectively collected data for 41 patients with septic shock (ACCP/SCCM 1992 definition) in
Figure 1 (abstract P412). Survival in relation to start of hydrocortisone.
the past year in two ICUs. Hydrocortisone was infused as suggested [2]. The time lapsing from start of vasopressors until start of hydrocortisone was determined by the patients’ charts. Results Early start of hydrocortisone was determined by the quartiles of lapsing time as less than 24 hours. The impact of early start is shown in Figure 1. The mean APACHE II score for patients in early start was 22.09 and for patients in late start was 18.33 (P = NS). Cox regression analysis revealed that the only factor affecting final outcome was early start of hydrocortisone (HR: 4.85, 95% CI: 1.11 to 21.22, P = 0.036) as opposed to appropriateness of antimicrobial treatment (HR: 2.80, 95% CI: 0.56 to 13.91, P = NS). Conclusions Despite the observational approach, early start of hydrocortisone replacement in septic shock is a critical factor for outcome. References 1. 2.
Sprung CL, et al.: N Engl J Med 2008, 358:111. Marik PE, et al.: Crit Care Med 2008, 36:1937.
P413 Low preoperative total lymphocyte count as a predictor of poor outcome in adult cardiac surgery V Lomivorotov, S Efremov, V Boboshko Novosibirsk State Institute of Circulation Pathology, Novosibirsk, Russia Critical Care 2011, 15(Suppl 1):P413 (doi: 10.1186/cc9833) Introduction Evaluation of operational risk is an important goal of perioperative management of patients in cardiac surgery. The aim of this study was to investigate the prognostic value of preoperative total lymphocyte count (PTLC) in peripheral blood as a predictor of postoperative complications and mortality in cardiac surgery. Methods A retrospective observational study of 1,380 adults who were operated on the heart using cardiopulmonary bypass (CPB) in 2009. Patient characteristics, hospital mortality, postoperative complications, ventilation time, ICU and hospital stay were analysed. Patients were divided into four groups depending on their PTLC: <1,000 cells/μl, 40 patients; 1,000 to 1,500 cells/μl, 199 patients; 1,501 to 2,000 cells/μl, 414 patients; and >2,000 cells/μl, 715 patients. Analysis was performed using univariate analysis, Kruskal–Wallace test or Fisher–Freeman– Halton exact test (for qualitative characteristics). Univariate and multivariate logistic regression analysis of in-hospital mortality also were performed. P <0.05 was considered statistically significant. Results PTLC <1,500 cells/μl was associated with significantly higher mortality by univariate (OR = 3.53; CI = 1.98 to 6.28; P <0.0001) and multivariate (OR = 2.06; CI = 1.02 to 4.15; P <0.044) analysis. Low
Critical Care 2011, Volume 15 Suppl 1 http://ccforum.com/supplements/15/S1
preoperative total lymphocyte count was associated with more frequent inotropic support (P <0.001); postoperative heart arrhythmia (P <0.001); dialysis-dependent acute renal failure (P <0.001); and a prolonged ventilation time (P = 0.001), ICU stay (P <0.001), and hospital stay (P = 0.007). Furthermore, patients with low PTLC were readmitted to the ICU more often (P = 0.008). There were no intergroup differences in age and body mass index. Conclusions PTLC is an informative, simple and easily reproducible criterion for evaluating the operational risk in cardiac surgery. However, detailed mechanisms responsible for correlations between preoperative PTLC and cardiovascular morbidity and mortality remain unknown. P414 Usefulness of presepsin (sCD14-ST) measurements as a marker for the diagnosis and severity of sepsis in systemic inflammatory response syndrome T Shozushima, Y Suzuki, T Masuda, G Takahashi, S Endo Iwate Medical University, Morioka, Japan Critical Care 2011, 15(Suppl 1):P414 (doi: 10.1186/cc9834) Introduction CD14 is present in macrophage, monocyte, and granulocyte cells and their cell membranes, and is said to be responsible for intracellular transduction of endotoxin signals. Its soluble fraction is present in blood and is thought to be produced in association with infections. It is called the soluble CD14 subtype (sCD14-ST), and in the text below it will be referred to by its generic name, presepsin. We have previously reported that presepsin is produced in association with infection and that it is specifically expressed in sepsis. In the present study we developed a new rapid diagnostic method using a chemiluminescent enzyme immunoassay, and it made automated measurements in a shorter time possible. Methods The subjects were 41 inpatients (25 males and 16 females), 62 ± 19 years old, who had been brought to the Critical Care and Emergency Center of Iwate Medical University, and who fulfilled at least two of the diagnostic criteria for systemic inflammatory response syndrome (SIRS) on arrival. Blood specimens were collected a total of six times – that is, on admission, and 12 and 24 hours and 3, 5, and 7 days later – and the presepsin values were measured. The sepsis markers PCT, IL-6, and CRP were also measured for comparison. Results The results of using this method to measure presepsin values in different pathological conditions were: normal, 294.2 ± 121.4 pg/ ml; local infection, 721.0 ± 611.3 pg/ml; SIRS, 333.5 ± 130.6 pg/ml; sepsis, 817.9 ± 572.7 pg/ml; and severe sepsis 1,992.9 ± 1,509.2 pg/ ml, and the presepsin values were significantly higher in patients with local infection, sepsis, and severe sepsis than in patients who did not have infection as a complication. In a comparative study with other diagnostic markers of sepsis based on ROC curves, the area under the curve (AUC) of presepsin was 0.845, and higher than the AUC of PCT (0.652), CRP (0.815), or IL-6 (0.672). Conclusions In the present study we were able to obtain results similar to those obtained with the conventional ELISA method, and it was possible to diagnose sepsis more rapidly and conveniently by using the immunoassay analyzer. We are currently using the analyzer in a multicenter clinical study, and are in the process of conducting a further clinical dynamics analysis in various pathological conditions. Based on the results of the present study, it appears that presepsin will soon be widely used as a diagnostic marker of sepsis in clinical settings. P415 Assessment of IL-18 values in septic acute lung injury/acute respiratory distress syndrome patients T Masuda, Y Suzuki, T Shozushima, S Endo Iwate Medical University, Morioka, Japan Critical Care 2011, 15(Suppl 1):P415 (doi: 10.1186/cc9835) Introduction IL-18 is said to be involved in organ injury. We investigated the IL-18 values of septic acute lung injury (ALI) and acute respiratory distress syndrome (ARDS) patients.
S147
Methods The subjects were 38 patients during the 3-year period from 2004 to 2007 from whom it was possible to collect a blood specimen within approximately 6 hours of the onset of septic ALI or ARDS. Their mean age was 67 years, and their mean APACHE II score was 29. Their SOFA score was 13, and their mean PaO2/FiO2 (P/F) ratio was 170. The P/F ratio was 246 in the ALI group and 135 in the ARDS group. There were four cases (10.5%) in the 28-day mortality group, and six cases (15.8%) in the 90-day mortality group. Results The value of IL-18 in the died group was significantly higher than in the survived group (1,649 ± 1,056 pg/ml vs. 4,523 ± 2,798 pg/ ml; P <0.05), and in the ARDS group also significantly higher than in ALI group (2,467 ± 1,880 pg/ml vs. 1,314 ± 800 pg/ml); P <0.05). Conclusions These results suggested that IL-18 may play an major role in progression of ARDS in respiratory disorder as multiple organ failure. P416 Activation of endothelial damage by TNFα and IFNγ in ischemia/ reperfusion injury and systemic inflammation A Golovkin, E Grigoryev, V Matveeva, G Plotnikov, D Shukevich Institute of Complex Problems of Cardiovascular Diseases, Kemerovo, Russia Critical Care 2011, 15(Suppl 1):P416 (doi: 10.1186/cc9836) Introduction The objective was to verify the possibility of endothelial damage induced by cytokines in ischemia/reperfusion (extracorporeal circulation). Methods Forty-one patients were included in the study. All patients diagnosed with coronary artery disease were operated on in the amount of coronary artery bypass grafting under normothermic cardiopulmonary bypass nonpulsed (CB) with cold blood cardioplegia. Systemic inflammatory response (SIRS) was defined as: SIRS I – 57%, SIRS II – 24%, SIRS III – 19%. Ischemia/reperfusion was confirmed by oxygen status and lactate of arterial and mixed venous blood (StatProfile). We investigated by enzyme immunoassay analysis (ELISA): soluble triggering receptor expressed on myeloid cells (sTREM-1), TNFα, IFNγ, soluble vascular cell adhesion molecules (sVCAM-1), soluble intercellular adhesion molecule (sICAM-1), and soluble platelet/ endothelial cell adhesion molecule (sPECAM-1); sets from Bender Medsystems and CanAg. Data are presented as mean ± standard deviation. Results In all patients was reported a decrease in the content of TNFα, and IFNγ (first point – before the extracorporeal circulation, second point – after). However, after the separation of patients according to severity of SIRS, a group of patients with the definition of the three signs of the cellular adhesion molecules (which corresponds to the most severe course of clinical and laboratory manifestations of systemic inflammation) recorded an increase in the concentration of TNFα, as well as sVCAM-1 (4.45 ± 0.9 vs. 8.9 ± 0.9 pg/ml), and sPECAM-1 (3.4 ± 0.9 vs. 6.7 ± 0.9 pg/ml). The level of sICAM-1 increased both in the general population and separately in groups of patients with different levels of expression of the cellular adhesion molecules. Similar results were obtained for the level of sTREM-1. A direct correlation was observed between the level of leading cytokines, the level of sTREM-1 and the level of cell adhesion molecules. Conclusions There is endothelial damage, activated by cytokines, reaching the highest value at SIRS III during ischemia/reperfusion and systemic inflammation. P417 SAPO-1/Fas and sFas-L ratio, level of Bcl-2 and p53 as a predictors of multiple organ dysfunction syndrome in polytrauma A Kiseleva1, E Grigoryev2, Y Churlyaev1, A Radivilko3 1 Branch of the Institute of General Reanimatology, Novokuznetck, Russia; 2 Institute of Complex Problems of Cardiovascular Diseases, Kemerovo, Russia; 3 Medical Academy, Kemerovo, Russia Critical Care 2011, 15(Suppl 1):P417 (doi: 10.1186/cc9837) Introduction The objective was to determine the prognostic significance of serum markers of apoptosis in patients with polytrauma. Methods The study included 34 male patients (38 ± 21 years old) with polytrauma. The severity of patients on admission according to the
Critical Care 2011, Volume 15 Suppl 1 http://ccforum.com/supplements/15/S1
ISS scale was 35 ± 14, on a scale of APACHE II was 26 ± 6, and on the SOFA scale was 7 ± 4. We investigated the serum markers of apoptosis: sAPO-1/Fas (soluble Fas receptor, sFas), sFas-L (soluble Fas ligand), Bcl-2 and p53 (Bender MedSystems, Austria). Data are presented as mean ± standard deviation. Results In patients with severe injury on the first day determined by the initial high level of sAPO-1/Fas (410.9 ± 89.7 pg/ml), which decreased on the second day, while remaining significantly above control values, the component for sAPO-1/Fas was 108 ± 12 pg/ml (P = 0.001). The level of sAPO-1/Fas increased, reaching a maximum on the fifth day (419.5 ± 94.5 pg/ml). The level of sFas-L was initially almost three times higher than the reference values at 48 ± 14 pg/ml, and on the third day rose in parallel to sAPO-1/Fas, reaching a maximum on the fifth day. In response to increased Fas-L, sFas is released. With increased expression of FasL and sFas lack of apoptosis leads to the development of multiple organ failure, and an excess of sFas massive death of lymphocytes may cause immunosuppression. The level of Bcl-2 in serum on the first day was significantly higher than in the control group (7.11 ± 5.55 ng/ml, P = 0.001) and amounted to 26.5 ± 6.3 ng/ml. On the fifth day there was a significant increase in the concentration of Bcl-2 to 39.8 ± 8.8 ng/ml, but by the seventh day the level of Bcl-2 decreased to 22.8 ± 4.3 ng/ ml. Increased levels of p53 induced by hypoxia lead to increased concentrations of Bcl-2. Conclusions The progressive development of multiple organ dysfunction syndrome in polytrauma is associated with serum concentrations of sAPO-1/Fas and sFas-L ratio, Bcl-2 and p53. P418 Sulfonated immunoglobulin improves cardiopulmonary functions by promoting IGF-I production in ARDS patients with severe sepsis Y Deguchi1, H Suga1, T Sato1, N Harada2, T Nakagawa1, K Okajima2 1 Tokyo Women’s Medical University MCE, Tokyo, Japan; 2Nagoya City University Graduate School of Medical Sciences, Aichi, Japan Critical Care 2011, 15(Suppl 1):P418 (doi: 10.1186/cc9838) Introduction It has been emphasized that severe sepsis often leads to shock and ARDS in critically ill patients. We reported previously that sulfonated immunoglobulin (sIG) administration significantly inhibited the increase of in lung MPO activities and the increase of pulmonary vascular permeability. In the present study, we examined whether sIG improves not only ARDS but also cardiovascular dysfunction in patients with severe sepsis. Methods ARDS patients with severe sepsis were divided into two groups, the sIG administrated group and the polyethylene glycoltreated immunoglobulin (pIG) administrated group. We evaluated them by measuring the value of IGF-1, lactate, PF ratio, cathecholamine index, septic severity score (SSS) and SOFA score. Results The serum IGF-1 levels in the sIG group were increased at the seventh day significantly (P <0.05). PF ratios in the sIG group were increased significantly at the seventh day (P <0.05). The serum lactate levels and catecholamine index in the sIG group were decreased significantly at the seventh day (P <0.05). The total score of SSS and SOFA also significantly improved in the sIG group at the seventh day (P <0.05). Conclusions These observations suggest that sIG might improve cardiopulmonary functions by promoting IGF-I production in ARDS patients with severe sepsis. References 1.
2.
3.
Okajima K, et al.: Activation of sensory neurons may contribute to reduction of endotoxin-induced hypotension by releasing CGRP, which is capable of promoting endothelial production of prostacyclin. Crit Care Med 2005, 33:847-854. Harada N, et al.: Capsaicin-induced sensory neuron activation, which leads to release of CGRP, might increase IGF-I production, thereby reducing reperfusion-induced liver injury by reducing apoptosis. Neuropharmacology 2007, 52:1303-1311. Asakura H, et al.: Plasma levels of TNF and IL-6 could be significantly suppressed by immunoglobulin in the LPS-induced DIC model. Moreover, hemostatic abnormality, organ dysfunction, and glomerular fibrin deposition in this model were all ameliorated by immunoglobulin. Crit Care Med 2006, 34:2421-2425.
S148
4.
Harada N, et al.: Stimulation of FcγRI on primary sensory neurons increases insulin-like growth factor-I production, thereby reducing reperfusioninduced renal injury in mice. J Immunol 2010, 185:1303-1310.
P419 Fluorinated groups mediate the immunomodulatory effects of volatile anesthetics in acute pulmonary inflammation M Urner1, I Herrmann2, B Müller-Edenborn1, L Limbach2, W Stark2, B Beck-Schimmer1 1 University Hospital Zurich, Switzerland; 2ETH Zurich, Switzerland Critical Care 2011, 15(Suppl 1):P419 (doi: 10.1186/cc9839) Introduction Volatile anaesthetics are known as immunomodulatory substances in inflammatory as well as in ischemia/reperfusion processes [1,2]. We investigated in a model of acute pulmonary inflammation whether these immunomodulatory effects arise from the ether basic structure or from characteristics in their halogenation. Methods Inflammatory response in pulmonary epithelial and endothelial cells as well as in neutrophils after co-exposure to endotoxin and sevoflurane, diethyl-ether or various water-soluble molecules carrying trifluorinated carbon groups (CF3) was evaluated. Expression of monocyte chemotactic protein-1 and cytokine-induced neutrophil chemoattractant protein-1, IL-6, and IL-8 as a measure of inflammatory activity were analyzed by ELISA. Chemotactic activity of supernatants regarding neutrophil recruitment was assessed. Flow cytometric analysis of neutrophil activation was performed measuring CD11b and CD62L expression. Viability was observed using fluorescence DNA quantitation. Cytotoxicity was evaluated by measuring lactate dehydrogenase in supernatants. Results Expression of inflammatory mediators to lipopolysaccharide stimulation in epithelial and endothelial cells was dose-dependently decreased upon exposure to sevoflurane and other molecules with CF3 groups. This was not observed for diethyl-ether or structure-similar nonfluorinated molecules. In neutrophils, chemotactic activity as well as expression of surface CD11b and CD62L was decreased by molecules carrying CF3 groups. Cytotoxicity could be excluded. Conclusions These findings show that the immunomodulatory effects are not limited to volatile anesthetics, but are associated with a much broader class of CF3 group-containing molecules. The immunomodulatory effects could now be provided in a hydrophilic, injectable formulation for the future treatment of patients suffering from acute pulmonary inflammation in environments not suitable for volatile anesthetics. References 1. 2.
Ross S, et al.: Br J Anaesth 1999, 82:622-632. Voigtsberger S, et al.: Anesthesiology 2009, 111:1238-1248.
P420 Soluble triggering receptor expressed on myeloid cells as a marker of non-infectious systemic inflammatory response syndrome E Grigoryev, A Golovkin, V Matveeva, G Plotnikov, D Shukevich Institute of Complex Problems of Cardiovascular Diseases, Kemerovo, Russia Critical Care 2011, 15(Suppl 1):P420 (doi: 10.1186/cc9840) Introduction The objective was to determine the diagnostic significance of soluble triggering receptor expressed on myeloid cells (sTREM-1) as a marker of the systemic inflammatory response syndrome (SIRS) in ischemia/reperfusion (extracorporeal circulation). Methods Eighty-nine patients were included in the study. All patients were divided into: group 1 (n = 41) – coronary heart disease (CHD), group 2 (n = 47) – acquired heart diseases (AHD). All the operations were performed with normothermal nonpulsatile extracorporeal circulation (EC) with cold blood cardioplegia (coronary artery bypass surgery in the group with CHD and prosthetics/plastic valves for the group with AHD). Systemic inflammatory response (SIRS) was defined by Bone and colleagues [1]; ischemia and reperfusion by lactate and oxygen status of arterial and mixed venous blood (StatProfile). We studied by enzyme immunoassay level (ELISA): high-sensitivity C-reactive protein (hsCRP), procalcitonin (PCT-Q) and sTREM-1, using
Critical Care 2011, Volume 15 Suppl 1 http://ccforum.com/supplements/15/S1
the sets by Bender Medsystems, CanAg and Brahms PCT-Q. Data are presented as mean ± standard deviation. Results All patients registered the increased level of hsCRP, without significant difference between the two groups. At the point after the operation, the rate of hsCRP was significantly higher for the group AHD. Correlations were noted between levels of hsCRP and the frequency of occurrence of criteria for SIRS (r = 0.22 for the group of IHD, P = 0.03; r = 0.39 for the group AHD, P = 0.01). The odds ratio (OR) likelihood of SIRS complications on hsCRP was 2.4 in the group with CHD and 3.9 in the group with AHD. There was no significant difference between the rates of PCT for the corresponding points of comparison groups. The highest predictive value (OR = 2.9, P = 0.03) has a PCT in relation to the severity of SIRS in patients with AHD (infectious endocarditis and rheumatic heart disease). The sTREM-1 level was higher compared with the postoperative period (55.5 ± 8.8 vs. 77.8 ± 9.1 pg/ml, P = 0.005; 49.9 ± 6.7 vs. 87.5 ± 8.9 pg/ml, P = 0.004). We studied the correlation between the level of sTREM-1 and the frequency of occurrence of symptoms SIRS (r = 0.77 for the group of IHD, P = 0.002; r = 0.79 for the group AHD, P = 0.04). The OR sTREM-1 probability of SIRS complications was highest in comparison with all of the markers. Conclusions sTREM-1 has the greatest diagnostic significance in relation to non-infectious SIRS in ischemia/reperfusion. References 1.
Bone RC, Balk RA, Cerra FB, et al.: Definitions for sepsis and organ failure and guidelines for the use of innovative therapies in sepsis. The ACCP/SCCM Consensus Conference Committee. American College of Chest Physicians/ Society of Critical Care Medicine. Chest 1992, 101:1644-1655.
S149
P422 The normobaric oxygen paradox: does it increase haemoglobin? S Theunissen1, D De Bels2, J Devriendt2, P Germonpré3, P Lafere3, J Valsamis2, T Snoeck1, P Meeus1, C Balestra1 1 ISEK Environmental Physiology Laboratory, Brussels, Belgium; 2Brugmann University Hospital, Brussels, Belgium; 3Queen Astrid Military Hospital, Brussels, Belgium Critical Care 2011, 15(Suppl 1):P422 (doi: 10.1186/cc9842) Introduction A novel approach to increase erythropoietin (EPO) using oxygen has been reported in healthy volunteers. The purpose of this study is to investigate whether the EPO increase is sufficient to induce erythropoiesis. Methods We compared exposure to daily versus every other day oxygen administration on haemoglobin variation during a 12-day period. Each subject underwent the two protocols at a 6-week interval period to achieve the same baseline values. Results See Figure 1. Nine subjects underwent the study. We observed a significant increase in haemoglobin values in the every other day group compared with the each day group and with baseline. At the end of each day period, haemoglobin values increased to achieve a significant difference as compared with baseline. There was a significant rise of reticulocytes in the every other day group as compared with the each day group (182 ± 94% vs. 93 ± 34%, P <0.001). These data provide demonstration of an enhanced production of erythrocytes.
P421 Anemia profile in critical septic patients hospitalized in the ICU M De la Torre-Prados1, A García-de la Torre1, J Rodriguez-Vidal1, M Nieto-Gonzalez1, C Ortiz-García2, A García-Alcántara1 1 Hospital Virgen de la Victoria, Málaga, Spain; 2Hospital Reina Sofía, Córdoba, Spain Critical Care 2011, 15(Suppl 1):P421 (doi: 10.1186/cc9841) Introduction The aim was to describe the anemia profile of medical or surgical patients with severe sepsis or septic shock in the ICU, assessing severity scale, length of stay and mortality. Methods From January to May 2009, we prospectively selected 79 patients; we excluded hematologic disease. Two groups were established: medical (n = 52, 65.8%) and surgical (n = 27, 34%) septic patients. The microcytic anemia profile was set in the first 24 hours: CBC, transferrin, serum iron concentration, transferrin saturation index (TSI) and ferritin. There is anemia when haemoglobin (Hb) is <12.5 g/dl (severe when <10 g/dl); mean corpuscular volume (MCV) <80 fl; ferritin <30 ng/ml; TSI <20%; serum iron <50 μg/dl. The reference values of transferrin are 200 to 360 mg/dl. The program used for the data processing and statistical analysis was SPSS. Results The mean age was 60 ± 17 years, 60% were men, APACHE II was 23.46 ± 6.7 and SOFA 9.68 ± 2.93; the length of stay in the ICU was 9.3 ± 5.7 days and 20.3% of mortality. The average values related to microcytic anemia were Hb = 10.02 ± 1.8 g/dl, serum iron = 36 ± 25 μg/dl, MCV = 88.37 fl and TSI = 20.29%. The prevalence of microcytic anemia in our septic patients was 53.8%. In both studied groups we found significant differences in the SOFA (10.17 vs. 8.7, P = 0.03) and in transferrin (147 mg/dl vs. 114 mg/dl, P = 0.002). The length of stay was higher in the surgical patients (P = NS). The mortality showed significant differences in age (58 vs. 66, P = 0.03), APACHE II (22 vs. 27, P = 0.01), SOFA (9 vs. 12, P = 0.0001) and in Hb (10.2 vs. 9.3, P = 0.08) and transferrin (141 vs. 117, P = 0.02). Conclusions The prevalence of microcytic anemia is more than one-half of our septic patients. There are iron metabolism disorders without significant differences between medical and surgical patients. Transferrin, a protein related to malnutrition, inflammatory response and organ dysfunction, is significantly lower in the most severe patients with higher organ dysfunction scores.
Figure 1 (abstract P422). Comparison between haemoglobin variations after 30 minutes of 100% O2 breathing every day or every other day. **Statistically significant difference from baseline (P <0.01) for oxygen breathing every other day (protocol B). §§Statistically significant difference from baseline (P <0.01) for Oxygen breathing each day (protocol A).
Conclusions The normobaric oxygen paradox seems effective to increase haemoglobin in non-anaemic healthy volunteers assuming there is a sufficient time interval between the two oxygen applications. This could permit interesting clinical applications in perioperative medicine as an adjunct therapy to EPO for blood predonation. P423 Transfusion of red blood cells does not increase transcutaneous oxygen tension O Schlager, M Gschwandtner, M Nikfardjam, R Koppensteiner, G Heinz Medical University Vienna, Austria Critical Care 2011, 15(Suppl 1):P423 (doi: 10.1186/cc9843) Introduction We investigated the skin oxygen tension (tcpO2) of critically ill patients before, during and after transfusion (XF) of packed red blood cells (RBC). Methods Nineteen critically ill patients (11 men, age 67 ± 15 years, SAPS II 60.1 ± 19) who received 2 U RBC due to hemoglobin (Hb) <8 g/l underwent measurement of tcpO2 (TCM400; Radiometer Ltd,
Critical Care 2011, Volume 15 Suppl 1 http://ccforum.com/supplements/15/S1
S150
not developing lung injury). Plasma levels of sCD40L were measured before surgery and at onset of TRALI. Results (1) Infusion of MHC-1 Ab resulted in pulmonary edema, accompanied by elevated BALF levels of total protein and KC and MIP-2 compared with infusion of isotype Ab (P <0.05 to all). Treatment with ciglitazone or anti-CD40L Ab did not result in a decrease of pulmonary edema compared with MHC-1 Ab, nor did it reduce BALF KC levels (33 ± 6.1 vs. 27 ± 19 vs. 13 ± 9.4 ng/ml respectively) and MIP-2 levels (5.3 ± 3.0 vs. 1.5 ± 1.7 vs. 2.0 ± 2.9 ng/ml respectively). (2) Surgery resulted in a decrease in sCD40L levels, with a concomitant decrease in platelet count. We found no difference in plasma levels of sCD40L between cardiac surgery patients developing TRALI and controls (275 ± 192 vs. 258 ± 346 and 93 ± 82 vs. 93 ± 123 pg/ml respectively, NS). Conclusions CD40L does not play a role in this model of antibodymediated TRALI. Moreover, sCD40L levels are not different in cardiac surgery patients developing TRALI compared with transfused controls, further suggesting that sCD40L is not a mediator of TRALI. References 1. 2.
Khan et al.: Blood 2006, 108:2455-2462. Vlaar et al: Intensive Care Med 2010, 36:879-887.
Figure 1 (abstract P423).
Copenhagen, Denmark) at the dorsum of one hand. Each patient served as her/his own control (baseline, after XF of 1, and second RBC). Ventilation and pressors were kept constant. Patients with bleeding, in shock and with circulatory assists were excluded. Cardiac index (CI) was determined by FloTrac™/Vigileo™. Results Hb significantly increased (P <0.002), while tcpO2 was not significantly different throughout XF (Figure 1; P = 0.72). Arterial pO2 (86 ± 14 vs. 91 ± 11 vs. 88 ± 18 mmHg, P = 0.68) and global hemodynamics (CI, P = 0.89, Figure 1; SVR: 822 ± 360 vs. 703 ± 233 vs. 941 ± 410, P = 0.13) did not change. Oxygen delivery (DO2) significantly increased (644 ± 188 vs. 744 ± 234 vs. 818 ± 214 ml/minute, P = 0.049). Interestingly, central venous oxygen saturation (ScvO2) decreased significantly during XF and did not completely recover until the end of XF (P <0.05 midst XF vs. baseline; Figure 1). Conclusions XF significantly increased Hb and calculated DO2 but not true tcpO2. Increase in DO2 occurred in the absence of changes in CI and oxygenation. ScvO2 significantly decreased during XF but did not completely recover until the end of the study period. P424 Role of CD40 ligand in transfusion-related acute lung injury PR Tuinman1, M Gerards1, G Jongsma1, L Boon2, AP Vlaar1, NP Juffermans1 1 Academic Medical Center, Amsterdam, the Netherlands; 2Bioceros, Utrecht, the Netherlands Critical Care 2011, 15(Suppl 1):P424 (doi: 10.1186/cc9844) Introduction Transfusion-related acute lung injury (TRALI) is an important problem in the critically ill. CD40L has been implicated as a cofactor or even the cause of TRALI [1]. (1) We hypothesized that blocking of the CD40–CD40L interaction protects against lung injury in a murine model of TRALI. (2) Furthermore, we hypothesized that plasma sCD40 levels are elevated in TRALI patients compared with controls. Methods (1) Male BALB/c mice (n = 96) were challenged with monoclonal MHC-1 antibody (Ab), a previously used murine TRALI model [2]. In separate experiments, mice were pretreated with Ciglitazone, an inhibitor of the expression of CD40L on platelets, or anti-CD40L Ab, which antagonizes CD40L–CD40 interaction. Controls received vehicle or isotype Ab. After 2 hours, mice were killed and bronchoalveolar lavage fluid (BALF) was obtained. The wet lung to body weight ratio was calculated. Total protein, keratinocyte-derived chemokine (KC) and macrophage-inflammatory protein-2 (MIP-2) were measured in BALF. (2) Cardiac surgery patients were prospectively followed for the onset of TRALI (by applying the consensus definition). Sixteen TRALI cases were compared with controls (transfused patients
P425 Tissue oxygen monitoring leads to lower rates of blood transfusions A Loukas, C Matadial, J Yapor, R Martinez-Ruiz University of Miami, FL, USA Critical Care 2011, 15(Suppl 1):P425 (doi: 10.1186/cc9845) Introduction Evidence exists that blood transfusions may be more harmful for patients than once suspected [1]. Optimal goals for transfusion therapy remain elusive. Lower rates of blood transfusion seem to lead to better patient outcomes. Tissue oxygenation monitoring may offer a novel insight into blood transfusion requirements as it represents an indication of oxygen content further down the oxygen cascade than the blood oxygen content defined by pulse oximetry and hematocrit. Our hypothesis is that the use of this monitor may define a safer, lower threshold for blood transfusion that may lead to decreased transfusion rates. Methods We performed chart reviews of 100 patients who underwent cardiac surgery (coronary artery bypass graft surgery and valvular surgery) with heart–lung bypass. The first 50 surgeries were performed with standard hemodynamic monitors and intraoperative transesophageal echocardiography. Indications for transfusion included ongoing bleeding, hematocrit less than 20% with a heart rate over 95 bpm or blood pressure less than 90 mmHg systolic. The subsequent 50 cases consisted of a similar patient population, surgical indications and medical group; however, the use of the Hutchinson InSpectra tissue oxygen monitor intraoperatively and postoperatively was employed. Our review sought to identify whether the transfusion threshold criteria were modified due to the availability of this additional monitoring information. Results A lower hematocrit value was found to be tolerated as long as tissue oxygen values were within an acceptable range; that is, above 70% or less than a 20% drop from baseline. There was a statistical difference between transfusion rates, in the first group was 30% and in the second group was 18%. This represents a relative decrease of nearly 50% in blood transfusions. Outcomes in both groups were identical. The mortality rate was nil. There was no significant difference between outcomes or length of stay. Conclusions Although optimal goals for blood transfusion remain elusive, it does appear that even slight overtransfusion may be detrimental [1]. The tissue oxygen monitor appears to define a new, lower safe threshold for transfusion. An outcome benefit will probably be observed in future studies. Long-term outcome benefits from the routine implementation of this device have already been suggested in the trauma [2] and intensive care [3] settings. References 1. 2. 3.
Bennett-Guerrero et al.: JAMA 2010, 304:1568-1575. Cohn et al.: J Trauma 2007, 62:44-53. Ikossi et al.:J Trauma 2007, 61:780-790.
Critical Care 2011, Volume 15 Suppl 1 http://ccforum.com/supplements/15/S1
P426 Central venous to arterial carbon dioxide gap as an indicator of oxygen debt in isovolemic anemia S Kocsi, G Demeter, D Erces, J Kaszaki, Z Molnar University of Szeged, Hungary Critical Care 2011, 15(Suppl 1):P426 (doi: 10.1186/cc9846) Introduction Anemia can cause an imbalance in oxygen delivery (DO2) and consumption (VO2), which may be difficult to detect. Recently the venous to arterial carbon dioxide difference has been shown to be increased (>5 mmHg) in certain critically ill conditions [1,2]. No study has yet investigated its significance in severe normovolemic anemia. Therefore, the aim of this study was to investigate the course of the central venous to arterial carbon dioxide gap (dcvCO2) in isovolemic anemia. Methods An experimental animal study on anesthetized Vietnamese mini-pigs. After splenectomy, mini-pigs (n = 13, weight range: 18 to 30 kg) were bled in five stages (~10% of estimated blood volume/5 minutes, T0 to T5) and blood loss was replaced by the same volume of colloid, after which hemodynamic measurements and blood gas analysis were performed. Results The fall of hemoglobin was significant from the first bleeding, from T0 to T5: median = 125 (interquartile range = 113 to 134) to 49 (43 to 55) g/l, P <0.05, respectively. Despite a significant increase in cardiac index by T1 (T0 = 2.6 (2.3 to 2.8) vs. T1 = 3.3 (2.7 to 3.6) l/minute/ m2, P <0.05), which remained so for the rest of the experiment, the O2 extraction (VO2/DO2) increased significantly only from T3 (T0 = 29 (18 to 33) vs. T3 = 35 (21 to 40)%, P <0.05). Anemia was accompanied by a significant increase in dcvCO2 from T0 = 5 (3 to 9) to T5 = 6 (6 to 11) mmHg, P <0.05. There was a strong significant correlation between VO2/DO2 and dcvCO2: r = 0.65, r2 = 0.43, P <0.001. Furthermore, dcvCO2 with a cut-off value >5 mmHg had a sensitivity of 69% and specificity of 82% to show a VO2/DO2 >30%, and receiver operating characteristics showed an area under the curve of 0.787 ± 0.054 (CI: 0.682 to 0.892), P <0.001, for the same VO2/DO2 threshold. Conclusions To our best knowledge, this is the first study to show that dcvCO2 could be used to detect oxygen debt in isovolemic anemia. References 1. 2.
Scalea TM, et al.: J Trauma 1990, 30:1539-1543. Vallée F, et al.: Intensive Care Med 2008, 34:2218-2225.
P427 Blood transfusion during cardiac surgery dose-dependently stimulates inflammation and coagulopathy in the lung: a case– control study PR Tuinman1, AP Vlaar1, AD Cornet2, JJ Hofstra1, M Levi1, JC Meijers1, A Beishuizen2, MJ Schultz1, JB Groeneveld2, NP Juffermans1 1 Academic Medical Center, Amsterdam, the Netherlands; 2VU University Medical Center, Amsterdam, the Netherlands Critical Care 2011, 15(Suppl 1):P427 (doi: 10.1186/cc9847)
S151
Restrictive transfusion was associated with increased pulmonary levels of plasminogen activator inhibitor-1 compared with nontransfused controls with a further increase after multiple transfusions (P <0.001; 3.4 (1.2) vs. 4.4 (1.4) vs. 6.3 (2.5) ng/ml, respectively). Concomitantly, levels of plasminogen activator activity (PAA%) were lower (P <0.001; 42 (6.5) vs. 34 (6.5) vs. 32 (7.8)%, respectively), indicating impaired fibrinolysis. In the systemic compartment, transfusion was associated with a significant increase in levels of TNFα, TATc and PAA (P <0.05). Conclusions Transfusion during cardiac surgery is associated with activation of inflammation and coagulation in the pulmonary compartment of patients who do not meet TRALI criteria, an effect that was partly dose dependent, suggesting transfusion as mediator of acute lung injury. These pulmonary changes were accompanied by systemic coagulopathy. P428 Red blood cell transfusion thresholds in pediatric septic patients O Karam1, M Tucci2, T Ducruet2, H Hume2, J Lacroix2, F Gauvin2 1 Hopitaux Universitaires de Genève, Switzerland; 2CHU Sainte-Justine, Montréal, Canada Critical Care 2011, 15(Suppl 1):P428 (doi: 10.1186/cc9848) Introduction In children with severe sepsis or septic shock, the optimal red blood cell (RBC) transfusion threshold is unknown. We analyzed the subgroup of patients with sepsis in the TRIPICU (Transfusion Requirements in Pediatric Intensive Care Units) study in order to determine the impact of a restrictive versus liberal transfusion strategy on clinical outcome. Methods This study is a subgroup analysis of a prospective multicenter randomized controlled trial (TRIPICU). One hundred and thirty-seven stabilized critically ill children (mean systemic arterial pressure >2 SD below normal mean for age and cardiovascular support not increased for at least 2 hours before enrolment), with a hemoglobin ≤9.5 g/ dl within 7 days after PICU admission, were randomized to receive RBC transfusion if their hemoglobin dropped below either 7.0 g/dl (restrictive group) or 9.5 g/dl (liberal group). Results In the restrictive group (69 patients), 30 patients did not receive any RBC transfusion, whereas only one patient in the liberal group (68 patients) was never transfused (P <0.01). No clinically significant differences were found for the occurrence of new or progressive multiple organ dysfunction syndrome (18.8% vs. 19.1%; P = 0.97), for PICU length of stay (P = 0.74) or PICU mortality (P = 0.44) in the restrictive versus liberal group. Conclusions In this subgroup analysis of stable septic children, we found no evidence that a restrictive red-cell transfusion strategy, as compared with a liberal one, increased the rate of new or progressive MODS. On the other hand, a restrictive transfusion threshold significantly reduced exposure to blood products. Our data suggest that a hemoglobin level of 7 g/dl may be safe for stabilized septic children but further studies are required to support this recommendation. Reference 1.
Introduction Blood transfusion is associated with increased morbidity and mortality in cardiac surgery patients, but the cause and effect relation remains unknown. We hypothesized that blood transfusion is associated with changes in pulmonary and systemic inflammation and coagulopathy, occurring in patients who do not meet the clinical diagnosis of transfusion-related acute lung injury (TRALI). Methods We performed a case–control study in an ICU of a university hospital. Cardiac surgery patients were grouped as having received no transfusion (n = 17), restrictive transfusion (1 to 2 units) (n = 18) or multiple transfusions (≥5 units) (n = 10). Bronchoalveolar lavage fluid (BALF) and blood were obtained postoperatively. Data are presented as median (IQR). Results Restrictive transfusion increased BALF levels of IL-1β compared with nontransfused controls (P <0.05), and levels were further enhanced by multiple transfusion (P <0.01; 2.9 (9.4) vs. 9.5 (35) vs. 15 (148) pg/ml, respectively). BALF levels of IL-8, TNFα and thrombin–antithrombin complex (TATc) were increased after multiple transfusion compared with nontransfused controls (P <0.01, P <0.001 and P <0.01 respectively), but not after restrictive transfusion.
Lacroix J, et al.: Transfusion strategies for patients in pediatric intensive care units. N Engl J Med 2007, 356:1609-1619.
P429 Accuracy of a continuous non-invasive hemoglobin monitor in the ICU D Frasca, C Dahyot-Fizelier, C Karen, Q Levrat, N Soumagne-Vialle, M Boisson, B Debaene, O Mimoz CHU Poitiers, France Critical Care 2011, 15(Suppl 1):P429 (doi: 10.1186/cc9849) Introduction The non-invasive pulse CO-oximeter provides an immediate and continuous estimation of hemoglobin concentration non-invasively, and so has the potential to improve ICU patient care. We determined whether non-invasive hemoglobin measurement by pulse CO-oximetry could provide clinically acceptable absolute and trend accuracy in critically ill patients, compared with other invasive methods of hemoglobin assessment available at bedside and the gold standard, the laboratory analyzer.
Critical Care 2011, Volume 15 Suppl 1 http://ccforum.com/supplements/15/S1
S152
Methods A prospective study was conducted in the surgical ICU of a university teaching hospital. Blood samples from subjects continuously monitored with pulse CO-oximetry (SpHb) were analyzed for hemoglobin concentration determination by a point-ofcare device (HemoCue301, HbHC), satellite laboratory CO-oximetry (Siemens RapidPoint 450, HbABG) and a laboratory hematology analyzer (Sysmex XT-2000i, tHB), which was considered the reference device. Hemoglobin values reported from the invasive methods were compared with the values reported by the Masimo Radical-7 Pulse COOximeter at the time of the blood draw. Results Sixty-two patients requiring 471 blood samples were included. Compared with the reference method, the bias and limits of agreement were 0.0 ± 1.0 g/dl for SpHb, 0.3 ± 1.3 g/dl for HbHC and 0.9 ± 0.6 g/dl for HbABG compared with the reference device. Accuracy assessed with ARMS was 0.8 g/dl for SpHb and 1.1 g/dl for HbABG and HbHC. Pulse CO-oximetry showed similar trend accuracy as CO-oximetry, whereas the point-of-care device did not follow the trend of the laboratory device as well as the other analyzers. See Table 1. Table 1 (abstract P429). Accuracy summary of test devices compared with laboratory hematology analyzer SpHb vs. tHb Bias (g/dl) Agreement(g/dl) ARMS (g/dl)
HbHC vs. tHb
HbABG vs. tHb
0.0
–0.3
–0.9
–1.0 to 0.9
–1.6 to 1.0
–1.6 to –0.3
0.8
1.1
1.1
Conclusions When compared with laboratory reference values, hemoglobin measurement with pulse CO-oximetry has absolute and trending accuracy similar to widely used, invasive methods such as CO-oximetry and a point-of-care device. Hemoglobin measurement with pulse CO-oximetry has the additional advantages of providing continuous measurements, non-invasively, which may facilitate hemoglobin monitoring in the ICU. P430 Safety and effectiveness of different treatment regimes with tranexamic acid in elective cardiopulmonary bypass patients JL Iribarren, JJ Jimenez, M Brouard, C Llanos, J Cabrera, L Lorenzo, R Perez, S Palmero, N Perez, L Lorente, M Mora, R Martinez Hospital Universitario de Canarias, La Laguna, Spain Critical Care 2011, 15(Suppl 1):P430 (doi: 10.1186/cc9850)
groups regarding the development of stroke (1.3 to 2.5%), RIFLE: I (2.5 to 7.5%) and seizures (0 to 2.5%), even though seizures were present in a dose-dependent fashion. Conclusions A dose higher than 25 mg/kg before and after CPB does not show a clinically relevant decrease in blood loss with a potential increase of adverse events, particularly the observation of seizures. P431 Anticoagulant effect of prothrombin complex concentrates: a whole blood in vitro study G Scharbert1, U Thaler1, C Weilnböck1, L Wetzel1, S Kozek-Langenecker2 1 Medical University Vienna, Austria; 2Evangelical Hospital, Vienna, Austria Critical Care 2011, 15(Suppl 1):P431 (doi: 10.1186/cc9851) Introduction Prothrombin complex concentrates (PCCs) are currently used to treat congenital or acquired coagulation factor deficiency. PCC preparations mostly contain heparin to prevent thromboembolic events. In factor VIII and IX deficient plasma, Takeyama and colleagues observed in vitro a heparin effect of PCCs [1]. The aim of the present experiment was to investigate anticoagulant effects of PCCs at clinically relevant concentrations in whole blood. In an in vitro experiment we compared the PCC preparation used in the experiments of Takeyama and colleagues with a new heparin-free PCC preparation. Methods After ethics committee approval and informed consent, citrated whole blood was obtained from 10 healthy volunteers. Two commercially available PCCs were tested: heparin-containing Prothromplex® (Baxter, Austria) and heparin-free Cofact® (Sanquin, the Netherlands) at concentrations of 0.3125, 0.625 and 1.25 IU/ml. Protamine was added to another set of samples (1:1 heparin:protamine). For global coagulation monitoring we used the NATEM test in the rotational thrombelastometry ROTEM® (Pentapharm, Germany). Results In the heparin PCC preparation we observed a significant concentration-dependent prolongation in coagulation time (CT) and coagulation formation time (CFT), even at the lowest concentration. The maximum clot firmness (MCF) was significantly reduced too. Heparindependent anticoagulation was reversible by protamine. The heparinfree PCCs did not affect onset of coagulation. The interpretation of the α-angle showed no increased thrombus formation in heparin-free PCC preparation. Conclusions Our results confirm and extend the report of Takeyama and colleagues. At clinical relevant concentrations, PCC has an anticoagulant effect. The heparin content of PCCs should be considered in the clinical routine. Reference 1.
Introduction Although tranexamic acid (TA) has been effective in reducing bleeding after cardiac surgery, the TA dosing scheme varies extremely and the agent is highly overdosed in most relevant trials. In a dose-dependent fashion, TA is associated with an increase of adverse events, particularly the observation of seizures. In this study we aimed to assess the safety and effectiveness of different treatment regimes of TA in cardiopulmonary bypass (CPB) patients. Methods A cohort study. The TA treatment regimes were: A: none, B: 40 mg/kg before CPB, C: 25 mg/kg before and 25 mg/kg after CPB, and D: 40 mg/kg before and after CPB. Demographic variables, comorbidity, perioperative clinical data, and postoperative outcomes (bleeding, RIFLE classification, seizures, stroke and mortality) were recorded. SPSS v15 was used. Results We studied four hundred and five patients (66, 80, 179 and 80 in the A, B, C and D groups, respectively). Surgical procedures were 209 (52%) coronary artery bypass grafting, 135 (33%) valvular, 41 (10%) combined surgery and 20 (5%) other procedures. The 24-hour postoperative bleeding was: A: 992 (95% CI = 808 to 1,177) ml; B: 829 (95% CI = 708 to 950) ml; C: 686 (95% CI = 607 to 765) ml; and D: 671 (95% CI = 550 to 793) ml (F: 18.98, P <0.001). The post-hoc analysis (Scheffé test) showed significant differences between group A versus group C (P = 0.002), and between group A versus group D (P = 0.003). The 24-hour postoperative red blood cell requirements were A: 384 (95% CI = 248 to 520) ml; B: 200 (95% CI = 119 to 280) ml; C: 253 (95% CI = 184 to 323) ml; and D: 156 (95% CI = 82 to 231) ml (χ2: 8.24 P = 0.041). We did not find significant differences after surgery between
Takeyama et al.: Blood Coagul Fibrinolysis 2007, 18:1-7.
P432 Failure to correct the international normalized ratio in patients with anticoagulant-related major bleeding is associated with increased 90-day mortality J Menzin1, L White1, M Friedman1, C Nichols1, JA Menzin1, C Jones2, J Hoesche2 1 Boston Health Economics, Inc., Waltham, MA, USA; 2CSL Behring, King of Prussia, PA, USA Critical Care 2011, 15(Suppl 1):P432 (doi: 10.1186/cc9852) Introduction Supratherapeutic international normalized ratio (INR) levels have been shown to be a significant predictor of death among patients with anticoagulant-related (ACR) intracranial hemorrhage (ICH). We assessed factors associated with 90-day mortality and time to death in patients receiving fresh frozen plasma (FFP) for ACR major bleeding in clinical practice. Methods A retrospective analysis was undertaken using electronic medical records from an integrated system. Patients who received FFP between 1 January 2004 and 31 December 2010, and who met the following criteria were selected: major hemorrhage diagnosis the day before to the day after initial FFP administration; INR ≥2 on the day before or the day of FFP and another INR result up to 1 day after FFP; and warfarin supply within 90 days prior to hospitalization. INR correction (defined as INR ≤1.3) was evaluated at the last available
Critical Care 2011, Volume 15 Suppl 1 http://ccforum.com/supplements/15/S1
test up to 1 day following FFP start. Patients dying within 72 hours surrounding FFP were excluded. Kaplan–Meier survival curves were estimated and time to death was assessed using Cox proportional hazards models. In sensitivity analysis, an INR threshold ≤1.5 was used to account for clinical practices that aim to avoid adverse outcomes (for example, thrombosis) of certain co-morbidities. Results A total of 405 patients met the selection criteria (mean age 75 years, 53% male), and 67% remained uncorrected. Overall, 19% of patients died within 90 days of hospital admission, with a higher proportion of uncorrected versus corrected patients dying (24% vs. 13%, P = 0.013). In Cox regression analysis, patients with a first elevated INR value >4 (HR = 2.21; 95% CI = 1.36 to 3.60), with an ICH bleed versus gastrointestinal or other bleed (HR = 2.08; 95% CI = 1.27 to 3.40), and with uncorrected INR (HR = 2.33; 95% CI = 1.30 to 4.16) were significantly more likely to die within 90 days of admission. In a sensitivity analysis (correction defined as INR ≤1.5), 39% remained uncorrected within 24 hours of FFP administration, with factors predicting 90-day mortality remaining robust in regression analysis. Conclusions Among ACR major bleed patients, not correcting to either INR ≤1.3 or INR ≤1.5 with FFP is associated with an increased rate of mortality at 90 days. Further assessment of co-morbidities associated with hemostasis and other predictors of mortality risk in this population is warranted. P433 Thromboembolic risks of recombinant factor VIIa use in warfarin-associated intracranial hemorrhage S Chou, X Cai, R Konigsberg, L Bresette, G Henderson, F Sorond, A Ropper, S Feske Brigham and Women’s Hospital, Boston, MA, USA Critical Care 2011, 15(Suppl 1):P433 (doi: 10.1186/cc9853) Introduction Recombinant factor VIIa (rFVIIa) may produce rapid hemostasis in warfarin-associated intracerebral hemorrhage (WICH) but may carry high thromboembolic risks. We compared baseline thromboembolic risk factors and thromboembolism rates in WICH patients treated with rFVIIa to those treated with FFP and vitamin K alone. Methods We identified 45 consecutive WICH patients treated with rFVIIa and 34 treated with FFP and vitamin K, and compared their incidence of pre-existing thromboembolic risk factors, troponin elevation, EKG changes, ischemic stroke, pulmonary embolism (PE), and deep vein thromboses (DVT). Results Both rFVIIa-treated and control WICH patients have high prevalence of pre-existing thromboembolic risk factors including atrial fibrillation (73% vs. 68%), DVT/PE (10% vs. 6%), coronary artery disease (CAD) (38% vs. 32%), and abnormal EKG (78% vs. 85%). Troponin elevation is common in WICH and incidence of troponin elevation (47% vs. 41%) and clinically significant myocardial infarction (MI) (13% vs. 6%) are similar between treatment groups. Past history of CAD (P = 0.0061) and baseline abnormal EKG (P = 0.02) were independently associated with clinically significant MI following WICH. Incidence of DVT/PE (2% vs. 9%) and ischemic stroke (2% vs. 0%) are comparable between rFVIIa-treated and control groups. Recombinant FVIIa-treated patients had lower mean INR at 3 (P = 0.0001) and 6 hours (P <0.0001) and received fewer units of FFP transfusion (3 vs. 5; P = 0.003). Conclusions Recombinant FVIIa use in WICH is not associated with increased thromboembolic complications compared with FFP and vitamin K alone and may decrease the quantity of FFP use. A prospective randomized study is necessary to determine whether rFVIIa improves outcome of WICH. P434 Does the coagulation profile really matter in central venous cannulation? A review of the literature J Baombe, L Sultan, B Foex Manchester Royal Infirmary, Manchester, UK Critical Care 2011, 15(Suppl 1):P434 (doi: 10.1186/cc9854) Introduction There is great variation in practice and opinions regarding the safety in inserting central venous lines in patients with
S153
coagulopathy. The authors reviewed the medical literature reporting the incidence of complications (haemorrhagic and nonhaemorrhagic) following the insertion under ultrasound guidance of a central venous line. Methods The authors searched the MEDLINE and Embase databases for relevant terms. The MEDLINE database (1950 to week 2 December 2010) was explored with the terms central line, catheterization, coagulopathy, blood coagulation disorder, international normalized ratio, thrombocytopenia with their appropriate combinations and truncated terms. The Embase database (1980 to week 2 December 2010) was searched with the terms central venous catheter, blood clotting disorder, thrombocytopenia, international normalized ratio, complications with their appropriate combinations and truncated terms. Both searches were limited to English language, humans and adults only. Results We found 413 papers with the MEDLINE search strategy. After abstract review and critical appraisal, only five articles were deemed to be directly relevant to our question and of level of evidence high enough to be considered. These were included in our final summary table. The Embase search returned 257 papers, only one relevant but also a duplicate from the previous search. Conclusions The retrieved studies seem to suggest that the insertion of central lines under ultrasound guidance do not require correction of haemostatic abnormalities prior to intervention. Rates of haemorrhage are low in patients with elevated prothrombin time, activated partial thromboplastin time, international normalized ratio or low thrombocyte count and appear to be closely related to the level of experience of the physician rather than the defects of haemostasis. P435 Monitoring of coagulation in patients after abdominal cancer surgery O Tarabrin1, V Suslov1, S Kalinchuk2, S Shcherbakov1, D Gavrychenko1 1 Odessa National Medical University, Odessa, Ukraine; 2Odessa Regional Clinical Hospital, Odessa, Ukraine Critical Care 2011, 15(Suppl 1):P435 (doi: 10.1186/cc9855) Introduction Despite the evidence of perioperative hypercoagulability in cancer patients, there are no consistent data evaluating the extent, duration, and specific contribution of platelets and procoagulatory proteins by in vitro testing. This study compared efficacy of haemoviscoelastography (HVG) versus thromboelastography for monitoring of coagulation imbalance. Methods A total of 536 patients undergoing open surgery for abdominal cancer received HVG, a viscoelastic test, which measures clot formation and includes information on the cellular as well as the plasmatic coagulation system. We examined the efficacy of a variety of coagulation tests. A complete coagulation screen activated clotting time (ACT), thromboelastography (TEG) and HVG were performed before surgery, at the end of surgery, and bemiparin anticoagulation monitoring on postoperative days 1, 2, 3, and 7. These were analyzed for the reaction time and the maximal amplitude (MA). Results We calculated the elastic shear modulus of standard MA and HVG MA, which reflect the total clot strength and procoagulatory protein component, respectively. The difference was an estimate of the platelet component. There was a l6% perioperative increase of standard MA, corresponding to a 49% increase of HVG MA (P <0.05) and a 79 to 85% contribution of the calculated platelet component to HVG MA. We conclude that serial standard thromboelastography and HVG may reveal the independent contribution of platelets and procoagulatory proteins to clot strength. Using multiple linear regressions, all coagulation, TEG and HVG variabilities were used to model postoperative hypercoagulation. Results showed that some components of the TEG failed to identify hypercoagulation (r <0.2, P >0.75). However, three components of the routine coagulation assay, including the bleeding time, prothrombin time, and platelet count, could be modeled to show prolonged postoperative hypercoagulability (P <0.01). We conclude that all components of the HVG reflect postoperative coagulopathies; these results suggest that it may be useful in determining the coagulation status of cancer patients perioperatively.
Critical Care 2011, Volume 15 Suppl 1 http://ccforum.com/supplements/15/S1
Conclusions Postoperative hypercoagulability, occurring for at least 1 week after major cancer abdominal surgery, may be demonstrated by HVG. Hypercoagulability is not reflected completely by standard coagulation monitoring and TEG and seems to be predominantly caused by increased platelet reactivity. P436 Overuse of coagulation parameter testing in critically ill patients V Bibeau, F Lauzier, MN Cote, AF Turgeon CHA-Hôpital de l’Enfant-Jésus, Université Laval, Quebec, Canada Critical Care 2011, 15(Suppl 1):P436 (doi: 10.1186/cc9856) Introduction The international normalized ratio (INR) is one of the most commonly ordered laboratory tests in the ICU. Recently, it was raised that laboratory tests are widely overused in critically ill patients. We hypothesized that most INRs are inappropriately ordered and could lead to inadequate frozen plasma (FP) transfusion. Methods We performed a retrospective cohort study in a 24-bed medical–surgical ICU of a Canadian teaching hospital. Patients with ≥1 INR testing admitted between 1 January and 30 June 2009 were randomly selected. Admission diagnosis, APACHE II score, drugs affecting coagulation, liver function, invasive procedures, recent or planned surgery, and recent or current bleeding were recorded. INRs ordered for warfarin adjustment were excluded. The primary endpoint was the proportion of inappropriate INRs, based on a blinded assessment of the clinical context by two independent investigators. Secondary endpoints were contributing factors to INR ordering and impact on FP transfusion. We used a standardized case report form. Inter-rater agreement was evaluated using weighted kappa. A third independent investigator resolved disagreement. We used the Student t and chi-square tests to compare continuous data and proportions. We obtained ethics approval. Results We included 43 patients (mean age 61.9 ± 16.0, APACHE II score 20.0 ± 8.6, 53.5% males) admitted for nontraumatic bleeding (41.9%), respiratory failure (16.3%), trauma (11.6%), sepsis (11.6%) or other reasons (18.6%). A total of 208 INRs were analyzed, representing 4.9 ± 4.2 INRs per patient. Twenty-five percent of INRs were ordered in the context of bleeding, 6.7% before and 22.1% after surgery, 4.8% before an invasive procedure and 3.8% for suspected liver dysfunction. A total 5.8% of INR were above the normal limit. Inter-rater agreement for INR inappropriateness was good (weighted kappa = 0.61, 95% CI: 0.50 to 0.72). Thirty-one out of 43 (72.1%) patients had at least one INR ordered inappropriately. One hundred and twenty-four out of 208 INRs were inappropriate (59.6%, 95% CI: 52.8 to 66.0). Intravenous heparin was associated with inappropriate INR (RR = 1.47, 95% CI: 1.18 to 1.74). Patients with inappropriate INR had lower APACHE II score (16.9 ± 9.4 vs. 22.8 ± 6.9, P = 0.002) and were less likely to receive vasopressors (25.0% vs. 65.2%, P = 0.008). No inappropriate INR was followed by FP transfusion. Conclusions Nearly 60% of INR orders were inappropriate. Patients on i.v. heparin, not on vasopressors, and with low APACHE II score were more likely to have inappropriate INRs. Despite no FP transfusion following inappropriate INRs, rationalizing INR testing is warranted to decrease associated costs and resource utilization. P437 Applying a new method for studying the functional state of hemostasis in clinical practice O Tarabrin1, I Tyutrin2, S Kalinchuk3, A Turenko3, S Shcherbakov1, D Gavrychenko1 1 Odessa Medical University, Odessa, Ukraine; 2Siberian State Medical University, Tomsk, Russia; 3Odessa Regional Clinical Hospital, Odessa, Ukraine Critical Care 2011, 15(Suppl 1):P437 (doi: 10.1186/cc9857) Introduction It is known that deep vein thrombosis of lower extremities and pulmonary embolism occupies an important place in the structure of postoperative morbidity and mortality. Methods After ethics approval and informed consent, we studied the functional state of hemostasis in a group of 40 healthy volunteers who were not receiving drugs affecting coagulation and in 37 patients
S154
with postphlebothrombotic syndrome (PPTS). In patients with PPTS we conducted baseline studies of coagulation state and daily monitoring of dynamic changes in the functional state of hemostasis, a comparative evaluation of performance low-frequency piezoelectric vibration hemoviscoelastography (LPVH) and the platelet aggregation test (PAT), standard coagulation tests (SCT), and thromboelastogram (TEG). Results It was found that the LPVH correlated with SCT, PAT and TEG. However, our proposed method is more voluminous: indexes ICC (the intensity of the contact phase of coagulation), t1 (the time the contact phase of coagulation), and A0 (initial rate of aggregation of blood) were consistent PAT indexes; indexes ICD (the intensity of coagulation drive), CTA (a constant thrombin activity) and CIP (the clot intensity of the polymerization) for SCT and TEG. In addition, the advantage of this method is to determine the intensity of fibrinolysis – with indicator IRLS (the intensity of the retraction and clot lysis). Conclusions LPVH allows one to make the total assessment of all parts of hemostasis: from initial viscosity and platelet aggregation to coagulation and lysis of clots, as well as their interaction. These data are objective and informative, as evidenced by close correlation with the performance of traditional coagulation methods.
P438 Comparison of point-of-care thrombelastography versus conventional coagulation tests in the emergency department management of trauma V Jeger1, S Willi1, T Liu2, L Omert2, A Orr2, MA Popovsky2, H Zimmermann1, AK Exadaktylos1 1 University Hospital Inselspital Bern, Switzerland; 2Haemonetics Corporation, Braintree, MA, USA Critical Care 2011, 15(Suppl 1):P438 (doi: 10.1186/cc9858) Introduction To guide the administration of blood products, coagulation screening of trauma patients should be fast and accurate. Conventional coagulation tests (CCT) are frequently not useful in the initial assessment of multiply injured patients, due to the delay in availability of results. The purpose of this study is to determine whether Rapid thrombelastography (RapidTEG®) results in 15 minutes correlate with Kaolin TEG or CCT. Methods A 6-month prospective observational study of adult patients with suspected multiple injuries was conducted at a Level 1 trauma center of a university hospital. TEG, RapidTEG®, and CCT (INR, aPTT, TT, fibrinogen, platelet count) were performed within 10 minutes of the patient’s arrival. Physicians blinded to TEG/RapidTEG® results made the decision to transfuse based on clinical evaluation and prior threshold (cut-off ) values for CCT. Cut-off values for RapidTEG® were retrospectively assessed. Correlations between TEG and CCT and between TEG and RapidTEG® parameters were calculated, as well as sensitivity and specificity of CCT and RapidTEG® for any blood product transfused on day 1. Results Seventy-six predominantly blunt trauma (96%, n = 73) patients comprised the dataset. The mean ISS was 18. Only weak correlation existed between CCT and relevant TEG parameters (r = 0.097 to 0.615). Strong correlation exists between Kaolin TEG and RapidTEG® for K, MA, G and LY30 (r = 0.844 to 0.988). At the predetermined cut-off points for treatment in trauma, CCT demonstrated poor sensitivity. Cut-off points for RapidTEG® demonstrated good sensitivity and specificity: RapidTEG®: Rapid K (seconds) 1.2; 80.0%; 59.2%; 0.785 (cut-off ; sensitivity; specificity; AUC), Rapid angle (°) 74.7; 84.0%, 56.9%; 0.765, Rapid MA (mm) 61.5; 72.0%; 71.4%; 0.745. CCT: TT (seconds) 15; 28.6%; 88.9%; 0.529, aPTT (seconds) 60; 4.8%; 97.8%; 0.735, INR 1.5; 19.0%; 96.0%; 0.730. Conclusions In this study of severely injured blunt trauma patients, RapidTEG® can be utilized in lieu of kaolin TEG to provide faster test results. Cut-off points for treatment can be determined with RapidTEG® to provide improved sensitivity and specificity compared with CCT with respect to blood product transfusion.
Critical Care 2011, Volume 15 Suppl 1 http://ccforum.com/supplements/15/S1
P439 Effect of hypothermia on coagulation functions in Sprague–Dawley rats with uncontrolled hemorrhagic shock KH Park Jeju Natioanl University Hospital, Jeju, South Korea Critical Care 2011, 15(Suppl 1):P439 (doi: 10.1186/cc9859) Introduction Acute coagulopathy, hypothermia, and acidosis are known as the lethal triad of major trauma patients. Major trauma patients with hypothermia and acidosis developed clinically significant bleeding despite adequate transfusion [1]. Recent animal experiment studies reported that hypothermia is associated with improved survival in controlled hemorrhagic shock [2,3]. Post-traumatic hypothermia is an unproven therapy unlike hypothermia as a postcardiac arrest care. The objective of this study was to investigate the effect of hypothermia on coagulation function in uncontrolled hemorrhagic shock with major trauma. Methods Thirty-two male Sprague–Dawley rats were divided into four groups randomly: Group 1 with normothermia (control, 37 to 38°C); Group 2 with hypothermia (33 to 34°C on rectal temperature); Group 3 with hypothermic hemorrhagic shock; Group 4 with normothermic hemorrhagic shock. Hemorrhagic shock was induced by splenic laceration or blood shedding. Coagulation functions were measured by rotation thrombelastometry (ROTEM®). The clotting time, clot formation time (CFT), and maximum clot firmness (MCF) were measured at baseline, after 1 hour shock, and after 1 hour resuscitation. They were compared among the four groups using the Kruskal–Wallis test with Bonferroni correction, and the Friedman test was used to detect the differences in the repeated measures in the same group, taking P <0.05 as a significant level. Results No significant differences showed among the groups at baseline. CFT after the shock period of group 2 was longer than that of group 4. MCF after resuscitation of group 2 was higher than that of groups 3 and 4. When the factors were compared as a time process, CFT and MCF after shock and resuscitation of group 3 decreased significantly compared with baseline. Four in group 3 and two in group 4 died during 48 hours of observation. Conclusions Although it took a shorter time to form a clot in normothermic shock compared with hypothermia, clot firmness was poorer in hemorrhagic shock. In addition, clot firmness was significantly worse in the shock period and after resuscitation in the hypothermic shock group. Only hypothermia does not deteriorate coagulation, but hypothermia combined with hemorrhagic shock deteriorates coagulation. References 1. 2. 3.
Ferrara A, et al.: Am J Surg 1990, 160:515-518. George ME, et al.: J Trauma 2010, 68:662-668. Iwamoto S, et al.: J Trauma 2010, 68:669-675.
P440 Sepsis: thrombocytopenia is bad, not recovering thrombocytopenia is too bad W Faviere, T Boechat Universidade Severino Sombra, Vassouras, Brazil Critical Care 2011, 15(Suppl 1):P440 (doi: 10.1186/cc9860) Introduction Thrombocytopenia is a prognostic marker in the critically ill population [1], affecting, indistinctly, patients presenting low platelet count on admission or developing it during their stay in the ICU. It has been shown that a drop in platelet count to ≤50% of admission is associated with high death rates [2]. We aimed to observe the outcome of thrombocytopenic septic patients in our ICU. Methods A retrospective observational cohort study in an 11-month period (August 2009 to July 2010) in an eight-bed medical–surgical ICU at a university hospital. This study included patients who fulfilled the criteria for sepsis as defined in the Surviving Sepsis Campaign and excluded those who spent less than 24 hours in the ICU. Thrombocytopenia (T) was defined as platelet count <150 x 109/l, recovering thrombocytopenia (RT) platelet count returning to >150 x 109/l and not recovering thrombocytopenia (NRT) platelet count consistently <150 x 109/l. We focused on the demographic data,
S155
APACHE II score, platelet count on admission, platelet count during stay and platelet count at the time of discharge from ICU. The primary outcome was ICU mortality. Results Complete data were available for 62 patients. Six were excluded. Twenty-eight males (50%), mean age 58 years (12 to 88 years), median APACHE II score 16.7 (interval 2 to 37). During the sepsis course 34 patients (60.7%) developed T, 15 (44.1%) had a drop in platelet count to <50% of admission and NRT occurred in 18 (53%). Mortality in the T group was 76.4% (RR = 1.9; 95% CI = 1.17 to 2.74; P <0.01), in platelet count drop to <50% of admission group it was 93.3% (RR = 1.47; 95% CI = 1.02 to 2.2; P <0.05), and in RT patients 50% survived to be discharged from the ICU. In the NRT group the mortality was 100% (RR = 2; 95% CI = 1.3 to 3; P <0.001) while in nonthrombocytopenics the total mortality was 40.9% (P <0.01). In T group patients the APACHE II score did not predict accurately the mortality risk. In both APACHE II groups (>22 (P = 0.007) or <22 (RR = 1.7; P = 0.05)) thrombocytopenia was highly associated with death. The ICU overall mortality in this period was 32%. Conclusions Thrombocytopenia – and its behavior – is a simple prognostic marker for ICU mortality independently of and complementary to established severity of disease scores. For septic patients thrombocytopenia is bad, not recovering thrombocytopenia is worse. References 1. 2.
Mackay A, et al.: Platelet count as a prognostic marker in intensive care. Crit Care 2010, 14(Suppl 1):P365. De Weerdt A, et al.: A prospective study of thrombocytopenia and prognosis in intensive care. Crit Care 1999, 3(Suppl1):P236.
P441 Thrombocytopenia: incidence and clinical impact on ICU mortality M Kompoti, M Michalia, P Peppa, F Nanou, M Charitidi, M Sartzi, I Vassiliadis, G Kallitsi, P Clouva-Molyvdas Thriassio General Hospital of Eleusis, Athens, Greece Critical Care 2011, 15(Suppl 1):P441 (doi: 10.1186/cc9861) Introduction The prognostic significance of thrombocytopenia in critically ill patients has not been thoroughly explored. Our study aimed at investigating the incidence of thrombocytopenia among ICU patients, its association with ICU-acquired infection and its clinical impact on ICU mortality. Methods All patients admitted to the ICU were prospectively followed with daily platelet (PLT) count measurement until ICU outcome. Thrombocytopenia was defined as PLT count lower than 150,000/mm3 and severe thrombocytopenia as PLT count lower than 20,000/mm3. Data were analyzed with one-way ANOVA and logistic regression with statistical significance set at P <0.05. Results We studied 169 consecutive patients (119 males, 50 females) aged (mean ± SD) 53.4 ± 19.8 years, with admission APACHE II score 22.7 ± 5.3. Thrombocytopenia during ICU stay was recorded in 101 patients (59.8%). Emergency surgical and trauma patients displayed the highest incidence of thrombocytopenia (77.3% and 72.1%, respectively). Emergency surgical and medical patients displayed the highest of severe thrombocytopenia (18.2% and 10.6%, respectively). Trauma and emergency surgical patients developed thrombocytopenia earlier during the ICU stay (that is, after 4.9 and 5.1 days, respectively) compared with medical and elective surgical patients (that is, after 13.3 and 10.9 days, respectively) (P = 0.001). Thrombocytopenia was more often recorded in patients with ICU-acquired infection compared with patients without infection. In particular, severe thrombocytopenia was recorded in 18.9% of patients with bloodstream infection and 9.0% of patients with other ICU-acquired infection. ICU mortality was significantly higher in patients who developed thrombocytopenia compared with patients with normal PLT counts throughout the ICU stay (30% vs. 9.4%, P = 0.002). In a logistic model adjusted for age, gender, admission diagnosis, admission APACHE II score and the occurrence of ICU-acquired infection, thrombocytopenia was independently associated with ICU mortality (P = 0.017) and the degree of PLT count decrease significantly increased the ICU mortality in a dose-dependent manner; that is, odds ratios of 3.4 for PLT 100,000 to 150,000/mm3, 3.5 for PLT 50,000 to 100,000/mm3, 14.9 for PLT 20,000 to 50,000/mm3 and 25.2 for PLT below 20,000/mm3.
Critical Care 2011, Volume 15 Suppl 1 http://ccforum.com/supplements/15/S1
Conclusions Thrombocytopenia was a common finding in our sample of ICU patients. Although the time of occurrence and the degree of PLT count decrease varied, reflecting a wide spectrum of pathogenic mechanisms, thrombocytopenia was independently associated with ICU mortality in a dose-dependent manner. P442 Sepsis-induced thrombocytopenia: early prediction and modifiable mortality G Georgiev, S Milanov, V Todorova, L Kozarov, M Milanov Pirogov Emergency Institute, Sofia, Bulgaria Critical Care 2011, 15(Suppl 1):P442 (doi: 10.1186/cc9862) Introduction Thrombocytopenia is a common problem in the ICU, considered to be associated with increased morbidity and mortality. Risk factors for sepsis-induced thrombocytopenia have not been yet specified. Our study focuses on its development and consequences in the general ICU. Methods A prospective observational study was conducted including all cases of sepsis for a 2-year period. Data on demographics, primary diagnosis and source of infection, current infectious pathogens, presence/severity of shock and outcome were cross-tabulated according to the presence and severity of thrombocytopenia. Effects of immunotherapy and substitution with thrombocyte concentrate on outcome were also tested. Analyses of disease prescription, length of ICU stay (LOS), severity and dynamics of organ dysfunction/disease/ systemic inflammation (serum creatinine levels, SOFA, SAPS II, SIRS, lung injury score) for each group of patients was performed. Results The study included 118 patients with thrombocytopenia of variable severity (39.33% out of 300 septic patients). The following independent prognostic factors for supervening thrombocytopenia (reported with respective RR and 95% CI) were identified: platelet count <150 g/l – prescription >48 hours (1.31; 1.02 to 2.67), SOFA score on inclusion >6 (1.36; 1.02 to 1.78), ΔSOFA >5 (2.77; 2.17 to 3.50), initial SAPS II exp. score >5.5 (1.39; 1.04 to 1.82), LIS >1.75 (1.56; 1.13 to 2.19), serum creatinine >122 μmol/l (2.38; 1.72 to 3.36), Gram-positive infectious pathogen, especially if Gram-positive co-infection or if concomitant invasive candidiasis (1.44, 1.08 to 1.94; 1.9, 1.33 to 2.46 and 2.60; 1.31 to 3.02), Streptococcus spp. infection (2.04; 1.17 to 2.64), disruption of the lower GIT (1.48; 1.06 to 1.97), polytrauma (0.39; 0.22 to 0.65); and platelet count <20 g/l – urosepsis (6.53; 1.76 to 16.96), soft tissue infection (9.87; 2.75 to 22.07), initial SAPS II exp. score >6.2 (4.90; 2.02 to 11.71), SOFA score on inclusion >8 (6.52; 2.68 to 15.04), female sex (1.74; 1.13 to 2.26). Mortality was significantly higher for the thrombocytopenic patients (66.95% vs. 41.76%, P = 0.000), except for those who underwent specific therapy (37.5%, P = 0.000). Conclusions New insight was gained into the prediction of imminent sepsis-induced thrombocytopenia. Applied immunotherapy and substitution therapy for the most severely but early identified thrombocytopenic patients contributes to the inadvertently reduced mortality within this group. P443 Biochemical and hematological parameters (including thromboelastography) differ in patients with sepsis and SIRS after esophagectomy M Durila1, J Bronský2, T Haruštiak3, A Pazdro3, M Pechová4, K Cvachovec1 1 Department of Anesthesiology and Critical Care Medicine, Second Faculty of Medicine, Charles University, Prague, Czech Republic; 2Department of Paediatrics, Charles University, Second Faculty of Medicine, Prague, Czech Republic; 3Third Department of Surgery, First Faculty of Medicine, Prague, Czech Republic; 4Department of Clinical Biochemistry and Pathobiochemistry, Second Faculty of Medicine, Charles University, Prague, Czech Republic Critical Care 2011, 15(Suppl 1):P443 (doi: 10.1186/cc9863) Introduction Early diagnosis of sepsis and its differentiation from non-infective SIRS is very important. The links between inflammation and coagulation play an important role in the SIRS/sepsis process. We investigated hematological and biochemical parameters (including thromboelastography (TEG)) in patients after surgical resection of
S156
esophagus. The aim of our project was to find out whether there are any changes in these parameters that could help in differentiation between SIRS and sepsis. Methods In our study we enrolled 38 patients (aged 41 to 74) undergoing esophagectomy. Blood samples were obtained in the morning before the operation and then every 24 hours for the next 6 postoperative days (POD). Blood samples were analysed for the following parameters: procalcitonin (PCT), C-reactive protein (CRP), IL-6, aspartate transaminase (AST), lactate, white blood count (WBC), D-dimers, antithrombin (AT), international normalised ratio (INR), activated partial thromboplastin time (APTT) and parameters of TEG. Results Nine patients developed sepsis within 6 postoperative days. Five of them had pneumonia and in four patients the cause of sepsis was dehiscention of gastroesophageal anasthosmosis. Significant differences between patients with SIRS and patients with sepsis were found in the following parameters: 0-day (before operation): no significant differences; POD 1: differences in AST (P <0.002) only; POD 2: AST (P <0.003), lactate (P <0.006), D-dimers (P <0.02), PCT (P = 0.03), IL-6 (P <0.03), WBC (P <0.03); POD 3: AST (P <0.03), PCT (P <0.02), IL-6 (P = 0.006), CRP (P <0.04), WBC (P <0.05); POD 4: AST (P = 0.006), PCT (P = 0.007), IL-6 (P <0.02), CRP (P = 0.03), D-dimers (P <0.05), INR (P = 0.03); POD 5: PCT (P <0.003), IL-6 (P <0.04), CRP (P <0.04), AT (P = 0.03); and POD 6: PCT (P = 0.0001), CRP (P <0.013), WBC (P = 0.03), TEG-LY30 (P <0.04). Conclusions Sequential measurement of biochemical and hematological parameters, mainly AST, PCT, IL-6, WBC, CRP and D-dimers, can help in early diagnosis of sepsis in patients after extensive operation such as esophagectomy. On the contrary, TEG does not seem to be helpful in differentiation of SIRS/sepsis during the early postoperative period. However, it seems to be useful after the fifth postoperative day. Acknowledgements Supported by grant agency of Charles University No. 21509. P444 Use of thromboelastography in severe sepsis: a case–control study A Cortegiani, L Marino, F Montalto, M Milana, A Di Benedetto, L Vento, SM Raineri University of Palermo, Italy Critical Care 2011, 15(Suppl 1):P444 (doi: 10.1186/cc9864) Introduction Thromboelastography (TEG) is a global test of coagulation that records the viscoelastic changes in blood during clot formation. Cardiosurgery and liver transplantation are established fields of application for TEG. Severe sepsis is often characterized by an imbalance of the haemostatic equilibrium between clot formation and fibrinolysis in favor of a procoagulant status, especially in the first phase. A hypocoagulant status due to coagulation factor consumption could occur later. In spite of this, the correlation between TEG and sepsis is not clearly established. Moreover, there are doubts about which TEG-detected variable is best correlated with sepsis. The aim of this study is to clarify this correlation. Methods We enrolled 62 patients in an observational study: 31 severe sepsis (ACCP/SCCM sepsis criteria plus two organ dysfunction at least) and 31 postoperative patients (without sepsis criteria), all admitted to our ICU. Patients with primary hematologic dysfunction/malignancy were excluded. The SOFA score was registered before enlistment. We obtained a 5 ml whole blood sample into a citrate 0.15 M test tube within 12 hours of diagnosis in the sepsis group or surgery in the postoperative group from each patient. A sample of 340 μl blood were extracted from each sample and put into a heparinase cup; coagulation was initiated with the addition of 20 μl CaCl 0.2 M. All of the tests were performed by Haemoscope® TEG5000. According to TEG analysis, r, k, α-angle, MA, G, A, lysis 30 and coagulation index were compared between the two groups using the t test. Results The mean age in the sepsis group was 59.8 whereas it was 62.2 in the postoperative group. The SOFA score was statistically different between the two groups (t = 3.359; P = 0.0015), being higher in the sepsis group. The α-angle parameter was found to be statistically significant higher in the postoperative group than in the sepsis group (t = 2.240; P = 0.0288). No significant differences were founded between the other TEG parameters.
Critical Care 2011, Volume 15 Suppl 1 http://ccforum.com/supplements/15/S1
Conclusions According to our data, there is no difference in TEG parameters between severe sepsis and postoperative patients apart from the α-angle, which seems to be lower in the first group. The α-angle is supposed to be high in the procoagulant state; our result could be thought of as linked to the late phase characterizing our severe sepsis group wherein factor consumption coagulopathy could occur. Reference 1.
Adamzik M, et al.: Crit Care 2010, 14:R178.
P445 Effect of anemia on coagulation and platelet function: a whole blood in vitro study G Scharbert1, L Wetzel1, L Berlinger1, S Kozek-Langenecker2 1 Medical University Vienna, Austria; 2Evangelical Hospital, Vienna, Austria Critical Care 2011, 15(Suppl 1):P445 (doi: 10.1186/cc9865) Introduction It is known that red blood cells are involved in hemostasis. They can support and improve coagulation in different ways. Therefore recommendations are given for red blood cell transfusions in anemic patients with massive bleeding to reach a hemoglobin concentration of 8 to 10 g/dl. Although blood transfusions can be life-saving, a number of negative or even potentially life-threatening effects are described. Methods In this study we investigated the effect of anemia on platelet function and plasmatic hemostasis with two different point-of-care methods: the multiple electrode aggregometry Multiplate® (MEA) and the rotational thrombelastometry ROTEM®. Blood was taken from 13 healthy volunteers to arrange in vitro anemia-series with 10, 7 and 3 g/dl hemoglobin. For the MEA we applied the agonists collagen, arachidonic acid, adenosine diphosphate (ADP), thrombin-receptoractivating peptide (TRAP) and ristocetin. For the ROTEM® analysis we used the tests EXTEM, INTEM and FIBTEM. Results The MEA showed significantly increased velocity of platelet aggregation in anemic blood samples. The agonists TRAP and ADP demonstrated the highest effects. The Aggregation Units and the area under the curve were not influenced by anemia. The ROTEM® analysis displayed significantly an amplified maximum clot firmness (MCF), a shortened clot formation time (CFT) und an increased α-angle. The CFT and lysis index at 30 minutes did not show any changes through lowering hemoglobin. The calculated effect of platelets on ROTEM® coagulation (MCFplatelet = MCFEXTEM – MCFFIBTEM) was unchanged. Conclusions In our study platelet function in anemic blood was observed with the MEA for the first time. Our results showed accelerated platelet aggregation through lowering hemoglobin. Our findings of a hypercoagulable profile in ROTEM® are in accordance with earlier observations. Future clinical studies are needed to evaluate risk of bleeding or hypercoagulability in anemic patients. P446 Effect of pH levels on platelet aggregation and coagulation: a whole blood in vitro study G Scharbert1, G Franta1, L Wetzel1, S Kozek-Langenecker2 1 Medical University Vienna, Austria; 2Evangelical Hospital, Vienna, Austria Critical Care 2011, 15(Suppl 1):P446 (doi: 10.1186/cc9866) Introduction The combination of acidosis, hypothermia and coagulopathy is associated with high mortality in polytrauma [1]. Acidosis impairs coagulation [2]. Whether acidosis leads to a reduced platelet function has not so far been evaluated. Methods In this in vitro study we evaluated the effects of pH levels (7.6, 7.4, 7.2, 7.0 and 6.8) on platelet aggregation and coagulation with human whole blood of healthy male volunteers. We used multiple electrode aggregometry (MEA) Multiplate® (tests: ADP, ASPI, TRAP) for platelet function testing. The global coagulation was evaluated at pH 6.8 and 7.4 with ROTEM®, which is a rotational thrombelastometry (tests: NATEM and APTEM). The pH levels of the blood samples were achieved by titration of HCl and NaOH. Results In MEA the AUC was significantly reduced for pH 7.0 and pH 6.8 in all three tests (ADP, ASPI and TRAP), as well as aggregation and velocity. Platelet function was not influenced by alkalosis (pH 7.6). In
S157
ROTEM® the AUC, CT, CFT and MCF showed no significant alterations. The α-angle and lysis index for 60 minutes were significantly reduced at pH 6.8. NATEM values were significantly different from those measured with APTEM. Conclusions In our study we evaluated a significant decrease of platelet function at pH 7.0 and 6.8 with MEA. The results of the analysis with the ROTEM® system showed a significant reduction of thrombus formation at pH 6.8, as described in the literature. In the APTEM test, we could identify hyperfibrinolysis. References 1. 2.
Cosgriff et al.: J Trauma 1997, 42:857-861; discussion 861-862. Engström et al.: J Trauma 2006, 61:624-628.
P447 Hemostasis system condition in progress of sepsis in severe burns M Presnyakova, S Evstigneev Nizhny Novgorod Research Institute of Traumatology and Orthopedics, Nizhny Novgorod, Russia Critical Care 2011, 15(Suppl 1):P447 (doi: 10.1186/cc9867) Introduction Among infectious complications in patients with serious heat injury, the most dangerous is sepsis developing in the early stages of burn disease. Sepsis is characterized by a fulminant, severe course, complex diagnostics, and a high case fatality rate. Hemostasis system disorders are one of the key pathogenic links of organ failure development in sepsis. Methods The hemostasis system condition was studied in 100 patients with over 20% of the body burned, from the first to 12th day after burn. Examined patients were divided into two groups: in the first group an acute period of burn disease was complicated by progress of sepsis (33 patients), and in the second group complications in the form of sepsis were not observed. The groups of patients studied were balanced in age and severity of the disease. Sepsis was diagnosed on the basis of clinical, laboratory and bacteriological findings, as well as confirmed by morphological studies in casualties. The control group consisted of 130 apparently healthy people. Results Comparative analysis of hemostasis system disorders in severe burn patients with early sepsis and those without similar complication showed that the progress of generalized infection in the acute period of burn disease is accompanied by reliable decreased activity of antithrombin III, XIIa-dependent fibrinolysis, blood plate count, and prothrombin time prolongation. There were no differences revealed between the studied groups of severe burn when determining fibrinogen content, soluble fibrin monomeric complexes, activated partial thromboplastin time, thrombin clotting time and echitox time, and the test revealing fragmented erythrocytes. Correlation analysis showed that the most contingency between progress of sepsis and hemostasis system data was noted on the third to fourth days after burn (with decreased activity of XIIa-dependent fibrinolysis (r = 0.58, P <0.0001), antithrombin III (r = –0.57, P <0.0001), prothrombin time (r = 0.49, P <0.0001) and thrombocytopenia (r = –0.48, P <0.0001)). On the basis of a retrospective analysis of case histories of severe burns with verified generalized infection, it was determined that the development of an acute form of DIC syndrome manifesting in a marked imbalance of coagulation and anticoagulative blood mechanisms as well as severe hepatorenal failure has a lead time of 1 to 8 days in revealing sepsis in the clinic. Conclusions Hemostasis system disorders corresponding to an acute form of DIC syndrome not only accompany the progress of sepsis in severe burn but can be an indirect predictor of its development. P448 Muscular compartment syndrome and in vivo optical spectroscopy monitoring: a new model F Ponchon, P Forget, M Vanhoonacker, G Stoquart, T Lejeune, F Lois, D Kahn, M De Kock UCL, Brussels, Belgium Critical Care 2011, 15(Suppl 1):P448 (doi: 10.1186/cc9868) Introduction The muscular compartment syndrome (MCS) is consecutive to an increase in intramuscular compartment pressures [1].
Critical Care 2011, Volume 15 Suppl 1 http://ccforum.com/supplements/15/S1
S158
of 10% from baseline is as accurate as the time of intracompartmental hyperpression to predict MCS (Figure 2). References 1. 2. 3.
Elliott et al.: J Bone Joint Surg Br 2003, 85:625-632. Boushel et al.: Acta Physiol Scand 2000, 168:615-622. Gentilello et al.: J Trauma 2001, 51:1-9.
P449 Effects of sepsis on venous microcirculation: non-invasive evaluation by quantitative near-infrared spectroscopy V Papi1, V Defraia1, M Sandri1, R Romano2, R De Blasi1 1 Sapienza University of Rome, Italy; 2Università Politecnica delle Marche, Ancona, Italy Critical Care 2011, 15(Suppl 1):P449 (doi: 10.1186/cc9869)
Figure 1 (abstract P448).
Figure 2 (abstract P448).
This is a rare but serious postoperative complication. In vivo optical spectroscopy (INVOS) monitors tissular oxygenation continuously and non-invasively. Our objective was to develop a model mimicking the physiopathology of MCS and to assess the interest of the INVOS in this case [1-3]. Methods After approval of the ethics committee, we inflated a tourniquet in nine healthy volunteers at a pressure equal to the mean arterial pressure (MAP), obtaining a model of slight venous congestion and arterial hypoperfusion. The INVOS monitoring was compared with sensory deficits, pain, motor activity, electromyography and invasive pressure. Results A profound motor nerve conduction block (>30% decrease in action potential amplitude from baseline) was observed in the seven volunteers completing the protocol, immediately reversible after releasing the external pressure. At baseline, the values of MAP, INVOS and intracompartmental pressure (ICP) were respectively 94.3 ± 6.5 mmHg, 73.3 ± 8.9% and 16.9 ± 8.6 mmHg. At the time of appearance of a significant block, the values of INVOS were 46.4 ± 10.9%; the absolute decrease of INVOS was 28.7 ± 10.6% and the ICP values were 70.0 ± 5.5 mmHg. The times to reach this significant block from baseline and from the time of an absolute INVOS decrease of 10% were respectively 33.0 ± 10.9 minutes and 27.43 ± 10.4 minutes (Figure 1). Conclusions Our model is appropriate since it mimics perfectly MCS [3]. The time after achieving an absolute decrease of the INVOS value
Introduction Sepsis has several effects on microcirculation, including microthrombosis, interstitial edema and reduced reactivity of arteriolar tone leading to shunt areas [1]. Little is known about the effects of sepsis on the venous component of microcirculation. Changes of venular compliance and volume of the venular bed may affect cardiac preload, which has a key role in occurrence of cardiac failure. Near-infrared spectroscopy (NIRS) is a widely used, non-invasive technique that enables one to quantify the tissue oxyhemoglobin and deoxyhemoglobin (Hb) concentration, through which microvascular blood flow, compliance and oxygen consumption can be extrapolated [2]. The aim of our study was to evaluate the effects of sepsis on venous compliance and volume of the venular bed. Methods Seven ICU patients with sepsis (according to ACCP/SCCM criteria [3]) and seven healthy subjects were studied. NIRS data were collected during several venous compressions at 20 to 30 to 40 mmHg. The venular bed volume increase at 20 mmHg was obtained from the total Hb concentration increase. Venular compliance was calculated as the volume increase and pressure inflated ratio. Results expressed as mean values ± SD for compliance and volume. The Mann–Whiney U test was performed to compare values in patients and controls. Results The mean venular bed volume increase in the sepsis group was 3.32 ± 0.90 ml while in controls it was 7.80 ± 4.24 ml (P <0.05). Venous compliance was significantly lower in the sepsis group compared with the control group (0.17 ± 0.06 ml/mmHg*l vs. 0.44 ± 0.10 ml/mmHg*l; P <0.05). Conclusions Sepsis affects the venous component of microcirculation by decreasing venular compliance and volume of the venular bed. This might be caused by a real decrease of venular bed volume, due to microthrombosis, or by an increase of venular tone. However, the clinical relevance of our findings is not known, and further studies are needed. References 1. 2. 3.
Trzeciak S, et al.: Ann Emerg Med 2007, 49:88-98. De Blasi RA, et al.: J Appl Physiol 1994, 76:1388-1393. American College of Chest Physicians/Society of Critical Care Medicine Consensus Conference: Crit Care Med 1992, 20:864-874.
P450 Role of microcirculatory monitoring in polytraumatic patients A Donati, S Loggi, R Domizi, MR Lombrano, V Fiori, A Valentini, MC Melia, C Scorcella, A Carsetti, P Pelaia Università Politecnica delle Marche, Ancona, Italy Critical Care 2011, 15(Suppl 1):P450 (doi: 10.1186/cc9870) Introduction Seventy-five percent of ICU mortality after the first 72 hours following major trauma is due to multiple organ dysfunction syndrome (MODS) [1]. How to follow this evolution is not completely understood yet and new parameters are still needed. The aim of this study was to evaluate the effects of polytrauma on sublingual microcirculation and to search correlations among it, Sequential Organ Failure Assessment (SOFA) score and biochemical markers and to use these factors for monitoring patients [2]. Methods This prospective study included 12 patients. Sublingual microcirculation has been registered using sidestream dark field imaging and analysed with AVA software, searching for indices of
Critical Care 2011, Volume 15 Suppl 1 http://ccforum.com/supplements/15/S1
S159
P451 Early trauma deaths in a level 1 trauma center: whole-body 16-MDCT is associated with a threefold increase in the time interval from hospital access to emergency surgery if compared with a US-based protocol G Nardi, E Cingolani, S Rogante, C Siddi, G Ranaldi, AP Cossu, D Piredda Ospedale S. Camillo-Forlanini, Rome, Italy Critical Care 2011, 15(Suppl 1):P451 (doi: 10.1186/cc9871)
Figure 1 (abstract P450). ROC curve: discriminating capacity of D-dimer, SOFA-Plt, and SOFA-tot versus PVD.
Figure 2 (abstract P450). ROC curve: discriminating capacity of myoglobin, lactate and tot-SOFA versus MFIs.
vessel density, perfusion and type of flow. For each patient, SOFA parameters, hemocoagulation indices, cytonecrosis criteria and hypoperfusion measures have been evaluated at admission and every 48 hours, for a minimum of 96 hours, and correlation between these and microcirculatory parameters has been researched. We then evaluated the discriminating capacity of these parameters versus microcirculatory indices, calculating the area under the ROC curve. Results No correlation was found between microcirculatory indices and the others. The following parameters had good discriminating capacity: SOFA-platelets (area = 0.745), total-SOFA (0.724) and D-dimer (0.670) for perfused vessel density (PVD) values; Hb (0.693) and SOFA platelets (0.714) for total vessel density (TVD); myoglobin (0.680), lactate (0.732) and total-SOFA (0.703) for microcirculatory flow index (MFI). See Figures 1 and 2. Conclusions Even in polytrauma, microcirculatory dysfunction is important for MODS appearance, and its analysis (PVD, TVD, De Backer score, MFIs) can help to evaluate this evolution, according to biochemical markers and severity index: joined with macrohaemodynamic indices, they allow one to better investigate organ features. References 1. 2.
Evans JA, et al.: World J Surg 2010, 34:158-163. Rixen D, et al.: Crit Care 2005, 9:441-445.
Introduction A retrospective analysis based on the data of the German Trauma Registry has shown a significant increase in the probability of survival in polytrauma patients submitted to whole body CT (WBCT). However, even when the CT is installed in the Emergency Department, the time required for positioning the patient for CT may significantly prolong the duration of CT diagnosis. Methods Our hospital is a level 1 trauma center with a catchment population of 2.5 million; there are two CT scans in the ED. All severely injured patients are submitted to US on admission. WBCT is performed as the first-line radiologic investigation in haemodynamic-stable patients or in unstable patients with negative abdominal US and without a clear source of bleeding. Unstable patients with severe head trauma and lateral signs are also submitted to CT. To evaluate whether the use of CT in the severely unstable patients brings a significant delay in emergency surgery, we retrospectively analyzed all early trauma death from January 2009 to November 2010. Results Seven hundred severe trauma patients (ISS >15) were brought in alive. Thirty-eight (5.4%) died before ICU admission: 21 died in the shock room before any surgical intervention. One patient was submitted to thoracotomy and laparothomy in the shock room and died. One more died on the CT table. The remaining 15 patients, severely hypotensive, were alive on admission to the OR. One of them was brought directly to the OR with no investigation because of massive bleeding from the extremities. The others had US on admission. US was the only investigation for seven of them; they all had a positive US showing important bleeding in the abdomen or in the chest. The other seven, who had no evidence of bleeding on the US, were submitted to WBCT. The mean time elapsed from hospital admission to OR entrance was 23 minutes (15 to 30 minutes) for patients who had only US and 70 minutes (52 to 90 minutes) for the CT group. The seven patients who had only US were all submitted to shock room decompressive minithoracotomy (five bilateral) with the suspicion of pneumothorax. Conclusions Recent reports suggest implementation of multi-slice CT integrated into the resuscitation room, thus enabling resuscitation to be performed directly on the ER CT. Unless this new technology is adopted, even the ED-based CT still needs excessive time to be performed in most unstable patients. In a cohort of patients who eventually died in the OR, a diagnostic process including ED-based WBCT was associated with a threefold increase in the time needed from hospital admission to surgery. P452 Diagnostic value of duplex ultrasonography in comparison with conventional angiography in the assessment of traumatic arterial injuries of the extremities H Ravari Imamreza, Mashhad, Iran Critical Care 2011, 15(Suppl 1):P452 (doi: 10.1186/cc9872) Introduction Traumatic events are one of the major causes of arterial injuries. Physical examination is not a good predictor of these injuries and arteriography is considered the gold standard for this purpose. In recent years, non-invasive modalities are increasingly replacing diagnostic arteriography. Duplex ultrasonography is an excellent method for investigation of arterial diseases. In this study, we analyze the diagnostic value of duplex ultrasonography in comparison with angiography in traumatic arterial injuries of the extremities. Methods Duplex ultrasonography was performed for patients with suspicious arterial injury due to extremity trauma just before angiography. The Doppler pattern and flow states were obtained, then standard angiography was performed. The results of duplex ultrasonography were compared with angiography.
Critical Care 2011, Volume 15 Suppl 1 http://ccforum.com/supplements/15/S1
Results A total of 75 patients with blunt and penetrating trauma to their extremities were investigated. Duplex ultrasonography had 95% sensitivity and 98% specificity in the diagnosis of arterial injury in this study. Conclusions We suggest that duplex ultrasonography can be used as a reliable tool, both sensitive and specific, in screening of hemodynamically stable patients with suspicious limb arterial injury. P453 Simple predictive scoring system for ventilator-associated pneumonia in trauma patients N Saito, T Yagi, Y Hara, H Matsumoto, K Mashiko Chiba Hokusou Hospital, Nippon Medical School, Chiba, Japan Critical Care 2011, 15(Suppl 1):P453 (doi: 10.1186/cc9873) Introduction VAP is associated with high mortality in trauma patients. However, detailed data on the prediction of VAP in such patients are limited. We therefore conducted a retrospective study aimed at developing a VAP predictive scoring system for trauma patients. Methods We retrospectively analyzed 187 consecutive patients with trauma who were ventilated for more than 72 hours between April 2006 and April 2010. VAP was diagnosed by CDC criteria. Patients were divided into the VAP group and non-VAP group and their clinical and laboratory data were compared by univariate analysis using the chi-square and Mann–Whitney U tests. Multivariate analysis using the stepwise method was used to identify predictors of VAP. Results Victims of blunt trauma accounted for 90.9% of the sample population. The median age of the patients was 50 (32 to 67) years, the median injury severity score (ISS) was 29 (22 to 32), and the hospital mortality rate was 12.3%. Seventy patients were assigned to the VAP group (27.5/1,000 mechanical ventilator-days) and 117 to the non-VAP group. The independent predictors for VAP were thoracic cage trauma (odds ratio (OR) 2.5 (P = 0.02; 95% confidence interval (CI): 1.1 to 5.5)), history of chronic heart failure (CHF; OR 8.9 (P <0.01; 95% CI: 2.4 to 33.0)), chronic obstructive pulmonary disease (COPD; OR 5.9 (P <0.01; 95% CI: 1.9 to 18.3)), muscle relaxant (MR) use (OR 5.2 (P <0.01; 95% CI: 1.7 to 15.3)), tracheal intubation (TI) in the prehospital setting (OR 4.7 (P <0.01; 95% CI: 1.8 to 12.4)), use of a nasogastric (NG) tube (OR 6.5 (P <0.01; 95% CI: 2.7 to 15.4)), cervical vertebrae external fixation (CVEF; OR 9.0 (P <0.01; 95% CI: 2.2 to 36.7)), and ISS >25 (OR 5.0 (P <0.01; 95% CI: 1.8 to 13.7)). Based on these results, we developed a VAP predictive scoring system. The following simplified clinical risk assessment tool was developed from the results of multivariate analysis, with scoring based on a cut-off point related to the adjusted odds ratio. VAP score: thoracic cage trauma = 2 points, CHF = 8 points, COPD = 5 points, MR use = 5 points, TI in the prehospital setting = 4 points, NG tube = 6 points, CVEF = 9 points, ISS >25 = 5 points. The area under the receiver operating characteristic curve for VAP in this scoring system was 0.847 (P <0.001; 95% CI: 0.79 to 0.90). The cut-off value for this score according to the sensitivity specificity curve in relation to VAP was 15 points. Sensitivity was determined at 91.1%, and specificity 74.5%. Conclusions The simple predictive scoring system developed for VAP in trauma will help physicians in the planning of early patient care. P454 Effect of a trauma proforma on the quality of documentation in the Emergency Department JE Millar, B Fisher, R McLaughlin Royal Victoria Hospital, Belfast, UK Critical Care 2011, 15(Suppl 1):P454 (doi: 10.1186/cc9874) Introduction Improvements in trauma care are driven by an understanding of the patient population and their outcome after injury. In order to achieve this, many centres submit data to trauma registries. This process relies on accurate and comprehensive documentation. The aim of this study was to evaluate whether the introduction of a standardised proforma for major trauma patients improved the quality of documentation in an urban Emergency Department (ED). Methods In September 2010 a proforma was introduced within the ED for use in patients presenting after major trauma. Prior to this, clinical
S160
documentation for these patients was recorded on the standard ED record. The last 30 patients attending the ED prior to introduction of the proforma, with major injuries requiring admission to a critical care bed or the operating room, were identified. In addition, 15 completed proformas were available for comparison. In order to set a standard for this comparison, the Utstein template for uniform reporting of data following major trauma [1] was examined to identify core variables that should reasonably be recorded in the ED. Of 31 variables, 23 were felt to be relevant. The ED record or proforma for each patient was then scrutinised in an attempt to extract these variables. A comparison was made between the two groups. Results In those attending prior to the introduction of a proforma, the mean number of variables identifiable from the clinical record was 12/23 (52%); after the introduction of the proforma this improved to 20/23 (87%). Several parameters were well documented amongst both groups including age, gender and those relating to mechanism of injury (accountable for 5/23 variables). These were identifiable in greater than 95% of cases. Use of the proforma improved the documentation of the remaining 18 variables, including base excess, level of prehospital care and first key emergency intervention. The most marked improvements were seen in the documentation of prehospital observations (GCS, GCS motor component, systolic blood pressure and respiratory rate). Among the pre-proforma group, 0/30 patients had a fully recorded set of prehospital care observations; this improved to 9/15 (60%) in the proforma group. Conclusions Improvements in trauma care are reliant on our ability to audit current practice, this in turn relies upon robust data collection. In a busy and stressful resuscitation room this is easily over looked. The introduction of standard documentation improves the clinician’s ability to record such information. Reference 1.
Ringdal KG, et al.: Scand J Trauma Resusc Med 2008, 16:7.
P455 Efficiency of a French-language triage algorithm in the Emergency Department J Jobé1, A Ghuysen1, P Gérard2, V D’Orio1 1 University Hospital, Liège, Belgium; 2University, Liège, Belgium Critical Care 2011, 15(Suppl 1):P455 (doi: 10.1186/cc9875) Introduction ELISA (Echelle Liégeoise d’Index de Sévérité à l’Admission) is a valid new Emergency Department (ED) triage algorithm including five levels of categorisation (from U1, high emergency degree, to U5, low degree), based on vital signs and selected anamnestic data. Previous work has demonstrated that ELISA evidenced a strong interrater and intra-rater agreement [1]. In this study, we aimed at further evaluating its efficiency. Methods From March 2008 to May 2008, we prospectively investigated 545 consecutive admissions to study the potential correlation between ELISA score and impact on resource consumption as well as ED stay. Resources were classified following three categories: complementary examinations (ECG, blood analysis, X-ray, and so forth), medical treatments (i.v. medications, casts, sutures, and so forth), and outcome after ED admission (discharge, hospitalisation, ICU admission or death). Each resource was considered a binary variable and was analyzed owing to four statistical tests: chi-square, Wald Wolfowitz, Kolmogorov– Smirnov and Mann–Whitney. Results Statistical analysis evidenced an effect of ELISA score on the overall need for complementary examinations except for serology, X-rays and Holter ECG. The initial index severity had also related the need for urgent treatments. Outcomes were also significantly correlated with ELISA: the smaller the index, the bigger the number of hospitalisations, ICU admissions and deaths. This study demonstrates ELISA’s efficiency; when the initial severity index is close to U1, more complementary examinations are needed and more medical treatments are necessary. Wounds do not have a high emergency degree, which explains why there was no influence of initial index severity on the realisation of sutures. The same reasoning is applied to X-rays that are frequently requested for light traumatic cases with low emergency degree. Finally, hospitalisation, ICU admission and death are more frequent when the ELISA score evidences the highest emergency degree.
Critical Care 2011, Volume 15 Suppl 1 http://ccforum.com/supplements/15/S1
Conclusions In addition to previous work demonstrating a strong inter-rater and intra-rater agreement, the present study points out the potent efficiency of ELISA, allowing its further use in the ED. Reference 1.
Jobé J, Ghuysen A, Gérard P, Hartstein G, D’Orio V: Validation of a new Frenchlanguage triage algorithm: the ELISA scale. Crit Care 2010, 14(Suppl 1):P277.
P456 Optimized patient transfer using an innovative multidisciplinary assessment in the Kanton Aargau (OPTIMA I): an observational survey in lower respiratory tract infections F Dusemund1, W Albrich1, K Rüegger1, R Bossart2, K Regez2, U Schild2, A Conca2, P Schuetz3, T Sigrist4, A Huber5, B Reutlinger2, B Müller1 1 Medical University Department of the University of Basel, Kantonsspital Aarau, Switzerland; 2Department of Nursing, Kantonsspital Aarau, Switzerland; 3Harvard School of Public Health, Boston, MA, USA; 4Department of Pneumology, Kantonsspital Zug, Switzerland; 5Department of Laboratory Medicine, Kantonsspital Aarau, Switzerland Critical Care 2011, 15(Suppl 1):P456 (doi: 10.1186/cc9876) Introduction Current medical scores have limited efficiency and safety to assign the most appropriate treatment site to patients with lower respiratory tract infections (LRTIs) [1-4]. We describe our current triage practice and assessed the potential of a combination of CURB65 with proadrenomedullin (ProADM) levels for triage decisions. Methods Consecutive patients with LRTIs were prospectively followed and retrospectively classified according to CURB65 and ProADM levels (CURB65-A). Low medical risk patients were further subgrouped according to biopsychosocial and functional risks. We compared proportions of patients virtually allocated to triage sites with actual triage decisions and assessed the added impact of ProADM in a subgroup. Results Ninety-six percent of 253 patients were hospitalized. Among the 138 patients with available CURB65-A, 17.4% had low medical risk indicating possible treatment in an outpatient or nonacute medical setting; 34.1% had intermediate medical risk (short hospitalization); and 48.6% had high medical risk (hospitalization). Fewer patients were in a low CURB65-A class (I) than a low CURB65 class (0, 1) (17.4% vs. 44.6%, P <0.001). Mean length of hospitalization was 9.4 days including 3.5 days after reaching medical stability. In 56.9% of patients, hospitalization was prolonged after medical stability mainly for medical reasons. Conclusions Current rates of hospitalization are high in patients with LRTI and the length of stay frequently extended beyond time of medical stabilization. The lower proportion of patients reclassified as low risk by adding ProADM to the CURB65 score might improve confidence in the triage algorithm. References 1. 2. 3. 4.
Aliyu ZY, et al.: Determinants for hospitalization in ‘low-risk’ community acquired pneumonia. BMC Infect Dis 2003, 3:11. Marrie TJ: Risks and outcomes in community acquired pneumonia. Can Respir J 1999, 6(Suppl A):6A-9A. Fine MJ, et al.: A prediction rule to identify low-risk patients with community-acquired pneumonia. N Engl J Med 1997, 336:243-250. Lim WS, et al.: Defining community acquired pneumonia severity on presentation to hospital: an international derivation and validation study. Thorax 2003, 58:377-382.
P457 Agreement of pain assessment between nurses and patients in the Emergency Department M Modanloo, H Abdollahi, N Behnampour Golestan University of Medical Sciences, Gorgan, Iran Critical Care 2011, 15(Suppl 1):P457 (doi: 10.1186/cc9877) Introduction Pain is one of the most common reasons why patients visit the Emergency Department (ED) and is a healthcare problem for patients [1,2]. The purpose of this study was to determine the agreement between patient self-reported pain intensity and nurse pain assessment in the ED.
S161
Methods A purposive sample of 100 patients and 36 nurses in the triage and clinical area within the ED was selected from 5Azar Hospital in Gorgan. The questionnaire included two components: participant characteristics and the Numeric Rating Scale (NRS). A questionnaire was administered twice to each patient. In triage the patients were asked to rate their pain intensity. Separately, the nurses assessed the patient’s pain intensity. This process was repeated with the same patients after referring them to a clinical area within the ED, but the nurses were different. Gathered data were described by frequency distribution tables and analyzed by Wilcoxon, Mann–Whitney and Spearman tests. P <0.05 was considered significant. Results Most of the patients were male (61%), with mean age of 39.16 ± 16.83 years. Fifty-four percent of the patients had chronic pain. Most of them had a diagnosis of abdominal pain and chest pain (61%). In the triage, the mean nurses’ pain intensity score was significantly lower than patients’ score (7.60 ± 2.1 vs. 9.13 ± 1.26), as significant differences in mean scores were observed (P <0.001). In the clinical area, patients’ scores were also significantly higher than nurses 7.36 ± 2.56 and 5.94 ± 2.33, respectively (P <0.001). Nurses significantly underestimated pain on the NRS. See Table 1. Table 1 (abstract P457). Patients’ (n = 100) and nurses’ (n = 36) pain intensity scores Triage area
Clinical area
Total
Nurses
7.60 (2.1)
5.94 (2.33)
6.77 (2.36)
Patients
9.13 (1.26)
7.36 (2.56)
8.24 (2.20)
Correlation
r = 0.612
r = 0.373
r = 0.528
Data presented as mean (SD).
Conclusions The findings have implications for the management of patients’ pain by highlighting the need for more accurate pain assessment. Further research is required to elucidate the way in which nurses and patients conceptualize pain and to understand better the process of pain assessment in clinical nursing practice. References 1. 2.
Eder SC, et al.: Am J Emerg Med 2003, 21:253-257. Marquié L, et al.: Acute Pain 2008, 10:31-37.
P458 Effect of delayed ICU admission on mortality and morbidity R Ramaiah, B Shepard, P Hopkins, R Maharaj King’s College Hospital, London, UK Critical Care 2011, 15(Suppl 1):P458 (doi: 10.1186/cc9878) Introduction Delayed admissions to the ICU from the Emergency Department (ED) may be associated with increase in mortality and morbidity [1]. We wanted to answer the following questions: is there an association between the timing of presentation to the ED and mortality; and is the time interval between the patient presenting to the ED and admission to the ICU associated with increase in mortality and morbidity? Methods We collected the number of patients admitted from the ED to the ICU from April 2009 to March 2010. The time duration from the patient presenting to the ED and the patient admitted to the ICU was collected. We defined any admission to the ICU more than 4 hours from the ED as delayed admission, as per the national standards. We assessed the APACHE score of the patient on admission, the length of stay in the ICU (LOS), relationship to the time of ED admission (either office hours 08:00 to 17:00 or out of hours 17:01 to 07:59) and the hospital mortality associated with each admission. Results We had 547 admissions to the ICU from the ED. There was no significant association between out of office admission to the ED and hospital mortality (OR = 0.858, 95% CI = 0.457 to 1.610) after adjustment for age and APACHE score. There was also no statistically significant difference between patients that took more than 4 hours between ED and ICU, with respect to the hospital mortality (OR = 1.00 and 95% CI = 0.999 to 1.001). We performed a COX regression analysis to establish whether delays were associated with increased LOS, using age and APACHE as the covariates. There was no statistically significant association
Critical Care 2011, Volume 15 Suppl 1 http://ccforum.com/supplements/15/S1
between ICU LOS and delays to ICU admission (hazard ratio = 0.948 and 95% CI = 0.934 to 0.962). There was no difference between APACHE scores >25 and ICU admission delays (chi-square P = 0.897). Conclusions There was no association between delay in ED to ICU admission on mortality or length of stay in the hospital. This might be due to the fact that the sick patients presenting in the ED are seen by a physician early, thereby leading to appropriate triage of the patient to the ICU. APACHE II scoring seems to be an independent variable and has a linear relation to the mortality and length of stay in the hospital. Reference 1.
Richardson JD, et al.: Effective triage can ameliorate the deleterious effects of delayed transfer of trauma patients from the emergency department to the ICU. J Am Coll Surg 2009, 208:671-678; discussion 678-681.
P459 Case note and chart review of mortality in patients with a predicted low risk of death on admission to the ICU S Elia, R Fisher, M Mostert University Hospital Lewisham, London, UK Critical Care 2011, 15(Suppl 1):P459 (doi: 10.1186/cc9879) Introduction The aim was to establish whether suboptimal care or system failures in the delivery of care contributed to mortality in patients admitted with a predicted low risk of death to our ICU. Methods We defined low risk of death as a predicted mortality of less than 20% based on either the ICNARC or APACHE II risk prediction models [1]. We reviewed the case notes and ICU charts of patients with a low risk of death admitted to our ICU during July to December 2008 and April to September 2009. Results Seven hundred and fifty patients (799 admissions, 49 readmissions) were admitted during the periods under review. The hospital mortality rate was 20.7% (155 patients) and of the 155 nonsurvivors 29 patients had a predicted low risk of death. Case notes for five patients could not be obtained and notes and charts for 24 of the 29 patients were reviewed. Errors identified in data collection: in two patients, incorrect data collection was identified that may have underestimated the risk of death. Suboptimal care identified: in four patients (16.7%), five instances of suboptimal care or system failures in care delivery were identified – delay in obtaining investigations (one laboratory, one radiology) delayed definitive treatment (two cases), delay in referring patient to the ICU (one case), elective surgical procedure caused bowel injury in a high-risk patient (one case), and delay in obtaining medical records caused the inappropriate admission of a patient to the ICU (one case). Patients with severe progressive illness: some patients were admitted with a low physiology score and low predicted risk of death but with a poor prognosis due to an underlying progressive illness. Conclusions A case note review of ICU nonsurvivors can identify areas where service delivery and patient safety can be improved. Four patients (16.7%) with alcoholic liver disease (ALD) died despite a low physiology score on admission. The increased incidence of ALD in our unit is in line with the national trend. Reference 1.
Harrison DA, et al.: A new risk prediction model for critical care: the Intensive Care National Audit & Research Centre (ICNARC) model. Crit Care Med 2007, 35:1091-1098.
P460 Cost impact of blocking: predictability of ICU patient throughput and cost variance using process modeling S Nabors1, T Bountourelis2, A Schaefer2, L Luangkesorn2, J Kharoufeh2, L Maillart2, W Yang2, G Clermont2 1 University of Pittsburgh Medical Center, Pittsburgh, PA, USA; 2University of Pittsburgh, Pittsburgh, PA, USA Critical Care 2011, 15(Suppl 1):P460 (doi: 10.1186/cc9880) Introduction Efficient management of ICU patient turnover can significantly impact patient survival, medical expenses, overall
S162
satisfaction, and hospital operating expenses. Movement within a constrained healthcare delivery system is a dynamic and stochastic process that eludes traditional analysis and prediction tools. We hypothesized that simulation-based approaches allow for a better capture of the interaction between reality and policy, and therefore guide efficient ICU management. We developed a simulation process, modeling constrained hospital patient flow in a tertiary care center and generated a cost-variance analysis derived from differences in that patient flow. Methods This study consists of a retrospective analysis of a comprehensive sample of 3,518 patients admitted to the VA Pittsburgh Health System from 27 April 2010 to 3 November 2010. Patient movement data are extracted to produce a cohort dataset and time-series analysis of patients transitioning in the following units: the medical ICU (nine beds), surgical ICU (11 bed), coronary care unit (18 beds), step-down unit (nine beds), monitored medical (15 beds), monitored surgical (12 beds), nonmonitored medical (44 beds) and surgical (19 beds). Cost data are extracted from the VAPHS annual budget review and cost allocation records for specific patient units and levels of care. Blocking time is the difference between time of assignment and movement to a specified location. Assignment difference is the probability of being assigned to a location other than requested location. Cost variance is the difference between cost allocations based on the standard of clinically indicated LOS and the cost allocations based on real LOS averaged per unit location. Results This model graphically depicts LOS rates, blocking times, assignment difference rates, and cost variance. The worst blocking time is observed for monitored medical beds (44 hours) while the worst assignment difference is observed for surgical monitored beds (0.55). The worst cost variance is recorded in the surgical ICU ($572,000). The total cost variance is $849,000. Conclusions ICU flow is a dynamic process affected by constraints manifesting in large blocking times, assignment differences and significant cost variance. This novel flow management tool could systematically and objectively aid managerial decision-making at both the unit and hospital levels. P461 ICU readmission: good or bad? E Potter, D Vondra, S Green, M Zuleika Royal Surrey County Hospital, Guildford, UK Critical Care 2011, 15(Suppl 1):P461 (doi: 10.1186/cc9881) Introduction Patients requiring ICU management risk deterioration following discharge. Readmission to the ICU is used as a marker of performance [1] with some controversy [2]. It is established that higher APACHE II scores and longer length of ICU stay are associated with higher risk of ICU readmission [3]. However, there are no criteria available to identify those patients most likely to benefit from readmission [4]. Methods Prospective data were collected on all patients admitted to a multidisciplinary adult ICU between 2001 and 2009 and entered into a computerised database. This included length of ICU stay, ICU and hospital outcomes, readmission to ICU and days prior to readmission. Data for all ICU admissions were analysed annually. Results There were 5,004 patients admitted during 2001 to 2009; 1,315 (26%) were elective postoperative admissions and 3,689 (74%) emergency admissions. The ICU mortality during this period was 15.8% and mean APACHE II score was 17.7 (1 to 55). There were 299 readmissions (6%). The average time between discharge and readmission was 8.5 days (0 to 89) with a mean length of ICU stay of 5.89 days (0.2 to 48.8). The average hospital mortality rate of readmitted patients was 33% and fell from 69% in 2003 to 24% in 2007. The proportion of readmitted patients increased from 3% (11) in 2001 to 10% (68) in 2007. As the proportion of patients readmitted increased, the hospital mortality rates for all ICU admissions fell 10% from 31% in 2001 to 21% in 2009. Conclusions As the number of patients readmitted has increased, hospital mortality of both readmitted patients and total ICU patients have fallen. Those readmitted have had a short length of stay (mean 5.89 days).
Critical Care 2011, Volume 15 Suppl 1 http://ccforum.com/supplements/15/S1
References 1. 2. 3.
4.
Society of Critical Care Medicine Quality Indicators Committee: Candidate Critical Care Quality Indicators. Anaheim, CA: Society of Critical Care Medicine; 1995. Cooper GS, et al.: Are readmissions to the intensive care unit a useful measure of hospital performance? Med Care 1999, 37:399-408. Chan KS, et al.: Readmission to the intensive care unit: an indicator that reflects the potential risks of morbidity and mortality of surgical patients in the intensive care unit. Surg Today 2009, 39:295-299. Campbell AJ, et al.: Predicting death and readmission after intensive care discharge. Br J Anaesth 2008, 100:656-662.
P462 Is the ASA physical status classification system a good prognostic index for ICU admissions? A Gregório, A Pais-de-Lacerda, C França Hospital de Santa Maria, Lisbon, Portugal Critical Care 2011, 15(Suppl 1):P462 (doi: 10.1186/cc9882) Introduction The physical state of the patient before surgery is defined by the American Society Anesthesiology (ASA) physical status classification system. The Simplified Acute Physiology Score (SAPS II) provides an estimate for the risk of intrahospital death for ICU patients. The Sequential Organ Failure Assessment (SOFA) score is used to monitor the patient’s condition during his/her stay in the ICU, assessing the extent of organ dysfunction or failure. Is the ASA physical status classification system a good prognostic index for determining postsurgical patient’s admittance to the ICU? What is the evolution of these patients? Could we predict the outcome of these patients? Methods A retrospective analysis of the ASA, SAPS II and SOFA of all postsurgical patients admitted to an ICU, between 1 May and 31 October 2010. Results Total ICU admissions: 323 patients, 118 being postsurgical patients (mortality: 12 patients – 10.17%). Maximum patient SOFA: between 0 and 19. Patient SAPS II: between 8 and 99. Of the 118 patients, five had ASA 5, a mortality of 100% being expected but only three died. The expected mortality rate of the three deceased (SAPS II: 58, 99, 80) was 5.2%, 92.5%, 98.4%, respectively. The two patients who got better had a SAPS II of 21 and 56 with a maximum SOFA of 4 and 16, which means that they improved significantly, against all odds. Most ICU admitted patients were ASA 3 and ASA 4. Fifty per cent of ASA 3 patients presented a maximum SOFA between 0 and 5; maximum SOFA was higher in 34% of ASA 3 patients (5 to 10) with predicted ICU mortalities of up to 7% and 46%, respectively. Four patients of the ASA 3 group died. Of the ASA 4 patients, 43% had a maximum SOFA between 5 and 10, and 34% presented a lower maximum SOFA (0 to 5). In 10 (26%) ASA 4 patients, maximum SOFA exceeded 11 with a mortality ICU predicted rate of 56%. In fact, five died. The reason for admission to the ICU of the 20 patients with lower ASA (17 ASA 2 patients, three ASA 1 patients) was a need for tighter monitoring or stabilization of postsurgical complications. Indeed, all deaths in the ASA 2 (1/17) and ASA 3 (4/38) groups were related to complications from co-morbidities. Conclusions ASA 3 and ASA 4 patients are those who benefit the most from a stay in an ICU, enabling one to reduce mortality predicted by SAPS II and SOFA scores. The ASA physical status classification system is not a good indicator of mortality, but its association with SAPS II and maximum SOFA scores define more effectively the severity and prognosis of the postsurgical patient. Reference 1.
Little JP: Consistency of ASA grading. Anaesthesia 1995, 50:658-659.
P463 Factors and consequences associated with a delay in the discharge process of patients from an adult critical care unit J Mellinghoff, A Rhodes, M Grounds St George’s Healthcare NHS Trust, London, UK Critical Care 2011, 15(Suppl 1):P463 (doi: 10.1186/cc9883) Introduction Adult intensive care beds are a scarce and expensive resource. Efficient utilisation of these beds necessitates safe and timely discharge of patients to the general ward. However, the discharge
S163
process is complex and often delayed. This study aimed to look at the processes and consequences that cause a delay in the discharge of patients from an adult ICU. Methods This was a retrospective study of our data collection databases based in a 17-bed London teaching hospital ICU. We examined the process of patient discharge from ICU to the ward over a 3-year period. Results The study period was from July 2007 until June 2010. There were 3,511 patient discharge episodes to hospital wards. A delay of over 4 hours occurred in 2,829 patient episodes (81%). The delays in discharge to the wards increased by over 100% for the year following a reduction of 28 beds in total intrahospital ward bed capacity [1]. There were over 42,000 hours (equal to 1,751 days) of delays in discharges for the patient episodes. Delays were caused by all stakeholders involved in the discharge process. The main reasons were insufficient ward bed availability (21%), delays in bed allocation (30%), delays in the completion of administrative tasks on the ICU (4%), delays in adequate preparation of ward beds (27%) for the arrival of the ICU patient, and delays that were attributable to intrahospital transport arrangements (5%). Overall, discharge delays to surgical wards were twice as likely compared with medical wards as they were also trying to deal with elective and emergency surgical admissions. Medical wards had fewer delays in transfer but were more likely to have longer delay times as a result of subsequent delays in discharging patients back to the community. Conclusions Delays were multifactorial and accumulative in nature and dependent on the individual processes involved in the transfer of patients. Themes were related to organisational, individual, teamwork and patient factors. Reference 1.
Department of Health Overnight Bed Count [http://www.dh.gov.uk/en/ Publicationsandstatistics/Statistics/Performancedataandstatistics/Beds/ DH_083781]
P464 Delayed ITU discharge: causes and impact M Flower, A Kaliappan West Suffolk Hospital, Bury St Edmunds, UK Critical Care 2011, 15(Suppl 1):P464 (doi: 10.1186/cc9884) Introduction ITU resources represent 13% of hospital costs. Patients requiring ITU should be admitted promptly. However, those identified as suitable for discharge to the ward should also be transferred swiftly. Methods A retrospective study of notes for 269 people admitted to the ITU between April and September 2010. Variables included length of ITU stay, discharge destination, reason for admission to ITU, primary pathology, disease severity on admission (APACHE II), health on discharge (MEWS) and ward bed availability. Results Most discharges occur out of hours (64%). The average length of ITU stay is 90 hours and the average discharge delay is 26 hours. As length of stay increases, so too does discharge delay. Discharge delay was not significantly correlated with increased hospital mortality. Those discharged to the ward were delayed by an average of 32 hours. Primary reasons for ITU admission included monitoring, diagnosis and support of physiological function, with the latter by far the commonest. Discharge delay was significantly longer for those admitted in order to establish a diagnosis (40 hours). Discharge delay was very short for biliary and cerebral disease, at 3 and 2 hours respectively, but much longer for pneumonia, acute renal failure and heart failure, at 38, 58 and 72 hours. No correlation was found between discharge delay and APACHE II score on admission or MEWS score on discharge. Conclusions ITU patients have complex care needs and transition through several departments. We focused on ITU factors and found discharge was delayed by long ITU stay, acute renal failure, heart failure, pneumonia and a lack of diagnosis on admission. The commonest ward factors are bed availability, emergency department activity, ward discharge practices and patient deterioration. In the community there are finite resources for special care. ITU patients should be prioritised for ward beds. Multispeciality involvement on intensive care and the presence of advanced diagnostic facilities on site, such as CT and angiography, would expedite diagnosis. Adequate step-down facilities, such as dialysis and respiratory support, should be available in order to
Critical Care 2011, Volume 15 Suppl 1 http://ccforum.com/supplements/15/S1
accept patients with complex needs and would enable earlier and safer discharge from intensive care. P465 Length of hospital stay prior to ICU admission and outcome K Simpson, G Williams, T Quasim Glasgow Royal Infirmary, Glasgow, UK Critical Care 2011, 15(Suppl 1):P465 (doi: 10.1186/cc9885) Introduction We hypothesised that for the general ICU population, a longer length of hospital stay prior to ICU admission was associated with a poor outcome. Previous work in specific ICU populations has suggested that a longer length of hospital stay prior to ICU admission is associated with a higher mortality [1,2], and longer and therefore more costly ICU stays [3]. We undertook an evaluation of the relationship between pre-ICU length of hospital stay (LOS), and hospital mortality over a 1-year period. Methods Using prospectively collected data, we undertook a retrospective evaluation of all patients admitted to the ICU of Glasgow Royal Infirmary from 1 August 2008 to 1 August 2009. Patients were identified from Wardwatcher (Critical Care Audit Ltd). Only the initial event was included in those patients with readmissions during the same hospital stay. The patients were divided into hospital survivors (Group A) and nonsurvivors (Group B). Statistical analysis was performed using SPSS version 15.0 for Windows (SPSS Inc, Chicago, IL, USA). Medians, interquartile ranges (IQRs) and Mann–Whitney U tests were applied as appropriate. Results A total of 419 patients were admitted during the study period. After excluding those with missing data and the outliers, 397 were included in the data analysis. There were 268 in the survivor group (Group A), and 129 in the group that died (Group B). Median patient age: Group A, 50 (IQR 36 to 66), Group B, 62 (IQR 50 to 70), P <0.001. Median APACHE II scores: Group A, 15 (IQR 10 to 20), Group B, 23 (IQR 18 to 29), P <0.001. Median predicted hospital mortality (%): Group A, 15.9 (IQR 6.3 to 31.6), Group B, 46.8 (IQR 30.8 to 67.4), P <0.001. Median preICU LOS (days): Group A, 1 (IQR 0 to 2), Group B, 1 (IQR 0 to 4), P = 0.001. Median ICU LOS (days): Group A, 2 (IQR 1 to 6), Group B, 2 (IQR 1 to 7), P = 0.297. Median hospital LOS (days): Group A, 18 (IQR 7 to 36), Group B, 8 (IQR 3 to 23), P <0.001. Conclusions In our cohort, the critically ill patients who survived to hospital discharge were younger, were less severely unwell and had a significantly shorter length of stay prior to ICU admission. What cannot be determined from this study is the bias of individual clinicians when seeing referrals. Assuming we admit the patients we anticipate to have the best chance of hospital survival, patients with a longer length of hospital stay prior to ICU appear to have worse outcomes. References 1. 2. 3.
Woodhead M, et al.: Crit Care 2006, 10(Suppl 2):S1. Hampshire P, et al.: Crit Care 2009, 13:R137. Higgins T, et al.: Crit Care Med 2003, 31:45-51.
P466 Intensive care admission triage for a pandemic: are government tools acceptable to UK intensivists? DT Ashton-Cleary1, NV Freeman2, A Tillyard1 1 Derriford Hospital, Plymouth, UK; 2Torbay Hospital, Torbay, UK Critical Care 2011, 15(Suppl 1):P466 (doi: 10.1186/cc9886) Introduction Triage criteria recommended by various governmental bodies are part of a process to cope with increased demand for intensive care resources during a pandemic [1]. It is unknown whether UK intensive care physicians agree with the proposed criteria that could automatically exclude a patient from receiving ICU care if adopted. Methods We conducted an online survey amongst the members of the UK Intensive Care Society. We asked respondents to grade their opinion about each criterion of a Department of Health (DoH) triage tool and provide some additional information about their own health. We used Cronbach’s alpha (CA) to assess how close the opinions of the respondents were with regard to each criterion and each of three sets of criteria. We used a chi-squared analysis to see whether these factors differed between intensive care consultants and nonconsultants.
S164
Results A total of 550 questionnaires were returned; 182 (33.1%) were from intensive care consultants. For six of the DoH 11 criteria, the agreement score was >4/5 indicating agreement or strong agreement. For both consultants and nonconsultants, the CA was >0.8 (significant inter-responder agreement). A total 19.4% of those currently meeting exclusion criteria and 34.6% of those in good health would give up the chance of a level 3 bed voluntarily if they fulfilled one of the proposed criteria during a pandemic. Conclusions The results indicate a general acceptance of the requirement for triage but nearly 40% have significant reservations about the proposed tool. Sixty-five to 80% of respondents would not withdraw from the triage process in a pandemic even if they knew the proposed criteria would exclude them. While approximately 60% of respondents accepted the triage tool, it seems the majority would not wish it to be used to determine their own care. Reference 1.
Christian MD, et al.: Can Med Assoc J 2006, 175:1377-1381.
P467 Patients’ profile admitted to the ICU after establishment of a regulatory policy system for ICU patient allocation at public hospitals in Rio de Janeiro, Brazil R Goldwasser1, S Oliveira1, C David2, M Oliveira1, A Babo1 1 Secretaria Estadual de Saude, Rio de Janeiro, Brazil; 2UFRJ, Rio de Janeiro, Brazil Critical Care 2011, 15(Suppl 1):P467 (doi: 10.1186/cc9887) Introduction The consolidation of intensive care fundamentals was accompanied by growth of ICUs and increased utilization of intensive care services. Unfortunately it was not followed by national health planning. The demographic changing profile with a higher number of elderly patients and a changing case mix with less trauma patient admissions, associated with the high prevalence of cardiovascular diseases and the early approach to septic patients, will have implications on intensive care organization. A regulatory policy system for public ICUs was started in Rio de Janeiro to ensure appropriate selection and allocation of patients who need intensive care. The aim of this study is to report the profile of patients admitted to the ICU since the beginning of this new policy. Methods A retrospective, 1-year, analysis of data from the Regulation Center. A nonchecklist medical application form is transmitted by fax for ICU patient allocation. Requests originated both from the hospital emergency room (HER) and nonhospital emergency units of care (Unidade de Pronto Atendimento (UPA)). The age, gender and the main prevalent diseases were recorded. Acute cerebrovascular disease (CVD) was considered all forms of stroke, both ischemic and hemorrhagic injuries; acute coronary disease (ACD) was considered stable and unstable angina and acute myocardial infarction; sepsis for severe sepsis and septic shock; trauma for any severe trauma, multiple trauma, burns and brain trauma; pneumonia for any severe lung infection with or without respiratory failure; and cardiac failure for any severe heart failure and acute pulmonary edema due to cardiac disease. Results There were 15,036 applications, 10,360 (68.9%) forms from HER and 4,676 (31.1%) forms from UPA. From 12,591 adult requests, 7,333 were men and 5,258 were women. Mean age was 61.54 years old, and 461 (4%) were >80 years old. Major diseases that motivated the requests for admission were ACD (1.871, 15%), CVD (1.753, 14%), pneumonia with or without organ failure (1.678, 13%), sepsis (1.423, 11%), cardiac failure (825, 7%), trauma (741, 6%) and others (4,300, 34%). Conclusions There was a significant number of ICU requests, mainly from in-hospital demand. The discussion regarding the indication of ICU care and knowledge of the patient profile may improve quality of the health critical care policy. P468 Changes in very older person admissions to an ICU over a decade J Connelly, E Dawe, H Jones Morriston Hospital, Swansea, UK Critical Care 2011, 15(Suppl 1):P468 (doi: 10.1186/cc9888) Introduction The UK population is getting older and consequently our attitudes, together with the number of very older person admissions
Critical Care 2011, Volume 15 Suppl 1 http://ccforum.com/supplements/15/S1
S165
Table 1 (abstract P468). Mortality of very older patients by specialty at ICU/ hospital discharge Medical (%)
Emergency surgical (%)
Elective surgical (%)
Overall (%)
1999 to 2000
33/52
41/48
18/36
29/44
2009 to 2010
38/48
34/47
11/16
33/44
Data presented as ICU/hospital mortality (%).
to critical care, may be changing [1]. We therefore reviewed admissions aged 80 or over (very older people) to our ICU and compared this with 10 years ago. Methods Retrospective data collection was completed for all patients admitted to our ICU for a 12-month period starting in August 2009, and a comparable 12-month period starting August 1999. Data were retrieved from an electronic database of ICU admissions. Results The number of very older patients admitted for the 1999 period was 87 out of a total 702 (12.4%) and for the 2009 period was 156 out of a total 1,071 (14.6%). There was a marked increase in emergency medical (from 24% to 47%) and emergency surgical (from 31% to 41%) admissions in the 10 years. This was in contrast to elective surgical admissions, which have reduced from 42% to 12%. The mean ICU admission APACHE II score for patients over 80 years old decreased from 21.2 to 18.6. The ICU and hospital mortality for the very older people is summarised in Table 1. The ICU mortality for this age group increased from 29% to 33% but the hospital mortality was unchanged at 44%. Conclusions Changes in population demographics are reflected in our critical care by an increase in the number of very older person admissions. The ICU mortality was higher in this group compared with 10 years ago. One possible explanation is the marked increase in emergency admissions. This may reflect an increased willingness to refer the very older patient for critical care support. Reference 1.
Office for National Statistics 2010 Population Estimates [http://www.statistics.gov.uk]
P469 Effect of introducing training in assessment tools for foundation trainees (F2) in intensive care and anaesthesia in a UK teaching hospital A Raithatha, A Khaliq, P Prashast, D Bryden Northern General Hospital, Sheffield, UK Critical Care 2011, 15(Suppl 1):P469 (doi: 10.1186/cc9889) Introduction A 2-year F2 programme was implemented nationally in the UK in 2005. The curriculum consists of core competencies against which trainees are assessed, with a syllabus setting out specific knowledge, skills and attitudes to develop. An essential component of this curriculum is that trainees must meet specific objectives in relation to recognition and treatment of the acutely ill. Assessment tools used are: MSF (multisource feedback), Mini-CEX (clinical evaluation), DOPS (direct observation of procedural skills), and CbD (case-based discussion). Specific training programmes were introduced in 2008 to assist staff with conducting these assessments, as trainees had reported difficulty in completing them. Training was delivered using mixed methods of face-to-face contact backing up e-learning. Aims were to assess the number and grade of medical staff involved in assessment; to assess their willingness to be involved in F2 training and any barriers existing; to assess the degree of training and understanding of assessment tools; and to compare with historical data. Methods The Modernising Medical Careers website [1] was used to create a questionnaire. Data were analysed retrospectively and results compared with those from a previous survey, conducted within our department in 2006. Results Comparisons (bracketed) are with 2006 data. Sixty-four completed forms were returned, representing 51% of those surveyed. A total of 87.5% (80%) were involved in teaching and 68% (42%) in assessment of F2s, with 66% (61%) being consultants. Seventy-six per cent felt that those involved in assessment should have specific training with 72% having received such training, compared with 42% in
2006. Twenty-two per cent would not assess an F2 if approached, with the majority (57%) citing lack of specific training as the reason. Twentyseven per cent (48%) of those involved in assessment had not received any specific training. Of those who had been trained, all respondents had at least some knowledge of DOPS, Mini-CEX and CbD. Conclusions Introduction of training has improved participation in both assessment and teaching, in addition to highlighting the need for those who were untrained not to undertake assessments they had not been trained to do. There is now a good understanding of assessment tools although further training is warranted to emphasise the valuable role of critical care experts in delivering training and assessment to foundation doctors. Reference 1.
Modernising Medical Careers [www.mmc.nhs.uk]
P470 Model Team in the ICU: does the implementation of intensive care assistants affect ICU nursing activity? KB Tang North District Hospital, Hong Kong Critical Care 2011, 15(Suppl 1):P470 (doi: 10.1186/cc9890) Introduction The healthcare workforce shortage is a global phenomenon, especially in the ICU. Use of a register nurse–unlicenced assistive personal model is an undeniable reality that fills the void created. Model Team is a structured training program for healthcare assistants to expand their role, facilitating them to perform nursing tasks that require nursing skill and knowledge. The purpose of the study is to investigate whether the Model Team approach could reduce bedside nursing activities. Methods This was a prospective cohort study. All bedside nurses working in an ICU were recruited. Intensive care assistants have undergone 3-month structuralized training for specific nursing skills, and then served four ICU beds under the supervision of a bedside nurse. Activities of all involved nurses were recorded before and after the implementation of an intensive care assistant service using the work-sampling method. Activities were categorized into six groups: patient care activities consigned to TISS-28; patient care activities not indicated in TISS-28; patient care activities that are not interventions in direct contact with the patient; organizational activities; personal activities; and miscellaneous activities [1]. The TISS-28 score of each patient was recorded during both sampling periods, serving as an indicator for complexity of nursing activity. A statistical test was performed to compare the frequency of patient care activities related to TISS-28 score (Question A) and nursing activities not related to direct patient contact (Questions C, D, E and F), before and after the Modal Team approach. Results In total 29 nurses were recruited, 14 nurses during the control period and 15 nurses after the Model Team approach. Patients in both periods were comparable with no significant difference in TISS-28 score. Patient care activities related to TISS-28 score reduced by 16.33% (mean frequency 3.43 to 2.87, P = 0.249) after the implementation of the intensive care assistant, but were not statistically significant. For nursing activities not related to bedside care, there was an insignificant increase of 1.67% (mean frequency 4.79 to 4.87, P = 0.448). Conclusions The Model Team approach may reduce bedside nursing activities, without effect on nonbedside nursing activities. Further study with a larger sample size should be done to test the hypothesis. Reference 1.
Reis M, et al.: Simplified therapeutic intervention scoring system: the TISS28 items – results from a multicenter study. Crit Care Med 1996, 24:64-73.
P471 Impact of implementing a critical care team in an open general ICU S Kim, IH Kim, S Han, SS Ki, GR Chon Konkuk University Chungju Hospital, Chungju, South Korea Critical Care 2011, 15(Suppl 1):P471 (doi: 10.1186/cc9891) Introduction High-intensity ICU physician staffing is associated with reduced ICU mortality [1]. We formed a critical care team (CCT) that consisted of five teaching staff interested in critical care management.
Critical Care 2011, Volume 15 Suppl 1 http://ccforum.com/supplements/15/S1
S166
Table 1 (abstract P471). Multivariate logistic regression analysis of factors affecting ICU mortality P value Male
0.864
Age
0.237
LOS, ICU
0.281
CCT
0.049
APACHE II
0.012
SOFA
0.004
Mechanical ventilation
<0.001
The CCT had been activated by each member of the team if needed and had provided rapid medical services including consultation. We evaluated the impact of implementing the CCT on open general ICU patient outcomes. Methods We performed a prospective observational study in an open general ICU between March 2009 and February 2010 according to CCT. We compared demographic data, ICU mortality rates, length of ICU stay, APACHE II scores, Sequential Organ Failure Assessment (SOFA) scores, patients who received mechanical ventilation, and success rates of weaning in CCT with those in non-CCT. Results We analyzed 857 patients’ data (161 cases in CCT vs. 696 cases in non-CCT), excluding readmission cases. Patients who received CCT management were more severe than those who received non-CCT management significantly (APACHE II 21.4 vs. 17.7; SOFA 5.8 vs. 4.9). Although there were more patients on applied mechanical ventilation (46% vs. 23.6%) in CCT than those in non-CCT and a higher success rate of weaning (60.8% vs. 43.9%) in CCT than those in non-CCT, there was no significant difference of unadjusted ICU mortality rates in both groups (14.3% in CCT vs. 12.2% in non-CCT). Using a multivariate logistic regression model, the ICU mortality rate was associated with non-CCT, APACHE II scores, SOFA scores, and applied mechanical ventilation (Table 1). Conclusions Although the CCT was not a full-time coverage team in the open general ICU, the CCT model was associated with reduced ICU mortality, especially in patients who received mechanical ventilation. Reference 1.
Pronovost PJ, et al.: JAMA 2002, 288:2151-2162.
P472 Impact of a program of training on the performance of a track and trigger system and outcome of ICU admissions M Waraich, J Zwaal, M Johnson Kingston Hospital, Kingston Upon Thames, UK Critical Care 2011, 15(Suppl 1):P472 (doi: 10.1186/cc9892) Introduction The introduction of track and trigger systems for hospitalised patients has been associated with improvement in outcome through earlier identification of sick patients [1]. We set out to improve the performance of our track and trigger system through a program of intense training of frontline medical and nursing staff with the aim to improve outcome of patients admitted to ICU. Methods A retrospective chart survey of all ICU admissions from the ward 3 months before and after conclusion of a program of training was carried out. Out of a total of 64 charts, four were incomplete and three concerned planned postoperative ICU admissions and were therefore omitted from analysis. Training emphasized triggering of the pathway if two or more physiological parameters were outside the normal range: respiratory rate <10 or ≥25, SaO2 <90%, systolic blood pressure <90, heart rate <50 or ≥110 and/or neurological response to painful stimulus only. The pathway could also be triggered by clinical concern about the patient. Triggering progressed through involvement of junior medical and nursing staff at step 1, intermediate level at stage 2 and senior medical and ICU staff at step 3. Outcome parameters: compliance with pathway steps and mortality of ICU admissions. Differences between proportions were tested according to the method described by Armitage and colleagues [2] with P <0.05 taken as significant.
Results Significant improvement was found in triggering at steps 1 and 3 with a reduction in noncompliance at step 1 from 51.7% to 28.1% (P = 0.044) and at step 3 from 31% to 9% (P = 0.018). The pathway compliance overall showed a nonsignificant improvement from 17.2% to 33.3%. Pathway noncompliance showed a trend towards occurrence out of hours (70% vs. 60.5%). Pathway sensitivity was unchanged (69% before vs. 61.4% after). There was no difference in ICU mortality pre and post training (41.4% vs. 47.4%, P = 0.6). Neither was there a difference in ICU mortality between pathway followers and nonfollowers (57.9% vs. 42.1%, P = 0.95). Conclusions Improved performance of the track and trigger system did not lead to improved outcome in patients admitted to the ICU. References 1. 2.
Konrad D et al.: Intensive Care Med 2010, 36:100-106. Armitage et al.: Statistical Methods in Medical Research. Oxford: Blackwell; 2002.
P473 Impact of increased numbers of intensive care consultants on outcome in a central London teaching hospital V Metaxa, C Bell, A Feehan, K Peters, T Chang, P Hopkins, M Ervine King’s College Hospital, London, UK Critical Care 2011, 15(Suppl 1):P473 (doi: 10.1186/cc9893) Introduction The standardised mortality ratio (SMR) is a key parameter by which ICUs quantify their performance. We report the effect of increased ICU consultant numbers on mortality and SMR in a central London teaching hospital. Methods The study was registered with the Clinical Audit Support System. Data were collected prospectively from March 2005 to date by a dedicated audit team and were analysed as part of routine audit. Results Table 1 shows the reduction in mortality and SMR from 2005 to date, comparing these data with patient and consultant numbers. Table 1 (abstract P473). SMR and mortality reduction from 2005 to date Number of admissions
Number of consultants
ICU Median mortality APACHE II (%)
2005 to 2006
646
5
18
34.4
0.93
2006 to 2007
774
5
17
19.3
1.15
ICU SMR
2007 to 2008
842
9
14
16.8
0.91
2008 to 2009
1,510
13
14.5
14.7
0.77
2009 to 2010
1,671
13
17
19.3
0.67
2010 to 2011 (incomplete)
1,434
17
19
19
0.62
Conclusions In this study we describe the remarkable reduction in both mortality and SMR that has occurred in the general ICU at King’s College Hospital over the past 5 years. The improvement in outcomes was associated with a quadrupling of ICU consultant numbers. We hypothesize that this increase in intensivist numbers allowed the reinforcement of a closed model of ICU care. We are now further analysing these data to search for quantitative improvements in surrogate markers of quality of care over the same time frame. References 1. 2.
Provonost PJ, et al.: JAMA 2002, 288:2151-2162. Baldock G, et al.: Intensive Care Med 2001, 27:865-872.
P474 Intensivist-led on-call service: key step in mortality reduction NJ Harris, H Kilner, A Krishnamurthy, P Bishop The Princess Alexandra Hospital NHS Trust, Harlow, UK Critical Care 2011, 15(Suppl 1):P474 (doi: 10.1186/cc9894) Introduction We conducted an audit to determine whether a change to a dedicated intensivist rota in our district general hospital ICU improved patient outcome. Our unit, like many others around the
Critical Care 2011, Volume 15 Suppl 1 http://ccforum.com/supplements/15/S1
S167
Table 1 (abstract P474). Patient demographics Factor
Cycle 1
Cycle 2
Subjects
82
76
‰ male
48
59
Mean age (years)
63
64
Age range (years)
19 to 91
21 to 91
APACHE Range
24.8
17.6
5 to 36
5 to 42
country, had historically been covered out of hours by anaesthetists rather than specialists in intensive care medicine. This audit therefore had potentially far-reaching implications for many other similar ICUs in the UK. Methods We conducted a retrospective analysis on data obtained from the ICNARC database, patient notes, drug charts and ICU charts over two cycles. The first ran from 1 December 2008 to 31 January 2009, when the conventional on-call consultant rota was still in operation. The second ran from 1 January 2010 to 31 March 2010, following implementation of a dedicated intensivist rota. Our primary outcome measure was unit mortality. We analysed a further eight parameters as indirect markers of good clinical practice. These were tidal volume, urine output, glycaemic control, lactate, mixed venous oxygen, and appropriate prescription of gastric protection, antibiotics and venous thromboembolism prophylaxis. Results Patient demographics were similar between the two cohorts under investigation, but the mean admission APACHE II score was found to be significantly lower following the rota change, as shown in Table 1. This reduced inpatient unit mortality from 39% in cycle 1 to 25% in cycle 2. However, the change to an intensivist rota made little difference to our markers of good clinical practice. Conclusions Our study suggests that the improvement to unit mortality was secondary to patient selection, rather than a fundamental change in clinical practice within the ICU. This indicates that a dedicated rota, in which consultant intensivists lead on out-of-hours referrals, reduces the number of inappropriate admissions to the ICU.
was extremely low in medicine wards versus surgical ones (25% vs. 60%) despite recurrent meetings with ward staff, owing to reluctance of physicians to call the MAT. There were more critically ill patients in surgery, notably in orthopedics, than in medicine wards (MEWS >3: 22% vs. 7%). As a result of MAT intervention, 30% of patients were admitted to the ICU (mostly from surgery). Conclusions MAT is ongoing with good acceptance from nurses and good compliance, especially in surgery wards; the inclusion of MEWS into the EHR turned out to be a great support for the nurses. MAT represents a safety system for in-hospital patients at risk, as advocated also by the Tuscany Health Agency for Quality that, in the aim of developing good practices for patient safety, recommends MEWS for tracking and managing critical in-hospital patients. P476 Does implementing a rapid response system decrease the number of in-hospital cardiac arrests? R So, L Te Velde, H Ponssen, M Frank, S Hendriks, E Oskam Albert Schweitzer Hospital, Rotterdam, the Netherlands Critical Care 2011, 15(Suppl 1):P476 (doi: 10.1186/cc9896) Introduction Resulting from the Dutch VMS Safety Program ‘Prevent Injury, Work Safely’, we recently started to implement a rapid response system (RRS) in our hospital. The purpose of the RRS is to recognize and treat the patients with clinical warning signs early on the ward to reduce preventable hospital-wide avoidable injury. We present the first outcome data for the implementation of the RRS. Methods From 1 May 2008 to 1 May 2009 we implemented in both clinical locations of our hospital a RRS, which has three basic limbs: an afferent limb (RRS activation card), a physician-led medical emergency team (MET) and an evaluation/feedback limb. We collected data regarding all MET calls from 1 May 2008 to 1 July 2010 and we focused on the number of in-hospital cardiac arrests (CA). Results See Table 1. Table 1 (abstract P476). Number per 1,000 discharged patients 2007
2008
2009
2010
Dordrecht
0
1.2
3.2
2.9
Zwijndrecht
0
6.4
11.8
10.9
Dordrecht
1.4
1.2
1.4
1.4
Zwijndrecht
2.6
1.3
0.6
0.6
MET calls
P475 Mews Anesthesia Team: a project for in-hospital patient safety R Oggioni, L Tadini Buoninsegni, G Iannello, C Rosati Azienda Sanitaria Firenze, Borgo San Lorenzo, Italy Critical Care 2011, 15(Suppl 1):P475 (doi: 10.1186/cc9895) Introduction In past years, to improve in-hospital patient safety, rapid response teams were put in place to treat, on ward’s call, the patients at risk in order of their severity. Methods In the Azienda Sanitaria Firenze, a dedicated group of intensivists and nurses developed a project called the Mews Anesthesia Team (MAT) in order to prevent and manage clinical deterioration of patients. This would be achieved through the activation of a rapid response team lead by an intensivist acting in accordance with an intervention flowchart. The project was based on the Modified Early Warning Score (MEWS), a validated warning score designed to alert ward nurses to patients at risk (MEWS >3) and/or to trigger MAT intervention (MEWS >5). Previously the group realized a pilot phase involving 420 patients, preceded by a 1-day dedicated course addressed to ward staff ; the preliminary results showed in 12% of patients with MEWS >3, that sicker patients were located more in medical wards, while more calls/interventions of MAT were performed in surgical wards. Subsequently MEWS was plugged into the nurse electronic health record (EHR) allowing one to display automatically the score and to stratify patients according to level of care and frequency of monitoring required. The final phase of the project started from our hospital, preceded by courses for the ward staff (mostly nurses). Results The performance indicator, that is nurse’s compliance in MEWS, was high in surgical wards compared with medical ones (88% vs. 71%); this difference is because until recently medicine nurses fill in MEWS only by sheet records. The adherence to the interventional flowchart
In-hospital CA
Conclusions Implementation of a RRS can decrease the number of inhospital cardiac arrests dramatically and thus avoid (serious) adverse events and possible deaths. Possible success factors include: timely activation of the RRS, the degree of implementation of the RSS, and timely agreed restrictive measurements on the general ward. P477 Impact of training in the use of an early warning system on in-hospital cardiac arrests A Raj, J Zwaal Kingston Hospital NHS Trust, Kingston upon Thames, UK Critical Care 2011, 15(Suppl 1):P477 (doi: 10.1186/cc9897) Introduction The introduction of an early warning system (EWS) has been associated with a reduction in in-hospital cardiac arrest (CA) [1]. We set out to determine the impact of a programme of training in the use of an EWS on the number and nature of CAs in our hospital. Methods We conducted a retrospective chart survey of all adult CA patients pre and post implementation of a training programme in the use of the EWS. If a patient develops abnormalities in two or more physiological parameters, the system forces escalation of care through three levels of care, with involvement of junior medical staff
Critical Care 2011, Volume 15 Suppl 1 http://ccforum.com/supplements/15/S1
S168
at level 1 and senior ICU medical staff at level 3. Abnormal physiology was defined as: SaO2 <90%, HR <50 or ≥110/minute, systolic blood pressure <90 mmHg, conscious level: only responsive to pain, respiratory rate <10 or ≥25/minute or clinical concern about the patient. Outcome parameters: CA/1,000 bed-days, percentage of CPR attempts deemed inappropriate by two senior intensivists, percentage of patients (in whom CPR attempts were deemed appropriate) with abnormal physiology prior to CA and survival post CA. Charlson’s comorbidity index (CCI) [2] was calculated for both periods. Differences between mean values were tested with Student’s t-test and differences between percentages were tested according to the method described by Armitage [3]. Results After adjusting for age (mean pre: 81.7, post: 81.8 years (P = 0.99)), sex and co-morbidity (CCI pre: 6.4, post: 6.66 (P = 0.79)): CA/1,000 bed-days pre: 0.89, post: 0.76 (P = 0.24); percentage of inappropriate CPR attempts pre: 62.5%, post: 33% (P = 0.11); percentage of cases with abnormal physiology identified prior to arrest pre: 68.8%, post: 75% (P = 0.72); and survival pre: 12.5%, post: 0% (P = 0.20). Conclusions Training in EWS was associated with a reduction in the number of CAs and percentage of inappropriate CPR attempts, both of which are in keeping with the literature. However, there was no significant difference in the percentage of cases with abnormal physiology identified prior to CA between both periods and there was no survival benefit after CA. An early warning tool may be unable to prevent CA in a subset of patients with deranged physiology. References 1. 2. 3.
Konrad D, et al.: Intensive Care Med 2010, 36:100-106. Charlson ME, et al.: J Chronic Dis 1987, 40:373-383. Armitage: Statistical Methods in Medical Research. 4th edition. Oxford: Blackwell; 2002:124–125.
P478 Daily physiological goal-setting: medical prescription and nursing adherence in a London teaching hospital ICU MK Khan, S Alawad, M Thavasothy Royal London Hospital, London, UK Critical Care 2011, 15(Suppl 1):P478 (doi: 10.1186/cc9898) Introduction Individual, clearly defined physiological goal-setting can help to optimize patient care [1]. At our ICU, eight physiological goals can be prescribed on the daily ICU observation chart. These include Hb, MAP, ICP, CPP, pO2, pCO2, fluid balance and sedation scores. We performed a prospective audit assessing doctors’ compliance with goal-setting, nursing adherence to these, and what goals nurses used when none were documented. Methods An audit was carried out from December 2009 to March 2010. A total of 90 bedside charts were reviewed at random. Data collected included the total number of goals specified by the ICU medical team, the percentage of time those goals were achieved and what goals nurses set themselves if no goal had been previously documented. Results Goals were prescribed for only 53% of patients. Most commonly prescribed were CPP targets for 63% of those with ICP bolts. The remaining parameters were prescribed for between 17 and 38% of patients, with balance and sedation goals being least commonly specified. For the ARDS subgroup of patients, no fluid balance goals were documented. Certain patterns were also evident; for example, pCO2 goal was more commonly stipulated for patients in the neuro group (for 41% of the group). However, there was no pattern seen in the number of goals specified per patient or according to the length of patient stay on the ICU. When goals were set, all targets were met 62% of the time, with >80% of targets met 79% of the time. When goals were not documented, however, 46% (pCO2) to 78% (fluid balance) of nursing staff were unable to specify what range of parameters they
aimed to keep within. The remainder that did aim for particular target ranges stated they were aiming for physiologically normal parameters. Whilst sensible, this may not have been appropriate for some patients. For example, for fluid balance, a small number aimed for goals specified on previous days but 78% did not aim to achieve any goal, occasionally resulting in an inappropriately positive fluid balance. Conclusions Adherence with physiological goal prescription amongst doctors is poor. When goals have been set, nursing adherence to them is very good. However, when no goals have been set, the physiological parameters that nursing staff aim for can be both variable and inappropriate, potentially resulting in both increased morbidity and prolonged length of stay on the ITU. Reference 1.
Holcomb BW, et al.: Curr Opin Crit Care 2001, 7:304-311.
P479 Automated reporting of safety bundles: streamlining the performance improvement process W McGee, T Higgins, J Echols, H Nelson, M Tidswell Baystate Medical Center, Springfield, MA, USA Critical Care 2011, 15(Suppl 1):P479 (doi: 10.1186/cc9899) Introduction Safety checklists, long used in aviation, have migrated to the critical care setting in an effort to reduce complications and improve patient outcomes. We developed an automated system to provide real-time feedback to the healthcare team on safety bundle compliance in the ICU. Methods A program was written in Cerner Command Language to automatically search data within the EMR for the most recent values of the following data: ventilation mode, respiratory rate, tidal volume, ideal body weight, administration of any sedative infusion, analgesic infusion, neuromuscular blocking agent, stress ulcer prophylaxis, DVT prophylaxis and regular diet, enteral nutrition, or total parenteral nutrition. Nursing documents oral decontamination, head-ofbed elevation, and whether a sedation vacation was conducted. A customized document was created to capture any patient/family/proxy discussions about end-of-life issues. High and low glucose values and the percentage of all glucose values within the range of 60 to 180 mg/ dl are also reported. A summary score was calculated by subtracting (from a baseline of 9) one point each for inappropriate tidal volume, failure to do a weaning trial, lack of oral care, head-of-bed elevation and stress prophylaxis, no sedation vacation and absent DVT prophylaxis, absent nutritional support or glucose values out of range. A perfect score is 9; lower scores indicate an opportunity for improvement. Clinicians access the report from within the hospital’s EMR and can view it on a portable device (iPad) or print it to carry on rounds. Results A partial report with data for two patients is shown in Table 1. Conclusions Automatic reporting of compliance with patient safety protocols is a useful performance improvement tool that further identified areas for improvement. Future study should assess the impact of this tool on actual compliance with patient safety goals. P480 Prevalence, clinical management and risks associated with acute faecal incontinence in the critical care setting: the FIRST questionnaire survey R Binks Airedale NHS Foundation Trust, Bradford, UK Critical Care 2011, 15(Suppl 1):P480 (doi: 10.1186/cc9900) Introduction The FIRST survey was designed to examine the prevalence, awareness and management of acute faecal incontinence
Table 1 (abstract P479). ICU safety bundle report Loc
Vent
f/Vt
Vt/IBW
Stress NM block
Oral
HOB
DVT 24-hour glucose % glu
Pain
Sed
Sed vac
Nutr
Score
4202
AC
0
6
Y
N
Y
Y
Y
105.216
67
Y
N
Y
R
6
4203
PSV
15
Y
N
N
Y
Y
Y
NA
0
Y
N
Y
R
6
Critical Care 2011, Volume 15 Suppl 1 http://ccforum.com/supplements/15/S1
with diarrhoea (AFI), and the clinical challenges associated with AFI for healthcare professionals (HCP) in the critical care setting. Methods A descriptive cross-sectional survey. Data were collected from ICUs or critical care units in Germany, Italy, Spain and the UK using a questionnaire. The questionnaire contained 20 questions for completion by HCP, and six specific questions for hospital pharmacists or purchasing personnel. Questions concerned the epidemiology, awareness and management of AFI, and associated clinical issues. Analysis of the results was conducted so that respondents remained anonymous. Results A total of 960 questionnaires were completed (Germany n = 200; Italy n = 261; Spain n = 267; UK n = 232) by nurses (60%), physicians (29%) and pharmacists or purchasing personnel (11%). Estimated prevalence of AFI ranged from 9 to 37% of patients on the day of the survey. The majority of respondents reported a moderately low awareness of the clinical challenges associated with AFI and its prioritisation in their units. Patients with AFI commonly had compromised skin integrity (perineal dermatitis, moisture lesions or sacral pressure ulcers). Reducing the risk of cross-infection and protecting skin integrity were rated as the most important clinical challenges. Forty-nine per cent responded that they had no hospital protocol or guideline for the management of AFI. There was generally low awareness of nursing time spent managing AFI episodes by some hospital personnel, but 60% of respondents estimated that 10 to 20 minutes are required for managing an AFI episode, requiring two or three healthcare staff. The key reported benefits of faecal management systems included: reduced risk of cross-contamination and infection, reduced risk of skin breakdown, and improved patient comfort and dignity. In those not using a faecal management system, the main reason reported was lack of availability or that devices were not included in the hospital guidelines. Conclusions AFI in the critical care setting may be an underestimated problem that is associated with a high use of nursing time. In many institutions there is a lack of protocols or guidelines, which might improve the management of AFI in the critical care setting. Acknowledgements Grant received from ConvaTec, Skillman, NJ, USA.
P481 Patient safety in ICUs: adverse events characterization and potential risk factors L Zambon1, R Daud-Gallotti1, K Padilha2, T Vasconcelos3, N Inoue3, F Rodrigues3, L Tanigushi1, I Velasco3 1 Clinics Hospital of University of São Paulo School of Medicine, São Paulo, Brazil; 2University of São Paulo School of Nursing, São Paulo, Brazil; 3University of São Paulo School of Medicine, São Paulo, Brazil Critical Care 2011, 15(Suppl 1):P481 (doi: 10.1186/cc9901) Introduction ICUs are complex settings, with critically ill patients submitted to invasive care, involving a multidisciplinary team, requiring urgent high-risk decision-making, taking place in an expensive structure with new technologies of increasing complexity. All these conditions facilitate the development of adverse events (AEs). We aimed to determine the occurrence of AEs in four tertiary academic ICUs in Brazil, disclosing their potential risk factors. Methods This prospective cohort was conducted in four medical ICUs of a major academic, tertiary hospital in Brazil, enrolling all adult admissions during June to August 2009. AEs were identified by direct daily monitoring of medical and nursing rounds and chart review. Age, sex, APACHE II scores, length of stay (LOS), and the Nursing Activities Score (NAS) were also registered. The association with the occurrence of AEs was analyzed with logistic regression. Results A total of 180 ICU admissions were included, regarding 176 patients (male/female: 86/90; age: 52.7 ± 1.8 years). The mean LOS, APACHE II scores and NAS were 10.0 ± 0.8 days, 15.7 ± 0.5 points and 69.0 ± 1.5%. Nearly 78% of the admissions (141 admissions) suffered 1,065 AEs. The most frequent AEs were: new dermatitis/pressure ulcers (195 events = 18.3% of events); hypoglycemic episodes not related to
S169
insulin use (HENI) (168 events = 15.8%); diagnostic/treatment failures (156 events = 14.6%); and drug AEs (195 events = 12.8%). Those four categories responded for 61.5% of all detected AEs. In the final logistic regression model, three independent variables remained as important risk factors for the occurrence of at least one AE: LOS >3 days, APACHE scores >13 points and NAS >70%, with adjusted OR estimates of 19.5, 3.4 and 3.3, respectively (P <0.02). Conclusions This prospective study was essential to identify the proportion of our ICU admissions affected by AEs, disclosing their nature. Our AE rates, affecting nearly 78% of admissions, were higher than those previously described. The direct observation of the ICUs contributed to those rates. Six out of 10 AEs corresponded to new cutaneous lesions, HENI, diagnostic/treatment failures and drug AEs. Length of stay, severity on admission and nursing workload were important risk factors for the occurrence of at least one AE. Acknowledgements This study was sponsored by FAPESP. Reference 1.
Rothschild JM, et al.: The Critical Care Safety Study: the incidence and nature of adverse events and serious medical errors in intensive care. Crit Care Med 2005, 33:1694-1700.
P482 Failure to define level 1 care B Fletcher, C Dames, S Hutchinson, S Fletcher Norfolk & Norwich Hospital, Norwich, UK Critical Care 2011, 15(Suppl 1):P482 (doi: 10.1186/cc9902) Introduction This observational prevalence study applies three definitions of level 1 care to a hospital-wide cohort of adult patients in a university hospital and a district general hospital, to test the validity of measures to define at-risk patients outwith critical care. This report provides a first look at the university arm of the study. The importance of correctly applying an acceptable definition is twofold. Firstly, an individual at risk of deterioration may be highlighted to critical care outreach services (CCOS). Secondly, a population of at-risk patients may identify an unmet resource need. The three common definitions are: Intensive Care Society (ICS) [1], Department of Health: Comprehensive Critical Care (CCC) [2] and Association of UK University Hospitals (AUKUH) [3]. The earliest definition of a level 1 patient by CCC identifies recent critical care discharges and/or deteriorating patients needing CCOS [1]. The ICS definition adds detail to this by scoping the options for monitoring or clinical intervention [2]. The AUKUH identifies two subgroups within level 1: acutely ill or deteriorating patients, and stable patients with greater nursing dependency [3]. Methods Data were collected from all inpatients by a team of trained researchers, using hand-held computers, over 5 days. The paediatric, maternity, oncology and emergency units were excluded. A central data controller guarded against omissions or duplications. The acuity criteria dataset was constructed by a regional expert critical care steering committee. The dataset from the university and district hospital sites have not yet been combined. Results A total of 696 patients were included, representing >97% of patients in surveyed wards. Within the 24-hour period before data collection: four patients had CCOS review, nine had stepped down from level 2/3 care and 51 had MEWS >3. In total, 371 patients (53%) met the criteria of at least one of the definitions, if not all three. Conclusions A significant proportion of adult patients meet one or more of the current definitions for level 1. We suggest that the current definitions may be unhelpful in identifying at-risk patients outside critical care. Further work is planned to investigate whether certain criteria, or combinations thereof, are better predictors of unmet clinical need, or contribute more to patient safety. References 1. 2. 3.
Levels of Critical Care for Adult Patients. London: Intensive Care Society; 2009. Comprehensive Critical Care: A Review of Adult Critical Care Services. London: Department of Health; 2000. AUKUH Acuity/Dependency Tool. London: Association of UK University Hospitals; 2007.
Critical Care 2011, Volume 15 Suppl 1 http://ccforum.com/supplements/15/S1
P483 Robotic telepresence in acute care facilities in community hospitals in Mexico G Vazquez de Anda1, S Larraza Rico2, L De la Cruz Avila2, S Resendiz2, M Escudero2, R Tapia Rodriguez2, Y Gutierrez Mariano2, G Diaz Diego2, J Mejia Nava2, R Camacho Beiza2 1 Universidad Autonoma del Estado de Mexico, Toluca, Mexico; 2Hospital Materno Perinatal Monica Pretelini del Instituto de Salud del Estado de Mexico, Toluca, Mexico Critical Care 2011, 15(Suppl 1):P483 (doi: 10.1186/cc9903) Introduction Telepresence using robots (TPR) in acute care facilities (ACF) is being increasingly accepted as a new and practical way of solving the shortage of intensivists in community hospitals (CH) where there are not specialists available 24/7 [1,2]. The main objective of this study is to show the early experience of using TPR in four CH in Mexico. Methods Four CH with 60 beds each were fully equipped with a telepresence system that includes: high-speed connectivity, wireless Internet access, a RP-7i robot (INTOUCH HEALTH, Santa Barbara, CA, USA), three computers (laptops) per hospital and one central computer based at the MPH. Additionally, all four CH has a specific team for technical support. The CH cover medical care to people without social security and are far away from the capital city at not less than 42 km (Tenancingo 42 km, Atlacomulco 63 km, Valle de Bravo 85 km and Tejupilco 90 km). The program includes a team of certified intensivists that is based at MPH. The task of the team is to assist physicians in ACF, which includes the emergency room (ER), ICUs and the operating room (OR). The program includes: rounds at ACF every day three times a day 24/7 and every time that it is needed. The MPH team gives assistance in: advanced trauma life support (ATLS), advanced cardiovascular life support (ACLS), advance life support for pregnant women (APLS), neurological support (NS), rapid response team support (RRTS), and air transportation assistance (AT). Hospitalization, discharge, transfer to high-care hospitals, and mortality were recorded. Results From 1 May to 30 November 2010, 319 patients were attended by the MPH team: 54 ER patients, 16 ATLS and 66 ACLS interventions, 106 ICU patients, 17 interventions as RRTS, 76 APLS, six AT, 27 OR assistances, and 22 NS. Forty-five percent of patients were discharged home, 25% were transferred to high-care hospitals, 9% were still in hospital and the total mortality rate was 19%. Conclusions This preliminary report shows that the practice of telepresence using robots in ACF is feasible at community hospitals in Mexico. Additionally, we observed minimal resistance to the expertise given by the MPH team. References 1. 2.
Vespa P: Robotic telepresence in the intensive care unit. J Crit Care 2005, 9:10. Vazquez de Anda GF, Larraza S: Telepresence using robots in acute care facilities. ICU Manage 2010, 10:20-23.
P484 System-level concentration of services for mechanically ventilated patients can mask substantial regional heterogeneity and disorganization DJ Wallace1, DC Angus1, MR Rosengart1, TJ Iwashyna2, JM Kahn1 1 University of Pittsburgh Medical Center, Pittsburgh, PA, USA; 2University of Michigan, Ann Arbor, MI, USA Critical Care 2011, 15(Suppl 1):P484 (doi: 10.1186/cc9904) Introduction In the United States, critical care bed allocation is increasing, despite a decline in the number of hospitals. This process suggests a centralization of intensive care may be occurring even without central planning. In an effort to provide more efficient healthcare, many national healthcare systems have considered deregulating and decentralizing authority but have been wary about whether nongoverned, deregulated healthcare would yield naturally centralized care as a function of market forces. We evaluated the concentration of critical care services for mechanically ventilated patients in the state of Pennsylvania over time as a model for this in a decentralized system that is undergoing concentration.
S170
Methods We performed a retrospective cohort study using Pennsylvania discharge data. All adult intensive care discharges between 2004 and 2008 with procedure codes for mechanical ventilation were eligible. We examined regional population-adjusted mechanical ventilation rates and the concentration of services over time. We evaluated changes in the Herfindahl–Hirshman Index (HHI), an accepted measure of overall market concentration, with larger numbers indicating greater concentration. Results Hospital numbers declined over the 4 years (180, 177, 173, 173), while the number of discharges remained constant (37,635, 36,883, 37,701, 37,793). At the state level, the annual rate of discharge did not change (3.04 per 1,000 persons in 2004 to 3.05 in 2008). However, there was substantial regional variability, with three regions increasing in volume, two decreasing, and four remaining unchanged. At the state level, services were unconcentrated and did not change over time: the HHI was 160 in 2005 and 166 in 2008; however, some regions substantially concentrated while others remained the same. The most concentrated regions in 2005 (HHIs: 1,751, 2,239 and 2,886) became more concentrated by 2008 (HHIs: 1,925, 3,532, 3,564). Conclusions Left to their own devices, some regions seem to centralize while others remain stagnant. Isolation of factors that drive adaptive concentration of services could be fruitful for national health systems interested in combining deregulation with centralization. Policy is needed to support outcomes-based regionalization, as a haphazard redistribution risks falling out of step with overall public health objectives if only global control of bed allocation is used. Acknowledgements Supported by NIH grant T32-HL07820.
P485 Understanding staff perspectives on collaborative quality improvement in the ICU: a qualitative exploration KN Dainty1, DC Scales2, B Hales2, T Sinuff2, M Zwarenstein2 1 St Michael’s Hospital, Toronto, Canada; 2Sunnybrook Health Sciences Centre, Toronto, Canada Critical Care 2011, 15(Suppl 1):P485 (doi: 10.1186/cc9905) Introduction Despite extensive use of QI collaboratives in healthcare and in critical care, little is known about the impact of the collaborative approach on how the intervention is taken up within participating organizations. This in-depth qualitative study investigates the frontline critical care staff perspective on being involved in a large collaborative network for ICU quality improvement. Methods One-on-one key informant interviews were conducted with 32 staff members from a sample of the ICUs who participated in the Ontario ICU Best Practice Collaborative between 2006 and 2008. Using a grounded theory approach, open coding was completed by two qualitative researchers. The open codes were then grouped in to broad theme-oriented categories and all text segments belonging to the same category were then compared. The theme-oriented categories became further refined and formulated into fewer analytic categories through an inductive, iterative process of going back and forth between the data and the analytic framework of the study. Results This research reveals that frontline staff do not feel the need for their unit to be ‘like’ high-performing peer organizations; they feel that belonging to a collaborative provides the chance to be recognized for providing a high level of care despite their inequalities. The existing QI communication structure within ICUs is highly ineffective for staff engagement, and a QI bubble seems to exist in terms of knowledge transfer. Finally, the idea of collaboration is exhibited more internally in increased intra-team cooperation than externally between organizations, where friendly competition is a more prominent driver. A conceptual framework for QI collaborative design is proposed for future testing. Conclusions These findings indicate that QI collaboratives for ICUs may not function by commonly held inter-organizational assumptions of legitimization, communication and collaboration, which may explain typically mediocre results. Hopefully this work can contribute insight into strategies for more effective use of collaborative efforts for healthcare QI and support new perspectives on their design for use in the ICU environment.
Critical Care 2011, Volume 15 Suppl 1 http://ccforum.com/supplements/15/S1
S171
P486 Improving medication safety on critical care using an anonymous electronic medication incident reporting system H Dillon, M Rosbergen, R Wyatt, J Nortje Norfolk & Norwich University Hospital, Norwich, UK Critical Care 2011, 15(Suppl 1):P486 (doi: 10.1186/cc9906) Introduction To improve medication safety on the Critical Care Complex (CCC), Norfolk & Norwich University Hospital, an anonymous electronic reporting system was introduced. Reports captured populate a local database of incidents, which identifies themes. Medication incidents are common; studies reveal up to 10.5 incidents per 100 beddays [1]. Under-reporting of incidents in the CCC was highlighted in a paper-based 2-week reporting project. The electronic reporting system expands this work, introducing a sustainable, integrated reporting system, addressing some of the reporting barriers. Methods A staff survey identified barriers to incident reporting such as access to forms, time taken to complete reports and fear of disciplinary action. An anonymous medication incident system was developed and implemented in the bedside clinical information system, Metavision®. One-to-one education sessions highlighted the system and a survey informed optimal form design. Incidents reported were entered into a database and categorised by time, error types and themes. The database allowed identification of processes needing improvement. Subsequently, targeted changes to the systems surrounding medications were introduced to reduce specific incident types. Results Over 34 weeks, 194 medication incidents were reported. The most common types of incidents were infusion documentation (Gantt), wrong dose, duplication, wrong rate and wrong frequency errors. System changes in response to these errors have reduced their incidence (Figure 1). Conclusions Incident reporting has improved significantly from a baseline of 19 reports in 2 years. The new reporting system has enabled targeted changes, eliminating some of the most common errors, improving medication safety. Fluctuating numbers of reports may still indicate under-reporting. Themes remain that have yet to be addressed. Reference 1.
Valentin et al.: Intensive Care Med 2006, 32:1591-1598.
Figure 1(abstract P486). Effect of system changes.
P487 Reduction in the incidence of VAP and mortality rates in the ICU after implementation of hand hygiene education protocols and extensive ICU reconstruction work K Filos, F Fligou, A Gotsi, D Velissaris, C Sklavou, M Marangos University of Patras, School of Medicine, Rion – Patras, Greece Critical Care 2011, 15(Suppl 1):P487 (doi: 10.1186/cc9907) Introduction Education in effective hand hygiene in the ICU is often neglected. The scope of this study is to detect the effects of an educational program on the incidence of VAP in a mixed ICU. Methods Two groups of patients in two comparable time periods (9 months each) before and 6 months after implementation of various hygiene measures were analyzed. The measures implied: implementation of foot-operated hand washbasins, training in the effective use of hand washing followed by use of alcohol-based antiseptic dispensers near each ICU bed, and others. The diagnosis of VAP was by using clinical, microbiological, radiographic criteria, and by the CPIS index. Statistics was with ANOVA and x2. Results Despite the comparable APACHE II scores at ICU admission (17.6 ± 6.5 vs. 18.1 ± 6.9) the two groups differed in variables as shown in Table 1. The incidence of VAP and mortality of Group 2 patients were significantly reduced. The RR of death in the control group was significantly increased (RR = 1.364, 95% CI: 1.055 to 1.763). The mortality of trauma patients in the protocol group was significantly lower (Group 1: 57.1% vs. 0% (Group 2), P <0.05). Conclusions The implementation of protocols regarding hand hygiene by healthcare professionals in the ICU, together with a reconstruction, may lead to a significant reduction in the incidence of VAP and mortality both in the crude ICU patient population and in the subgroup of polytrauma patients.
P488 Paediatric admissions to an adult ICU in a district general hospital in the UK A Hazara, V Singh, P Davoudian Addenbrooke’s NHS Foundation Trust, Cambridge, UK Critical Care 2011, 15(Suppl 1):P488 (doi: 10.1186/cc9908) Introduction Data were collected for paediatric admissions to an adult ICU in a district general hospital in the UK over a 6-year period to look for feasibility and the associated problems of training and skills after centralisation of PICUs in the country. Methods We searched the ICNARC database for all entries relating to children for their age, gender, and diagnosis at admission, source of referral, length of stay, level of support, outcome/discharge and any other problems highlighted during their stay in the unit between the years 2002 and 2009. Results Thirty-eight children were admitted to the adult critical care unit during this period. The age range was from 6 months to 16 years (average 9.12 years). Seventeen patients were male and 23 female. The most common reason for admission to the unit was respiratory problems followed by trauma. Seventeen patients received level 2 care and 21 received level 3 care. Twenty children needed endotracheal intubations, 12 needed arterial lines, 10 needed central lines and two needed intercostal drains. Twenty-one patients received sedation, most commonly with midazolam and morphine. The average length of stay in the ITU was 1.5 days and 80% of patients were discharged from the ITU within 2 days. Twenty-two patients were discharged to the ward
Table 1 (abstract P487). Mortality in crude ICU patients and trauma patients with VAP Mortality of all patients (%)
Incidence of patients with VAP/mortality (%)
Incidence of trauma VAP patients/mortality (%)
Group 1 (n = 201, control)
44.3%#
10.4/67.6
15.9/57.1
Group 2 (n = 191, protocol)
32.5%**
5.2/40.0*
8.9/0*
Data are in total numbers (n) or proportions (%). *P <0.05, **P <0.01 for comparisons between two groups. #Relative risk = 1.364 (95% CI: 1.055 to 1.763) compared with Group 2 (protocol).
Critical Care 2011, Volume 15 Suppl 1 http://ccforum.com/supplements/15/S1
and 16 were transferred to a specialist ICU. Thirteen of these specialist transfers were to a local specialist centre and three to other specialist centres. The national paediatric transport service was used in seven instances, and local service in nine instances. The number of admissions to the ICU was few, and it was able to manage the cases and institute appropriate therapy. Less than 50% of these patients were transferred to a speciality hospital and most level 2 care could be managed in the district general hospital. In those needing transfer to specialist units, the availability of protocols for sedation and analgesia resulted in less delay in handover and transfers. Communications between various teams involved in transfer and preparation was effective and no critical incidents were reported. Conclusions With the specialist centre bed occupancy remaining high, district general ICUs provide more and more ongoing level 2 care to critically ill children. This also confirmed the findings of other studies that widespread use of a specialist retrieval service has not resulted in loss of vital stabilisation skills. Reference 1.
Lampariello S, Clement M, Aralihond AP, et al.: Stabilisation of critically ill children at the district general hospital prior to intensive care retrieval: a snapshot of current practice. Arch Dis Child 2010, 95:681–685. doi:10.1136/ adc.2008.151266.
P489 Factors associated with compassion fatigue among ICU nurses in Greece P Mangoulia, G Fildissis, E Koukia, G Alevizopoulos, T Katostaras National and Kapodistrian University of Athens, Greece Critical Care 2011, 15(Suppl 1):P489 (doi: 10.1186/cc9909) Introduction ICU nurses work in a demanding environment and they are repetitively exposed to traumatic situations and stressful events. There is a growing interest in the phenomenon of compassion fatigue (CF) and its impact on healthcare professionals; however, its impact on ICU nurses is basically unknown. The primary aim of this study was to investigate the risk for CF (the trauma suffered by the helping professional) and burnout (BO – emotional exhaustion, depersonalization and reduced sense of personal accomplishment), and the potential for compassion satisfaction (CS – the fulfillment from helping others and positive collegial relationships) among ICU nurses. An additional goal was to test the relationship between nurses’ characteristics (demographic and occupational) and CF risk. Methods The Professional Quality of Life Scale (ProQOL R_IV, CF, BO and CS subscales) and a demographic tool were distributed to 335 ICU nurses in 22 public hospitals in the Athens greater area, Greece. Results Findings revealed that 57.9% of ICU nurses are at the high level of risk for CF and 56.1% are at the high level of risk for BO, while 61.5% of participants reported low potential for CS. Female nurses (P = 0.016), with low income (P = 0.041), married (P = 0.001) or widowed (P = 0.023), who work as assistant nurses (P = 0.014) and also registered nurses with Master of Science (P = 0.008) or Nursing Specialty (P = 0.003) were found to have higher risk for CF. Additionally, higher risk for CF had also participants who characterized their relationship with their colleagues as neutral (P = 0.001) or bad (P = 0.030), believed that the staff work sometimes as a team (P = 0.016), spend 26 to 100% of their work time in direct contact with the patients (26 to 50%: P = 0.001, 51 to 75%: P = 0.043, 76 to 100%: P = 0.024) and described their mental health as poor (P = 0.001), average (P <0.001) or good (P <0.001). Nurses who want to retain in the ICU (P = 0.003) and those who want to leave the hospital in few years (P = 0.005) were associated with lower risk for CF. Conclusions The high prevalence of CF in our sample indicated that large numbers of ICU nurses may be experiencing these negative effects. Knowledge of CF-related variables may help healthcare organizations identify nurses at risk, provide intervention strategies to maintain healthy outcomes for nurses and increase job satisfaction. References 1. 2. 3.
Abendroth M, et al.: J Hosp Palliat Nurs 2006, 8:346-356. Mealer ML, et al.: Am J Respir Crit Care Med 2007, 175:693-697. Sabo BM: Int J Nurs Pract 2006, 12:136-142.
S172
P490 Burnout in ICUs in Portugal: is there? Are there differences between doctors and nurses? C Teixeira1, S Pereira2, O Ribeiro3, A Fonseca4, A Carvalho4 1 Centro Hospitalar do Porto, Portugal; 2Universidade dos Açores, Angra do Heroísmo, Portugal; 3Faculdade de Medicina do Porto, Portugal; 4Universidade Católica Portuguesa, Porto, Portugal Critical Care 2011, 15(Suppl 1):P490 (doi: 10.1186/cc9910) Introduction The aims were to identify whether there is burnout and the burnout levels of doctors and nurses working in ICUs (adult polyvalent units in northern Portugal). Also, to identify factors that may lead to the development of burnout in doctors and nurses working in the ICU. Methods Application of a self-completion questionnaire with three items: the sociodemographic data of the study population, experiences in the workplace, and the Maslach Burnout Inventory – General Survey (Portuguese Version for Investigation 2006). For the implementation of methodological tools, we requested the authorization of the relevant institutional bodies, the ethics committee and directors of services. The professionals who participated in the study were asked for informed consent, whether formal or informal. Observation of the contexts of work and interviews was also done. In this study we will focus on the results of the questionnaire. Statistical analysis was performed using SPSS v.17.0. Results A total of six hospitals, 10 polyvalent adult ICUs in the north of the country, 300 professionals, 73% nurses. Age of respondents was a median 32 years, with 8 years of professional experience and 4 years on the ICU. Results of the MBI: average levels of burnout in physicians and nurses working in the ICU. The risk of developing burnout is highest being a nurse 1:54 OR, yet there is no statistically significant difference at 95% (0.837, 2.834). Nine percent of professionals studied showed burnout, 31% with Burnout syndrome and high risk of burnout. Distribution of levels of burnout by occupational category: higher levels of emotional exhaustion in nurses, personal and professional achievement smaller in nurses, and higher depersonalization in doctors. Conclusions The results of the study underline the importance of promoting the prevention of burnout in doctors and nurses in the ICU. Reference 1.
Embriaco N, et al.: High level of burnout in intensivists. Am J Respir Crit Care Med 2007, 175:686-692.
P491 Medical handovers in the ICU: a snapshot of practice in the South West of France G Brenier, T Geeraerts, O Fourcade CHU Toulouse Prupan, Toulouse, France Critical Care 2011, 15(Suppl 1):P491 (doi: 10.1186/cc9911) Introduction Medical handover is critical for quality of care in the ICU. Time assigned to medical handovers can vary across different units, with significant impact on the organization of medical work. We aimed to study the time spend for medical handover in ICU and its variation across academic, general and private hospitals in the area of the South West of France, the Midi-Pyrénées region. Methods Between August and October 2010, we questioned by telephone 86 physicians issued from 19 different ICUs. This prospective observational study mainly focused on four items: unit characteristics, health diary organization, medical handover procedures, and selfassessment of satisfaction for medical handover (numeric scale from 0 to 10). Results Eleven general hospital centers, three private hospitals, and five university hospitals were concerned by the survey. The mean time spent for medical handover was 59 ± 35 minutes on Monday morning, significantly longer than other days, evening, and weekend handovers (P <0.001 for all comparisons). When reporting it with the number of ICU beds, the time spent for handover per patient was significantly shorter in private hospitals compared with general and academic hospitals (P <0.05 for all comparisons). This was true for every day. The median satisfaction for quality and duration were both 8, with a significantly
Critical Care 2011, Volume 15 Suppl 1 http://ccforum.com/supplements/15/S1
S173
Table 1 (abstract P492). Patient profile 2001 to 2003
2004 to 2006
2007 to 2009
Total
194
181
157
Male
90 (46%)
94 (52%)
67 (43%)
Age (years)
2.8 ± 3.7
3.5 ± 3.9
4.1 ± 4.6
2001 to 2003
2004 to 2006
2007 to 2009
0.066 ± 0.130
0.114 ± 0.239
0.086 ± 0.147
19
17
11
Sum of PIM2
12.75
20.71
13.43
O/P ratio
1.49
0.82
0.82
Table 2 (abstract P492). Results
PIM2 score Observed death
Figure 1 (abstract P491).
higher satisfaction in general hospital (P = 0.001 for comparison vs. other hospital for both). See Figure 1. Conclusions Time spent for the medical ICU is important, with an approximate total time of 1 hour 30 minutes on Monday, and 1 hour the other days. Physicians in private hospitals spend less time for medical handovers. This fact should be considered for medical timework organization, especially in academic hospitals and in hospitals with large ICUs. P492 Ratio of observed to predicted deaths in pediatric patients after introducing a closing policy in a general ICU Y Ueno1, H Imanaka2, J Oto2, M Nishimura2 1 The University of Tokushima Graduate School, Tokushima, Japan; 2 Tokushima University Hospital, Tokushima, Japan Critical Care 2011, 15(Suppl 1):P492 (doi: 10.1186/cc9912) Introduction The purpose of this study was to investigate whether the introduction of a closed ICU policy affected the prognosis of the critically ill pediatric patients in a general ICU. Methods Our ICU is a general acute-care one. The Department of Emergency and Critical Care Medicine was established in January 2004. Since then, full-time intensivists performed daily rounds and decided the ventilatory setting, cardiovascular treatment and antimicrobial agents (closed policy). We collected the Pediatric Index of Mortality 2
Figure 1 (abstract P493). Average ICU length of stay.
(PIM2) score for each pediatric patient (≤15 years old) admitted to our ICU from 2001 to 2009. We divided the patients into three terms: the early (2001 to 2003), middle (2004 to 2006), and latest (2007 to 2009) groups. We obtained the predicted number of deaths by summing the PIM2 score for every patient. We compared the ratio of observed to predicted deaths (O/P ratio) between the three groups. Results The patient profile and results are shown in Tables 1 and 2. In total, 532 pediatric patients were collected. The PIM2 score increased significantly from 0.066 ± 0.130 in 2001 to 2003 to 0.114 ± 0.239 in 2004 to 2006 and to 0.086 ± 0.147 in 2007 to 20009. However, the O/P ratio decreased from 1.49 in 2001 to 2003 to 0.82 in 2004 to 2006 and 0.82 in 2007 to 2009. Conclusions The O/P ratio improved after the establishment of a closed policy in our general ICU. Reference 1.
Slater A, et al.: Intensive Care Med 2003, 29:278-285.
P493 Safety programme reduces ICU mortality KD Rooney, R Sundaram, L Gibson, RJ Price Royal Alexandra Hospital, Glasgow, UK Critical Care 2011, 15(Suppl 1):P493 (doi: 10.1186/cc9913) Introduction One in 10 patients admitted to Scottish hospitals are unintentionally harmed and around 50% of these events could have been avoided if lessons from previous incidents had been learned. A National Audit Office report estimated that patient safety incidents cost the NHS an estimated £2 billion a year.
Critical Care 2011, Volume 15 Suppl 1 http://ccforum.com/supplements/15/S1
S174
Figure 2 (abstract P493). Standardised mortality ratio.
Methods We identified a minimum of eight main elements that we should concentrate on in order to produce reliable critical care. They included VAP, CVC insertion and maintenance, peripheral vascular catheter maintenance, daily goals, multidisciplinary ward rounds, hand hygiene, and glycaemic control. Results We have seen significant reductions in our VAP and Cr-BSI rates with more than 230 days and 440 days between events achieved, respectively. Despite an increase in the complexity and severity of cases in the last year due to Pandemic H1N1 2009, our average length of stay (Figure 1) has still reduced by 2.4 days with a 0.23 reduction in our standardised mortality ratio (Figure 2) from 0.92 to 0.69. Conclusions The public display of our infection rates has helped change the culture in our ICU to one of transparency and safety. Multiple small-scale tests of change are integral to changing practice in a high-risk environment. Bundles of care, daily goals and checklists all help produce high-quality reliable healthcare. Reference 1.
classification, R heart catheter and shuttle test distance (most recent assessment) along with organ support data. We recorded the length of stay (hours) in CC, CC and hospital outcome, 1-year survival and eventual outcome. Results Forty-seven patients were admitted (33 women), six required invasive ventilation, another six required non-invasive ventilation (NIV), 18 needed inotropic support and nine required CVVH. For survival to discharge, ROC analysis of shuttle distance demonstrated an asymptotic significance of P = 0.04 and an area of 0.71 (95% CI = 0.52 to 0.91) with 83% sensitivity and 65% specificity for a shuttle of 255 metres. Those with a shuttle over 255 metres had an average unit survival of 94%, 88% at hospital discharge and 47% at 1 year. Those below 255 metres had an average survival of 56%, 44% and 33%, respectively. Five out of six invasively ventilated patients died in hospital, but one lived for more than a year after discharge. Three out of six patients receiving NIV died in hospital but three lived for more than a year after discharge. Seventeen out of 18 who required inotropic support were dead at 1 year and 74% died before hospital discharge. For CVVH, five died and four lived. Overall survival: 64% survived to leave CC, 55% were discharged home alive and 34% were alive at 1 year. See Table 1. Conclusions More than one-half of PH patients admitted to CC survive to be discharged home. Shuttle distance gives an indication of likely average survival.
Department of Health, National Audit Office: A Safer Place for Patients: Learning to Improve Patient Safety. HC 456 Session 2005–2006. [http://www. nao.org.uk]
P494 Critical care outcome of pulmonary artery hypertension A Philips, J Hurdman, B Batuwitage, D Kiely, G Mills Sheffield Teaching Hospitals, Sheffield, UK Critical Care 2011, 15(Suppl 1):P494 (doi: 10.1186/cc9914)
P495 Outcomes of haematopoietic stem cell transplant patients admitted to the ICU G Bird, K Mohammed, P Farquhar-Smith, P Gruber The Royal Marsden NHS Foundation Trust, London, UK Critical Care 2011, 15(Suppl 1):P495 (doi: 10.1186/cc9915)
Introduction Critical care (CC) outcome in pulmonary hypertension (PH) is not well documented, but is generally assumed to be poor. We therefore investigated the critical care outcome in 8 years of noncardiothoracic admissions to a PH supraregional centre. Methods We recorded the following data in PH patients admitted to CC: demography, aetiology, cardiovascular parameters including NYHA
Introduction Use of haematopoietic stem cell transplant (HSCT) has become standard care for many types of haematological malignancies.
Table 1 (abstract P494) Age
NYHA
SpO2
RA
MPAP
CI
PVR
MVsats
Shuttle
LOS
Average
44
2.9
93
13
50
2.8
751
61
231
126
SD
18
0.6
6
9
14
1.1
324
12
125
154
Median
43
3
93
10
49
2.8
689
65
255
72
25th centile
29
3
92
5
40
2.0
515
54
92
43
75th centile
59
3
96
19
58
3.2
997
68
96
165
Critical Care 2011, Volume 15 Suppl 1 http://ccforum.com/supplements/15/S1
Unfortunately HSCT is frequently associated with complications such as sepsis, respiratory failure and graft versus host disease (GvHD) requiring ICU admission. Traditionally the prognosis of these patients has been poor with an in-hospital mortality of 60 to 95% [1]. The aim of this study was to determine outcomes and establish prognostic indicators of inhospital mortality. This may assist clinicians in identifying patients most likely to benefit from ICU therapy. Methods Following research approval, a retrospective study was undertaken in a 12-bed specialist cancer ICU over a 5-year period (October 2004 to September 2009). Patient variables including demographics, haematological diagnosis, reason for ICU admission, type of transplant, APACHE II, number of organ failures and type of organ support were recorded. The primary objective was to determine ICU, hospital and 6-month mortality. The secondary objective was to identify key prognostic variables in determining in-hospital mortality using univariate and multivariate analysis. Results Eighty-four patients with were admitted to the ICU following HSCT. Patient characteristics: median age 53 (range 19 to 76), female (43%), haematological diagnosis (49% leukaemia, 30% myeloma, 20% lymphoma), previous transplant (26%) and allogenic transplant (61%). Common reasons for ICU admission were respiratory failure (49%), sepsis (19%) and acute renal failure (11%). Median APACHE II was 20 (range 9 to 36) and number of organ failures was 2.5 (range 0 to 5). In the first 24 hours of ICU admission, 65% of patients received mechanical ventilation, 49% renal replacement and 57% vasopressor therapy. ICU, in-hospital and 6-month mortalities were 38%, 51% and 63%, respectively. Univariate analysis revealed allogenic transplant, GvHD, mechanical ventilation, vasopressor support, time post transplant >30 days and organ failure >2 were all significant predictors of in-hospital mortality with P values of <0.001, 0.02, 0.001, 0.02, 0.01 and 0.002 respectively. Multivariate analysis revealed that allogenic transplant, mechanical ventilation and time post transplant >30 days were independent prognostic predictors of in-hospital mortality. Conclusions Our outcome data were favourable in comparison with other published studies. Allogenic transplant, mechanical ventilation and time post transplant >30 days were independent factors that predicted poor outcome. Reference 1.
Soubani AO, et al.: Chest 2004, 126:1604-1611.
P496 Patterns of infection and impact on outcome in haematology patients admitted to intensive care R José, I McDonald, P Pfeffer, S Shaw, C Kibbler, B Agarwal Royal Free Hospital, London, UK Critical Care 2011, 15(Suppl 1):P496 (doi: 10.1186/cc9916) Introduction Infections with opportunistic pathogens in stable chronic haematological patients are well known. Recent reports suggest that these patients admitted to intensive care (ICU) tend to do as well as or better than those without infection [1]. We sought to study the pattern of all infections diagnosed in haematology patients in our ICU. Methods Data on infections were retrospectively collected for haematology patients consecutively admitted to our unit (tertiary haematology referral centre) for the period of January 2005 to December 2008. Readmissions (9/106) were excluded. Bacteria, mycobacteria and fungi were identified by culture and viruses detected by DNA PCR. Coagulase-negative staphylococcus was excluded from the analysis, as they most probably represented contaminants. Data were analysed with SPSS software. Results Ninety-seven patients were admitted during the study period, 71% with known or clinically suspected infection. The most commonly identified bacteria were Pseudomonas aeruginosa (15.4%) and Enterococcus faecalis (11.3%); viruses were cytomegalovirus (CMV) (17.5%) and respiratory syncytial virus (RSV) (17.5%); and fungi were Candida species (6.2%). Known or clinically suspected infection at admission, identifying an organism, presence of infection with multiple organisms, and infection type were not associated with increased ICU or hospital mortality (P >0.05), but resulted in significantly longer ICU and hospital LOS. Increased ICU LOS (days) (mean (SD)) was associated with identifying an organism (7 (8) vs. 16 (6); P <0.001), number of organisms per patient (0, 1, 2, 3) (7 (7), 13 (13), 16 (8), 41 (29); P = 0.006), infection
S175
type (not identified, bacterial, viral, mixed, fungal) (7 (8), 15 (19), 16 (12), 17 (9), 26 (24); P <0.001)), viral infection (11 (15), 16 (11); P = 0.005), CMV viraemia (11 (14), 18 (12); P = 0.002), while increased hospital LOS (days) (mean (SD)) was associated with identifying an organism (37 (34) vs. 61 (60); P = 0.004) and infection type (not identified, viral, fungal, bacterial, mixed) (37 (34), 47 (34), 52 (41), 67 (77), 69 (36); P = 0.025). Conclusions Most patients with haematological diagnoses admitted to our ICU had a clinically suspected or documented infectious cause. Although infection characteristics are not associated with overall mortality, they are associated with prolonged ICU and hospital LOS. Reference 1.
Depuydt et al.: Outcome in critically ill patients with allogeneic BM or peripheral haematopoietic SCT: a single-centre experience. Bone Marrow Transplant 2010. [Epub ahead of print]
P497 Outcome of haematology patients admitted to intensive care in a tertiary centre: primary haematological diagnosis, recent chemotherapy and bone marrow transplantation are not associated with outcome R José, I McDonald, P Pfeffer, S Shaw, B Agarwal Royal Free Hospital, London, UK Critical Care 2011, 15(Suppl 1):P497 (doi: 10.1186/cc9917) Introduction Acute illness in patients with underlying haematological disease is associated with poor prognosis. Recent reports suggest improved outcomes in these patients except for those with bone marrow transplantation (BMT) or recent chemotherapy [1]. We sought to audit the overall outcome and potential determinants of outcome in these patients admitted to our ICU. Methods Retrospective data on demographics, underlying haematological diagnosis, BMT, recent chemotherapy, reason for acute illness, severity of acute physiological derangement (severe acute physiological score (SAPS), number of failed organs, need for invasive mechanical ventilation and renal support), and ICU and hospital outcomes were collected for 106 consecutive admissions (97 patients) between January 2005 and December 2008. Re-admissions were excluded (9/106 patients). Data were analysed with SPSS software. Results Of the 97 patients, NHL (30.9%) and AML (26.8%) accounted for most haematological diagnoses. A total 24.7% were post-BMT, and 36.1% had chemotherapy within a month of admission or on the ICU. The mean (SD) age was 49 (15), SAPS 55 (16) and 56.7% were males. The mortality at ICU and hospital discharge was 51.5% and 63.9%, respectively. Gender, neutropaenia (≤1 x 10⁹/l), haematological diagnosis, admission reason, HIV status, BMT and recent chemotherapy were not predictive of ICU or hospital outcome (P >0.05). SAPS, invasive mechanical ventilation (IMV), renal support (RS) and sequential number of organs supported (OS) were predictive of both ICU and hospital mortality outcomes (P <0.05). Conclusions There is ongoing heightened risk of mortality in patients with haematology diagnoses admitted to the ICU with acute illness, related to both the severity of the initial physiological disturbance and requirements for organ support. In our patient population, BMT and recent chemotherapy were not associated with increased mortality, but this will need further evaluation with a larger sample size. Reference 1.
Cuthbertson BH, Rajalingam Y, Harrison S, McKirdy F: The outcome of haematological malignancy in Scottish intensive care units. J Intensive Care Soc 2008, 9:135-140.
P498 New prognosis inflammatory and nutritional indexes: comparison with the Prognostic Inflammatory and Nutritional Index as reference index F Ziegler, L Codevelle, E Houivet, J Benichou, A Lavoinne, P Dechelotte Université et CHU, Rouen, France Critical Care 2011, 15(Suppl 1):P498 (doi: 10.1186/cc9918) Introduction The Prognostic Inflammatory and Nutritional Index (PINI) was previously developed to improve the diagnosis and monitoring of
Critical Care 2011, Volume 15 Suppl 1 http://ccforum.com/supplements/15/S1
patients with inflammation and/or malnutrition in terms of morbidity and mortality risk, especially in ICU patients [1]. The formula includes the determination of four serum protein concentrations: PINI = (C-reactive protein (CRP) (mg/l) x orosomucoid (OROSO) (g/l)) / (albumin (ALB) (g/l) x transthyretin (TTR) (g/l)). Since CRP may be considered now as the gold standard for assessing and monitoring inflammatory states in clinical practice, OROSO is generally unavailable for PINI calculation. Elsewhere, the strong and rapid changes in CRP levels (0 to 600 mg/l) in acute inflammation may lead to an overestimation of the risk of morbidity and mortality suggested by the PINI. The aim of this study was to evaluate alternative biological formulas by removing OROSO from the PINI and replacing CRP value by its logarithm (Log), in order to reduce the mathematical weighting of this biomarker. Methods Blood samples of 106 patients hospitalized in intensive care, gastrointestinal surgery, vascular and thoracic surgery, pneumology, gastroenterology or internal medicine units were drawn to measure serum concentrations of ALB, TTR, CRP and OROSO. Proteins were determined using an immunonephelometry method (BN2; Siemens, Germany). The correlations between six new formulas and the PINI were studied – that is, CRP / ALB x TTR, Log(CRP) / ALB x TTR, CRP / TTR, Log(CRP) / TTR, CRP / ALB and Log(CRP) / ALB – using the Spearman rank test. Results The relations obtained between the PINI and the experimental formulas were linear (y = ax + b) with formulas without Log and nonlinear when a Log was used (y = ax2 + bx + c or y = log(x) + b). All six formulas were correlated with the PINI (0.78 <R <0.94, P <0.0001). CRP / ALB x TTR, Log(CRP) / ALB and CRP / TTR showed the highest correlations, with R = 0.94, 0.91 and 0.90, respectively. The less elevated correlation was observed using CRP / ALB (R = 0.78). Conclusions Among the six new formulas compared with the PINI, that omitting only OROSO provided the best performance. The control of CRP weighting obtained with Log(CRP) in the formula Log(CRP) / ALB appears promising in current clinical practice, since it involves the most often used serum proteins to assess inflammatory and nutritional status. Reference 1.
Ingenbleek Y, et al.: Int J Vitam Nutr Res 1985, 55:91-101.
P499 Feasibility and utility of frailty assessment in the over 80s on critical care B Charles, R Porter, D Bryden Sheffield Teaching Hospitals NHS Trust, Sheffield, UK Critical Care 2011, 15(Suppl 1):P499 (doi: 10.1186/cc9919) Introduction A recent UK-wide audit in perioperative care of the over 80s recommended the use of frailty assessment as an independent marker of risk in older people [1]. Our critical care unit (CCU) has a fully integrated patient data management system (Metavision®) incorporating notes, patient data and laboratory results. We wished to determine the feasibility and utility of performing frailty assessments using our existing data collection tools on all patients over 80 years old. Methods Retrospective data collection identified all patients >80 years old admitted to CCU over a 22-month period to November 2010. Frailty was assessed by means of the Canadian Study of Health and Aging index, which has been validated as a simple assessment tool [2]. APACHE II scores and numerical assessments of polypharmacy were also noted. Results A total of 112 patients were identified with a median age of 83 years (80 to 92). Seventy-three per cent (n = 83) were discharged from critical care alive and 57% survived to leave hospital. Survival for those aged under 80 was significantly higher with 83% (P = 0.01) and 73% (P = 0.00) surviving until critical care and hospital discharge, respectively. Frailty was only able to be assessed in 66 (58.9%) of patients. Scores were as shown in Figure 1 but bore no relationship to survival. On multivariate analysis, APACHE II scores but not polypharmacy or frailty score were independent predictors of mortality. Conclusions Our patients had a significantly lower unit and hospital survival than those aged under 80 and this may reflect the need for better assessment tools of frailty and co-morbidity in the critical care population. Current critical care data collection is not sufficient to
S176
Figure 1 (abstract P499). Frequency of frailty scores.
adequately assess and record frailty in our unit. The National Institute for Health and Clinical Excellence will be producing a guideline for critical care in older patients and this should include a review of frailty assessment. References 1. 2.
NCEPOD: An Age Old Problem. NCEPOD; 2010. Rockwood K, et al.: A global clinical measure of fitness and frailty in elderly people. CMAJ 2005, 173:489.
P500 Quality of life in the over-80-year-old medical patient following intensive care KJ Rowe, M Trivedi, A Ercole, K Gunning Addenbrookes Hospital, Cambridge, UK Critical Care 2011, 15(Suppl 1):P500 (doi: 10.1186/cc9920) Introduction The aim of this study was to determine the quality of life (QOL) in patients over 80 years old following intensive care who were admitted with a medical diagnosis. The older ICU population is increasing, and using QOL after critical illness rather than mortality may represent a better outcome measure. The evidence is conflicting, with some studies suggesting good QOL scores in the older patients compared with younger patients, whilst others show the opposite. This may be due to differences in study design with variations in age group studied and the follow-up period. Our study uses a novel approach to evaluate QOL using aged-matched controls. Methods A total of 296 patients aged ≥80 years with a medical diagnosis were admitted to the ICU between 1 January 2006 and 31 December 2009. Patients alive in May 2010 were sent two questionnaires, one assessing subjective changes before and after ICU admission in four key areas (QOL, physical ability, mood and memory) and a second validated QOL scoring tool (SF-36). Patient views regarding their ICU stay were also explored. A control group of age-matched patients was identified from outpatient clinics and given similar questionnaires to complete. Results Of 261 ICU admissions fulfilling the study criteria, 201 survived to ICU discharge and 148 to hospital discharge (73.6%). Of these, 81 were alive in May 2010. Forty-nine were sent questionnaires and 27 were returned (55%). Questionnaires were sent to 33 controls. Questionnaire 1 (subjective QOL) – in all key areas patients felt that their QOL had decreased following admission to ICU. Questionnaire 2 (SF-36) – there was no statistical difference between patients and controls in any of the SF-36 domains (Mann–Whitney U test, P <0.05). Views regarding intensive care: 24/25 former ICU patients believed that admission to intensive care was in their best interest, 21/25 would want to be treated in intensive care again if needed, compared with 15/27 of controls. Eleven out of 25 former ICU patients had discussed their wishes regarding future treatment on intensive care with someone compared with 6/28 controls. Conclusions The SF-36 results indicated that QOL scores in elderly survivors of medical intensive care are not significantly below those of their peers. There is, however, a subjective reduction in QOL. The majority of ICU survivors in this age group would want such treatment again Reference 1.
Hennessy D, et al.: Chest 2005, 127:1764-1774.
Critical Care 2011, Volume 15 Suppl 1 http://ccforum.com/supplements/15/S1
P501 Is age a predictor of mortality in medical high-dependency units? E Hood, A Bhangu, D Pandit, A Michael Russells Hall Hospital, Dudley, UK Critical Care 2011, 15(Suppl 1):P501 (doi: 10.1186/cc9921) Introduction The population aged >65 years is set to rise by 32% by 2033. As resources are limited, difficult decisions regarding access to high-dependency care for the older person will become increasingly important. The aim of this study was to determine whether age is a predictor of mortality in patients admitted to an open medical highdependency unit (MHDU). Methods A prospective observational cohort study of 100 consecutive patients admitted to a MHDU with a medical diagnosis over a 3-month period. The primary endpoint was 30-day mortality. Results Overall mortality at 30 days was 21% (n = 21). Forty-one per cent of patients were aged <65 years, 29% 65 to 74 years and 30% 75+ years. There were no significant differences in mortality between groups (12%, 31% and 23%, respectively). When considering APACHE II scores ≥25, there was no significant difference in mortality between age groups (35% <70 years (7/20) vs. 29% ≥70 years (4/14), P = 1.000). The final model at multivariable regression analysis identified that ≥2 organ support (odds ratio = 10.843, 95% CI = 3.281 to 35.836) and preadmission moderate/nursing home care (4.437, 95% CI = 1.053 to 18.697) were significantly associated with worse outcome. ROC curve analysis for death showed that APACHE II score was a moderate discriminator (area under the curve = 0.64, 95% CI = 0.53 to 0.75), and age (0.60, (0.48 to 0.72)) was a poor predictor for 30-day mortality. The majority of survivors (88%) were discharged at their preadmission functional status; those who declined in function were not significantly older than those who did not. See Figure 1.
S177
aspects of organ dysfunction. It is therefore ordinal data, and in intensive care patients should not simply be assumed to be well approximated by a normal distribution. This study aimed to discover what proportion of recent intensive care literature is presenting this score inadvisably as normal data. Methods Twenty of the most recent original articles containing ‘APACHE’ or ‘Acute Physiology and Chronic Health Evaluation’ were identified from each search engine of 10 highly cited journals with notable intensive care literature content. Studies presenting an average score and a measure of central spread were included. Statistical methods used were recorded. Results Approximately 70% of identified papers presented APACHE data as means and standard deviations, and 48% used these data in parametric tests. Eighty-one per cent did not mention assessment of skewness or kurtosis and only 7% documented the test used to assess whether the distribution appeared normal. Conclusions Inadvisable presentation and processing of APACHE data is commonplace in critical care journals and authors should exercise greater awareness of the potentially skewed distribution of the data. Medians and interquartile ranges suit its ordinal nature better. Subjecting APACHE data to parametric analysis when non-normally distributed will increase the risk of type 1 or type 2 errors depending on the nature of departure from non-normality. P503 ICU scoring systems: which one to use in oncology patients? D Juneja, P Nasa, O Singh, R Dang, Y Javeri, G Singh Max Superspeciality Hospital, Delhi, India Critical Care 2011, 15(Suppl 1):P503 (doi: 10.1186/cc9923) Introduction The aim was to assess the performance of various ICU scoring systems in oncology patients. Methods A prospective analysis of data for all oncology patients admitted to the ICU over 6 months. For mortality prediction, SMR was computed. Calibration was assessed by Lemeshow–Hosmer goodnessof-fit test and discrimination by AUROC curves. Primary outcome was ICU mortality. Results ICU mortality was 36.5%. Mortality predicted by SAPS II score was closest to that of actual mortality with a SMR of 1.003, followed by that of MPM II0 (0.855) and APACHE II (1.181) scores (Table 1). SAPS II (χ2 = 1.842; P = 0.985) had the best calibration. Mechanical ventilation Table 1 (abstract P503). AUC for predicting ICU mortality Parameter
Figure 1 (abstract P501). Survival of high-risk (2+ organ support and high preadmission care levels) versus low-risk groups, split by age.
Conclusions Age does not predict outcome from MHDU. Patients requiring ≥2 organ support and/or higher levels of preadmission home support had higher mortality. Selected elderly medical patients can be expected to have outcomes comparable with younger patients and should not be denied MHDU care. P502 Inadvisably presenting APACHE scores as parametric data: a study of 200 original articles from leading journals R Kam1, C Bunce2, JM Handy3 1 Imperial College London, UK; 2Moorfields Eye Hospital NHS Foundation Trust, London, UK; 3Chelsea & Westminster Hospital, Imperial College London, UK Critical Care 2011, 15(Suppl 1):P502 (doi: 10.1186/cc9922) Introduction The APACHE score, used to indicate severity of systemic illness in patients, is the sum of separate points given for different
Survivors
Nonsurvivors
P value
Males
44
26
0.854
Females
22
12
Metastasis
42
22
0.562
Ventilation
5
35
0.00
Vasopressors
7
37
0.00
Table 2 (abstract P503). Baseline characteristics of survivors and nonsurvivors Scoring system
AUC
95% CI
APACHE II
0.726
0.629 to 0.824
APACHE III
0.818
0.733 to 0.903
APACHE IV
0.793
0.707 to 0.880
SAPS II
0.718
0.615 to 0.820
SAPS III
0.781
0.686 to 0.877
MPM II0
0.750
0.648 to 0.853
MPM III0
0.684
0.573 to 0.795
SOFA
0.769
0.678 to 0.859
Critical Care 2011, Volume 15 Suppl 1 http://ccforum.com/supplements/15/S1
and use of vasopressors were significant baseline characteristics (Table 1). All of the scores tested had good efficacy but none reached statistical significance (Table 2). Conclusions The SAPS II and APACHE III scores showed good accuracy, calibration and mortality prediction. Nevertheless, the difference in efficacy was not statistically significant and the choice of scoring system may depend on the ease of use and local preferences.
P504 Do scoring systems predict mortality following emergency abdominal aortic aneurysm repair? The Norwich experience S Kumar, J Nortje Norfolk & Norwich University Hospital, Norwich, UK Critical Care 2011, 15(Suppl 1):P504 (doi: 10.1186/cc9924) Introduction APACHE II scores [1] and Glasgow Aneurysm Scores (GAS) [2] are commonly used in ICUs to predict mortality. These scoring systems (scores α mortality), when applied to postoperative emergency open abdominal aortic aneurysm (AAA) repair patients, yield varying results. We applied these scoring systems to our patients to establish their predictive value in our clinical setting. Methods This retrospective audit included patients who underwent emergency open AAA repair and were admitted to our ICU, over a period of 1 year (November 2008 to November 2009). These patients were identified from our local ICU database (Metavision®) and scores
S178
(APACHE II and GAS) were calculated for each of these patients. The mortality rates were compared with the national average [3]. Results A total of 98 AAA repair patients were identified, of whom 35 patients (32 males and three females) had undergone emergency (ruptured) repair. Seven patients (20%), including two females, died in the ICU. There is an increase in mortality with increasing APACHE II scores (Figure 1). The same does not apply for GAS scores but all the patients who died had a GAS score >89. Our mortality rate was 20% compared with the national mortality of 38% (Figure 2). Conclusions APACHE II scores seem to be more predictive of our unit AAA mortality rates than GAS scores. We aim to apply these scores to a larger dataset and also determine possible reasons for improved survival. References 1. 2. 3.
Knaus WA, et al.:APACHE: a physiologically based classification system. Crit Care Med 1985, 13:818-829. Samt AK, et al.: Glasgow aneurysm score. Cardiovasc Surg 1994, 2:41-44. National Vascular Database 2009 [www.vascularsociety.org.uk/ national-vascular-database]
P505 Influence of resuscitation status on the performance of APACHE III, APACHE IV and SAPS III MT Keegan, O Gajic, B Afessa Mayo Clinic, Rochester, MN, USA Critical Care 2011, 15(Suppl 1):P505 (doi: 10.1186/cc9925)
Figure 1 (abstract P504). AAA mortality versus APACHE mortality.
Introduction The presence of a do-not-resuscitate (DNR) order is an independent predictor of mortality in ICU patients [1]. Of the major ICU prognostic scoring systems, only MPM III includes DNR status as a predictor. The influence of DNR status on APACHE III and IV and SAPS III is unknown. We hypothesized that there would be differences in the performances of APACHE III, APACHE IV, and SAPS III when DNR status was included as a predictor variable. Methods A retrospective cohort study was performed. Demographic, physiologic and outcome data for 2,596 patients admitted to one of three ICUs (medical, surgical, mixed) at our tertiary referral center in 2006 were collected. The presence or absence of a DNR order on ICU admission and at the end of the first ICU day was recorded. The performance of each of the four models, with and without inclusion of first-day DNR status, was assessed using the area under the receiver operating characteristic curve (AUC) for discrimination and the Hosmer–Lemeshow statistic (HLS) for calibration. Comparison of model performance was as described by Hanley [2]. Results Of the 2,596 patients studied, 211 (8.1%) and 252 (9.7%) had DNR orders on ICU admission and at the end of the first ICU day, respectively. Two hundred and eighty-three patients (10.9%) did not survive to hospital discharge. A total 19.4% of the nonsurvivors had DNR orders on admission versus 6.7% of the survivors, P <0.01. At the end of the first ICU day, 32.5% of nonsurvivors were DNR versus 6.9% of survivors, P <0.01. The AUCs (95% CI) of the models for prediction of hospital mortality were 0.868 (0.854 to 0.880), 0.861 (0.847 to 0.874) and 0.801 (0.785 to 0.816) for APACHE III and IV, and SAPS III, respectively. When DNR status at end of the first ICU day was included in the models, the AUCs were 0.876 (0.855 to 0.897), 0.868 (0.846 to 0.891), and 0.816 (0.791 to 0.841), respectively. There were no significant differences between the discriminative ability of the models with and without DNR status (APACHE III P = 0.103, APACHE IV P = 0.145, SAPS III P = 0.072). The HLS for the models with and without DNR status were 33.7 and 29.3, 31.0 and 33.3, and 36.6 and 29.0 for APACHE III and IV and SAPS III, respectively. Each of the HLS generated P <0.05. Conclusions Neither the discrimination nor calibration of APACHE III and IV and SAPS III were significantly improved by the inclusion of resuscitation status at the end of the first ICU day in the prognostic models. References
Figure 2 (abstract P504). AAA mortality NNUH versus UK.
1. 2.
Azoulay E: Intensive Care Med 2003, 29:1895-1901. Hanley JA: Radiology 1983, 148:839-843.
Critical Care 2011, Volume 15 Suppl 1 http://ccforum.com/supplements/15/S1
P506 Limitations of the use of the Glasgow Coma Scale in intensive care patients with non-neurological primary disease: a search for alternatives PV Dong, OL Cremer University Medical Centre Utrecht, the Netherlands Critical Care 2011, 15(Suppl 1):P506 (doi: 10.1186/cc9926) Introduction Numerous scoring systems have been devised to assess the severity of illness and predict outcome in critically ill patients in the ICU, many of which incorporate the Glasgow Coma Scale (GCS) as a key component. However, the GCS requires observation of a verbal score (which is often unavailable in the ICU), must be interpreted in cases of concurrent sedation, and is insensitive to more subtle derangements of consciousness (such as delirium). Furthermore, its relationship with outcome may be nonlinear. In this study we quantified the practical limitations of using the GCS in daily routine. We then aimed to provide alternative methods for neurological assessment scoring in case of missing GCS scores. Methods We performed an observational study of all patients admitted to a large tertiary ICU from January 2009 until September 2010. Patients following elective surgery, having an uncomplicated stay <96 hours, were excluded from analysis. We collected data on neurological status and sedation. All variables were assessed for their ability to predict hospital mortality, using multivariate logistic regression analyses that included the variables of primary interest as well as any relevant covariates. Results In total 1,128 patients were included (62% males, mean age 58 ± 17 years, 40% surgical admissions). We observed an overall 26% hospital mortality rate (compared with 30% predicted by the APACHE IV model). In patients with maximum GCS motor scores of M1 and M2–3 on their first day in the ICU, the mortality rate was 62% and 79%, respectively. Within the large majority of patients with a M6 score, we observed a broad range of clinical variance, expressing low discriminative ability of the GCS motor score. We found inferior predictive power of the APACHE IV model in patients with nonneurological primary disease (c statistic = 0.75 to 0.79) compared with patients with acute neurological injury (0.85 to 0.86). The predictive power of the APACHE IV model improved when substituting missing GCS components by other neurological observables. Conclusions The GCS is difficult to obtain and interpret, and shows inconsistent predictive power. In patients with non-neurological primary disease, the use of alternative observables, such as pupillary anomaly, RASS score and sedative use, may serve as a substitute score in cases of missing or unobservable GCS assessments. References 1. 2.
Vincent JL, et al.: Crit Care 2010, 14:207. Matis G, et al.: Acta Neurol Belg 2008, 108:75-89.
P507 ManChEWS: Royal Manchester Children’s Hospital early warning score V Joshi, R Barber, R Yates Royal Manchester Children’s Hospital, Manchester, UK Critical Care 2011, 15(Suppl 1):P507 (doi: 10.1186/cc9927) Introduction Unrecognised clinical deterioration resulting in near or actual cardiorespiratory arrest in hospitalised children sadly still occurs. The majority of these events may be preventable. Royal Manchester Children’s Hospital (RMCH) introduced a simple track and trigger Early Warning System (ManChEWS) in 2005 by which variation in six key physiological parameters is scored according to a trafficlight system in routine nursing observations. The aim was to evaluate use of ManChEWS since its introduction, in order to allow continued improvement and development. Methods Three audits were carried out: an audit to evaluate ManChEWS in emergency admissions to the PICU or PHDU (2006 to 2007), a prospective audit of children who trigger EWS on the ward but do not require admission to the PHDU/PICU (2009), and an audit to evaluate the use of ManChEWS in children that died between 2005 and 2008 following an acute deterioration on the wards.
S179
Results ManChEWS correctly identifies the clinically deteriorating child on the ward. ManChEWS is over-triggering, leading to staff becoming immune to triggers. This is due to the high frequency of underlying illness in children admitted to RMCH. Medical staff are not currently redefining parameters for children with abnormal baseline parameters. ManChEWS is not being universally used in RMCH. Twenty-five per cent of deaths in RMCH were attributable in part to ‘the failure to recognise a sick child’. These might have been prevented by the correct use of ManChEWS. Conclusions ManChEWS correctly identifies the deteriorating child and offers staff a clear pathway for escalation of care and senior review. ManChEWS is not being used correctly on the wards by medical or nursing staff. For patients with underlying disease, ManChEWS overtriggers, leading to staff becoming immune to triggers. Developments and the future Development of an EWS Steering Group. Daily review of patients triggering ManChEWS by development of an outreach team. Electronic EWS implementation across the Trust. Patients with underlying illness may have individualised parameters set by senior medical staff.
P508 Does an open level 2 medical high-dependency unit improve outcomes for critically ill patients? Using the APACHE II scoring system in a district general hospital in the UK V Hurley, D Pandit Russells Hall Hospital, Birmingham, UK Critical Care 2011, 15(Suppl 1):P508 (doi: 10.1186/cc9928) Introduction Improving care of acutely ill medical patients led to formation of a six-bed level 2 medical high-dependency unit (MHDU). The aim of this study was to look at outcomes of medical patients admitted to an open level 2 MHDU. Methods One hundred and nine patients were consecutively admitted to the MHDU in a prospective observational study. APACHE II derived mortality scores averaged for two groups of patients – those who survived the admission and those who did not – and were assessed using a chi-squared test. Results A total 48.6% of patients were male, mean age 59.3 years (range 0 to 98 years). Average total length of stay in hospital was 16.55 days with average 4.29 days in the MHDU (range 0 to 18 days). In total, 34.9% admissions were respiratory in origin, 22% sepsis, 10% GI, 7.4% poisonings, 5.5% other, 4.6% renal, 3.6% cardiac, 2.8% neurological and <1% unclassified. A total 29.3% of patients were admitted directly from A&E, 37.6% from the emergency admissions unit and 33% from the wards (27% of these from ITU). Two per cent of patients required ITU admission after the MHDU. Twenty-two patients out of 109 died during this admission, 13 of them while admitted to the MHDU. Deaths were classified according to diagnosis on admission to the MHDU, with 45% with GI disease dying, 29% with sepsis, 22% endocrine and 21% respiratory. These patients were deemed not suitable for escalation to level 3 care. Of 109 patients, full APACHE II data were available for 87. Of this subcohort, 16 patients died and 71 survived. Expected values were calculated and predicted that 26 should have died and 61 survived (P <0.05) from the APACHE II data. Conclusions The cost of NHS care is becoming increasingly important in the UK and anecdotal evidence suggests a high proportion of patients managed in level 3 care could more appropriately be managed with a lower level of care ideally in an HDU setting, while decisions can be made whether the physiological status of the patient justifies escalation of care. This observational study raises questions about appropriateness of admission to MHDU and has led to improvement of gatekeeping to the unit. This study also demonstrates increasing involvement of critical care in managing end-of-life challenges. We have used this study to demonstrate to our colleagues what critical care can and cannot offer. Future studies to characterise performance of our unit will use the SAPs and risk profile management method. Reference 1.
Knaus WA et al.: APACHE 2: a severity of disease classification system. Crit Care Med 1985, 13:818.
Critical Care 2011, Volume 15 Suppl 1 http://ccforum.com/supplements/15/S1
S180
P509 Gastrointestinal failure score alone and in combination with SOFA score in the assessment of the critically ill patients N Abed1, L Mohammed1, A Metwaly2, M Hussien2 1 Cairo University, Cairo, Egypt; 2Theodor Bilhars Research Institute, Cairo, Egypt Critical Care 2011, 15(Suppl 1):P509 (doi: 10.1186/cc9929) Introduction Gastrointestinal problems occur frequently and are associated with an adverse outcome in critically ill patients; despite this, gastrointestinal (GI) function is not included in any of the widely used scoring systems assessing organ failures in critical illness. Several studies have demonstrated an impact of intra-abdominal hypertension (IAH) on mortality [1]. With the goal of developing a scoring system for GI failure, Reintam and colleagues combined GI symptoms and IAH into a five-grade scale – the Gastrointestinal Failure Score – and tested it among critically ill patients in Estonian ICUs [2]. The aim of our study was to evaluate the GIF score in our Egyptian ICUs regarding validity and impact on mortality and comparing this with the SOFA score. Methods We studied 109 mechanically ventilated patients on day 1 admitted to the general ICU of Kasr El Aini Hospital and Theodor Bilharz Research Institute in the period from March 2009 to November 2009. The SOFA + GIF scores were calculated each day by summarizing the SOFA score and the GIF score of the respective day in each patient. Results FI developed in 35.8%, IAH in 26.9% and both of them together in 14.7% of all patients. Compared with patients with mean GIF = 0, patients with mean GIF higher than 0 and lower than or equal 2 and mean GIF higher than 2 show higher ICU mortality (100%, 81.4% vs. 48.2% P <0.0001), respectively. The GIF score integrated into the SOFA score allowed a better prediction of ICU mortality than the SOFA score alone shown by AUC 0.92 and 0.890, respectively. Conclusions The mean GIF score in the first 3 days on the ICU demonstrated a high prognostic value in prediction of ICU mortality. Further multicenter studies should confirm whether GIF score could be advocated as an adjuvant subscore for GI tract assessment in the SOFA score. References 1. 2.
Malbrain et al.: Crit Care Med 2005, 33:315-322. Reintam et al.: Crit Care 2008, 12:R90.
P510 How high must lactate be to predict an adverse outcome? A Reintam Blaser, J Starkopf University of Tartu, Estonia Critical Care 2011, 15(Suppl 1):P510 (doi: 10.1186/cc9930) Introduction We aimed to clarify the associations between lactate levels and ICU mortality and their changes over 6 years in one ICU. Methods All patients admitted to the general ICU of university hospital from 2005 to 2010 were studied. Highest lactate on admission day in the ICU was documented.
Figure 1 (abstract P510). Lactate levels of survivors versus nonsurvivors over the years. #Difference between survivors and nonsurvivors, P <0.005.
Figure 2 (abstract P510). ICU survival rates according to lactate levels.
Results In total, 1,830 patients were treated, 417 were excluded due to incomplete data and 1,413 patients were included in the study. Survivors had a mean blood lactate level of 2.8 ± 3.3 versus 8.9 ± 7.2 mmol/l in nonsurvivors (P <0.001). The lactate levels of survivors versus nonsurvivors over the years are presented in Figure 1. The survival in different lactate groups is presented in Figure 2. Conclusions There is a linear correlation between blood lactate levels and ICU mortality. A considerable amount of patients with very high lactate levels survive the ICU. There is no certain lactate level that may reliably predict an adverse outcome. P511 Outcome prediction in haematological patients requiring admission to the ICU S Gopal1, N Green1, M Myint2, A Jacobs2 1 Heart and Lung Centre, Wolverhampton, UK; 2New Cross Hospital, Wolverhampton, UK Critical Care 2011, 15(Suppl 1):P511 (doi: 10.1186/cc9931) Introduction The outcome of haematological patients admitted to the ICU is improving [1,2]. However little is known of the predictive factors that determine hospital outcome in this group of patients. We hypothesised that certain haematological factors may predict a worse outcome in these patients requiring admission to the ICU. Methods We retrospectively reviewed all haematological patients admitted to a 15-bed medicosurgical ICU of a teaching hospital over a 5-year period from 1 April 2005 to 31 March 2010. Data on validated outcome predictors including age, APACHE II score, APACHE II predicted mortality, length of ICU stay, and requirement for mechanical ventilation were collected. Furthermore outcome predictors deemed important in haematological patients were also collected, including neutropaenic status at onset of illness, malignancy status at onset of illness and whether chemotherapy was received within 30 days of admission to the ICU. We performed logistic regression analysis to model these variables against hospital mortality. Results Fifty-six haematological patients were admitted to the ICU during the study period. Data from three patients were incomplete and they were therefore excluded from the analysis. Mean age (SD) 54 (18.5) years; mean APACHE II score (SD) 23.4 (6.8); mean APACHE II predicted mortality (SD) 50.6 (23.8)%; mean ICU stay (SD) 4.6 (3.7) days. Twenty patients (35.7%) were mechanically ventilated on admission to the ICU. Thirteen patients (26%) were neutropaenic at onset of critical illness; 40 patients (75.5%) had a haematological malignancy and 31 patients (56.6%) had received chemotherapy within 30 days of the onset of critical illness. The standardised mortality ratio (95% CI) for this cohort of patients was 0.86 (0.82 to 0.91). Logistic regression analysis revealed no relationship between these variables and hospital mortality even after adjusting for age, APACHE II score, length of ICU stay and requirement for mechanical ventilation. Adjusted OR (95% CI) for neutropaenic status at
Critical Care 2011, Volume 15 Suppl 1 http://ccforum.com/supplements/15/S1
onset of critical illness was 1.8 (0.3 to 9.1) P = 0.46. Malignancy at onset of illness OR was 0.54 (0.1 to 3.7) P = 0.53. Chemotherapy within 30 days of admission to ICU OR was 0.4 (0.1 to 2.2) P = 0.30. Conclusions Haematological factors including neutropaenia, haematological malignancy and recent chemotherapy do not predict worse outcomes in this group of patients. With improving mortality rates, all haematological patients should be considered for admission to the ICU. References 1. 2.
Bokhari S, et al.: Ann Hematol 2010, 89:505-512. Soares M, et al.: Crit Care Med 2010, 38:9–15.
P512 HIV-infected patients in the ICU in the current era of high-activity antiretroviral treatment P Vidal Cortés, V Aller Fernández, M Mourelo Fariña, P Lameiro Flores, P Vázquez Rodríguez, A Castro Iglesias CHU A Coruña, A Coruña, Spain Critical Care 2011, 15(Suppl 1):P512 (doi: 10.1186/cc9932) Introduction Our purpose is to study the effect of high-activity antiretroviral treatment (HAART) on the epidemiology and outcome of human inmunodefficiency virus (HIV) patients in the ICU. HAART has modified the outcome of patients infected with HIV, increasing survival and reducing infectious complications. In the first years of HAART use a significant change in the diagnosis and prognosis of ICU-admitted HIV patients has been identified, but there are no studies investigating this issue in the most recent years. Methods A retrospective study. HIV patients admitted to a 36-bed ICU, between January 2005 and December 2009 (HIV incidence in our population: 42 cases/million hab/year). We studied demographic characteristics, having or not HAART, final diagnosis, need for organ support and outcome (length of stay (LOS) and mortality). Results One hundred and five HIV-infected patients (70.5% being male), 52 (49.5%) having HAART. Mean age: 41 ± 8.57 years. More common co-morbidities were: hepatic disease (61%), cirrhosis in a 10.5%, followed by chronic respiratory disease and dyslipemia (12.4%), cardiac disease (5.7%), solid and hematologic malignancy (5.7% and 2.9%, respectively). A total 70.5% had a history of intravenous drugs use, and 13.3% were heavy alcohol consumers. Average CD4 count was 275.4 ± 362/ml, mean viral load was 3,656 ± 3,000/ml. A total 52.1% were on their CD4 nadir at admission time. Most frequent final diagnosis (grouped): infectious disease, 58.3% (focus: lung 66.7%, CNS 16.7%), cardiac disease (12.7%), intoxication and trauma (5.8% each one). Average APACHE II: 20.9. A total 48.6% of patients needed support with vasopressors, 64.7% mechanical ventilation and 15.2% renal support. A total 69.5% of patients needed at least one organ support. ICU LOS: 8.7 ± 9.9 days, hospital LOS: 29 ± 29.5. ICU mortality: 28.6%, hospital mortality: 35.2%. Conclusions Despite the beneficial effects of HAART on inmune status, infection (especially pneumonia) remains the most common cause of ICU admission. Our results confirm the trend to a lower mortality saw in early HAART period studies. References 1.
2.
Powell et al.: Survival for patients with HIV admitted to the ICU continues to improve in the current era of combination antiretroviral therapy. Chest 2009, 135:11-17. Croda et al.: Benefit of antirretroviral therapy on survival of human immunodeficiency virus-infected patients admitted to an intensive care unit. Crit Care Med 2009, 37:1605-1611.
P513 Clinical characteristics and outcomes of obstetric patients requiring ICU admission H El-Abd, K Mashhour, A Mwafy Cairo University Hospitals, Cairo, Egypt Critical Care 2011, 15(Suppl 1):P513 (doi: 10.1186/cc9933) Introduction Despite therapeutic advances during this century, maternal mortality remains an important public health problem.
S181
So it was logical to study these patients who were referred from the Gynecology and Obstetric Department to our ICU aiming to review a series of these patients in order to assess the spectrum of diseases, required interventions, complications that occurred and maternal mortality and to identify conditions associated with maternal death. Methods A retrospective cohort study in the Critical Care Medicine Department, Cairo University. The medical records of all obstetric ICU admissions over the period from January 2005 to December 2009 were reviewed. Results Over these 5 years, 169 women required ICU admission (1.6% of all ICU admissions). The mean age was 29.29 ± 6.06 years; mean gestational age was 34.56 ± 3.01 weeks, and the mean length of ICU stay was 3.32 ± 3.6 days. Most patients (77%) were admitted with obstetric cause, the most common cause of maternal morbidity was pregnancyinduced hypertension (56.21%), followed by obstetric hemorrhage (17.75%). Heart failure (13.6%) was the principal nonobstetric cause. Maternal mortality rate was 4.14%, with hypovolemic shock and MODS (71.4%) as main causes. Despite the incidence of death being higher among patients with obstetric versus nonobstetric cause (4.6% and 2.6%, respectively), this was not statistically significant (P = 0.91). Twenty-five percent of patients had prior medical diseases, 76.74% of them had cardiac problems. The most common interventions were central venous catheterization (91.1%), endotracheal tube intubation (16.6%), and mechanical ventilation (12.4%). Disturbed conscious level, MODS, shock, ARF, bleeding, and ARDS were present in 17.8%, 12.4%, 10.7%, 10.7%, 8.9% and 7.1% of patients, respectively. Anemia, leucocytosis, and thrombocytopenia were more present in the obstetric group. Conclusions The admission rate to the ICU may be reduced by improving the management of the hypertensive disease during pregnancy. Early admission to the ICU decreases the maternal mortality and morbidity. Despite several complications occurring with obstetric patients, the prognosis is still good. Reference 1.
Panchal S, et al.: Intensive care utilization during hospital admission for delivery. Prevalence, risk factors, and outcomes in a statewide population. Anesthesiology 2000, 92:1537-1544.
P514 Management and risk factors for maternal morbidity of eclampsia in a Moroccan teaching hospital Y Zarrouki, M Boutbaoucht, Y El Waggagui, G El Adib, S Younous Mohammed VI Teaching Hospital, Marrakesh, Morocco Critical Care 2011, 15(Suppl 1):P514 (doi: 10.1186/cc9934) Introduction Eclampsia is a serious complication of pregnancy, it remains a frequent condition in our context. The aim of this study is to measure the incidence of eclampsia, its risk factors associated with adverse maternal outcome and to identify its most common presentations in our practice. Methods Through a prospective descriptive study spread over 1 year (November 2009 to October 2010), all cases of eclampsia gathered in the maternity ICU of Marrakesh Teaching hospital are included, and epidemiological and prognostic data were analyzed by either chisquared analysis or the unpaired Student test as appropriate. Results The incidence of eclampsia was 6.68/1,000 deliveries, it is behind 11% of hospitalizations in our ICU (59 cases during study period) with 87% of patients referred from all southern Morocco. Sixty-two percent of seizures occurred antepartum, 20% during labor and 18% postpartum. Two peaks of age are observed, 22 ± 5 years and 36 ± 4 years. Major maternal complications included HELLP syndrome (12%), abruptio placentae (8%), disseminated intravascular coagulopathy (8%), pulmonary edema (5%), acute renal failure requiring dialysis (4%), aspiration pneumonia (3%) and neurologic complications (3%) including hemorrhage, ischemia and cerebral venous thrombosis. Maternal mortality was 6.7% and perinatal mortality was 16.9%. Parturients with antepartum eclampsia have significantly higher incidences of HELLP syndrome (14% vs. 6%; P = 0.02) and abruptio placentae (12% vs. 4%; P = 0.006) than did those in whom eclampsia developed intrapartum and postpartum. In contrast, women with postpartum eclampsia were more unlikely to have acute renal failure
Critical Care 2011, Volume 15 Suppl 1 http://ccforum.com/supplements/15/S1
(7% vs. 2%; P = 0.005) and neurologic complications (5% vs. 1%; P = 0.001) than were those with antepartum eclampsia. In addition, older women develop more renal failure than younger ones (9% vs. 2%; P = 0.001). Conclusions Pregnancies complicated by eclampsia are purveyors of high maternal morbidity and mortality. Antepartum and postpartum cases were more severe than intrapartum cases; the same observation is made among older women. P515 Clinical and diagnostic value of transcranial cerebral oximetry in the optimization of mechanical ventilation in newborn infants V Estrin, A Simonova Research Institue of Obsetrics and Pediatrics, Rostov on Don, Russia Critical Care 2011, 15(Suppl 1):P515 (doi: 10.1186/cc9935) Introduction Treatment of ischemic damage to organs and tissues by mechanical ventilation with a high content of oxygen in the inspired mixture (FiO2) can lead to oxidative stress and reperfusion of tissue alteration, which is particularly characteristic of infants with their characteristic low levels of antioxidant protection. From this perspective, there is optimal mode selection in mechanical ventilation and FiO2 of vital organs and tissue, namely in brain tissue, which was made possible through the use of transcranial cerebral oximetry (TCO). Methods At stage 1 of the study, with the consent of the ethics committee and informed parental consent, we examined 24 infants born in the physiological department of the maternity hospital RNIIAP of gestation 38 to 40 weeks, with Apgar 7 to 10, and birth weight 2,500 to 3,900 in the state of physiological sleep after feeding. In all children, we measured the cerebral tissue oxygen saturation (SctL, SctR) using the cerebral oximeter Fore-sight (USA) at 1, 3 and 5 days after birth. Later, in a controlled, randomized study were included two groups of neonates on mechanical ventilation. In patients of group 1 (n = 35), modes and ventilator FiO2 were determined under the control of TCO in a way that is as close as possible to indicators of cerebral oxygenation for the age norm. In patients of group 2 (n = 33), mode selection and FiO2 ventilation was carried out under the supervision of pulse oximetry and partial oxygen tension (pO2), according to acid–base balance, excluding indicators for TCO. Results At stage 1 the study defined age-norm TCO indicators for healthy infants amounting in the left hemisphere of the brain to 79.2 ± 4.06% (0.01 <P <0.05) and in the right hemisphere to 84.89 ± 5.1% (0.01 <P <0.05). At phase 2 of the study group infants, the selection of modes and ventilator FiO2 on the basis of indicators for TCO statistically significantly (in all cases 0.01 <P <0.05) decreased length of stay on the ventilator (from 9.4 to 5.6 bed-days), mortality (from 2.7% to 0%), and number of complications (cases of radiologically confirmed pneumonia from 4.2% to 0.2%) compared with the control group. Conclusions The use of TCO for the optimization of mechanical ventilation and oxygen saturation monitoring in brain tissue in newborn infants in critical condition is a promising method for reducing mortality, reducing the term of ventilation and reducing complications of oxygen therapy in this group of patients. P516 Assessment of artificial ventilation in Salvadorian public hospitals JF Granados, PE Sobenes, MT Bertoli Dr Jose Matias Delgado University, Antiguo Cuscatlan, El Salvador Critical Care 2011, 15(Suppl 1):P516 (doi: 10.1186/cc9936) Introduction Artificial ventilation (AV) is an essential resource that is not always available at Salvadorian public hospitals. Approximately 40% of hospital-related deaths may have required AV [1]. The main indication for AV is respiratory insufficiency requiring support for these patients. Variations in ventilation modality and time among others can affect patient health [2]. The aim of this study was to clarify the AV situation in national hospitals of El Salvador’s public health system. Methods This study is transversal descriptive. A representative sample (n = 5) of public national hospitals was selected. These included four second-level hospitals and one third-level hospital. Two hospitals
S182
were from the central metropolitan region, one from the par central, west and east region; representing 36.1% of available hospital beds nationwide. To complete AV data of the totality of public hospitals, a telephone survey was used. All data about patients, AV type, costs, maintenance and operative personnel, among others, were collected. Results Only 18% of all public hospitals around the country have mechanical AV. The majority of mechanical AV on the public health network is focused on Rosales National Hospital (HNR), with 61.9% of mechanical ventilators nationwide. Mechanical AV is operated by respiratory therapy personnel at HNR and Zacamil National Hospital; however, in another two hospitals from the east and west region, mechanical AV is operated by residents; and manual AV is provided by self-inflating resuscitator bag operated by interns only. The main causes of AV are nonsurgical; representing 88.9% of the reasons to employ mechanical AV, and 100% for manual AV. The mean patient ventilation time for mechanical AV was >48 hours, and for manual AV was >24 hours. No patient with manual AV had normal pO2. The maintenance cost for all mechanical AV was less than $100 per month per ventilator and only 68% of mechanical ventilators were functional, the most frequent model being Servo900. Conclusions The actual mechanical AV existence is very limited, since only four out of 14 departments have this resource, representing 18% of public health centers nationwide, centralized in the department of San Salvador, leaving 82% of these centers with no mechanical ventilation at all, being probably supplanted by manual AV. Results show the necessity for cheaper, efficient and easy-to-use AV systems. References 1. 2.
Deaths_all_eages_2008.pdf [www.salud.gob.sv/archivos/pdf/causas_ frecuentes2008/Muertes_Todas_las_Edades_2008.pdf ] Peleg AY, et al.: N Engl J Med 2010, 362:1804-1813.
P517 Comparison of the stated religious beliefs amongst UK intensive care physicians and the UK population A Tillyard, DT Ashton-Cleary Derriford Hospital, Plymouth, UK Critical Care 2011, 15(Suppl 1):P517 (doi: 10.1186/cc9937) Introduction The UK is a multifaith culture and 77% of the population considered themselves to belong to a religious group in the 2001 UK Census [1]. Differing faiths have differing customs and views surrounding end-of-life decisions and care. Treatment withdrawal and withholding of life-sustaining care or CPR have been shown to be significantly influenced by both patient and physician religion [2]. We wanted to determine whether the population faith mix was reflected amongst UK intensive care physicians. Methods We conducted an online survey amongst the members of the UK Intensive Care Society. We asked them to state whether they considered themselves to belong to a faith group. Results A total of 550 questionnaires were returned; 182 (33.1%) were from intensive care consultants. These are compared with UK 2001 Census data. Over 50% abstained from the question (vs. 7.8% in the Census). A total 11.8% of respondents were atheists (vs. 15.05% in the Census). Members of the Catholic Church and Church of England formed 8.4% and 10.2% of respondents. These faiths are grouped together in the Census as Christians and formed 71.8% in that sample. A total 1.8% were Hindu (0.98% in the Census) and 1.5% were Muslim (vs. 2.78% in the Census). Those belonging to other faiths formed 14.5% amongst respondents and 1.59% in the Census. Conclusions The proportionately smaller UK faith groups are represented to largely similar extents amongst physicians. A much larger proportion of our study sample abstained from the question than in the UK Census (51.8% vs. 7.8%). Our questionnaire was presented along with questions regarding decisions to exclude patients from the ICU; abstainers may have felt their religious beliefs were being unfairly judged as a source of bias in their other answers. The religious makeup of a group of physicians can clearly not be manipulated to match that of the population but consideration should be given to how this factor may influence treatment decisions. This is likely to be of particular relevance where physician and patient do not share the same faith.
Critical Care 2011, Volume 15 Suppl 1 http://ccforum.com/supplements/15/S1
References 1. 2.
Office of National Statistics UK 2001 Census. Focus on Religion [http://www. statistics.gov.uk/downloads/theme_compendia/for2004/FocusonReligion.pdf ] Sprung CL, et al.: JAMA 2003, 290:790-797.
P518 Characteristics of Outreach patients that received end-of-life counseling K Kyeremanteng, RP Patel, EF Fitzgibbon The Ottawa Hospital, Ottawa, Canada Critical Care 2011, 15(Suppl 1):P518 (doi: 10.1186/cc9938) Introduction Approximately 20 to 30% of ICU patients are palliated in the ICU. Many of these patients have not had goals of care discussions prior to being admitted to the ICU. Several of these patients may have prolonged courses that can cause anguish for patients and their families and may have been prevented if goals of care discussions occurred earlier. There has been increasing evidence that palliative care involvement in critical care improves outcomes such as quality of end-of-life care [1], decreased length of stay [2] and better pain and symptom management [3]. No studies have looked at medical emergency teams/Outreach with respect to palliative care and endof-life care. We performed a retrospective descriptive study looking at the characteristics of Outreach patients who received end-of-life counseling (EOLC). Methods We evaluated 80 patients from The Ottawa Hospital General campus that were seen by Outreach and received EOLC in 2007. From the Outreach database and the hospital computerized health record system, we obtained patient demographics and medical information such as admission diagnosis and reason for Outreach call. We compared these patients with ones that did not receive EOLC. We also subdivided the patients that received EOLC into patients that were successfully palliated versus ones that were not palliated and compared patient characteristics. Results Twenty-one percent of all Outreach patients received EOLC in 2007. Comparing patients that received EOLC with those with no EOLC, mean age was 72.3 ± 11.5 versus 68.9 ± 17.6 (mean ± SD). Fiftytwo percent had cancer versus 38%. Dementia was involved in 17% of EOLC patients versus 8% in non-EOLC patients. Length of stay (LOS) was 26.3 ± 26.1 days versus 34 ± 30.7. Admission to Oncology/Hematology/ Radiation Oncology was 33% in the EOLC group compared with 20%. The proportion of patients seen during the day was 49% versus 64%. Call indication was mostly respiratory in the EOLC group (53% vs. 32%). Sex, number of co-morbidities, days admitted prior to Outreach call and admission diagnosis were similar in both groups. Amongst the patients that received EOLC, 49% were palliated and 51% were not palliated. Patient characteristics were similar in these two groups. (t-Score testing is pending.) Conclusions At our tertiary center, the Outreach patients that receive EOLC tend to be older, admitted for respiratory illness and have a diagnosis of cancer. References 1. 2.
3.
Campbell ML, Guzman JA: Impact of a proactive approach to improve end-of-life care in a medical ICU. Chest 2003, 123:266-271. Norton SA, Hogan LA, Holloway RG, et al. Proactive palliative care in the medical intensive care unit: effects on length of stay for selected high-risk patients. Crit Care Med 2007, 35:1530-1535. Delgado-Guay M, Parsons HA, Li Z, et al.: Symptom distress in advanced cancer patients with anxiety and depression in the palliative care setting. Support Care Cancer 2009, 17:573-579.
P519 Discussing end-of-life issues with terminally ill cancer patients and their families: our results BE Eftimova, B Lazarova Clinical Hospital, Stip, Macedonia Critical Care 2011, 15(Suppl 1):P519 (doi: 10.1186/cc9939) Introduction Most of the literature regarding communication between health professionals and patients at the end of life and their families
S183
has focused on specific topics, like breaking bad news and discussing treatment decisions such as CPR and advanced directives. Conversation about end-of-life issues often takes place over time rather than as a single discussion. The objective of this paper is to explore the optimal content and phrasing of information when discussing the dying process and E-O-L issues with terminally ill cancer patients and their families. Methods We conducted focus groups and individual interviews with 20 palliative care patients and their families treated in Clinical Hospital Stip in the past 12 months. The focus groups and individual interviews were fully transcribed. Further individual interviews were conducted until no additional topics were raised. Participant’s narratives were analyzed using qualitative methodology. Results Distinct content areas emerged for discussing E-O-L issues: treatment decisions at the E-O-L; potential future symptoms; preferences for place of death; the process of dying; what needs to be done immediately after death; and existential issues. When discussing process of dying participants are recommended: exploring the person’s fears about dying; describing the final days and unconscious period; and the reduced need for food and drinks. Many participants identified the dilemma regarding whether to discuss potential complications around the time of death. Conclusions This paper provides strategies, phrases and words that may inform about the process of dying and E-O-L issues. This will be useful especially for patients’ families. Further research is needed to determine the generality of these findings. References 1. 2. 3.
Maddocks I: Palliative care in the 21st century. Med J Aust 2003, 179(Suppl 6):S4-S5. Larson DG, Tobin DR: End-of-life conversations: evolving practice and theory. JAMA 2000, 284:1573-1578. Curtis JR, Wenrich MD, Carline JD, et al.: Understanding physicians’ skills at providing end-of-life care perspectives of patients, families and health care workers. J Gen Intern Med 2001, 16:41-49.
P520 Factors associated with withdrawal of life-sustaining therapy in severe traumatic brain injury patients N Côte1, A Turgeon1, F Lauzier1, L Moore1, JF Simard1, D Scales2, K Burns2, M Meade3, F Bernard4, D Zygun5, D Fergusson6; Canadian Critical Care Trials Group 1 Université Laval, Québec, Canada; 2University of Toronto, Canada; 3McMaster University, Hamilton, Canada; 4Université de Montréal, Canada; 5University of Calgary, Canada; 6University of Ottawa, Canada Critical Care 2011, 15(Suppl 1):P520 (doi: 10.1186/cc9940) Introduction Traumatic brain injury (TBI) mortality remains high and often follows withdrawal of life-sustaining therapy (WLST). Studies reporting the determinants of WLST in this population are scarce. We analyzed data from a multicenter retrospective cohort study to identify factors associated with WLST in TBI. Methods We randomly selected charts of 720 mechanically ventilated severe TBI patients (identified using ICD-10 codes) admitted to the ICUs of six participating centers (120 patients per center) over a 2-year period. Data were abstracted using a standardized case report form and operations manual. Among nonsurvivors (n = 228), we compared patients who died following WLST with those who did not in order to investigate the potential influence of variables pertaining to the injury and management. Our final model to WLST included four baseline characteristics (age, gender, GCS and pupillary reflex) and factors with P <0.2. Research ethics approval was obtained in all participating centers. Results We analyzed 225 patients (three missing data) including predominantly male patients (69.7%) with a mean age of 50.7 years. Among nonsurvivors, brain herniation on initial CT scan was more often reported in patients dying following WLST (OR = 2.91, 95% CI = 1.16 to 7.30, P = 0.02), while the opposite was observed for epidural hematoma (OR = 0.18, 95% CI = 0.06 to 0.56, P <0.01). Craniotomy (OR = 0.12, 95% CI = 0.02 to 0.68, P = 0.02) and other nonneurosurgical procedures (OR = 0.08, 95% CI = 0.02 to 0.43, P <0.01) were associated with a lower odds of death following WLST. Other interventions, such as vasopressor use (OR = 0.50, 95% CI = 0.22 to 1.11,
Critical Care 2011, Volume 15 Suppl 1 http://ccforum.com/supplements/15/S1
P = 0.09), DVT prophylaxis (OR = 0.33, 95% CI = 0.11 to 1.03, P = 0.06) and insulin infusions (OR = 2.13, 95% CI = 0.99 to 4.62, P = 0.06) were not significantly associated with lower and higher odds of death due to WLST, respectively. Conclusions Death due to WLST was associated with several patient and clinical factors. We also observed that WLST was less frequent among patients that had received more aggressive treatments, for example craniotomy. Further research is required to understand factors that influence decisions to WLST in severe TBI patients, since these decisions may be modifiable and based on physicians’ and surrogates’ perceptions of prognosis. P521 Documenting end-of-life care plans on the ICU: using a digital proforma may improve compliance with nationally agreed standards S Cantellow, D Harris, S Smith, C Bordeaux, M Thomas Bristol Royal Infirmary, Bristol, UK Critical Care 2011, 15(Suppl 1):P521 (doi: 10.1186/cc9941) Introduction The Liverpool Care Pathway (LCP) is the accepted gold standard in the documentation of end-of-life care in the UK. A computerized version of the LCP in the form of a digital proforma (DP) exists as an option on our unit. Some clinicians choose to use freetext (FT) entry citing as this can be more comprehensive. Our study investigates whether usage of the DP is likely to result in a greater degree of compliance with LCP standards than FT alone. Methods All deaths occurring between 1 January 2009 and 30 June 2009 were identified from the record of ITU admissions. Cases of cardiac arrest and brain stem death were excluded. Quality of documentation was scored by a nurse and doctor assessor (for each LCP goal: 0 = nothing entered, 1 = goal partially addressed, 2 = goal fully addressed). The average of the total scores for each case was calculated. Performance of the DP was analysed by comparing average total scores for DP versus FT alone using simple nonparametric descriptors. Results There were 52 deaths and 45 after exclusions. Use of the DP resulted in considerably higher total average scores (range 13.50 to 17.5, interquartile range 15.50 to 16.75, median 15.50) than use of FT alone (range 0.00 to 9.50, interquartile range 1.75 to 6.25, median 4.00). Statistical significance is suggested by the lack of overlap in the range values. See Figure 1. Conclusions Using the DP for end-of-life documentation is highly likely to improve compliance with accepted standards in end-of-life care. Doctors using FT alone were unlikely to document all of the broad issues that require consideration. The use of a DP can function as a useful checklist ensuring patients receive the best care when organ support is withdrawn.
S184
P522 Gender influences end-of-life decisions ME Lissauer, L Smitz-Naranjo, SB Johnson RA Cowley Shock Trauma Center, Baltimore, MD, USA Critical Care 2011, 15(Suppl 1):P522 (doi: 10.1186/cc9942) Introduction End-of-life care is an unavoidable component of critical care. Despite palliative care guidelines, wide variations exist in patient selection and implementation of limitations in care decisions. Understanding why some patients have care limited and some are provided full resuscitative efforts allows opportunities for improving care at the end of life. Methods All consecutive deaths (n = 151 patients) in a tertiary-care surgical ICU over a 2.2-year period were reviewed. Patients were divided into groups: withhold (WH) = patients who had potentially life-saving therapies withheld/withdrawn; full care (FC) = patients who had full resuscitative efforts prior to death. Demographics, acute physiology score (APS), and APACHE IV scores were used to compare groups. Fisher’s exact test and Student’s t test (significance: P <0.05 level) were used. Results A total of 1,764 patients were admitted and 151 (8.6%) died. Patients who died had a mean age of 63 ± 14 years and 83 (55%) were male. One hundred and eleven (74%) had potentially life-saving therapy withheld/withdrawn (WH group). Forty patients (26%) had full resuscitative efforts until time of death (FC group). Age, admission APACHE IV, and APACHE IV at time of death/withdrawal of care were similar between genders, however significantly more males had care withdrawn than females (83% vs. 47%, P <0.005). Compared with the FC group, the WH group was less sick at ICU admission (APS: 76.7 ± 28.3 vs. 91.7 ± 37.0, P <0.01) but had similar pre-existing co-morbidities (chronic health points: 13.3 ± 7.2 vs. 11.7 ± 6.9). Compared with their admission APS, both groups had similar deteriorations in clinical status and the FC group remained significantly more ill (APS 93.6 ± 31.4 vs. 109.4 ± 44.7, P <0.02 between groups and P <0.05 compared with admission). Factors not different between groups included: APACHE diagnosis, admitting service, admitting source (ED, OR, floor, other hospital), need for mechanical ventilation, or readmissions. Specifically there were no differences between groups in types of chronic illnesses including cancer, liver disease, COPD, diabetes or in ICU length of stay (18 ± 17 vs. 16 ± 37). Conclusions Gender more than age, severity of illness, diagnosis, and co-morbidities had a profound influence on end-of-life care and decisions. Duration of the ICU stay and deteriorating status did not appear to impact decisions to limit care. The FC group was more sick at ICU admission and at time of death than the WH group. Gender issues at end of life need to be further studied to optimize limitations of care for all patients.
P523 Survey of the use of ancillary tests in the diagnosis of brain stem death A Sherrington, L Barrass, G Mandersloot, M Healy The Royal London, London, UK Critical Care 2011, 15(Suppl 1):P523 (doi: 10.1186/cc9943)
Figure 1 (abstract P521).
Introduction In the UK, the diagnosis of brain stem death (BSD) is mainly confirmed by clinical testing. The Code of Practice guidelines regarding the time interval between cessation of sedative drugs and testing allow for considerable variation in interpretation and practice [1]. In some countries, ancillary tests are used as an alternative to clinical diagnosis [2]. Our aim was to survey current attitudes and practice surrounding the use of ancillary tests in the diagnosis of BSD. Methods We confirmed ethics committee exemption and the survey was peer-reviewed by the Neuro-critical Care Network. We distributed it electronically to the 31 neuro-critical care centres in the UK, collecting responses anonymously. Results We had a response rate of 94%. The majority of centres had four-vessel angiography (4VA) and spiral CT angiography (CTA) available (25 and 24, respectively), 13 centres had access to transcranial
Critical Care 2011, Volume 15 Suppl 1 http://ccforum.com/supplements/15/S1
Doppler (TCD) and 12 to evoked potentials (EPs). Twenty-three centres had used or would consider ancillary tests in addition to clinical tests where these could not be completed due to the nature of injury (for example, facial trauma); 19 centres had used or would consider this when drug levels were unavailable. Four centres had used ancillary tests alone to confirm BSD where depressant drug levels had precluded clinical testing; a further eight centres would consider this approach. First-choice investigation was CTA in 48% of centres, 30% preferred 4VA, and 4% TCD. Following cessation of sedative drugs, there was considerable variation in timing of clinical testing and pharmacokinetic factors considered. Whilst 33% of centres measure thiopentone levels in all cases, 22% never do. In five centres, delays in testing due to raised drug levels exceeded 5 days. Where raised levels preclude testing, 17 centres were confident that 4VA would diagnose BSD in some or all circumstances; 13 centres were confident with CTA. TCD and EPs were considered less reliable. Conclusions There is considerable variation in UK opinion and practice. Measurement of drug levels is not universal but raised levels delay diagnosis significantly. More than one-half of the centres surveyed would be confident in using an ancillary test alone to diagnose BSD. Further consensus is needed. References 1. 2.
A Code of Practice for the Diagnosis and Confirmation of Death. London: Academy of Medical Royal Colleges; 2008. Australian and New Zealand Intensive Care Society: The ANZICS Statement on Death and Organ Donation. 3rd edition. Melbourne: ANZICS; 2008.
P524 Interactions of endotoxin, albumin function, albumin binding capacity and oxidative stress in brain-dead organ donors V Stadlbauer1, B Leber2, P Stiegler2, S Stanzer1, U Mayrhauser2, S Köstenbauer2, M Sereinigg2, A Puntschart2, T Stojakovic2, K Tscheliessnigg2, K Oettl2 1 University Hospital Graz, Austria; 2Medical University Graz, Austria Critical Care 2011, 15(Suppl 1):P524 (doi: 10.1186/cc9944) Introduction Albumin binds and detoxifies endotoxin in healthy people. Oxidative stress leads to protein oxidation and thus to impaired binding properties of albumin. This, in combination with increased gut permeability, leads to appearance of endotoxin in the systemic circulation and further to impaired organ function. We hypothesise that these processes occur in serum of brain-dead organ donors. Methods Eighty-four consecutive brain-dead organ donors were enrolled. Endotoxin was determined with an adapted limulus amoebocyte lysate assay. Albumin fractions and binding capacity were determined by HPLC. FlowCytomix™ was used for determination of cytokine levels and RT-PCR for analysis of tight junction protein (TJP) mRNA expression. Brain-dead organ donors were categorized by the length of ICU stay. Survival data of 76 organ recipients were collected. Results Albumin binding capacity for dansylsarcosine was reduced in brain-dead organ donors compared with controls. Endotoxin positivity in was found in 16.7% of brain-dead organ donors. Endotoxin positivity but not length of ICU stay was associated with a further decrease of binding capacity. In organ donors albumin was higher oxidized than in controls. Lengths of ICU stay increased albumin oxidation further. In addition, IL-6, IL-8, IL-10 and IL-1β levels were elevated in patients whereas IFNγ levels were within the normal range. Recipients of organs from endotoxin-positive donors showed a significantly worse survival as compared with recipients from endotoxin-negative donors (log-rank P <0.05). Length of ICU stay of the donor did not have any influence on outcome of the recipients. Preliminary data for TJP expression in duodenum samples showed a trend towards lower expression in the endotoxin-positive sample. Conclusions We therefore conclude that oxidative stress, as well as systemic endotoxemia, is present in a proportion of in brain-dead organ donors that might have a negative impact on outcome of recipients. High endotoxin levels might be due to increased gut permeability and decreased binding capacity of albumin facilitated by higher albumin oxidation.
S185
P525 Children visiting the ICU KK Borges, L Genaro, M Monteiro Clinica Sao Vicente, Rio de Janeiro, Brazil Critical Care 2011, 15(Suppl 1):P525 (doi: 10.1186/cc9945) Introduction Most hospitals only allow children above 12 years old to visit adult ICU patients. However, younger children participating in the hospitalization process manifest, through their family members, their willingness to visit their hospitalized relatives. This raises different healthcare team members’ opinions on how to manage their visits to the ICU and prevent psychological harm. This study suggests some relevant steps to allow and receive a child in an adult ICU. Methods A literature review on children visiting the ICU was performed to construct the steps. The flowchart was based on Torres’ studies of the child in the face of death, based on Piaget’s cognitive development. The flowchart: Identify the family request, either to the psychologist or to the team, to allow the child’s visit / Understand the family context and information provided to the child / Healthcare team discussion – team consensus and ICU routine adjustment / Psychologist interview and accompaniment to the bed / After-visit evaluation and follow-up during the ICU stay from family information. Results The literature search has shown diversified results. The use of the flowchart, adjusted to each case requirement, has been very useful in our institution’s practice. We could perceive that the healthcare team feels more serene and confident with this guidance and that the families feel more relieved and assured by sharing their afflictions related to their children. Conclusions The interdisciplinary work is fundamental to using the flowchart, requiring a healthcare team aligned with its aims and, above all, sensitive to the essence of the bioethical principle of autonomy, ruled by the patient’s and family member’s will. However, due to this subject relevance and sensitivity, new discussions are required to deepen the studies and therefore systematize children’s visits to ICUs. References 1. 2.
3.
Barker C, Nieswiadomy RM, Arnold WK: Nursing interventions for children with a parent in the intensive care. Heart Lung 1998, 17:441-446. Johnstone M: Children visiting members of their family receiving treatment in ICUs: a literature review. Intensive Crit Care Nurs 1994, 10:289-292. Torres WC: Children Facing Death: Challenges. São Paulo, Brazil: Casa do Psicólogo; 1999.
P526 Is there a difference in response rate and degree of satisfaction among family members of survivors and nonsurvivors at admission to intensive care? C Teixeira1, J Keating2, I Silva2, A Veloso2, O Ribeiro3, I Aragão1 1 Centro Hospitalar do Porto, Portugal; 2Universidade do Minho, Braga, Portugal; 3 Faculdade de Medicina, S. Bioestatística e Informática Médica, Porto, Portugal Critical Care 2011, 15(Suppl 1):P526 (doi: 10.1186/cc9946) Introduction The objective was to identify whether there are differences in the degree of satisfaction among family members of survivors and nonsurvivors on admission to the ICU. Also, to identify who they are and what are the sociodemographic characteristics of the relatives answering a questionnaire for assessing the needs of relatives of patients admitted to our ICU, and what are the clinical and sociodemographic characteristics of patients. Methods A letter was sent to all families who had a relative in the ICU in the period of 1 year, with a sealed envelope with the address, and the questionnaire: characterization of the family, assessing the satisfaction of the needs in family-gathering areas for support, comfort, access, information, and trust. We also collected sociodemographic data and patient records. Statistical analysis was performed using SPSS v.17.0. Results We obtained responses from 90 families, 43% spouses, mean age 47 years, 65% female. Characterization of patients (median (P25 to P75)): 78% male, age 60 years (41 to 73), SAPS 43 (33 to 54), number of hospital days in the ICU 9 days (4 to 16). We obtained a higher and statistically significant (P <0.05) response rate in relatives of patients hospitalized longer and in those who survived. The family satisfaction
Critical Care 2011, Volume 15 Suppl 1 http://ccforum.com/supplements/15/S1
was generally good. The relatives of the survivors were more satisfied in all dimensions evaluated (a value closer to greater satisfaction), although this difference was statistically significant only in the comfort dimension (P = 0.003). Conclusions Contrary to other studies we found that relatives of the survivors are more satisfied with most aspects of care received, better meeting their needs than family members of nonsurvivors, although this difference is statistically significant only in the dimension comfort. The results emphasize the need for improved measures of comfort in the ICU. One factor, among others, to explain this result may be that on one hand the aspects of patient-centered care and family were similar in both groups, but on the other hand the relatives of the survivors feel more a lack of space suitable for families that currently do not exist in our ICU. There is a growing recognition that families are an integral part of the modern ICU and that we should incorporate the findings of this evaluation of needs and family satisfaction in quality improvement in the ICU. P527 Patient’s families in the ICU: describing their strategies to face the situation KK Borges, MG Mello, CM David Universidade Federal do Rio de Janeiro, Brazil Critical Care 2011, 15(Suppl 1):P527 (doi: 10.1186/cc9947) Introduction The ICU is an environment that generates permanent anguish in family patients due to the possibility of the death of the patient [1]. The stressful situation might induce families to call upon strategies of facing different levels and intensities to keep the harmony of its own emotional structure. The objective is to describe the strategy processes used by families of severely ill patients in the ICU to face the situation. Methods A prospective study covering 14 families. We applied a qualitative method of interviewing and observing participants, complementing the data-gathering by applying the Strategies Inventory of Coping, by Folkman and Lazarus, adapted by Savoia and colleagues [2]. The mixed method used to interpret the results combines the quantitative and qualitative data into only one phase of the study, prioritizing the descriptive-analytical logic. Among the criteria of inclusion are: one member of the patient family in the ICU for more than 1 week, being an adult, must be present in most of the visit periods and receiving physician’s information of the patient conditions. Results Families utilize diverse strategies and at different levels, but the most used strategies almost always and most of the time are: escape and avoid (93%), positive re-evaluation and a strategy of problemsolving (79%), social support (43%) and responsibility acceptance (7%). The strategies were considered nonadaptative and the less used were distance, confronting and self-control. Conclusions Escaping and avoidance were the most used due to religious aspects, expressed through perseverance and optimistic attitudes as a way to solve problems, which is directly related to responsibility acceptance and self-control. Positive re-evaluation looks for significance and encouragement to overcome adversity and maintain hope. Knowing such psychological recourses allowed the hospital team to identify the necessity for human assistance to families, making them available in the relationship and prepared in the art of communication. References 1.
2.
Azoulay E, Pochard F, Chevret S, et al.: Impact of a family information leaflet on effectiveness of information provided to family members of intensive care unit patients. Am J Resp Crit Care Med 2002, 165:438-442. Savoia M, Santana P, Mejias N: Adaptação do Inventário de Estratégias de Coping de Folkman e Lazarus para o Português. Vol. 7. São Paulo: Psicologia USP; 1996:183-201.
P528 Communication with relatives in the ICU M Liu, S Hutchinson Norfolk & Norwich University Hospital, Norwich, UK Critical Care 2011, 15(Suppl 1):P528 (doi: 10.1186/cc9948) Introduction Relatives of patients in the ICU undergo considerable stress. Effective communication with relatives has been shown to:
S186
provide support, reduce stress, and improve their well-being and decision-making. Satisfaction also depends on communication by a senior caregiver. Our aim was to determine how well relatives of patients in the Norfolk & Norwich University Hospital (NNUH) ICU are kept informed. Methods The Metavision® Clinical Information System is used for documentation at the 20-bed NNUH ICU. Retrospective data analysis was conducted for patients staying >4 days during 1 October 2009 to 1 January 2010. Data from the ‘Relatives Communication’ page included: how often and when relatives were first spoken to, and the staff involved. These variables were compared with patient outcome and length of stay on the ICU. During 1 August to 1 October 2010 relatives were asked to anonymously complete a survey evaluating consultations in the ICU. Results Of 64 notes, communication with relatives was documented in 55% of patients. Of these, 60% of communication was conducted by a consultant. More discussions occurred with relatives of patients who died. Increasing duration of stay on the ICU resulted in a higher percentage of relatives being spoken to. Sixty-seven per cent of relatives of patients staying >20 days were not communicated with until after day 4 of admission. Of 40 surveys, all relatives agreed that the patient’s condition was discussed with them quickly enough after admission. Ninety-three per cent thought that they were spoken to often enough and 95% felt by the right staff. Eighty per cent were spoken to by senior staff but 45% stated updates were mostly given by nursing staff. Ninety percent felt they were given the right amount of information and in an appropriate location. Ninety percent were satisfied with their consultations. Seventy-three per cent agreed or partially agreed that written information about critical care would have been helpful. Conclusions Analysis of the notes indicated that communication with relatives of patients on the ICU was poor. This prompted surveying relatives’ satisfaction directly, which found that most are satisfied with their experiences of communication in the ICU. Hence, we conclude that relatives are well informed – mainly by nursing staff – but documentation of communication requires improvement. The system currently favours recording of formal conversations by medical staff whilst nursing updates are often documented elsewhere. A solution may be to develop a multidisciplinary record of communication. References 1. 2.
Curtis JR, et al.: Chest 2008, 134:835-843. Damghi N, et al.: Crit Care Med 2008, 36:2084-2091.
P529 Inter-observer agreement of Medical Research Council-sum score and handgrip strength in the ICU G Hermans, B Clerckx, T Vanhullebusch, J Segers, G Vanpee, C Robbeets, M Casaer, P Wouters, R Gosselink, G Vandenberghe UZ Leuven, Belgium Critical Care 2011, 15(Suppl 1):P529 (doi: 10.1186/cc9949) Introduction Muscle weakness often complicates critical illness and is associated with prolonged duration of rehabilitation, increased mortality and limiting functional outcome even years later [1]. To examine the effects of interventions on this complication, reliable measurements of muscle force in critically ill patients are needed. We aimed to examine, in critically ill patients, the inter-observer agreement on the Medical Research Council (MRC)-sum score and handgrip strength, two methods to quantify muscle force. Methods All patients were included in an ongoing randomized controlled trial examining two feeding strategies (ClinicalTrials. gov:NCT 00512122) and constituted a cross-sectional, randomly selected sample. Patients were studied on median ICU day 17 (11 to 29.5). Two observers independently measured the MRC-sum score in 75, and handgrip strength in 46 critically ill patients. Results The intra-class correlation coefficient (ICC) for the MRCsum score was 0.95 (0.92 to 0.97), with weighted kappa coefficient for individual muscle group scores of 0.83 ± 0.03. Kappa coefficient was 0.68 ± 0.09 for identifying patients with MRC-sum score <48, 0.88 ± 0.07 for MRC-subtotal in the upper limbs <24, and 0.93 ± 0.07 for
Critical Care 2011, Volume 15 Suppl 1 http://ccforum.com/supplements/15/S1
MRC-sum score <36. The ICCs for left and right handgrip strength were respectively 0.97 (0.94 to 0.98) and 0.93 (0.86 to 0.97). Conclusions We found very good inter-observer agreement, both for MRC-sum score and for handgrip strength in critically ill patients. When applying MRC-sum score <36 as a cut-off for severe weakness, agreement was excellent supporting its use as an outcome parameter for interventional studies. Agreement on identifying significant weakness (MRC-sum <48) was good. For an equivalent cut-off to identify significant weakness in the upper limbs (<24), agreement was very good. It remains to be determined whether this may be used as a substitute for the total MRC-sum score. Reference 1.
Herridge MS, et al.: N Engl J Med 2003, 348:683-693.
P530 Assessment of functional capacity after discharge from the ICU E Caser, P Simões, A Casati, C Barbas CIAS, Vitória, Brazil Critical Care 2011, 15(Suppl 1):P530 (doi: 10.1186/cc9950) Introduction Functional capacity refers to the degree of involvement in activities and is often used as synonymous with performance in activities of daily living such as self-care. These measures of capacity are useful and provide some understanding on the prognosis and outlook for independence after discharge. This study was designed to analyze the functional capacity before ICU admission and after hospital discharge. Methods A 7-month prospective observational study (1 October 2007 to 1 May 2008) was carried out in a 16-bed medical–surgical ICU. Patients >18 years old and admitted >72 hours were included. We interviewed cooperative patients or close relatives using the Barthel Index to evaluate the ability of a patient in daily life activities. Questions were applied upon admission to the ICU and 7, 90 and 180 days after hospital discharge. Results Out of 322 admissions, 135 patients met trial criteria for inclusion in the study (mean age 66 ± 22 years and 55.6% male). The mean APACHE II score was 18 ± 6 and the mean length of ICU stay was 17 ± 7 days. A total of 15.9% were abed at admission, 39.1% at 7 days, 23.9% at 90 days and 28.3% at 180 days after discharge were still abed. Upon admission 43.5% practiced some type of physical activity, 7 days after discharge 21.7%, and at 90 and 180 days 40% and 34.8%, respectively, had some physical activity. The functional capacity assessed by the Barthel index at admission, 7, 90 and 180 days after hospital discharge were respectively 84 ± 28, 71 ± 32, 78 ± 31 and 79 ± 31 points. There was a statistically significant difference between functional capacity at baseline, at 7, 90 and 180 days with APACHE II and age. The ICU mortality was 14.2%, hospital mortality was 31.9% and cumulative mortality at 7 days after hospital discharge was 32.6%, at 90 days was 36.3% and at 180 days was 38.5%. Conclusions The independence in daily life activities decreased significantly after admission to the ICU; however, at 90 and 180 days after hospital discharge they increased but did not return to their levels prior to admission. The presence of an ill population of older people in the ICU may have contributed to these results. References 1. 2.
Mahoney FI, et al.: Maryland State Med J 1965, 14:56-61. Nicholas A, et al.: Crit Care Med 2001, 29:2119-2124.
P531 Rehabilitation after critical care: using audit to guide changes in practice, a multidisciplinary (MDT) approach N Glasby, E Blake, D Green Kings College Hospital, London, UK Critical Care 2011, 15(Suppl 1):P531 (doi: 10.1186/cc9951) Introduction To audit the holistic assessment and treatment planning of critical care patients of more than 5 days stay, in line with the National Institute of Clinical Excellence (NICE) guidelines published in March 2009. The guidelines state that each patient should have a full comprehensive assessment and reassessment of all physical
S187
and nonphysical potential problems, individual goal-setting and documented communication between patient, MDT and family members. Methods An audit form was developed from NICE guidelines and piloted with 10 patients, feedback on the audit form from the staff was then collected and the audit form amended as necessary. A sample of patients was identified (10% of 2008/2009 admissions of >5 days) and the first 10 sets of notes were assessed for inter-rater reliability between the staff collecting the information (doctors, occupational therapists, physiotherapists, nurses and speech and language therapists). The results were then compiled and new documentation developed to prompt consideration of potential physical and nonphysical problems. Weekly MDT rehabilitation ward rounds and goal-setting meetings were also commenced. A repeat audit using the same tool is to commence in December 2010/January 2011 with a second sample planned for June 2011/July 2011 in line with original audit samples. Results Physical problems were comprehensively assessed in 100% of the sample population; however, there was little evidence of assessment of potential nonphysical problems in most patients. There was poor documentation of information-giving to patient relatives in all aspects of their care, particularly around goal-setting and social aspects of care. Transition from critical care to the ward was highlighted as an area to be improved, with poor information provision to the ward and to the patient/carer. Conclusions Following the initial audit, in order to resolve the highlighted issues several initiatives were put in place: a rehabilitation ward round was commenced with weekly MDT goal-setting, a psychosocial history form was introduced along with a critical care MDT assessment tool. We are now beginning to re-audit following these changes in practice. Subjectively, collaborative working has enhanced patient care by optimising communication across the whole MDT. At the time of the conference 50% of the second audit will be completed, which will give some indication of the impact of our change in practice. Reference 1.
[www.guidance.nice.org/CG83]
P532 An audit of adult critical care rehabilitation processes in a UK district general hospital based on NICE guidelines R Agarwala, N Ahmed, K Patil Croydon University Hospital, Croydon, UK Critical Care 2011, 15(Suppl 1):P532 (doi: 10.1186/cc9952) Introduction The majority of patients who survive critical illness have significant physical and nonphysical morbidity [1]. Current UK National Institute of Clinical Excellence guidelines set a minimum standard for the provision of rehabilitation services following ICU admission [2]. We audited local adherence to these guidelines in our 670-bed district general hospital and required a standard of 100% adherence to all parameters. Methods A retrospective review of all patients ventilated, on the ICU, from September to November 2009 who survived to hospital discharge. Data reviewed included critical care and hospital discharge summaries, and notes from outreach follow-up, psychiatry follow-up and the ICU outpatient clinic. Results Seventy-five patients were ventilated on our ICU during the period specified. Forty-two out of 75 (56%) survived to hospital discharge and records were available in 32 patients for inclusion in analysis. Mean total hospital stay was 44 days. Thirty-two out of 32 (100%) patients were formally assessed for their risks of developing physical and nonphysical morbidity before leaving the ICU, with shortterm and medium-term rehabilitation goals being set in 28/32 (87%) of patients. Thirty-two out of 32 (100%) patients had a comprehensive clinical assessment following discharge from the ICU to identify rehabilitation needs during their ward stay. Thirteen out of 32 (41%) patients were seen by a psychologist. Seven out of 19 (37%) of those who did not see a psychologist did not meet criteria for referral, but in 10/19 (53%) who did meet criteria no referral was made. Thirteen out of 32(41%) patients were seen in an ICU outpatient clinic. Reasons given by the 59% who did not attend were multiple follow-up with other specialities and lack of perceived benefit from attendance.
Critical Care 2011, Volume 15 Suppl 1 http://ccforum.com/supplements/15/S1
Conclusions All patients leaving our ICU received the required standards of assessment with regards to their rehabilitation needs. A more robust system is required to ensure referral to a psychologist when indicated, as anxiety and depression following ICU admission is reported in up to 40% of patients [1]. A patient leaflet explaining these risks and the benefits of attending ICU follow-up clinics may improve outcomes. References 1. 2.
Jones C, et al.: Crit Care Med 2001, 29:573-580. Brett S, et al.: Guideline 83. London: National Institute of Clinical Excellence; 2009. [http://guidance.nice.org.uk/GC83]
P533 Follow-up after critical care M Slattery, P Temblett, A Houghton, D Hope ABM University Trust, Swansea, UK Critical Care 2011, 15(Suppl 1):P533 (doi: 10.1186/cc9953) Introduction Many patients experience physical and psychological morbidity following a stay in critical care [1]. The National institute of Clinical Excellence (NICE UK) recommends access to follow-up and rehabilitation services for this patient group [2]. We aim to present 1 year’s experience following the establishment of a follow-up service at our university teaching hospital. Methods The multidisciplinary follow-up team consisted of a consultant in critical care, a senior nurse and a critical care physiotherapist. Patients completed a preclinic questionnaire followed by a semi-structured interview to identify potential issues. Twenty-four clinics took place over the 12-month period. Results A total of 221 patients were recruited. Of the patients studied 26% attended the clinic and completed the evaluation questionnaire, 30% did not engage follow up services. We identified recurrent themes in both physical and nonphysical problems. Example physical problems include limited physical activities in 77%, with 54% of patients studied finding difficulties with activities of daily living. Alteration in taste, smell, hearing and vision modalities was frequently described. In terms of psychological morbidity, anxiety and post-traumatic stress symptoms seem to predominate. Significant numbers of patients retain memory of their ITU stay, with one-third in the form of flashback memories. Only 5% of patients studied returned to work. Conclusions Our findings demonstrate that a wide variety of problems can be identified in an ICU follow-up clinic. The challenge now is to identify those groups of patients who will benefit most from follow-up, to develop effective rehabilitation programmes for these patients, and to find methods to increase patient participation. References 1.
2.
Cuthbertson HG, et al.: The PRaCTICaL study of nurse led, intensive care follow-up programmes for improving long term outcomes from critical illness: a pragmatic randomised controlled trial. BMJ 2009, 339:b3723. CG83 Rehabilitation after Critical Illness. London: National Institute for Clinical Excellence; 2009.
P534 Sunlight exposure does not influence ICU survival R Castro, S Hong, C Lee, L Weissfeld, G Clermont, D Angus, M Rosengart University of Pittsburgh Medical Center, Pittsburgh, PA, USA Critical Care 2011, 15(Suppl 1):P534 (doi: 10.1186/cc9954) Introduction The biological influence of light on human physiology (for example, circadian rhythms, cortisol and melatonin) has long been recognized. Recent interest has been directed to understanding the ramifications of light on immune function, particularly in the context of patient care. Although light and seasonal variations have been shown to modulate leucocyte count and lymphocytes B and T activity and proliferation in mammals, little is understood about these interactions in the course of illness. Thus, we hypothesized that sunlight is directly associated with improved outcome in critically ill patients. Methods We conducted a retrospective, cohort study of all patients admitted to the ICU at a single center between the years 2000 and 2004. Light exposure was assessed by theoretical insolation (kWh/
S188
m2/day), a measure of solar energy striking a unit of earth surface area that was obtained from the National Aeronautics and Space Administration. Daily and total insolation was determined for each patient, accounting for hospital geographic location, period and duration of hospitalization, and adjusted by day-specific admission/ discharge–sunrise/sunset times. To adjust for differences in case mix, we abstracted data regarding patient age, race, injury severity score, length of stay (LOS) and admission diagnostic categories. Patients who died before 24 hours were excluded from the analysis. The hypothesis was modeled using a multivariate logistic regression submodel for survival and a linear mixed submodel for the insolation measurement. Both were linked by the random intercept parameter in the mixed submodel. Results A total of 22,730 patients were available for study. The majority was male (52.7%) and Caucasian (80.0%) with a mean age of 59.4 ± 17.7 years. The leading ICU admission diagnoses were cardiovascular conditions (23.4%), trauma (13.4%) and sepsis (5.9%). The mean APACHE III score was 52.8 ± 28.3, LOS was 3.3 ± 2.3 days and mortality was 13.4%. The total insolation per patient was 14.8 ± 33.2 kWh/m2 (mean ± SD). After adjusting for differences in case mix, there was no significant association between survival and total insolation dose at 24 hours and up to the 10th day of ICU hospitalization (P = 0.64). A tendency towards lower mortality with higher insolation was observed for trauma patients (P = 0.15), although this did not attain statistical significance. Conclusions Sunlight has no impact on general ICU patient survival according to our analysis. In other relevant outcomes (mechanical ventilation requirements, sedation, delirium incidence, and so forth), the impact of sunlight still has to be elucidated. P535 Incidents related to intrahospital transport of patients in the ICU C Van Velzen, AH Brunsveld-Reinders, MS Arbous Leiden University Medical Center, Leiden, the Netherlands Critical Care 2011, 15(Suppl 1):P535 (doi: 10.1186/cc9955) Introduction The objective of this study was to determine the incidence and type of incidents related to intrahospital transport (IHT) of critically ill patients in our ICU and to identify contributing factors of these incidents. Methods Since 2006 an electronic incident registration system was implemented on our tertiary university mixed adult ICU. Two investigators identified incidents related to IHT between 2006 and 2009. IHT incidents were categorized according to phase of occurrence: before, during or after IHT. The physical derangement of the patients could be cardiovascular, respiratory, or neurologic. By means of a structured incident analysis method, potential causal and contributory factors were determined. Results In a 1-year period (2009) 568 transports were performed in 1,821 ICU patients. Thus about one-third of all ICU patients needed IHT. Of all incidents reported from 2006 to 2009, 2.1% was IHT related. IHT had an incident rate of 3.7%. Of all IHT incidents (n = 124), 35% occurred pre-transport, 50% during transport and 15% post-transport. Thirty-two patients (25.8%) had a physical derangement. The most involved organ system was the respiratory system (n = 20) followed by the cardiovascular system (n = 10) and neurological problems (n = 2). Indentified causes were technical (n = 39), organizational (n = 50) and human error (n = 86); more than one cause per case could be assigned. Technical causes occurred mostly during transport (n = 28) followed by pre-transport (n = 9) and after transport (n = 2). Contributing factors were mostly equipment related (n = 22). Human error was divided between during transport (n = 35) and pre-transport (n = 33) and fewer occurred after transport (n = 18). Contributing factors were coordination errors (n = 37) and external factors (n = 19). Organizational causes were mostly pre-transport (n = 26) and during transport (n = 20) and fewer after transport (n = 4). Almost all contributing factors were due to information transfer (n = 31). Overall, the most important contributing factors were coordination errors (n = 37), information transfer (n = 31), equipment failure (n = 22), and insufficient supervision (n = 22). Conclusions Incidents related to IHT have an incidence of 3.7%. Most incidents occurred pre-transport and during transport. The incidents
Critical Care 2011, Volume 15 Suppl 1 http://ccforum.com/supplements/15/S1
are predominantly on the respiratory and cardiovascular systems. Human failure is an important cause of IHT. Contributing factors were coordination errors, equipment failure, information transfer and insufficient supervision. Given the contributing factors we think the number of incidents could be reduced by means of a transportation checklist. P536 Systematic review of industry-led versus investigator-led randomized controlled trials K Kommaraju1, W Kwong2, J Marshall3, K Burns3 1 Virginia Commonwealth University, Richmond, VA, USA; 2University of Toronto, Canada; 3St Michael’s Hospital, Toronto, Canada Critical Care 2011, 15(Suppl 1):P536 (doi: 10.1186/cc9956) Introduction Funding sources may influence the focus and conduct of randomized controlled trials (RCTs). We undertook a systematic review to examine differences between industry-funded and non-industryfunded (including mixed funding) RCTs. Methods We searched MEDLINE for RCTs that enrolled at least 100 subjects and were published between 1990 and 2009 in five critical care journals (AJRCCM, CCM, ICM, Chest, Shock), two pediatric journals (Pediatric CCM and J Pediatrics), and five general medical journals (NEJM, Lancet, JAMA, BMJ, Ann Intern Med). We screened 1,094 abstracts to identify potentially eligible trials independently, and two investigators abstracted data independently and in duplicate. Statistical analysis was by the Mann–Whitney U test, t test or Fisher’s exact test; the α level for significance was set at P <0.05. Results We identified 313 RCTs for which the funding source could be ascertained; 83 (26.5%) were fully industry-funded, 78 (24.9%) had mixed funding, and 152 (48.6%) received no industry funding. RCTs fully funded by industry randomized more patients (median 385 vs. 255 patients, P = 0.0006), used more hospital sites (63.3 ± 92.9 vs. 10.3 ± 14.8, P <0.0001) and were more likely to originate from North America (51/83; 61.4% vs. 84/231; 36.4%, P <0.0001). Studies investigating drugs and devices accounted for over 90% of industry-funded RCTS. Non-industry-funded trials were more likely to investigate weaning/ ventilation and feeds/nutrition. A higher proportion of industryfunded RCTs recruited sepsis patients (35/83, 42.2% vs. 28/230, 12.1%, P <0.0001), whereas non-industry-funded RCTs were more likely to randomize neonatal or pediatric patients (22.2% vs. 10.8%, P = 0.02). The number of published critical care RCTs has increased over time, from 34 from 1990 through 1994 to 116 from 2005 through 2009. The proportion of fully industry-funded trials has been constant over time. Reporting of Data and Safety Monitoring Board involvement also increased over time for both industry-funded and non-industry-funded RCTs. Studies investigating drug interventions increased over time for industry-funded RCTs, but has remained relatively constant for nonindustry-funded trials. Conclusions The total number of critical care RCTs has increased over time; a minority of these is fully funded by industry. Industry-funded trials are larger, more frequently originate from North America, and more frequently target patients with sepsis. P537 Female authors in top-rank journals of different medical specialties K Amrein, C Putz-Bankuti, J Mader, A Amegah-Sakotnik, T Urbanic, D Wagner, E Prandl, N Sareban, S Amrein, A Langmann Medical University of Graz, Austria Critical Care 2011, 15(Suppl 1):P537 (doi: 10.1186/cc9957) Introduction In various scientific fields, including medical research, men have been found to have a higher scientific output than women. These differences may be due to women’s lower integration in the scientific community [1]. Even though the proportion of female authors has increased in the past decades, women still contribute less to prominent medical journals [2]. Methods Thirty-five top-10-ranked journals of eight different medical categories were analysed: Medicine, General & Internal (M,GI), Critical Care (CC), Anaesthesiology (A), Surgery (S), Emergency Medicine (EM),
S189
Table 1 (abstract P537). Percentage of female authors First authors
Senior authors
S
20.8
12.8
EM
22.1
15.3
CC
25.6
13.8
M,GI
30.3
19.8
R
35.1
17.1
H
35.7
17.2
N
38.6
17.1
A
38.7
23.6
Radiology (R), Haematology (H) and Clinical Neurology (N). Over a 12-month period, we evaluated the first and senior authors’ first name for gender. Results Thirty-one percent of evaluable first authors were female, compared with 18% of all senior authors. There were significant differences between the evaluated categories, with the lowest percentage of female first authors in the category Surgery, followed by Emergency Medicine (Table 1). In every category, the proportion of female senior authors was significantly lower than that of first authors. Conclusions There is a wide variation in the proportion of contributing female authors between the subspecialties analysed, probably reflecting the varying percentage of female scientists. However, in all evaluated medical categories, the proportion of papers authored by females was significantly lower than those authored by men. References 1. 2.
Puuska HM: Scientometrics 2010, 82:419-437. Jagsi R: N Engl J Med 2006, 355:281-287.
P538 National survey of protective eye care practices in the critically ill R Kam1, S Haldar2, E Papamichael3, K Pearce4, M Hayes5, N Joshi5 1 Imperial College London, UK; 2North West London Hospitals NHS Trust, London, UK; 3Watford Hospital, London, UK; 4University of Nottingham, UK; 5 Chelsea and Westminster Hospital, London, UK Critical Care 2011, 15(Suppl 1):P538 (doi: 10.1186/cc9958) Introduction Critically ill patients with inadequate lid closure are susceptible to developing exposure keratopathy. Protective measures can prevent this and reduce the risk of subsequent microbial keratitis and irreversible visual loss. Of two published surveys [1,2], one was carried out before there was any evidence-based research in this area and the other did not address which methods were in use in ICUs. This study aims to describe the current eye care methods used in ICUs in England, the perceived incidence of eye complications, their nature and the effectiveness of protocols in use. Methods A team of researchers telephoned all general ICUs and other specialty critical care units in England caring for sedated, ventilated patients and asked a supervising nurse questions from a questionnaire piloted earlier in London. Results Two hundred and seventeen out of 267 ICUs (81%) participated. One hundred and thirty out of 217 (60%) ICUs had an eye care protocol. Sixty-six per cent of units with protocols assessed lid closure compared with 65% of those without. Geliperm application was the most common protective therapy (106 units, 49%), followed by Lacrilube (76 units, 35%). Most ICUs used a combination of methods. The total estimated incidence of ocular complications in the last year was 502. The most recent complications witnessed included corneal ulceration (23 cases), microbial keratitis (11) and chemosis (23). Cases of severe visual loss were caused by anterior ischaemic optic neuropathy following prone positioning (two cases) and microbial keratitis in a patient’s only functioning eye. Conclusions There is a need for protocols that encourage proper eyelid position assessment, effective protection of the ocular surface and referral to ophthalmologists in the event of any complications or any loss of corneal clarity.
Critical Care 2011, Volume 15 Suppl 1 http://ccforum.com/supplements/15/S1
References 1. 2.
Farrell M, Wray F: Eye care for ventilated patients. Intensive Crit Care Nurs 1993, 9:137-141. King DJ, Healy M: Prevention of eye disease in intensive care – a telephone survey. Intensive Care Med 2003, 29:15S.
P539 Sleep disturbances in the ICU G Langevoort, J Hofhuis, J Rommes, P Spronk Gelre Hospitals, Apeldoorn, the Netherlands Critical Care 2011, 15(Suppl 1):P539 (doi: 10.1186/cc9959) Introduction Sleep disturbances are common in critically ill patients on the ICU, with possibly serious consequences [1]. More attention is needed for the sleep–wake cycle of ICU patients. The aim of this study was to gain insight into factors that are important for sleep of critically ill patients on the ICU. Methods We conducted a multicentre, exploratory survey sent to nurse managers of all adult ICUs in the Netherlands. We used a self-developed questionnaire to describe which factors are important for sleep of ICU patients. Surveys were distributed via mail with subsequent written reminders. Relevant factors in relation with sleep of ICU patients were included in the questionnaire. Results The survey response rate was 60% (68/114). Characteristics of the sleeping patient on the ICU most often included: lying quiet with closed eyes (89.7%), decreased pulse rate (88.2%) and slower respiration (83.8%). Nonpharmacological interventions to improve sleep of the ICU patients most often comprised: keeping patients awake during the day (94.2%), lights out in the ICU (92.6%), use of a clock (91.2%), reducing noise of the ICU staff (89.7%) and reducing nursing interventions (86.8%). The type of sleep medication was mostly determined only by physicians (57.4%). The assessment of the effects of the sleep medication was mostly determined by nurses and physicians together (58.8%). Most frequent medications used were midazolam (92.6%), propofol (85.3%) and temazepam (75.1%). Nursing autonomy regarding sleep and sedation practices of patients (rated on a 10-point numerical scale) was judged as poor (median 5, IQR 3 to 7). How much nursing observations influences sleeping practices in the ICU was judged as good (median 8, IQR 7 to 8). How the average patient was sleeping on the ICU was judged as moderate (median 6, IQR 5 to 7). Furthermore, 69.1% of the ICUs mentioned a disturbed sleep–wake cycle, judged predominantly due to too much noise (61.8%), delirium (55.9%), and nursing interventions (48.5%). Most ICUs (83.8%) did not have a sleeping protocol, but 67.6% of these ICUs preferred to implement such a protocol. Conclusions The average ICU patients are sleeping moderately well, mostly due to a disturbed sleep–wake cycle, delirium and nursing interventions. ICU nurses experience only a moderate feeling of autonomy and influence on sleeping practices. Most ICUs did not have a sleeping protocol, but more than one-half of these ICUs preferred to implement one. Reference 1.
Tamburri LM, et al.: Nocturnal care interactions with patients in critical care units. Am J Crit Care 2004, 13:102-112.
S190
P540 Inhaled colistin for the treatment of ventilator-associated tracheobronchitis in critically ill patients Z Athanassa1, P Myrianthefs1, E Boutzouka1, V Papaioannou2, S Tsiplakou2, A Tsakris3, G Baltopoulos1 1 ‘Agioi Anargyroi’ Hospital, Athens, Greece; 2‘KAT’ Hospital, Athens, Greece; 3 Medical School, University of Athens, Greece Critical Care 2011, 15(Suppl 1):P540 (doi: 10.1186/cc9987) Introduction Limited evidence exists regarding the efficacy of inhaled antibiotics in ventilator-associated tracheobronchitis (VAT) [1,2]. The aim of this study was to assess the effect of monotherapy with nebulized colistin on clinical and microbiological outcomes in critically ill patients with VAT due to polymyxin-only susceptible Gram-negative bacteria. Methods Patients were eligible for the study if they had clinical symptoms suggestive of VAT (for example, fever, purulent secretions), an absence of an evolving infiltrate on chest X-ray, and microbiological confirmation of VAT with quantitative cultures of endotracheal aspirates (ETAs) with a diagnostic threshold for VAT ≥105 colonyforming units (CFU)/ml. Susceptibility to colistin was determined using the Vitek technique (Biomerieux, France). Selected patients received inhaled colistin at a dose of 1 million units every 8 hours for 7 days via a vibrating-mesh nebulizer (Aeroneb Pro; Aerogen, Galway, Ireland). Assessed clinical outcomes were cure, defined as resolution of signs and symptoms at day 5, and development of ventilator-associated pneumonia (VAP) at day 10 after initiation of treatment. Microbiological outcomes were defined as eradication and decline termed as isolation of ≤102 CFU/ml and were assessed by ETA quantitative cultures received at days 3 and 5 after initiation of treatment. Results Our study included 12 patients (eight men and four women) with mean age 58.7 years. The mean values of APACHE II and SOFA scores were 15.5 and 6.8, respectively. Two patients had polymicrobial Gram-negative VAT. Isolated pathogens from ETAs were: Pseudomonas aeruginosa (8/12 patients), Acinetobacter baumannii (5/12 patients), and Klebsiella pneumoniae (1/12 patients). Cure was achieved in nine out of 12 patients. In the three patients with clinical failure, intravenous colistin was administered. Two of them were subsequently cured and one patient developed VAP. Microbiological eradication was achieved in five out of 12 patients while decline was achieved in three out of 12 patients. Conclusions According to our limited data, monotherapy with nebulized colistin might be effective in the treatment of patients with VAT. Further investigation is warranted to evaluate whether nebulized antibiotics could effectively treat VAT and reduce the need for systemic antibiotics. References 1. 2.
Palmer LB, et al. Crit Care Med 2008, 36:2008-2013. Craven DE, et al. Clin Infect Dis 2010, 51(Suppl 1):S59-S66. Cite abstracts in this supplement using the relevant abstract number, e.g.: Athanassa Z, et al.: Inhaled colistin for the treatment of ventilator-associated tracheobronchitis in critically ill patients [abstract]. Critical Care 2011, 15(Suppl 1):P540.