FIGURE E.3: Spot and futures daily coffee price variability (1 October 2019 – 30 September 2020)
Low price variability
Spot prices (227 reporting days)
Futures prices (221 reporting days)
150 days in green
138 days in green
Moderate price variability
32 days in yellow
31 days in yellow
Excessive price variability
45 days in red
52 days in red
NOTE: The spot price is the ICO Composite Indicator and the futures price is the New York Arabica price. Source: Excessive Food Price Variability Early Warning System. The ICO composite indicator is based on prices for prompt shipment, that is, shipment within 30 calendar days from the date of contract.
45
88
COFFEE DEVELOPMENT REPORT 2020
(a) ICO composite indicator
8 6 4 day-to-day % change
2 0 -2 -4 -6
Mar 2020
May 2020
Jul 2020
Sep 2020
Mar 2020
Jul 2020
Sep 2020
Jan 2020 Jan 2020
May 2020
Nov 2019 Nov 2019
Jun 2019
Sept 2019 Sept 2019
Apr 2019
Feb 2019
Oct 2018
Dec 2018
Jun 2018
Aug 2018
Apr 2018
Feb 2018
Oct 2017
Dec 2017
-8
(b) New York Arabica futures
8 6 4 2 0 -2 -4 -6
Jun 2019
Apr 2019
Feb 2019
Oct 2018
Dec 2018
Jun 2018
Aug 2018
Apr 2018
Feb 2018
Oct 2017
-8
Dec 2017
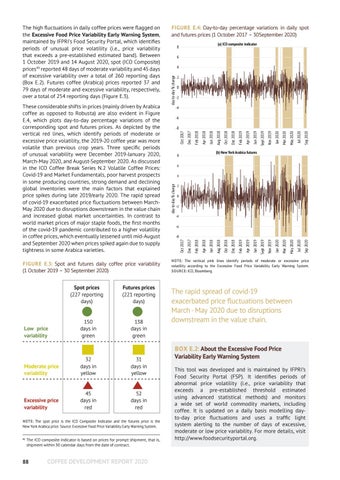
These considerable shifts in prices (mainly driven by Arabica coffee as opposed to Robusta) are also evident in Figure E.4, which plots day-to-day percentage variations of the corresponding spot and futures prices. As depicted by the vertical red lines, which identify periods of moderate or excessive price volatility, the 2019-20 coffee year was more volatile than previous crop years. Three specific periods of unusual variability were December 2019-January 2020, March-May 2020, and August-September 2020. As discussed in the ICO Coffee Break Series N.2 Volatile Coffee Prices: Covid-19 and Market Fundamentals, poor harvest prospects in some producing countries, strong demand and declining global inventories were the main factors that explained price spikes during late 2019/early 2020. The rapid spread of covid-19 exacerbated price fluctuations between MarchMay 2020 due to disruptions downstream in the value chain and increased global market uncertainties. In contrast to world market prices of major staple foods, the first months of the covid-19 pandemic contributed to a higher volatility in coffee prices, which eventually lessened until mid-August and September 2020 when prices spiked again due to supply tightness in some Arabica varieties.
FIGURE E.4: Day-to-day percentage variations in daily spot and futures prices (1 October 2017 – 30September 2020)
day-to-day % change
The high fluctuations in daily coffee prices were flagged on the Excessive Food Price Variability Early Warning System, maintained by IFPRI’s Food Security Portal, which identifies periods of unusual price volatility (i.e., price variability that exceeds a pre-established estimated band). Between 1 October 2019 and 14 August 2020, spot (ICO Composite) prices45 reported 48 days of moderate variability and 45 days of excessive variability over a total of 260 reporting days (Box E.2). Futures coffee (Arabica) prices reported 37 and 79 days of moderate and excessive variability, respectively, over a total of 254 reporting days (Figure E.3).
NOTE: The vertical pink lines identify periods of moderate or excessive price volatility according to the Excessive Food Price Variability Early Warning System. SOURCE: ICO, Bloomberg.
The rapid spread of covid-19 exacerbated price fluctuations between March - May 2020 due to disruptions downstream in the value chain.
BOX E.2: About the Excessive Food Price Variability Early Warning System This tool was developed and is maintained by IFPRI’s Food Security Portal (FSP). It identifies periods of abnormal price volatility (i.e., price variability that exceeds a pre-established threshold estimated using advanced statistical methods) and monitors a wide set of world commodity markets, including coffee. It is updated on a daily basis modelling dayto-day price fluctuations and uses a traffic light system alerting to the number of days of excessive, moderate or low price variability. For more details, visit http://www.foodsecurityportal.org.
