FIGURE O.2: Coffee prices remain below the 10-year average 250
150
Oct-20
Oct-19
Oct-18
Oct-17
Oct-16
Oct-15
Oct-14
Oct-11
Oct-10
50
Oct-13
100
-14%
10-yr average
Oct-12
US Cents/lb
200
SOURCE: ICO
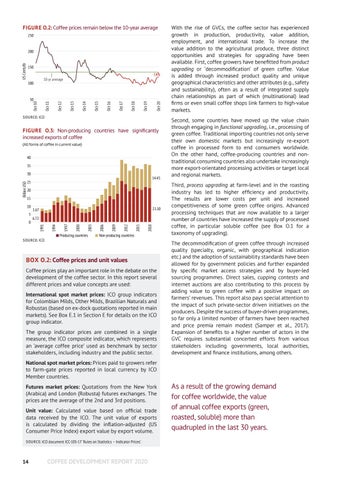
FIGURE O.3: Non-producing countries have significantly increased exports of coffee (All forms of coffee in current value)
40 35 14.45
25 20 15
SOURCE: ICO
Producing countries
2018
2015
2012
2009
2006
2003
6.72 2000
0
21.10
1.67
1997
5
1994
10
1991
Billion USD
30
Non-producing countries
BOX O.2: Coffee prices and unit values Coffee prices play an important role in the debate on the development of the coffee sector. In this report several different prices and value concepts are used: International spot market prices: ICO group indicators for Colombian Milds, Other Milds, Brazilian Naturals and Robustas (based on ex-dock quotations reported in main markets). See Box E.1 in Section E for details on the ICO group indicator. The group indicator prices are combined in a single measure, the ICO composite indicator, which represents an ‘average coffee price’ used as benchmark by sector stakeholders, including industry and the public sector.
With the rise of GVCs, the coffee sector has experienced growth in production, productivity, value addition, employment, and international trade. To increase the value addition to the agricultural produce, three distinct opportunities and strategies for upgrading have been available. First, coffee growers have benefitted from product upgrading or ‘decommodification’ of green coffee. Value is added through increased product quality and unique geographical characteristics and other attributes (e.g., safety and sustainability), often as a result of integrated supply chain relationships as part of which (multinational) lead firms or even small coffee shops link farmers to high-value markets. Second, some countries have moved up the value chain through engaging in functional upgrading, i.e., processing of green coffee. Traditional importing countries not only serve their own domestic markets but increasingly re-export coffee in processed form to end consumers worldwide. On the other hand, coffee-producing countries and nontraditional consuming countries also undertake increasingly more export-orientated processing activities or target local and regional markets. Third, process upgrading at farm-level and in the roasting industry has led to higher efficiency and productivity. The results are lower costs per unit and increased competitiveness of some green coffee origins. Advanced processing techniques that are now available to a larger number of countries have increased the supply of processed coffee, in particular soluble coffee (see Box O.1 for a taxonomy of upgrading). The decommodification of green coffee through increased quality (specialty, organic, with geographical indication etc.) and the adoption of sustainability standards have been allowed for by government policies and further expanded by specific market access strategies and by buyer-led sourcing programmes. Direct sales, cupping contests and internet auctions are also contributing to this process by adding value to green coffee with a positive impact on farmers’ revenues. This report also pays special attention to the impact of such private-sector driven initiatives on the producers. Despite the success of buyer-driven programmes, so far only a limited number of farmers have been reached and price premia remain modest (Samper et al., 2017). Expansion of benefits to a higher number of actors in the GVC requires substantial concerted efforts from various stakeholders including governments, local authorities, development and finance institutions, among others.
National spot market prices: Prices paid to growers refer to farm-gate prices reported in local currency by ICO Member countries. Futures market prices: Quotations from the New York (Arabica) and London (Robusta) futures exchanges. The prices are the average of the 2nd and 3rd positions. Unit value: Calculated value based on official trade data received by the ICO. The unit value of exports is calculated by dividing the inflation-adjusted (US Consumer Price Index) export value by export volume. SOURCE: ICO document ICC-105-17 ‘Rules on Statistics – Indicator Prices’.
14
COFFEE DEVELOPMENT REPORT 2020
As a result of the growing demand for coffee worldwide, the value of annual coffee exports (green, roasted, soluble) more than quadrupled in the last 30 years.