22 minute read
ConsultationandCitizenParticipation


The Cities of Eugene and Springfield conducted extensive consultation with key partners, stakeholders and community members in identifying Housing and Community Development needs from November 2019 through January 2020. The consultation process built on work that has been ongoing by committees and boards that bring together a broad range of stakeholders. In addition to consultations with stakeholders, the needs identified reflect information gathered through web-based surveys for both service agencies and community residents, public forums to hear community members, and input from the Consolidated Plan Advisory Committee.
Individuals representing government and policy makers, nonprofit organizations, affordable housing providers, and other interested parties were invited to participate to ensure that as many points of view as possible were heard. Over the course of one-on-one interviews and twelve small focus group meetings, approximately 133 public participants and 21 city staff provided their feedback in person.
Advisory Body Consultations
The assessment engaged several committees that are actively evaluating and addressing housing, homeless, fair housing, and community development needs including:
Lane County Poverty & Homelessness Board
Intergovernmental Human Services Commission
Intergovernmental Housing Policy Board
United Way of Lane County Community Investment Steering Committee
Eugene Affordable Housing Trust Fund Advisory Committee
Eugene Planning Commission
Agency Survey
In addition to these meetings, online surveys were completed by 68 representatives from 38 agencies. The responders noted that the greatest barrier to finding and maintaining housing in the cities was rental costs and finding vacant units, and that creating additional affordable housing is the greatest housing need. The responders also identified needs for housing rehabilitation and emergency repairs, as well as accessibility improvements and down payment assistance. Preventing homelessness and providing housing for homeless individuals was also identified as a high priority, and the homeless population was identified as the population most in need of housing assistance and services. Survey responses were received from the following agencies:
Applegate
Catholic Community Services of Lane County
Centro Latino Americano
Cornerstone Community Housing
Department of Human Services
DevNW
Ebbert Memorial United Methodist Church
Emerald Village Eugene
First Place Family Center
FOOD for Lane County
Head Start of Lane County
Here to Help Housing
HIV Alliance
Home for Good Housing Agency
Hosea Youth Services
Jennings Group Inc
Lane Council of Governments
Lane County Health and Human Services
Lane Independent Living Alliance (LILA)
Looking Glass Community Services
Options Counseling and Family Services
Oregon Law Center
Relief Nursery, Inc.
ShelterCare
Sponsors, Inc.
Springfield Eugene Tenant Association
SquareOne Villages
St. Vincent de Paul Society of Lane County
Supportive Services for Veteran Families
White Bird Clinic
Womenspace, Inc.
InformationfromthePublic
Written Comments
Written public comments were accepted during the 30-day public comment period and were incorporated into the Consolidated Plan.
Community Survey
A survey was developed to collect input from community members to identify priority needs and collect information on conditions in the community. The survey was distributed on the internet and through social media in both English and Spanish. Partner agencies also helped by distributing the survey to their clients, where appropriate. A total of 216 responses were received. Responders to the Community Survey identified the most needed services for both renters and owners. For renters, responders identified top needs as ongoing rental assistance, security Deposit assistance, and emergency rental assistance. For owners, responders identified mortgage assistance, foreclosure prevention, and utility/energy payment support as the highest needs. Responders identified mental health and addiction services and housing services as the greatest social service needs. Respondents also identified assist human service agencies with facilities acquisition or improvements as the most needed Community Development Need.
Open House
The Cities of Eugene and Springfield hosted an Open House on Affordable Housing and Community Development, on February 12, 2020. Community members had the opportunity to learn about and provide feedback on the draft priority needs and draft strategies for the 2020 Consolidated Plan. The event was attended by over 130 community members, who were also asked to rank the proposed strategies and to provide comments.
Resident Participation Plan
A requirement of the Consolidated Plan is to develop and utilize a strategy to achieve resident public participation. This plan was updated in 2020 and is summarized here.
The Cities will continue to encourage participation by low- and moderate-income persons throughout the community. Emphasis will be placed on reaching out to minority populations, nonEnglish-speaking persons, and persons with disabilities, in the preparation of the Plan. The Cities will also notify and seek the participation of local and regional institutions and other organizations, including businesses, developers, community and faith-based organizations, in the development and implementation of the Consolidated Plan.

The Cities will make vital information that pertains to the Consolidated Plan available to the resident, public agencies and other interested parties on an annual basis. The information to be made available includes the amount of assistance the Cities expect to receive, available unspent prior year’s funds and related program income, the range of activities to be undertaken, including the estimated amount of CDBG and other funds that will be expended on low- and moderateincome persons.
The Cities will provide interested parties with a reasonable opportunity to comment on the Plan or on any amendments to the Plan. The Cities will consider any comments or views of interested parties received in writing or orally, at any of the public hearings, or during the specified public comment review period.
Meetings are announced through posting on City websites and in the Register Guard. All public hearings are advertised in the Register-Guard Newspaper 14 days or more prior to the hearing.
For the development of the Consolidated Plan, one public hearing in addition to multiple public meetings to obtain resident views regarding the proposed priority needs and strategies for the five-year period.
Public meetings are held at times convenient to potential and actual beneficiaries in locations that meet Americans with Disabilities Act accessibility standards. With 48 hours’ notice prior to any public meeting, the Cities can provide the following services: an interpreter and audio equipment for the hearing impaired; a reader to review printed materials with the sight impaired, and a foreign language interpreter for non-English speaking residents.
Due to public health concerns related to the COVID-19 pandemic, the final meetings and public hearings had to be held in an online format. Efforts were made to provide call-in options to facilitate access for individuals with limited technology access.
CommunityProfileandNeeds
The Eugene-Springfield Consolidated Plan relies upon multiple forms of qualitative and quantitative data as well as community input in order to identify housing, homelessness, and community development needs and trends. This picture of need is the basis of the proposed objectives and outcomes for the 2020 Consolidated Plan. In addition to the US Census, updated American Community Survey (ACS) data and community surveys that provides the foundation for development of the document, the Cities of Eugene and Springfield built on the work of several active committees and recent studies that addressed housing, homeless and community development. The assessment was also informed by additional consultations with city officials and other important stakeholders such as the Intergovernmental Human Services Commission, United Way of Lane County, Lane County Poverty & Homelessness Board, Homes for Good (PHA), and the Intergovernmental Housing Policy Board.
In 2020, the regional economy has continued to diversify and improve, while at the same time leaving many in the community still struggling to find jobs with wages to cover increasing housing costs. There is a significant number of households who cannot meet the basic needs for food, shelter, medical care and transportation. In addition, there are a growing number of seniors, persons with disabilities, and others who are unable to work. These factors, combined with a very tight housing market, have resulted in many households paying more than they can afford, and a growing number of persons experiencing homelessness. It is important to note that the impacts of the COVID-19 are too recent to be reflected in the data used for the analysis provided below.
Population Growth
The overall population has grown steadily in both cities since 2000, reaching a combined 223,958 in 2017. Population grew to 163,135 in Eugene (18% growth since 2000) and 60,823 in Springfield (15% growth) in 2017.
Age Distribution
The population of Eugene and Springfield is aging. In 2000, people aged 60 to 75 accounted for 8% of the total population. This grew to 14% in 2017. For the same period, people under 45 accounted for 67% of the population in 2000, and this has dropped to 63% in 2017.
Racial and Ethnic Composition
Eugene and Springfield are becoming increasingly racially and ethnically diverse. Latino residents are the fastest growing population, representing 10.2% of the population in the two cities, and this population has grown 26.4% between 2000 and 2017. Approximately 21% of the population of the cities are either Latino or minority race.
Household Composition
As of 2017, family households still make up the largest percentage of households with 54% (Eugene – 52%, Springfield – 59%), and of those, 10% of households is single female headed households. There has also been a significant increase in single person households which now make up 45% of all households. The largest growth in household type is non-family households which increased 57% between 2000 and 2017. Average household size 2.33 in Eugene and 2.50 in Springfield.
Income and Poverty
Although growing, Median Household Income for both Eugene ($47,489) and Springfield ($41,700) is lower than the US ($57,652) and Lane County ($47,710). Further, there are many residents in both cities that are struggling, as evidenced by other indicators: 19% of Eugene residents and 28% of Springfield residents receive food stamp benefits (SNAP), and 49% of students from the three Public School Districts in Eugene and Springfield are eligible for free and reduced lunch. Low wages also contribute to financial instability. In 2017, 21% of households in Eugene and 20% of households in Springfield had incomes below the poverty level.
Persons with Disabilities
In the Cities of Eugene and Springfield, about 32,438 people, or 14%, live with one or more disabilities. The highest reported disabilities include ambulatory (8%), cognitive (8%), and difficulty with independent living (7%).
Persons Experiencing Homelessness
The 2019 Point-in-Time Count (PIT) identified 2,165 people in Lane County experiencing homelessness, a 32% increase from 2018 and 49% increase from 2016. Over two-thirds of this population, or 1633 individuals, met HUD’s definition of unsheltered, which includes 411 persons staying in “alternative to shelter” programs such as Dusk to Dawn, Opportunity Village, and Conestoga Huts. The 2019 PIT count also found that 759 persons experiencing homelessness were seriously mentally ill, 724 were chronically homeless, 525 reported substance abuse, 173 were veterans, and 113 were families with children staying in a shelter. For FY 2018, Lane County reported that 2,753 unduplicated individuals who were homeless received human services from one or more agencies. During the 2018-2019 school year, the three public school districts in Eugene and Springfield report 1,629 homeless youth, includes students who are staying with friends or family. The reported number includes 482 homeless youth who were unaccompanied.
Persons with Special Needs who are not Homeless
Limited new data exists specific to non-homeless special needs populations in the cities of Eugene and Springfield. There are numerous sub-populations in this community. Of those, there are some that have both sufficient numbers and unique housing and service needs that warrant identification. Those include the following: families with children, seniors, ex-offenders, people with HIV/AIDS, victims of domestic violence, people with drug and alcohol addictions, people who are evicted or foreclosed, people with physical and mental disabilities, veterans, youth and young adults, and youth aging out of foster care.
Employment and Economy
Economic conditions in Eugene and Springfield have recovered significantly in the past decade, and the region has emerged as a more diversified economy than it was during the Great Recession. The number of jobs has grown steadily during the decade, and unemployment rates have remained relatively low during recent years (below 6%). Wages have risen as well, although the loss of manufacturing jobs still has tempered wage growth in the region.
In 2018, unemployment was 4.50%. Employment growth combined with retirements and declining unemployment rates is creating a strengthening economy. As the economy continues to improve, the labor market tightens, availability of skilled workers may create a challenge for employers. Unemployment in the region has been decreasing but opportunities are limited for young unskilled workers. The new workforce of youth 16-24 years old accounts for 38% of the workforce. Getting younger workers to work in skilled career opportunities will allow the younger workforce to establish the experience and income that first jobs provide, a key workforce challenge facing both cities. The workforce problems facing younger workers today may follow them well into the future through lower lifetime earnings.
While there have been recent and significant job losses as a result of COVID-19, it is unclear how sustained these job losses will be as social distancing measures diminish. It is apparent however that many people with limited incomes are experiencing financial instability as a result of recent events.
Housing Units and Tenure
Together, Eugene and Springfield contain 97,224 housing units. The majority (61%) of the housing stock is single-family units, with the remainder consisting of multi-family units (33%) and a small share of mobile/manufactured homes (6%). This balance has remained relatively stable since 1990, although planners in both cities anticipate a gradual increase in multi-family housing to accommodate future population needs. For rental households, 41% in Eugene and Springfield live in 2-bedroom homes. Increasingly, homes with three-bedrooms are being occupied by renters, climbing to 30% in 2017 from 25% in 2010. Renter households occupying studios and onebedroom homes has stayed relatively stable since 2010, edging up from 29% to 30%.
Eugene has recently shifted to a majority renter city, where 52% of households rented their home in 2017. Springfield retains a slight majority of owner-occupied homes, where 51% of households own and 49% rent.
Manufactured dwelling parks are areas where people rent or lease a space for their manufactured home, which they may rent or own. A manufactured dwelling is a more affordable way for many people to own a home or live independently in an environment for older individuals. About 5% of the housing units in Eugene and Springfield are manufactured home park spaces, with nearly 40% of the homes in three census tracts. These tracts are located in west Eugene, Glenwood, and midSpringfield.
Assisted and Public Housing
A variety of assisted housing developments are currently available and serving low-income persons in the cities of Eugene and Springfield. There are at total of 4,452 assisted housing units in 113 developments in both cities, including projects subsidized with Section 8, Low-Income Housing Tax Credits, or other project-based subsidies. Eugene and its urban growth boundary have a total of 3,516 units in 83 developments and Springfield and its urban growth boundary have 866 units in 28 developments.
Homes for Good serves as the housing authority for the cities of Eugene and Springfield. There are a total of 595 public housing units in Lane County with 383 of those in Eugene and Springfield, and as of February 2020, 98.9% were leased. Additionally, Homes for Good has 3,065 total vouchers (3,056 in use), of which 236 are designated as Veterans Affairs Supportive Housing (192 in use). For all voucher programs, 6% are held by households with one or more persons who identify as a minority race or ethnicity.
Homes for Good maintains a waiting list for all their public housing units. There are approximately 1800 households on public housing waiting lists with typical wait times between 1 and 5 years. The Section 8 waiting list was last opened in 2019 and 4,887 people responded to the online application. At this point in time, 74% of families issued vouchers are able to lease a unit.
Housing Cost Burden
While wages and incomes have continued to rise in recent years, they have not kept pace with the cost of both owner and rental housing in both cities. From 2010 to 2017, Median Household Income rose 14% in Eugene and by 15% in Springfield.
Housing costs in the Eugene-Springfield area have risen more sharply since 2010, especially in recent years. Median home prices have increased by about 130% between 2000 and 2019 in both Eugene and Springfield, reaching $320,000 in Eugene and $270,100 in Springfield (Zillow October 2019). Median Rental Rates have also increased substantially faster than incomes, if not as dramatically as home values. Between 2010 and 2019, the median rental rate rose to $1,373 in Eugene (47% increase) and $1,181 in Springfield (58% increase).
As a result, many households pay more for housing than is affordable, or are unable to afford any housing. Households paying more than 30% of household income are considered to have a ‘housing cost burden’. A majority of all renters in Eugene (55%) and slightly under half of all renters in Springfield (48%) are considered housing cost burdened, while a smaller but significant share of all homeowners in each jurisdiction are also cost burdened (Eugene – 27%, Springfield – 29%).
Housing Conditions and Lead Based Paint
In the cities of Eugene and Springfield, approximately 60% (55,005) of the total housing units were built prior to 1980 and may contain lead-based paint. Approximately 11,437 homes pose potential lead-based paint hazards in the cities of Eugene and Springfield.
Despite the age of the housing stock, the physical condition of the housing in Eugene and Springfield is generally good, as there are relatively few housing units (1,875) in the area that are considered substandard according to HUD. Of those, 90% are rental units, and 59% are occupied by people making 50% or less of the average median income. Based on input received during provider and public consultations, units available to low-income residents tend to have more significant issues, and because of the scarcity of affordable low-income housing, residents are reluctant to raise their concerns for fear of losing the housing.
Priority Needs
The purpose of identifying the community needs and trends, conducting surveys and meeting with providers is to identify what the priority needs are for the low-and moderate-income households in this community for the next five years. Listed below are the needs that were identified through the analysis that have been identified as priority needs to address using HUD funds.
Renters
Rising rents has created a substantial gap in decent quality housing affordable to very low-, lowand moderate-income households in both cities. There are 21,535 such households earning less than 80% of AMI in Eugene, and 7,270 such households in Springfield, which make up 63% of all renters.
• Renter households earning less than 80% of area median income (very-low, low- and moderate- incomes): Over three quarters of these households spend more than 30% of their income on housing costs (79% in Eugene, 74% in Springfield). Moreover, 54% of these households in Eugene and 35% of these households in Springfield spend 50% of their income on housing costs.
• Renter households earning less than 50% of area median income (very-low and lowincome): A modestly greater share of these households also spend more than 30% of their income on housing costs. However, the significantly more of these households pay more than 50% of their income on housing costs (Eugene – 68%, Springfield – 57%).
• By April 2020, a growing number of residents have experienced a severe loss of income due to the COVID-19 pandemic, raising the risk of housing instability and homelessness, and potentially destabilizing existing affordable housing developments due to interruptions in rental income.
Homeowners
Rising home values have also reduced the availability of quality housing affordable to low-and moderate- income households. There are 7,390 owner households (23% of all owners) earning less than 80% of AMI in Eugene, and 4,470 owner households (37% of all owners) in Springfield, substantially fewer than the number of renters in this income bracket. Low, very low- and even moderate-income homeowner households need increased access to affordable homeownership opportunities and support to remain homeowners. The high costs also reduce opportunities for potential homebuyers.
• A significant majority of low-income owners experience a housing cost burden, overcrowding, and/or substandard housing conditions (Eugene – 78%, Springfield – 59%).
• Owner households earning less than 80% of area median income (very-low, low- and moderate- incomes): A significant majority of these homeowners spend more than 30% of their income on housing costs (Eugene – 66%, Springfield – 57%). Moreover, 41% of these households in Eugene and 28% of these households in Springfield spend 50% of their income on housing costs.
• Owner households earning less than 50% of area median income (very-low and lowincome): There are 3,370 owner occupied households in Eugene, and 2,030 in Springfield earning less than 50% AMI. Over three quarters (77%) of these households in Eugene and over half (56%) of households in Springfield spend more than 30% of their income on housing costs. 59% of these owner households in Eugene and 39% in Springfield spend more than 50% of their income on housing costs.
People Experiencing Homelessness
People need access to housing and supportive services to prevent them from becoming homeless and to leave homelessness.
• The 2019 Point in Time Count identified 2,165 people experiencing homelessness.
• Of those, 1,633 were unsheltered, 84 were families with children staying in a shelter, 841 were chronically homeless, 197 were veterans, 525 reported substance abuse and 759 were seriously mentally ill.
• The 2019 PIT Count identified 145 unaccompanied youth, with 21 in Emergency Shelter (6 youth under age 18), 16 in Transitional Housing (6 youth under age 18), and 108 unsheltered (14 youth under age 18). A total of 26 unaccompanied homeless youth were under age 18, 119 were ages 18-24.
• Lane County reports 26 agencies with 170 projects in WellSky, a management information system used to share information among service providers on services provided to at-risk, homeless, or near homeless clients.
• Lane County reported that 2,753 unduplicated individuals who were homeless received human services from one or more agencies in fiscal year 2018.
• The three public school districts in Eugene and Springfield report 1,629 homeless youth during 2019, and this definition includes students who are staying with friends or family. The definition of homeless for purposes of the Plan includes people who are “doubled-up”.
Non-Homeless Special Needs Populations
People with special needs need additional support for housing and supportive services. This includes families with children, seniors, ex-offenders, people with HIV/AIDS, victims of domestic violence, people with drug and alcohol addictions, people who are evicted or foreclosed, people with physical and mental disabilities, veterans, youth and young adults, and youth aging out of foster care.
• Special needs populations need additional support as it relates to affordable housing, human services, employment opportunities, and accessibility improvements in housing and public facilities.
• In both cities, 49% of students in the three public districts are eligible for free or reduced lunch.
• One in seven Oregonians and one in five children in Oregon are food insecure.
• Free local bus passes, gasoline, care repair, driver’s license, ID card or birth certificate fee were all identified as difficult to access based upon feedback provided by the constituency surveyed.
• There is one domestic violence provider in Eugene. Records indicated there are minimal domestic violence and sexual assault providers, with limited shelter space and housing assets dedicated to survivors and those fleeing domestic violence.
• In the Community Survey, respondents identified mental health and addiction services and housing services as the greatest social services needs. Respondents also identified Assist human service agencies with facilities acquisition or improvements as the most needed Community Development Need.
Employment Opportunities
People who have low incomes, are unemployed or underemployed need a broader range of employment opportunities, including self-employment
• After Lane County lost 18,000 jobs between 2007 and 2010, employment has continued to grow [back to pre-recession levels], currently peaking at 95% as of 2017. As unemployment rates have declined in recent years, so too has job growth since 2016.
• Workers in the Eugene Metropolitan Statistical Area had an average (mean) hourly wage of $22.75 in May 2018, about 9 percent below the nationwide average of $24.98.
• Not all sectors have returned to pre-recession levels, including financial activities, construction, manufacturing, and information.
• In 2019, the top three reasons employers found it difficult to fill vacancies were: (1) lack of applicants, (2) unfavorable working conditions, and (3) lack of qualified candidates (Hiring Challenges for unfulfilled job vacancies, May 2019).
• The loss of jobs combined with the subsequent recession, have widened the page between employed wages and housing gaps.
• Community Survey responders identified creating jobs in low-income neighborhoods as the greatest economic development need.
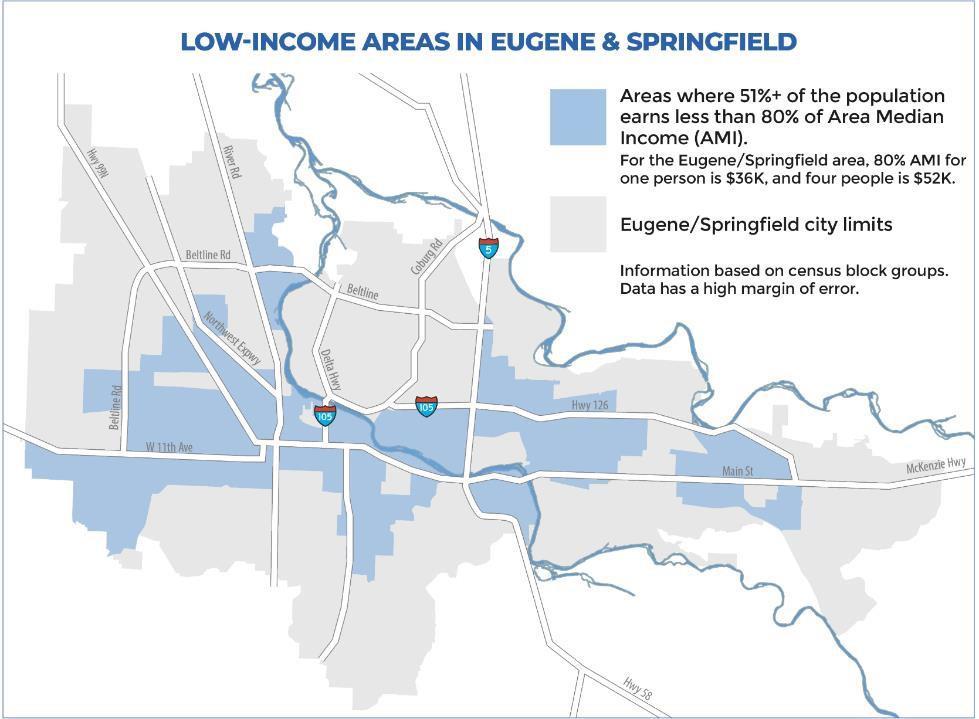
Low-Income Areas and Areas of Slums and Blight
Geographic areas defined as areas of slums or blight or as low-income areas need additional support for rehabilitation and public facility and infrastructure improvements.
• There are several areas in this community that are or could meet the HUD requirement for an area of slums and blight which would allow different uses of CDBG funds. These areas could benefit from increased investments in the area. There are also specific properties with deteriorated conditions that could addressed using CDBG funds.
• There are several areas of this community that are characterized by 51% or more low- to moderate-income residents, which can benefit from increased investments in this area.
StrategicPlan
As part of the consolidated planning process, priority needs were identified based on the needs assessment, market analysis, stakeholder consultation, and input from residents. Next, strategies and goals were developed to address these priority needs with the cities’ anticipated CDBG and HOME grants, which will help leverage additional public and private resources.
Below is a summary of the strategies that have been identified that both meet priority needs and are also eligible uses of HUD funds. A table following this section shows the relationship between identified strategies and the priority needs of Eugene and Springfield for use of federal funds received from HUD. During the public comment period in March 2020, nonprofit partners and stakeholders reported concerns about residents already experiencing sudden and significant losses of income due to the COVID-19 pandemic. Beyond the real threats among residents of housing instability and homelessness, affordable housing agencies reported concerns about the destabilization of existing affordable housing developments due to interruptions in rental income. As a result of these comments, a fifth housing strategy Provide Rent Assistance was added to provide an option to address housing instability among renters and preserve existing affordable rental housing.
Priority Needs
Priority Need Explanation
Renters
Low- and very low-income people need increased access to quality affordable rental housing as well as rental assistance
• About three quarters of moderate- and lowincome renters spend more than 30% of their income on housing costs (Eugene – 79%, Springfield – 74%)
• The majority of low-income renters spend more than 50% of their income on housing costs (Eugene – 68%, Springfield – 57%)
Comments
• Between 2010 and 2019, the median rental rate rose to $1,373 in Eugene (47% increase) and $1,181 in Springfield (58% increase)
• Significant increase in need from 2013 to 2017;
• Many more moderate-income households spend more than 30% on housing
• Many more low- and very income households spend more than 50% on housing
Homeowners
Low- and very low-income people need increased access to affordable homeownership opportunities and support to remain homeowners
• A significant majority of low-income owners experience over-crowding, substandard housing, or a housing cost burden (Eugene –78%, Springfield – 59%)
• A significant majority of moderate- and lowincome owners spend more than 30% of their income on housing costs (Eugene – 66%, Springfield – 57%)
• A large percentage of low-income owners spend more than 50% of their income on housing costs (Eugene – 59%, Springfield –39%)
• Low-income households spending more than 30% of income housing have increased in Eugene but remains steady in Springfield
• Low-income households spending more than 50% of income housing have increased in both Eugene and Springfield
Priority Need
People experiencing Homelessness
People need access to housing and supportive services to prevent them from becoming homeless and to leave homelessness
Explanation
• A total of 2,165 homeless individuals were served in FY 2019 by agencies funded by Lane County
• The three public school districts in Eugene and Springfield report 1,629 homeless youth during 2019 (includes students who are staying with friends orfamily)
• The definition of homeless for purposes of this Plan includes people who are“doubled-up”
• Shortage of year-round low-barrier emergency shelter beds, especially for single individuals and victims of Domestic Violence
• Lack of diversion and rapid exit services for those exiting Permanent Housing
Comments
• Majority of the homeless population in Eugene (73%) and Springfield (88%) are experiencing unsheltered homelessness
• Shortage of low-barrier year-round emergency shelter and shelter beds in Eugene and Springfield
• In 2017, one in four persons exiting permanent housing in Lane County returned to homelessness
• There are no youth-specific resources for transition-age youth (18-24)
• Due to low rental vacancy (3.6% in Eugene and 3.4% in Springfield) and even lower affordable unit rental vacancy, the Lane County Continuum of Care struggles with voucher or tenantbased programs
Non-Homeless Special Needs Populations
Special needs populations need additional support as it relates to affordable housing, human services, and employment opportunities
• People with special needs including families with children, seniors, ex-offenders, people with HIV/AIDS, victims of domestic violence, people with drug and alcohol addictions, people who are evicted or foreclosed, people with physical and mental disabilities, veterans, youth, and youth aging out of foster care
• There were 32,438 elderly (over the age of 65) and 3,310 frail elderly (that need assistance with daily living) in EugeneSpringfield (2017 ACS)
• The disability rate is 13.5 percent in Eugene and 18.6 percent in Springfield
• Physical disabilities can include hearing, vision, cognitive, ambulatory, self-care or independent living difficulties
• In the Community Survey, respondents identified mental health and addiction services and housing services as the greatest social service needs. Respondents also identified assist human service agencies with facilities acquisition or improvements as the most needed Community Development Need
Employment Opportunities
People who have low incomes, are unemployed or underemployed need a broader range of employment opportunities, including selfemployment
• Job growth and low unemployment rates has not yielded better wages for many younger residents and workers lacking necessary skills
• The new workforce of youth 16-24 years old accounts for 38% of the workforce
• Current low unemployment rates and retirements in workforce has created demand for skilled workers in some industries
• The United Way ALICE report found that 58% of all jobs in Oregon are low-wage (less than $20/hour), with contract positions (nonbenefited) increasing, a factor in job and housing insecurity
• There is a need to increase high-wage and living wage career employment opportunities for youth
• Lower wages are exacerbating housing affordability for some workers
Low-Income Areas & Areas of Slums and Blight
Geographic areas that meet federal criteria as areas of slums and blight or as lowincome areas and need additional support for rehabilitation and public improvements
• There are several areas in this community that are or could meet the HUD requirement for an area of slums and blight which would allow different uses of CDBG funds. These areas could benefit from increased investments in the area
• There are several areas of this community that are characterized by 51% or more low- to moderate-income residents, which can benefit from increased investments in this area
• Need to support low- and moderate- income neighborhoods through public improvements such as infrastructure and public facilities
• Low-Income Areas have been mapped for both jurisdictions
• Support currently designated slum/blight areas
Affordable Housing Strategy
Rehabilitate existing housing stock affordable to lowincome persons (CDBG)
Provide down payment assistance for homeownership (CDBG)
Provide rental assistance for housing stability and homelessness prevention (HOME)
Renters, Homeowners, Homeless, LowIncome Area Non-Homeless Special Needs Maintain Housing Policy board ✓ Number of fair housing events 20 Maintain fair housing services ✓ ✓ Update Fair Housing Plan ✓ ✓
Support programs that assure housing opportunities are provided without discrimination. Support Housing Policy Board. Update Fair Housing Plan
Community Development Strategy
Support a human services delivery system to address the needs of homeless persons, special needs, and other low-income populations (CDBG)
Promote economic development and employment opportunities through the creation of jobs and business development (CDBG)
Make strategic investments to improve low- income neighborhoods and other areas of slums and blight (CDBG)
Homeless, Special Needs Fund capital improvements to facilities owned by non-profits.
Fund non-profit services through the Human
Provide below market financing to local businesses creating or retaining jobs. Provide micro-enterprise training, and development opportunities.
Renters, Owners, Homeless, Special Needs, Low-Income Areas and Slums & Blight, Employment Opportunities
Provide financing for activities which eliminate slums and blight, including acquisition, clearance, rehab and historic preservation and economic development activities, infrastructure and public facility improvements.


