
DDL - Shaping the future of nasal and pulmonary Drug Delivery 8th, 9th & 10th December 2021 Proceedings The Aerosol Society DRUG DELIVERY TO THE LUNGS 32, 2021 www.ddl-conference.com VIRT UAL CONFERENCE
Drug Delivery to the Lungs 2021
DDL Annual Lecture p3
Invited Speakers Conference Papers p9–28
Pat Burnell Young Investigator Award
Conference Papers p29–46
FLASH Speakers Conference Papers p47–94
On-Demand Speakers Conference Papers p95–278
2St.
3McMaster
4McMaster
5McMaster
Invited Speakers Conference Papers
Pat Burnell Young Investigator Award Conference
Zhang
1School of Mechanical Engineering, Faculty of Engineering, Macquarie University, Sydney, NSW, Australia
2Woolcock Institute of Medical Research, Sydney, Australia.
3Department of Biomedical Sciences, Faculty of Medicine, Health and Human Sciences, Macquarie University, Sydney, NSW, Australia
4Department of Marketing, Macquarie Business School, Macquarie University, Sydney, NSW, Australia
Digitalisation in respiratory medicine, where are we heading to? 3 Sabine Häussermann1 1VisionHealth GmbH, Landsberger Str 72, Munich, 80339, Germany Inhaled therapies for COVID-19 9 Peter J. Barnes FRS MedSci National Heart & Lung Institute, Imperial College London Pre-clinical animal models: useful asset or a waste of resources? 11 Mark Birrell Imperial college London and AstraZeneca Targeted Nasal Drug Delivery – for Nose, Body and Brain 13 Julie D. Suman, Ph.D.1 1Next Breath, an Aptar Pharma company, 1450 South Rolling Road, Baltimore, Maryland / 21045, USA Nebulizers and COVID-19: Aerosol Generation vs. Aerosol Dispersion 17 Rajiv Dhand, MD, FCCP, FACP, FAARC, FRSM, ATSF Division of Pulmonary and Critical Care Medicine Professor and Wahid T. Hanna, MD Endowed Chair of Medicine Associate Dean of Clinical Affairs Graduate School of Medicine University of Tennessee Health Science Center, Knoxville, TN Investigating the Effects of Fluid Composition on Bacterial Aerosol Production 25 Mathura Thirugnanasampanthar1, Rod G Rhem2, Myrna B Dolovich2,3 & Zeinab Hosseinidoust1,4,5 1McMaster University, Department of Chemical Engineering, 1280 Main Street West, Hamilton, ON, L8S 4L8, Canada
DDL2021 DDL Annual Lecture
Joseph’s Healthcare, Firestone Research Aerosol Laboratory, 50 Charlton Ave East, Hamilton, ON,
L8N 4A6, Canada
University, Faculty of Health Sciences, Department of Medicine, 1280 Main Street West, Hamilton, ON, L8S 4K1, Canada
University,
Engineering,
School of Biomedical
1280 Main Street West, Hamilton, ON, L8S 4K1, Canada
University,
DeGroote Institute
Infectious
Micheal
for
Disease Research, 1280 Main Street West, Hamilton, ON, L8S 4K1, Canada
An adaptable dual-chamber microfluidic platform to investigate Pseudomonas aeruginosa biofilm growth at the airliquid interface under controlled hydro and aerodynamic flows 29
Papers
Ye1,2, Dina M. Silva2, Daniela Traini2,3,
Paul Young2,4, Shaokoon Cheng1, Hui Xin Ong2,3
1Department of Pharmaceutical Sciences, College of Pharmacy and Health Sciences, St. John’s University, Jamaica, NY 11439, USA
Gholizadeh1,2, Shaokoon Cheng2, Agisilaos Kourmatzis3, Zara Sheikh1, Daniela Traini1,4, Paul Young1,5 & Hui Xin Ong1,4
1Respiratory Technology, The Woolcock Institute of Medical Research, Sydney, NSW 2037, Australia
2School of Engineering, Macquarie University, Sydney, NSW 2109, Australia
3School of Aerospace, Mechanical and Mechatronic Engineering, The University of Sydney, Sydney, NSW 2006, Australia
4Department of Biomedical Sciences, Faculty of Medicine, Health, and Human Sciences, Macquarie University, Sydney, NSW 2109, Australia
5Department of Marketing, Business School, Macquarie University, Sydney, NSW 2109, Australia
1Skaggs Pharmaceutical Sciences Center, College of Pharmacy, The University of Arizona, 1703 E. Mabel St, Tucson, Arizona 85721, USA.
2Department of Medicine, Division of Translational and Regenerative Medicine, The University of Arizona College of Medicine, Tucson, AZ, USA
1Department of Small Molecule
Sciences, Genentech, Inc., One DNA Way, South San Francisco, CA 94080
2Department of Industrial and Physical Pharmacy, College of Pharmacy, Purdue University, 575 Stadium Mall Drive, West Lafayette, IN 47907, USA
3Birck Nanotechnology Center, Purdue
Sarah
1205 West State Street, West Lafayette, IN 47907, USA
Tomaso Guidi2, Francesca Schiaretti2, Hartmuth Schroettner3,4, Amrit Paudel1,5
1Research Center Pharmaceutical Engineering GmbH, Inffeldgasse 13, 8010 Graz, Austria
2Chiesi
S.p.A., R&D Department, Largo F. Belloli 11/A - 43122 Parma, Italy
3Austrian Centre for Electron Microscopy and Nanoanalysis, TU Graz, Steyrergasse 17/III, 8010 Graz, Austria
4Graz Centre for Electron Microscopy, Steyrergasse 17/III, 8010 Graz, Austria
5Institute of Process and Particle Engineering, TU Graz, Inffeldgasse 13, 8010 Graz, Austria Using
Athiya Azeem1, Gajendra Singh1, Hak-Kim Chan3, Lunjian Li2, Runyu Yang2, Agisilaos Kourmatzis1
1School of Aerospace, Mechanical and Mechatronic Engineering, The University of Sydney, NSW 2006, Australia
2School of Materials Science and Engineering, UNSW Sydney, NSW 2052, Australia
3School of Pharmacy, The University of Sydney, NSW 2006, Australia
1i2c Pharmaceutical Services, Cardiff Medicentre, Cardiff. CF14 4UJ. UK.
Pulmonary delivery of bedaquiline-loaded cubosomes for non-small cell lung cancer (NSCLC) treatment 33 Suyash M. Patil1, Shruti S. Sawant1 & Nitesh K. Kunda1
A human nose-on-a-chip as a physiologically relevant in-vitro model for nasal drug delivery
Hanieh
39
Pat Burnell Young Investigator Award Conference Papers
Targeting Deep Lungs with Swellable Nano/Microgels for the Delivery of Suramin 47 David Encinas-Basurto1, Kiley McCombs1, Ernest Vallorz1 & Heidi Mansour1,2
FLASH Speakers Conference Papers
Improving Physical and Aerosol Stability of Spray Dried High-dose Dry Powder Inhaler Formulations 51 Nivedita Shetty1,2, Heejun Park2, Dmitry Zemlyanov3 & Qi (Tony) Zhou2
Pharmaceutical
Spray-congealing and wet-sieving as alternative processes for the engineering of D-mannitol carriers
Joana
University,
57
T. Pinto1,
Zellnitz1,
Farmaceutici
microscopic high-speed imaging to quantify agglomerate-to-wall impaction in dry powder
inhalers 63
Propellant Dispersible Tablet for Preparation of Salmeterol/Fluticasone Combination pMDIs using Low-GWP HFC152a 67
A
Wiktoria Wegrzyn1,Rachael Kay & Cuong Hoa Tran
71
Sneha Dhapare1, Abhinav Mohan1, Bryan Newman1; Mårten Svensson2; Peter Elfman2; Dennis Sandell3,#, Larry Winner4, Simon Berger5, Jürgen Bulitta5, Günther Hochhaus5
1Office of Research and Standards, Office of Generic Drugs, Center for Drug Evaluation and Research, Food and Drug Administration, Silver Spring, MD, USA
2Emmace Consulting AB, Scheelevägen 22, SE-223 63 Lund, Sweden
3S5 Consulting, Ekvägen 8, SE-275 62 Blentarp, Sweden; # In Memoriam, October 29, 2020
4Department of Statistics, College of Liberal Arts and Sciences, University of Florida, Gainesville, FL, USA
5Department of Pharmaceutics, College of Pharmacy, University of Florida, Gainesville, FL, USA
High-dose inhaled rifampicin powder formulations: preparation, in vitro characterization and in vivo evaluation
Prakash Khadka1, Shubhra Sinha2, Ian G. Tucker1, Jack Dummer3, Philip C. Hill4, Rajesh Katare2 & Shyamal C. Das1
1School of Pharmacy, University of Otago, Adams Building, 18 Frederick Street, P.O. Box 56, Dunedin 9054, New Zealand
2Department of Physiology, HeartOtago, School of Biomedical Sciences, University of Otago, 270 Great King Street, P.O. Box 913, Dunedin 9054, New Zealand
3Department of Medicine, Dunedin School of Medicine, University of Otago, P.O. Box 56, Dunedin 9054, New Zealand
4Centre for International Health, Department of Preventive and Social Medicine, Dunedin School of Medicine, University of Otago, PO Box 56, Dunedin 9054, New Zealand
Respirable powder containing Cyclosporine A loaded liposomes as immunosuppressive
Davide D’Angelo1, Eride Quarta1,2, Stefania Glieca1, Veronica Chierici1, Giada Varacca1, Fabio Sonvico1, Francesca Buttini1
1Food and Drug Department, University of Parma, Parco Area delle Scienze 27/A, 43124 Parma, Italy 2Plumestars srl, Strada Inzani 1, 43125 Parma, Italy
03.
04.
1Respironics
75
Effects of Realistic In Vitro Test Factors on the Aerosol Properties of Metered-Dose Inhalers (MDIs)
agent suitable for lung transplant rejection and the containment of severe lung inflammation
81
DPI production: discriminating destabilising influences during spray drying 87 Friederike Roth, Regina Scherließ
of Pharmaceutics and Biopharmaceutics Kiel University, Grasweg 9a, Kiel, 24118, Germany FLASH Speakers Conference Papers On-Demand Speakers Conference Papers 01. Inhalable cannabidiol dry powders with enhanced solubility 95 Waiting Tai1, Lyndsey Leigh Anderson2, Jonathan Carl Arnold2, Hak-Kim Chan1 & Philip Chi Lip Kwok1
Drug Delivery Group, Sydney Pharmacy School, Faculty of Medicine and Health, The University of Sydney, NSW 2006, Australia
Initiative for Cannabinoid Therapeutics, Brain and Mind Centre, The University of Sydney, NSW 2050, Australia 02. Developing Analytical Methodology and Test Apparatus to Study Drug Deposition in the Throat 99 Matthew Potts1, Ben Myatt1, Sam Apoola2 & Peter Healey1 1Kindeva Drug Delivery Limited, Charnwood Campus, 10 Bakewell Road, Loughborough, LE11 5RB, United Kingdom 2School of Mechanical Engineering, Leeds University, Woodhouse Lane, Leeds, LS2 9JT, United Kingdom
Protein
Department
1Advanced
2Lambert
HFA-152a Inhaler Dose Release 105 Alan P. McKiernan1, Treasa M. Thomas1 & Cathal Duignan1
PLM Medical, IDA Business & Technology Park, Carrick-on-Shannon, N41 WK46, Ireland
1Prior
Towards a More Realistic Method for Measuring Nebulized Aerosols: Measurement of Fine Particle Fraction During Simulated Adult Breathing with a Nephele Mixing Inlet and Laser Diffraction with Simultaneous Drug Dose Analysis 111 Lois Slator1,2, Owen Currie1, Markus Hijlkema1 & Darragh Murnane2
Respiratory Drug Delivery (UK) Ltd, a business of Philips Electronics UK Limited, Chichester, West Sussex, UK
School of Life and Medical Sciences, University of Hertfordshire, Hatfield, UK
2
05. In Vitro Investigation into Fugitive Aerosol from a Novel 4th Generation Adaptive Aerosol Delivery (AAD) System
Adam P Metcalf, Steven P Cowley & Lucy EA Hardaker
Respironics Respiratory Drug Delivery (UK) Ltd, a business of Philips Electronics UK Limited, Chichester Business Park, City Fields Way, Chichester, PO20 2FT, United Kingdom
06. Aerodynamic particle size distribution and delivered dose efficiency of a continuous-output mesh nebuliser and a novel breath-actuated device using terbutaline sulphate
Edgar H. Cuevas Brun, Huei-An Tsai, Ciou-Ting Wang, Yuan-Ming Hsu & Ke-Ting Chen
HCmed Innovations Co. Ltd., Rm. B, 10F., No.319, Sec.2, Dunhua S. Rd., Taipei City, 10669, Taiwan
07. Is a Pressure Drop ≥10 cm H2O with any Dry Powder Inhaler (DPI) a Reasonable Threshold Above which a Patient Should Receive an Adequate Lung Dose: Method Validation and Experience with a Sample Cohort of COPD Patients?
Mark W Nagel1, Jason A Suggett1 & Jolyon P Mitchell2
1Trudell Medical International, 725 Baransway Drive, London, Ontario, N65 5G4, Canada
2Jolyon Mitchell Inhaler Consulting Services Inc., 1154 St. Anthony Rd., London, Ontario, N6H 2R1, Canada
08.
1Research Center Pharmaceutical Engineering, Inffeldgasse 13, Graz, 8010, Austria
2Institute for Process and Particle Engineering, Graz University of Technology, Inffeldgasse 13, Graz, 8010, Austria 10.
Yuqing Ye1,2, Ziyi Fan1, Ying Ma1,2 & Jesse Zhu*1,2
1University of Western Ontario, 1151 Richmond Street, London, N6A 3K7, Canada
2Ningbo Inhale Pharma, 2260 Yongjiang Street, Gaoxin District, Ningbo, 315000, China
11.
Elena Menchi1, Charaf El Khattabi2, Olivier Denis3, Stéphanie Pochet2, Karim Amighi1 & Nathalie Wauthoz1
1Laboratory of Pharmaceutics and Biopharmaceutics, Faculty of Pharmacy, Université libre de Bruxelles (ULB), Boulevard du Triomphe, B-1050 Brussels, Belgium, Elena.Menchi@ulb.be
2Pharmacology, Pharmacotherapy and Pharmaceutical Care, Faculty of Pharmacy, Université libre de Bruxelles (ULB),
3Immune
12.
du Triomphe, B-1050 Brussels, Belgium
Flook1, Daniel Lock
1University of Bath, Claverton Down, Bath, BA2 7AY
13.
115
B-1180 Brussels, Belgium
Jonathan Marie, Bruno LE CORRE & Claire CANNETTE
APTAR PHARMA Route des Falaises 27100 Le Vaudreuil France
14. Understanding impact of fines on flow behavior of lactose blends with and without magnesium stearate and its impact on filling using membrane filling technology
M. Mehta1, E. Sternberger-Ruetzel1, H. Peters.2 & O. Imole3
1Harro Höfliger Verpackungsmaschinen GmbH, Helmholtzstraße 4, 71573 Allmersbach i.T, Germany
2DFE Pharma, Transistorweg 5, 6534 AT Nijmegen, The Netherlands
3Hosokawa Micron B.V., Gildenstraat 26, 7005 BL, Doetinchem, The Netherlands
119
123
153
159
On-Demand Speakers Conference Papers
Myriam Eckes and Brenda Hervieu, Lina Fontaine & Thierry Porée OptimHal-ProtecSom, 24 rue du Train Renard, 50700 Valognes,
Machine Learning approach to predict the formation co-amorphous systems for inhalation therapy 133
Effect of an inhalation chamber without inspiratory valve and facemask for neonates use on drug delivery. 127
France. 09.
Sarah Zellnitz1, Elisabeth Fink1 & Amrit Paudel1,2
Investigation of design features on the performance of 3D-printed dry
powder inhalers. Part 1: grid mesh 139
Determination of an appropriate dose ratio of a synergistic combination of long-acting bronchodilators for the maintenance treatment of asthma and COPD 145
Boulevard
Response,
Sciensano, Rue Engeland 642,
A Predictive Model To Explore The Effects Of Physicochemical Properties On Mesh-Nebulisation
Annabel
149
Elastomer used in
Identification of potential antioxidant degradation products as Extractables from an innovative Thermo Plastic
Metered Dose Inhalers
On-Demand Speakers Conference Papers
15. Influence of material and capsule filling process with Minima® on aerosolization performances by DPIs
Annalisa Bianchera1, Ayça Altay-Benetti1, Francesca Buttini1, Pietro Pirera2 & Ruggero Bettini1
1Food and Drug Department, University of Parma, Parco Area delle Scienze 27/a, Parma, 43124, Italy
2I.M.A. Industria Macchine Automatiche S.p.A. Unipersonale, Via Emilia 428-442, 40064 Ozzano dell’Emilia (Bologna), Italy
16. Co-amorphization: A formulation strategy for amorphous high dose dry powder to treat lung infections
Bishal Raj Adhikari1, Keith C. Gordon2 & Shyamal C. Das1
1School of Pharmacy, University of Otago, Dunedin 9054, New Zealand
2Department of Chemistry, University of Otago, Dunedin 9016, New Zealand
17. Budesonide Solution MDIs: Plasma Treated Canister Performance and other Canister Types
David A. Lewis1, Rob. D. Johnson1, Daniel I. Lewis1, Jacqueline Green2
1Oz-UK Limited, Chippenham, Wiltshire, UK
2Presspart Mfg Ltd, Blackburn, UK
18. Fluticasone Propionate Suspension MDIs: Plasma Treated Canister Performance and other Canister Types
David A. Lewis1, Rob. D. Johnson1, Daniel I. Lewis1, Jacqueline Green2
1Oz-UK Limited, Chippenham, Wiltshire, UK
Mfg Ltd, Blackburn, UK
19.
Andrew J.L. McArthur1, Victoria L. Oliver2, Pete Lambert1, Eddie French1, Jacob Harker1 & Michelle P. McIntosh1
1Drug Delivery, Disposition and Dynamics, Monash Institute of Pharmacy and Pharmaceutical Science, Monash University, Melbourne, VIC 3052, Australia.
2Melbourne University School of Population and Global Health, Melbourne University, Melbourne, VIC 3052, Australia.
20. Formulation, Characterization and Optimization of Dry Powder for Inhalation using combined micronized LevoDropropizine and Curcumin
Carlotta Giulieri1, Gianluca Trentin2, Stefano Cagliero2 & Aurelie Schoubben1
1University of Perugia, via del Liceo 1, Perugia (PG), 06123, Italy
2Aptuit an Evotec company, via Alessandro Fleming 4, Verona (VR), 37135, Italy
21. Fundamental properties of propellant aerosols can guide transition to low global warming potential pMDIs: size, velocity and surface charge
Irene Rossi1 & William J. Ganley1, Philip Chi Lip Kwok2, Ivan Zadrazil3, Graham Hassall3, Olivier Michelet4, Segolene Sarrailh4, Guillaume Brouet4, Robert Price1 & Jagdeep Shur1
1Nanopharm Ltd, An Aptar Pharma Company, Cavendish House Hazell Drive, Newport NP10 8FY
2Sydney Pharmacy School, Faculty of Medicine and Health, University of Sydney, Pharmacy and Bank Building A15, NSW 2006, Australia
3Dantec Dynamics, Garonor Way, Royal Portbury, Bristol, BS20 7XE
4Aptar Pharma, Route des Falaises, 27100, Le Vaudreuil, France
22. Investigation on the impact of resonant acoustic mixing parameters and carrier type on the deposition patterns of Budesonide/Formoterol Fumarate DPI combination product
S Radivojev1,2, M Beretta1,3, V Reinisch1, V Rehbein1, J T Pinto1, E Frönlich1,2, & A Paudel1,3
1Research Center Pharmaceutical Engineering GmbH, Inffeldgasse 13, Graz, 8010, Austria
2Center for Medical Research, Medical University of Graz, Stiftingtalstraße 24, Graz, 8010, Austria
3Institute of Process and Particle Engineering, Graz University of Technology, Inffeldgasse 13, Graz, 8010, Austria
23. A high force pMDI for delivery into the olfactory region of the nasal cavity
Andy Cooper1, Barzin Gavtash1
1Kindeva Drug Delivery, Charnwood Campus, 10 Bakewell Road, Loughborough, Leicestershire LE11 5RB
163
167
171
175
183
189
193
197
2Presspart
drying yield
efficiency
inhaled powder for global health applications 179
A Design of Experiments approach to optimising spray
and production
of a model
On-Demand
24. The application of morphological filters in automated imaging for nasal formulations: a design of experiment approach
Paulo Serra1, Jared Hall1, Irene Rossi1, Jagdeep Shur1 & Robert Price1
1Nanopharm Ltd, An Aptar Pharma Company, Cavendish House Hazell Drive, Newport NP10 8FY, United Kingdom
25. Device and Formulation Factors affecting the Aerosol Performance of Pressurised Metered Dose Inhalers
B. J. A. Thorne1, S. B. Kirton1, M. Knowles2 K. C. Lee3, D. Murnane1, A. I. Sapsford2, A. D. Wright2
1University of Hertfordshire, College Lane, Hatfield, AL10 9AB, U.K.
2Bespak Europe Ltd., Bergen Way, King’s Lynn, Norfolk, PE30 2JJ, U.K.
3University of East London, Docklands Campus, University Way, London, E16 2RD, U.K.
26. Development of a nasal spray containing a novel human recombinant antibody for SARS-CoV-2 therapy
201
207
211
Antonia Zapata del Baño1, Cyrine Mestiri1, Hank Oviatt2, Bill Zimlich2, Eric Mathur2, Karen Terry3, Robert Price1, Jagdeep Shur1, Irene Rossi1
1Nanopharm Ltd, An Aptar Pharma Company, Cavendish House Hazell Drive, Newport NP10 8FY, United Kingdom
2Diomics Corporation, 41083 Sandalwood, Murrieta, CA 92562, United States
3Aptar Pharma, 250 North Route 303, Congers, NY 10920, United States
27.
Mark W. Nagel1, Jason A. Suggett1 & Jolyon Mitchell2
1Trudell Medical International, 725 Baransway Drive,
215
Lane, Oxford, OX2 0QS, UK
2Novartis Pharma AG, Novartis Campus, Basel, Switzerland
32.
George Herbert1,2, Glenn Woolley1,2,3, Dave Roberts1,2, Juozas Domarkas1,2, John Wright1,2, Graham Wright3 & Stephen J. Archibald1,2
1Department of Biomedical Sciences, The University of Hull, Cottingham Road, Hull, HU6 7RX, UK
2The Positron Emission Tomography Research Centre, The University of Hull, Cottingham Road, Hull, HU6 7RX, UK
3Hull University Teaching Hospitals NHS Trust, Castle Hill Hospital, Castle Road, Cottingham, HU16 5JQ, UK
33.
Irès van der Zwaan1 Pegah Nabavi2 Adam Feiler2,3
1Department of Pharmaceutical Biosciences and Swedeliver, Uppsala University, Husargatan 3, Uppsala, 75237, Sweden
2Nanologica, Forskargatan 20G, SE-151 36 Södertälje, Sweden
3KTH, Royal Institute Technology, Department of Chemistry, Drottning Kristinas väg, 51SE-100 44 Stockholm
(VHC)
How does the Tongue Influence Transport of Inhaled Particles from a Pressurized Metered Dose Inhaler (pMDI) and Valved Holding Chamber
London, Ontario, N65 5G4,
2Jolyon Mitchell Inhaler Consulting Services Inc., 1154 St. Anthony Rd., London, Ontario, N6H 2R1, Canada 28. Leveraging DPI formulation screening: particle-particle interaction 219 Raquel Borda d’ Água1 & João Pereira2 1Hovione, Estrada do Paço do Lumiar, Campus do Lumiar, Edifício R, 1649-038, Lisboa, Portugal
Plume Front Velocity and Force to Actuation Characterisation of Pressurised Metered Dose Inhalers and Soft Mist Inhalers 223 Joshua Houlden1, Miles Jeanneret1 Davide Cunha1 & Mervin Ramjeeawon1 1Intertek Melbourn, Saxon Way, Melbourn, Herts, SG8 6DN, UK 31. Influence of Geography on the Carbon Footprint Impact of Breezhaler® Dry Powder Inhaler 227 Aumônier S1, Mezzi K2 Whiting A1 & Fulford B2 1ERM, Eaton House, Wallbrook Court, North Hinksey
Canada
29.
Radiolabelled Drug Molecules
The Quantitative Assessment of Vape Devices as Novel Pulmonary Drug Delivery Systems Using Fluorine-18
231
Enabling Pulmonary Drug Delivery with Nanoporous Particles
237
Speakers Conference Papers
34. In vitro and in vivo evaluations of the tolerance of a new and innovative anti-tuberculosis drug combination by inhalation
Faustine Ravon1,2, Elena Menchi1, Myriam Remmelink3, Selma Chraibi1, Véronique Fontaine2 & Nathalie Wauthoz1
1Unit of Pharmaceutics and Biopharmaceutics, Faculty of Pharmacy, Université Libre de Bruxelles, Boulevard du Triomphe, Brussels, 1050, Belgium
241
2Unit of Microbiology, Bioorganic and Macromolecular Chemistry, Faculty of Pharmacy, Université Libre de Bruxelles, Boulevard du Triomphe, Brussels, 1050, Belgium
3Department of Pathology, Hôpital Erasme, Université Libre de Bruxelles, Route de Lennik 808, Brussels, 1070, Belgium
35. Transport of Local Anaesthetic Lidocaine across a Pharyngeal Air-Liquid Interface Cell Model
245 Zara Sheikh1, Antonella Granata1, Dina Silva1, Paul Young1,3, Hui Xin Ong1,2, Daniela Traini1,2
1Woolcock Institute of Medical Research, 431 Glebe Point Road, Glebe NSW 2037, Australia
2Department of Biomedical Sciences, Faculty of Medicine, Health and Human Sciences, Macquarie University, NSW 2109, Australia 3Macquarie Business School, Macquarie University, NSW 2109, Australia
36. Formulation Development of Inhalable Dacomitinib Polymeric Nanoparticles for Non-Small Cell Lung Cancer Treatment
Druvasarika Barji, Suyash M. Patil, Nitesh K. Kunda
251
Department of Pharmaceutical Sciences, College of Pharmacy and Health Sciences, St. John’s University, Jamaica, NY 11439, USA
37. Nasal-PAMPA: a novel in vitro tool for prediction of intranasal drug permeability
Patrícia Henriques1,2, Joana Bicker1,3 Slavomíra Doktorovová2, Ana Fortuna1,3
1Laboratory of Pharmacology, Faculty of Pharmacy, University of Coimbra, Pólo das Ciências da Saúde, Azinhaga de Santa Comba, 3000-548 Coimbra, Portugal
2R&D, Drug Product Development, Hovione FarmaCiencia SA, Lisbon, Portugal
255
3CIBIT/ICNAS, Coimbra Institute for Biomedical Imaging and Translational Research, University of Coimbra, Azinhaga de Santa Comba, 3000-548 Coimbra, Portugal
38. Surface Acoustic Wave Nebulisation for Targeted Inhalation Drug Delivery to Central and Peripheral Airways
Christian Witte1, Elijah Nazarzadeh1, John Pritchard1, Julien Reboud2, Jonathan M. Cooper2
1Acu-Flow Limited, Rankine Building, Oakfield Avenue, Glasgow, G12 8LT, UK
2University of Glasgow, Rankine Building, Oakfield Avenue, Glasgow, G12 8LT, UK
39. The evolution of unsteady flow from dry powder inhalers
Vishal Chaugule1, Suzanna Olofsson1, Larissa Gomes dos Reis2, David F Fletcher3, Paul M Young2,4, Daniela Traini2,5 & Julio Soria1
1Laboratory for Turbulence Research in Aerospace and Combustion (LTRAC), Department of Mechanical and Aerospace Engineering, Monash University, Clayton Campus, Melbourne, VIC 3800, Australia
2Respiratory Technology, Woolcock Institute of Medical Research, Sydney, NSW 2037, Australia
3School of Chemical and Biomolecular Engineering, The University of Sydney, Sydney, NSW 2006, Australia
4Department of Marketing, Macquarie Business School, Macquarie University, NSW 2109, Australia
261
265
5Department of Biomedical Sciences, Faculty of Medicine, Health and Human Sciences, Macquarie University, NSW 2109, Australia
40. Assessment of aerosol drug delivery during the escalation of treatment for a simulated COVID-19 adult patient 269
Ronan MacLoughlin, Marc Mac Giolla Eain, Andrew O’Sullivan, Leanne Reilly, Keith Hurney, Mary Joyce1
1Aerogen Ltd., Galway Business Park, Dangan, Galway, H91 HE94, Ireland
41. Development of a prototype of an aerosolization device for dry powders to improve in vitro cell-based assays in the context of lung delivery 273
Jorge F. Pontes1,2, Hermínio P. Diogo3, Eusébio Conceição4, Flávia Musacchio1, Rui M. Borges dos Santos1,4 & Ana Grenha1,4
1Centre for Marine Sciences, Universidade do Algarve, Campus de Gambelas, Faro, 8005-139, Portugal
2Centre for Biomedical Research, Universidade do Algarve, Campus de Gambelas, Faro, 8005-139, Portugal
3University of Lisbon, Instituto Superior Técnico, Centro de Química Estrutural, Av. Rovisco Pais, 1049-001 Lisbon, Portugal
4Faculdade de Ciências e Tecnologia, Universidade do Algarve, Campus Gambelas, Faro, 8005-139, Portugal
On-Demand Speakers Conference Papers
DDL Annual Lecture
1
2
Digitalisation in respiratory medicine, where are we heading to?
Sabine Häussermann1 1VisionHealth GmbH, Landsberger Str 72, Munich, 80339, GermanySummary
Digitalisation has changed our life in many ways, and it is also changing the way we treat patients Digitalisation has a great potential to make communication and the use of resources faster and easier. That way, digitalisation facilitates what we have done analogue before: communicate, send, and store diagnostic and lab data, visualise data in graphs etc.
An even grander potential of digitalisation lies in using artificial intelligence (AI). But AI will only get us to a certain point, the real value lies in combining AI and human emotional intelligence (EI), with that we can leverage healthcare to the next level. We might see correlations we missed before, get support for physicians in another way In other fields such as chess, we have already seen the success: While even chess grand masters were losing against AI already in 1995, we could see that the combination of AI and human does not only beat humans (not surprisingly) but also AI. When digitalisation is done in an ethical way, the combination of digital tools, AI and physicians can lead to real personalised medicine, putting the patient into the centre
Key Message
Digitalisation is more than translating analogue data into digital signals, sent electronically. Digitalisation bears the potential to use big data and evaluate it with artificial intelligence With that, we can personalise medicine in a way, which was not possible before and create powerful tools for physicians.
Introduction
For decades now, digitalisation has been changing our life and the change is still going on In healthcare, implementing those changes were not very successful at first. Many of the eHealth and mHealth solutions failed in practice and never took up in real life. Recently the solutions became more convenient and less costly, so slowly they came into the market, and the current pandemic convinced some of the sceptics that digitalisation has the potential to be useful.
Now we see electronic patient records and digitalised hospitals in most countries. Apps for chronic patients which support those patients and their friends and family at home. The wearable and wellness industries are penetrating the healthcare market, so the gap between healthcare and wellness industry is getting smaller. This is all contributing to the success of digitalisation since it makes data and information widely accessible for physicians and for patients.
Beyond these, digitalisation has a much higher potential in changing the way we treat patients AI has powerful potential within healthcare, promising the ability to analyse vast amounts of data quickly and in detail
What can we expect from digitalizing respiratory medicine?
Digitalisation: a value on its own
The lack of resources in healthcare and the aging society contribute to the fact, that physicians and nurses have less and less time for the patients. At the same time, needs patients are very often not considered in this equation since access to healthcare can be time consuming and tedious. Both sides profit considerably from online booking of appointments, and the possibility of for example video consultations. No one doubts the usefulness of electronic patient records and digital hospitals even though it’s not yet implemented fully and completely everywhere. If done right, those tools can be
Drug Delivery to the Lungs, Volume 32, 2021 - Sabine Häussermann et al.
3
One of the best-known examples on the market for this is Nuvoair, which uses AI for the interpretation of spirometry test results. The clinical trial done with that system, outperformed pulmonologists in 16 European countries in the correct interpretation of spirometry curves [3] Therefore, the spirometry system of Nuvoair is a great tool for GPs and for home spirometry, and maybe even for the busy life of hospital staff
Symptom checker AI systems are used to diagnose diseases. They can be used at home, but will more and more be used also in physicians’ offices, to support decisions The most widely known now are Ada and Babylon. Both use neural networks to learn from textbooks and articles and diagnose patients according to pre-existing conditions, risk factors and symptoms [4] Their accuracy was triaged in clinical trials: The accuracy of diagnosis and safety for Ada and Babylon in the clinical trial was comparable to those of human physicians. [5] [6]
Especially in the recent month, with the COVID situation, many companies developed AI cough monitors as a biomarker for respiratory diseases. One of these examples from Switzerland, Resmonics, has validated their cough monitor, running on commercial smartphones with no other hardware needed, with several clinical trials. They could show that their detection of cough and sleep quality was prognostic on the detection of asthma attacks up to 5 days ahead [7]
New ways in the therapy of respiratory diseases
Managing chronic respiratory diseases is a challenge, both for patients, and the treating physician . The restructuring of the health care systems is a chance, to involve patients and their friends and family more into the treatment of their diseases. AI driven apps can be a tool to empower patients following their therapy plan adequately at home.
The most common drug delivery route for Asthma and COPD therapy is inhaled to the lungs This route has great advantages but faces long standing problem of handling and inhalation errors. The training of inhaler use for patients is an unmet need, which is addressed by Kata. Kata® is based on AI to support inhalation therapy while patients use their normal therapy in real time Furthermore, it provides help and guidance through a diary function, education, and support.
Pulmonary rehabilitation is one of the cornerstones of respiratory therapy due to its positive effect on disease progression and mortality. Despite that, many health care systems cannot offer it due to resource restrictions. Kaia COPD aims to deliver a personalised pulmonary rehabilitation experience through education, daily training sessions and individualised therapy. It has shown the first positive results on outcome in a pilot study [8]
Limits and risks of digitalisation
Generally, there is the risk of data abuse, which becomes greater when this data is digital. The issue with this relatively new field is, that quality standards are being developed as the field develops and open flanks are sometimes only exposed by criminal energy. This is the risk of any new technology and notified bodies and regulatory authorities are working on the standards as we go along.
Not only the risk of data abuse, but also data ownership is one of the fiercely discussed topics in the field. The opportunity here is, that data ownership is transferred to the patient in the course of digitalisation. With that, digitalisation has the potential to empower patients and get them into a more active and responsible role.
When it comes to AI, choosing the wrong data set or a limited data set is one of the greatest risks. The bias humans have in terms of racism and prejudices is therefore often reproduced by AI The advantage when it comes to healthcare is, that applications need to be developed by quality standards and have to show clinical efficacy in order to be used in the field. This helps to mitigate the risk, but does not wave the need to apply new standards and regulations
Generally, the limitation of digital support system is the agnosticism in empathy and common sense. For this reason, it is not going to replace human care givers, but complement them.
Drug Delivery to the Lungs, Volume 32, 2021 - Sabine Häussermann et al.
4
One of the best-known examples on the market for this is Nuvoair, which uses AI for the interpretation of spirometry test results. The clinical trial done with that system, outperformed pulmonologists in 16 European countries in the correct interpretation of spirometry curves [3] Therefore, the spirometry system of Nuvoair is a great tool for GPs and for home spirometry, and maybe even for the busy life of hospital staff
Symptom checker AI systems are used to diagnose diseases. They can be used at home, but will more and more be used also in physicians’ offices, to support decisions The most widely known now are Ada and Babylon. Both use neural networks to learn from textbooks and articles and diagnose patients according to pre-existing conditions, risk factors and symptoms [4] Their accuracy was triaged in clinical trials: The accuracy of diagnosis and safety for Ada and Babylon in the clinical trial was comparable to those of human physicians. [5] [6]
Especially in the recent month, with the COVID situation, many companies developed AI cough monitors as a biomarker for respiratory diseases. One of these examples from Switzerland, Resmonics, has validated their cough monitor, running on commercial smartphones with no other hardware needed, with several clinical trials. They could show that their detection of cough and sleep quality was prognostic on the detection of asthma attacks up to 5 days ahead [7]
New ways in the therapy of respiratory diseases
Managing chronic respiratory diseases is a challenge, both for patients, and the treating physician . The restructuring of the health care systems is a chance, to involve patients and their friends and family more into the treatment of their diseases. AI driven apps can be a tool to empower patients following their therapy plan adequately at home.
The most common drug delivery route for Asthma and COPD therapy is inhaled to the lungs This route has great advantages but faces long standing problem of handling and inhalation errors. The training of inhaler use for patients is an unmet need, which is addressed by Kata. Kata® is based on AI to support inhalation therapy while patients use their normal therapy in real time Furthermore, it provides help and guidance through a diary function, education, and support.
Pulmonary rehabilitation is one of the cornerstones of respiratory therapy due to its positive effect on disease progression and mortality. Despite that, many health care systems cannot offer it due to resource restrictions. Kaia COPD aims to deliver a personalised pulmonary rehabilitation experience through education, daily training sessions and individualised therapy. It has shown the first positive results on outcome in a pilot study [8]
Limits and risks of digitalisation
Generally, there is the risk of data abuse, which becomes greater when this data is digital. The issue with this relatively new field is, that quality standards are being developed as the field develops and open flanks are sometimes only exposed by criminal energy. This is the risk of any new technology and notified bodies and regulatory authorities are working on the standards as we go along.
Not only the risk of data abuse, but also data ownership is one of the fiercely discussed topics in the field. The opportunity here is, that data ownership is transferred to the patient in the course of digitalisation. With that, digitalisation has the potential to empower patients and get them into a more active and responsible role.
When it comes to AI, choosing the wrong data set or a limited data set is one of the greatest risks. The bias humans have in terms of racism and prejudices is therefore often reproduced by AI The advantage when it comes to healthcare is, that applications need to be developed by quality standards and have to show clinical efficacy in order to be used in the field. This helps to mitigate the risk, but does not wave the need to apply new standards and regulations
Generally, the limitation of digital support system is the agnosticism in empathy and common sense. For this reason, it is not going to replace human care givers, but complement them.
Drug Delivery to the Lungs, Volume 32, 2021 - Sabine Häussermann et al.
5
Conclusion
The future of healthcare will be more patient centred, empowered to prevent disease progression rather than passively receiving treatment. The aim is, that personalised health solution will seamlessly fit into patients’ life’s. This will be enabled by data and algorithms and change healthcare systems within, with regard to organisation and regulation. Therefore, the roles of physicians and nurses will need to be redefined.
With more data being available, AI will have a dominant role in healthcare in the future. Undoubtedly, AI is superior in pattern recognition and will be of great support for the system if done right One factor making AI driven solutions more successful is the human factor: each the AI solution and the human physician have their limitation; in combination they will achieve the best possible results for the patient. The example comes from the chess game. AI beat the human player already in 1995, but AI in combination with the human player was superior to AI only, and therefore the most successful combination [9]
Transferring this example to respiratory care, AI might enable us to predict and mitigate exacerbations, treat patients cost efficient in a personalised way and support caregivers in their decision.
[1] Stead WW, Searle JR, Fessler HE, Smith JW, Shortliffe EH. Biomedical informatics: changing what physicians need to know and how they learn. Acad Med. 2011 Apr;86(4):429-34. doi: 10.1097/ACM.0b013e3181f41e8c. PMID: 20711055.
[2] Tinschert P, Rassouli F, Barata F, Steurer-Stey C, Fleisch E, Puhan MA, Kowatsch T, Brutsche MH. Nocturnal Cough and Sleep Quality to Assess Asthma Control and Predict Attacks. J Asthma Allergy. 2020;13:669-678 https://doi.org/10.2147/JAA.S278155
[3] Topalovic M, Das N, Burgel PR, Daenen M, Derom E, Haenebalcke C, Janssen R, Kerstjens HAM, Liistro G, Louis R, Ninane V, Pison C, Schlesser M, Vercauter P, Vogelmeier CF, Wouters E, Wynants J, Janssens W; Pulmonary Function Study Investigators; Pulmonary Function Study Investigators:. Artificial intelligence outperforms pulmonologists in the interpretation of pulmonary function tests. Eur Respir J. 2019 Apr 11;53(4):1801660. doi: 10.1183/13993003.01660 -2018. PMID: 30765505.
[4] Cirkovic, Aleksandar. (2020). Evaluation of Four Artificial Intelligence –Assisted Self-Diagnosis Apps on Three Diagnoses: Two-Year Follow-Up Study. Journal of Medical Internet Research. 22. e18097. 10.2196/18097
[5] Gilbert S, Mehl A, Baluch A, Cawley C, Challiner J, Fraser H, Millen E, Montazeri M, Multmeier J, Pick F, Richter C, Türk E, Upadhyay S, Virani V, Vona N, Wicks P, Novorol C. How accurate are digital symptom assessment apps for suggesting conditions and urgency advice? A clinical vignettes comparison to GPs. BMJ Open. 2020 Dec 16;10(12):e040269. doi: 10.1136/bmjopen-2020-040269. PMID: 33328258; PMCID: PMC7745523.
[6] Baker, A., Perov, Y., Middleton, K., Baxter, J., Mullarkey, D., Sangar, D., Butt, M., DoRosario, A., & Johri, S. (2020). A Comparison of Artificial Intelligence and Human Doctors for the Purpose of Triage and Diagnosis. Frontiers in artificial intelligence, 3, 543405. https://doi.org/10.3389/frai.2020.543405
[7] Tinschert P, Rassouli F, Barata F, Steurer-Stey C, Fleisch E, Puhan MA, Kowatsch T, Brutsche MH. Nocturnal Cough and Sleep Quality to Assess Asthma Control and Predict Attacks. J Asthma Allergy. 2020;13:669-678 https://doi.org/10.2147/JAA.S278155.
[8] Rassouli F, Boutellier D, Duss J, Huber S, Brutsche MH. Digitalizing multidisciplinary pulmonary reha bilitation in COPD with a smartphone application: an international observational pilot study. Int J Chron Obstruct Pulmon Dis. 2018 Nov 23;13:38313836. doi: 10.2147/COPD.S182880. PMID: 30538444; PMCID: PMC6260122.
[9] Case, N. (2018). How To Become A Centaur. Journal of Design and Science. https://doi.org/10.21428/61b2215c
Drug
to the Lungs, Volume 32, 2021 -
in
to?
Delivery
Digitalisation
respiratory medicine, where are we heading
6
Invited Speakers Conference Papers
7
8
Inhaled therapies for COVID-19
Peter J. Barnes FRS MedSciNational Heart & Lung Institute, Imperial College London
SARS-CoV-2 is a coronavirus that infects epithelial cells in the naso - and oropharynx before infecting epithelial cells of the lower airways and alveoli and in severe COVID -19 spreading systemically and inducing a systemic inflammatory response. SARS-CoV-2 is spread mainly by virus particles in droplets and aerosols. This suggests that inhaled therapies may be useful in the treatment of early COVID -19 disease before severe respiratory systemic features develop and potentially in reducing transmission of the virus in the community. To be effective any inhaled therapy must be rapidly acting to prevent viral replication in respiratory epithelial cells to prevent the disease spreading down the respiratory tract and into the systemic circulation. It also needs to be safe and available for early prescription in order to prevent severe disease and hospitalisation. The development of inhaled therapies for COVID -19 may involved repurposing of existing inhaled therapies or developing inhaled formulations of new drugs w ith antiviral effects.
Patients with asthma and COPD were reported to be less likely to be hospitalised with SARS -CoV-2 infection despite the concern that this coronavirus would have severe consequences for these patients as coronaviruses are known to trigger severe exacerbation s. One possibility was that this may be due to the widespread treatment with inhaled corticosteroids (ICS), which are known to suppress ACE2 and TMPRSS2 on epithelial cells that are key entry receptors for the virus and also reduce virus replication in vitro. A community based open label parallel group phase 2 study of the ICS budesonide (800 µg bid until recovery) in people with early symptoms (within 7 days of onset) of COVID -19 and confirmed by PCR testing (STOIC) showed that only 1/69 people in the ICS group developed severe disease compared with 10/70 in the usual care group. 1 Clinical recovery was also shorter in the ICS group. This finding was confirmed in an open label study of inhaled budesonide in individuals over the age of 65 years at risk from severe COVID-19 (PRINCIPLE), which showed a reduction in time to recovery and a trend towards reduced hospitalisation and death. 2 Several other trials, including double-blind studies, of ICS in early COVID-19 are currently underway with different corticosteroids, includ ing ciclesonide, which appears to be the most effective against SARS-CoV-2 in vitro 3 However, a recent double-blind study of nasal and inhaled ciclesonide failed to show any benefit in early COVID -19, although the population was mainly young adults who have a low risk of diseas e progression.4 The mechanism of action of ICS in COVID-19 has not yet been established, but may involv e reduced viral entry due to suppression of ACE2 and TMPRSS2 in airway epithelial cells, reduced viral proliferation or reduced inflammatory mediators secreted by airway epithelial cells that may promote viral spreading.
Interferon β1 is currently approv e for treating multiple sclerosis. Nebulised IFN -β1a (SNG001) gave a greater degree of clinical improvement in hospitalised COVID -19 patients and a reduction on symptoms (mainly dyspnoea) compared to with placebo and was well tolerated. 5 However, studies in early disease are underway but have not yet been reported, although there are logistical problems in the need for a nebuliser to deliver the drug. Inhaled PUL-42 is a combination of a TLR2/6 and a TLR9 inhibitors which is effective in a single inhaled dose against SARS-CoV and MERS-CoV infection in mice and reduces the lung viral load.6 This drug is now in clinical trials for COVID-19. Other inhaled drugs, including antivirals such as remdesivir and niclosamide, are also in development.
Drug Delivery to the Lungs , Volume 32, 2021 - Peter J Barnes FRS MedSci
9
10
Pre-clinical animal models: useful asset or a waste of resources?
Mark BirrellImperial college London and AstraZeneca
Time and time again I hear “preclinical in vivo models are not predictive of clinical results” and they are blamed for the failure of research programs. Having spent 3 decades working with these models, it does tend to grind. To be fair, the statement isn’t incorrect, its more that “we” should be realistic of what the rodent models can really tell us. In my view the in vivo systems are very useful for PK/PD modelling i.e. looking for target engagement and then a related function, and linking that to exposur e/dose. It’s when it comes to modelling diseases that the models can fail: the lung structure, the cells, the physiology, the immunology, the mediators etc are different in rodents compare to man. Add to that is we, as yet, do not know what triggers the majority of human respiratory diseases, and, indeed they are likely to multifactorial – precision medicine is the rallying cry for the majority of on-going projects.
I would like to share with you some data we published a few years ago (ref below) in which we looked at the role of an ion channel expressed on airway sensory nerves, TRPV1, in chronic cough. The preclinical data was very supportive of progressing to clinical assessment but when the human study read out, the data were very disappointing. I will show you how we are currently trying to address how we can improve the predictivity of the in vivo systems and hope that going forward they can be used in the development of anti-tussive therapies.
Drug Delivery to the Lungs , Volume 32, 2021 - Mark Birrell
11
12
Targeted Nasal Drug Delivery – for Nose, Body and Brain
Julie D. Suman, Ph.D.11Next Breath, an Aptar Pharma company, 1450 South Rolling Road, Baltimore, Maryland / 21045, USA
Summary
Chemoreceptors, trigeminal parasympathetic pathways and lymphatic tissue within the nasal cavity represent the future of nasal drug delivery. Targeted deposition in specific regions to deliver medication to these sites is growing. Unmet needs in CNS conditions such as Parkinsons Dis ease, Alzheimer’s and brain cancers like glioblastoma, all my benefit from drug transport along the olfactory neurons into the cerebral spinal fluid (CSF) or brain. Narrow spray plumes and optimized instructions for use help to direct droplets to the region of interest. For example, an increase in insertion depth of the spray nozzle may improve deposition in the olfactory regions by ~30%. However, deposition alone may not be enough. Formulation strategies to overcome mucociliary clearance are being investig ated to improve retention. In addition, certain mucoadhesive excipients may also potentiate the immune response for intranasal vaccine. Nanoparticulate systems have the potential for both intranasal vaccination and improving uptake in the CNS via the olfac tory nerves. The optimal nanoparticle size is being investigated as well as the potential toxicity associated from increased uptake in the brain. In vitro nasal casts and imaging studies have been instrumental in understanding intranasal deposition. Additi onal learnings from in silico models is also advancing the understanding of targeted nasal drug delivery.
Key Message
Intranasal targeted delivery shows promises for vaccine administration and CNS therapies. An understanding of formulation optimization via mucoadhesives and nanoparticulate systems may further advance these treatment modalities.
Introduction
Throughout the late twentieth century, intranasal medications focused on locally acting indications such as allergic rhinitis. Recently, the landscape has shifted to systemic treatments such as rescue medications. Examples of these life-saving drugs are naloxone, glucagon and midazolam. As the industry evolves, directing deposition to specific regions of the nose has gained a focus. This review will highlight the advantages and challenges of targeted nasal drug delivery for nasal vaccines, central nervous system (CNS) applications and novel targeted compounds.
Nasal Anatomy
The physiological function of the nasal cavity is to warm and hum idify incoming air via the turbinates. The nose also serves as a defence mechanism designed to trap particles, viruses , and pollution to prevent them from causing harm. These protective measures work both for and against us from a drug delivery standpoint.
The first consideration in targeted delivery is overcoming anatomical features of the nasal cavity. The nasal cavity is a convoluted space designed to capture particles. As the airway narrows to 0.3cm 2 beyond the nasal valve, air flow also becomes turbule nt. This leads to significant deposition by inertial impaction in the anterior third of the nasal cavity. Since olfactory neurons are located the superior regions of the nose, targeted CNS drug delivery is a challenge due to anatomical barriers
The large surface area of the nasal cavity is highly vascularized and also contains immunocompetent cells. Systemic drug delivery is therefore possible due to the richness of blood vessels. Generally, systemic absorption in the nose occurs in the posterior two-thirds of the nasal cavity, which is lined with respiratory epithelium cells.
Cilia and mucus secreting goblet cells also line the nasal cavity , which is the second consideration in targeted delivery. As the cilia beat, mucus is swept to the back of the n asal cavity and eventually swallowed. A healthy adult clears the nasal cavity in 15 to 30 minutes. From a drug delivery standpoint, mucociliary clearance can become a barrier to drug absorption or interaction with dendritic cell.
Despite the physiological challenges above, there have been advancements in targeting delivery to specific regions of the nose.
Drug Delivery to the Lungs , Volume 32, 2021 - Julie D Suman, Ph.D. et al.
13
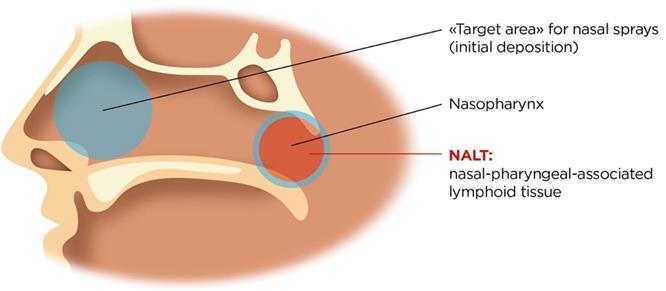
Vaccines
The Nasal Associated Lymphoid Tissue (NALT) is located in the back of the nasal cavity. Whereas many locally and systemically acting products ta rget the main nasal cavity, the NALT is the target for vaccine delivery (Figure 1). Dendritic cells are also present throughout the nasal epithelium and play a role in antigen presentation.
To reach the back of the nasal cavity, developers often consider dose volume and spray characteristics. Little research has been done to demonstrate the ideal do se volume, e.g. 100 µl vs 500 µl, for effective intranasal vaccination. Studies have shown that 200 µl doses or larger have a tendency to be cleared faster from the nose (1). However, for vaccination, this may be a desired attribute as the formulation quickly covers the NALT. There is also some thought that a narrow spray plume may lead to improved deposition towards the back of the nasal cavity. Yet others util ize a wide plume that may cover more surface area.
Vaccine formulators are also consider utilization mucoadhesives to increase retention. Increasing residence time may allow for improved uptake by immunocompetent cells. Traditional viscosity enhancing excipients are considered here. In addition, cationic excipients can play a dual role. In addition to adhering to mucus, cationic polymers may also act as an adjuvant.
CNS Drug Delivery
Drug delivery to the brain has always been a challenge due to the protective blood brain barrier (BBB). Lipophilic, small molecules (< 400 Da) have been show to reach the CNS by diffusion from the system ic circulation (2). However, large molecules and hydrophilic molecules often require a receptor or carrier mediated approach. To overcome transport issues, the “nose to brain’ route is often considered.
Olfactory neurons that penetrate superior regions of the n asal cavity offer a direct connection to the CNS. As noted above, deposition in this region is limited to anatomical barriers. Some of key drivers to shift deposition to this region include smaller droplets, decreasing droplet velocity and altering the administration angle and/or depth of insertion. In vitro studies in nasal casts (Figure 2) have demonstrated that a 5 mm increase in depth of insertion into the nostril can improve olfactory deposition by 30%.
Drug Delivery to the Lungs , Volume 32, 2021 - Targeted Nasal Drug Delivery – for Nose, Body and Brain
Figure 1 - Nasal deposition targets. Intranasal vaccines delivery target is the NALT.
14
While increasing deposition in the target area may increase CNS uptake, additional formulation optimization may be needed to improve CNS bioavailability beyond the reported 1% in man. Mucoadhesives and viscosity enhancing agents have been considered to improve retention in the olfactory region. Another strategy is utilization of nanoparticles.
Intranasal nanoformulations include, but are not limited to, nanoemulsions, PLGA nanoparticles and dendrimer-conjugate nanoparticles (2). Many of these are being investigated in preclinical models. While the size of these particles may allow greater penetration into the brain, local brain toxicity associated with these particulate systems is still being evaluated.
Novel Targeted Applications
A deeper understanding on nasal physiology such as neuronal pathways , chemosensors and lymphatic drainage may open the door to alternative targeted pathways. A commercial example is recently approved varenicline solution (Tyrvaya TM, Oyster Point Pharma), which is proposed to activate the trigeminal parasympathetic pathway (3). Targeting this route via receptors in the nose improves tear film homeostasis and basal tear film production resulting in symptom relief from dry eye disease.
Chemosensors located near the nasal septum may play a role in communication with the brain. An investigative class of synthetic neuroactive steroids (pherines) signal a neuronal response to by-pass the BBB. The nerve signals eventually reach the amygdala via the limbic system to cause a rapid antidepressive and anti-anxiety effect (4) The nasally administered compound, PH94B (VistaGen Therapeutics, Inc.), is currently Phase 3 clinical trials.
Assessing Targeted Nasal Delivery
In vitro nasal casts and in vivo deposition studies remain the most common tools to assess deposition. There are limitations in both these modalities. Cast models are great for understanding the initial s ite of drug deposition. However, these models are static and do not address mucocilliary clearance making it difficult assess retention time and formulation affects. In vivo studies, such as gamma scintigraphy, can assess deposition and mucociliary clearance if done properly. However, these studies do not address uptake by specific receptors.
To address these limitations, there attempts to develop in silico models that predict deposition and subsequent clearance (5, 6). However, these no widely accepted gold standard for these models. Nonetheless, utilization of these predictive models may help to advance targeted nasal drug delivery.
Conclusions
Targeted nasal drug delivery may represent the future for specific compou nds to treat unmet CNS diseases as well as successful intranasal vaccination. The nasal cavity also contains chemoreceptors and other neural pathways that can unlock treatments for ailments such as anxiety and dry eye disease. Overcoming mucociliary clearance pathways and optimizing deposition is key t o magnify the effectiveness of these compounds. Additional research is needed to understand the impact of mucoadhesives, dose volume, and nanoparticle technology to maximize therapeutic response. In addition, predictive models to facilitate these investigations are also necessary.
References
Journal articles [1], Chapters in books [2], Meeting abstracts [3]
[1] Harris A S, Hedner P, Vilhardt H: Nasal administration of desmopressin by spray and drops , J Pharm Pharmacol 1987; 39 (11): PP 932-934.
[2] Islam S UI, Shehzad A, Ahmed M B, Lee Y P: Intranasal Delivery of Nanoformulations: A Potential Way of Treatment for Neurological Disorders, Molecules 2020; 25 (8):1929.
[3] Vollmer, W D, Paauw J, Chiu K H, Nau, J: Efficacy and safety of OC-01 (Varenicline) Nasal Spray on Signs and Symptoms of Dry Eye Disease: the ONSET-2 Phase 3 Randomized Trial, Opthalmology 2021, online ahead of print.
[4] Monti L and Liebowitz M R: Neural circuits of anxiolytic and antidepressant pherine molecules , CNS Spectr. 2020; 23: pp1-7.
Drug Delivery to the Lungs , Volume 32, 2021 - Julie D Suman, Ph.D. et al.
Figure 2. In vitro nasal cast deposition of a solution administered at 45° orientation, 5° angle from center wall (septum) and two depths of insertion (5 and 10mm).
15
[5] Rygg A, Hindle M, Longest W P: Linking Suspension Nasal Spray Drug Deposition Patterns to Pharmacokinetic Profiles: A Proof-of-Concept Study Using Computational Fluid Dynamics, J Pharm Sci 2016; 105(6): pp 1995-2004.
[6] Basu, S, Computational characterization of inhaled droplet transport to the nasopharynx , Scientific Reports 2021, 11:pp 1–13.
Drug
to the Lungs ,
Drug
and
Delivery
Volume 32, 2021 - Targeted Nasal
Delivery – for Nose, Body
Brain
16
Nebulizers and COVID-19: Aerosol Generation vs. Aerosol Dispersion
Rajiv Dhand, MD, FCCP, FACP, FAARC, FRSM, ATSF
Division of Pulmonary and Critical Care Medicine
Professor and Wahid T. Hanna, MD Endowed Chair of Medicine
Associate Dean of Clinical Affairs
Graduate School of Medicine
University of Tennessee Health Science Center, Knoxville, TN
INTRODUCTION
Severe acute respiratory syndrome coronavirus 2 (SARS -CoV-2), the virus responsible for the global pandemic of coronavirus disease 2019 (COVID -19), has afflicted more than 245 million people worldwide and caused more than 5 million deaths (1). COVID -19 primarily affects the respiratory tract and infected persons generate respiratory droplets and aerosols containing the virus that transmit the infection to susceptible hosts (2). Patients with COVID-19 need inhaled therapies, either for pre-existing respiratory diseases or because of new onset respiratory distress and hypoxemia in patients with no previous pulmonary problems. Aerosolized therapies increase part icle concentrations in the vicinity of patients receiving such treatments (3, 4). Inhalers (pMDIs, DPIs and SMIs) have a very low risk of contamination and the risk of spreading infection with those devices is largely due to “bioaerosols” generated by the patient during breathing, speaking, coughing or sneezing (2,5,6). In contrast, nebulizers, especially those that are operated continuously, release “fugitive emissions” that could remain in the indoor environment (7, 8) (Figure 1).
A
a small amount
short distances before evaporation. B shows a burst of
during procedures
g such as suctioning, intubation, or bronchoscopy. In C, administration of therapeutic aerosols by nebulizer, noninvasive ventilation, or use of high -flow nasal cannula could disperse aerosols from the patient (bio -aerosols) to a greater distance. (Reproduced from Reference #2)
Fugitive emissions generated during nebulization are composed of a mixture of aerosol generated by the nebulizer (medical aerosol) and bioaerosols exhaled by the patient (8,9). Because jet nebulizer operation requires a gas flow of 6 to 8 L/min, use of nebulizers has the potential to further disperse virus particles generated by infected individuals in the environment. Dispersion of bio -aerosols and stimulation of cough during nebulizer treatment could spread infection to susceptible hosts in the vicinity ( 10,11). These concerns severely limited nebulizer use since the early days of the COVID -19 pandemic.
Drug Delivery to the Lungs , Volume 32, 2021 - Rajiv Dhand, MD, FCCP, FACP, FAARC, FRSM, ATSF
Figure 1: Difference between aerosol “generating” versus aerosol “dispersing” procedures.
shows
of aerosols generated during normal breathing travel
aerosols generated
that provoke coughin
17
ALTERNATIVES TO NEBULIZERS
The use of pMDIs and spacers has been suggested as an alternative to nebulizer therapy (11, 12). A significant proportion of patients without previous history of respiratory disorders are unaccustomed to using hand-held inhalers correctly and therefore may not derive the maximum benefits from this treatment method. Patients with a history of respiratory diseases with poor inhalat ion-actuation coordination, inadequate inspiratory effort, or other comorbid physical or mental/cognitive disabilities may also be deprived of the full treatment benefits from medication delivered by hand -held inhalers (13). Inadequate treatment can result in the loss of disease control and exacerbations that lead to disease progression, therefore increasing the likelihood those patients will require emergency care, longer hospital stays, and other invasive procedures, such as endotracheal intubation, that increase aerosol exposure risks and further add to the possibility of SARS -CoV-2 exposure by patients and hospital staff (14). In children, nebulizers are most commonly employed for inhalation therapy and use of nebulizers allows administration of higher doses of medication as well as co-administration of compatible drug mixtures (15). Moreover, several treatments for respiratory disorders, such as bronchodilators, inhaled corticosteroids, antibiotics, prostacyclin and its analogs, and mucolytics, are admi nistered by nebulization (16). Avoiding nebulizer use altogether limits therapeutic options for patients who need such therapies. Thus, the concerns about using nebulizers in patients with COVID -19 must be balanced with the risk associated with avoiding th eir use which could jeopardize the health and well -being of patients as well as Health Care Providers (HCPs).
At present, there are no conclusive data showing that nebulizers increase the transmission of acute respiratory infections from a real-world perspective (8,9). Transmission of infection early on in the SARSCoV-2 pandemic could be attributed to the lack of adequate personal protective equipment by HCPs and other procedural confounders (17). The influence of nebulizers in dispersing aerosols in the environment has been investigated with simulation experiments by several investigators (3, 4, 10, 1820). In these studies, droplet dispersion was demonstrated in the environment after nebulization of saline or live attenuated influenza virus(3, 4, 18-20). While using smoke to simulate dispersion of aerosols, the exhaled air dispersion distance was found to be greater with nebulization than with a simple oxygen mask and noninvasive ventilation (3). As such, nebulization was considered among other aerosol generating procedures (AGPs) (21, 22,23). Due to concerns that aerosol generated by the nebulizer might carry virus to the surrounding environment, especially with reports of SARS -CoV-2 being viable in aerosols for up to 3 hours (24), several clinical s ocieties made recommendations against the use of nebulizers during the COVID-19 pandemic (25,26). However, guidelines from other expert groups, such as NICE in UK, NERVTAG and The Centers for Disease Control and Prevention (CDC) recommend continued use of nebulizers because the aerosol generated by nebulizers has not been shown to contain infectious particles (27- 29).
DIFFERENCES IN FUGITIVE AEROSOL EMISSIONS WITH VARIOUS NEBULIZERS AND INTERFACES
Li and colleagues conducted a study in 9 healthy volu nteers who were given 3 mL saline with a small volume nebulizer (SVN) or vibrating mesh nebulizer (VMN) with a mouthpiece, a mouthpiece with an exhalation filter, an aerosol mask with open ports for SVN and a valved facemask for VMN, and a facemask with a scavenger (Exhalo) in random order (30). Five of the participants received treatments using a face tent scavenger (Vapotherm) and a mask with exhalation filter with SVN and VMN in a random order. They found that SVN produced higher fugitive aerosol concen trations than VMN, while facemasks generated higher aerosol concentrations than mouthpieces. Adding an exhalation filter to the mouthpiece or a scavenger to the facemask reduced aerosol concentrations for both SVN and VMN. Vapotherm scavenger and filter facemask reduced fugitive aerosol as effectively as a mouthpiece with an exhalation filter (30). This study provides guidance for reducing fugitive aerosol emissions from nebulizers in clinical practice.
Jain and coworkers performed a pilot clinical study u sing scintigraphy to investigate the dispersion pattern of technetium (Tc) radiolabeled exhaled droplets during nebulization with a jet nebulizer and compressor (31). They reported that nebulizer use did not affect the dispersion of respiratory aerosols in both near-zone (within 1 foot on each side) and far -zone (1.5 feet on either side and 2 feet in front) during tidal breathing. In agreement with previous studies, they found that both coughing and sneezing cause distant dispersion of aerosol in far -zone, nearly 4-6 fold higher than tidal breathing under normal conditions. The results of Jain and colleagues suggest that nebulization per se has a clinically
Drug Delivery to the Lungs , Volume 32, 2021 - Nebulizers and COVID-19: Aerosol Generation vs. Aerosol Dispersion
18
insignificant role in producing fugitive emissions and dispersion of exhaled aerosols. These findin gs provide assurance that nebulizer therapy has a limited role in transmission of Covid -19 or other droplet borne infections unless the nebulizer solution induces coughing or sneezing when inhaled (31).
Given the absence of any conclusive data that link ne bulized treatments to the transmission of SARSCov-2, most international societies (8,27,28) and CDC (29) have not advised against the use of nebulizers during the Covid pandemic. Recommended technique for using nebulizers during the COVID19 pandemic in the hospital is shown in Table 1.
MITIGATING RISK OF TRANSMITTING INFECTION WITH NEBULIZERS
Independent of the nebulizer type used, a risk of bio -aerosol dispersion exists in case of contamination of the reservoir while loading the medication loading, whi ch need to be performed using aseptic techniques. A mouthpiece should be preferred over a face mask to improve treatment efficiency and reduce fugitive emissions because a mouthpiece does not force aerosols out of the interface during therapy (8). Furthermore, placing a filter on the nebulizer’s outlet has been found to reduce fugitive emissions and exposure of HCPs to aerosol medications (4,30,32). An exhalation filter attached to the nebulizer has been shown to reduce exhaled aerosol droplets between 0.06 to 0.1 µm in size by 98% (33). In summary, jet or mesh nebulizers should be used with a mouthpiece and a filter attached to the exhalation port of the nebulizer could effectively reduce emission of exhaled aerosol droplets (Figure 2).
CONCLUSION
Apprehension that nebulizers could increase transmission of SARS -CoV-2 infection has severely limited their use in clinical practice. Evidence to support increased risk of SARS -CoV-2 by nebulizer treatments is inconclusive and is based mainly on experiment al and simulation studies. However, clinicians should exercise caution and protect themselves from SARS -CoV-2. Some measures to mitigate spread of infection include using a mouthpiece rather than a mask for inhalation of the nebulized medication and placement of a filter on the exhalation port of the nebulizer and instructions to the patient to seal their lips tightly around the mouthpiece during inhalation and exhalation. Other considerations include using a breath synchronized nebulizer that only genera tes an aerosol during inhalation to minimize the release of medical aerosols or employing vibrating mesh nebulizers in place of jet nebulizers. Health care workers are advised to limit the number of people in the room and stay two meters away from the infected patient during procedures that provoke coughing or sneezing. Bystanders and health care professionals should wear N95 or other respirators, in addition to eye protection in rooms where nebulizer treatments are being administered. Such measures could m inimize spread of aerosols in the environment and avoid close and prolonged exposures to patients with COVID -19 during nebulizer treatments.
Drug Delivery to the Lungs , Volume 32, 2021 - Rajiv Dhand, MD, FCCP, FACP, FAARC, FRSM, ATSF
Figure 2: Use of expiratory filters and use of mouthpieces with either jet or vibrating mesh nebulizers is recommended to reduce aerosol dispersion
19
References
1. World Health Organization. WHO Coronavirus dashboard. Available at https://covid19. who.int/. Accessed Oct 8, 2021.
2. Dhand R, Li J. Coughs and sneezes: their role in transmission of respiratory viral infections, including SARS -CoV-2. Am J Respir Crit Care Med. 2020;20:651–659.
3. Simonds AK, Hanak A, Chatwin M, Morrell M, Hall A, Parker KH, et al. Evaluation of droplet dispersion during noninvasive ventilation, oxygen therapy, nebuliser treatment and chest physiotherapy in clinical practice: implications for mana gement of pandemic influenza and other airborne infections. Health Technol Assess 2010;14:131–172.
4. McGrath JA, O’Sullivan A, Bennett G, O’Toole C, Joyce M, Byrne MA, et al. Investigation of the quantity of exhaled aerosols released into the environment during nebulisation. Pharmaceutics. 2019;11(2):75.
5. Cole EC, Cook CE. Characterization of infectious aerosols in health care facilities: an aid to effective engineering controls and preventive strategies. Am J Infect Control 1998;26:453 -464.
6. Edwards DA, Man JC, Brand P, Katstra JP, Sommerer K, Stone HA, Nardell E, Scheuch G. Inhaling to mitigate exhaled aerosols. Proc Natl Acad Sci U S A. 2004;101(50):17383- 17388.
7. Reychler G, Vecellio L, Dubus JC. Nebulization: a potential source of SARS -CoV-2 transmission. Respir Med Res 2020;78:100778
8. Fink JB, Ehrmann S, Li J, Dailey P, McKiernan P, Darquenne C, Martin AR, Rothen -Rutishauser B, Kuehl PJ, Häussermann S, MacLoughlin R, Smaldone GC, Muellinger B, Corcoran TE, Dhand R. Reducing Aerosol -Related Risk of Transmission in the Era of COVID-19: An Interim Guidance Endorsed by the International Society of Aerosols in Medicine. J Aerosol Med Pulm Drug Deliv. 2020 Dec;33(6):300-304. doi: 10.1089/jamp.2020.1615. Epub 2020 Aug 12.
9. Scheuch G. Breathing Is Enough: for the spread of Influenza Virus and SARS-CoV-2 by breathing only. J Aerosol Med Pulm Drug Deliv. 2020 Aug;33(4):230-234. doi: 10.1089/jamp.2020.1616. Epub 2020 Jun 17.
10. Tang JW, Kalliomaki P, Varila TM, Waris M, Koskel H. Nebulisers as a potential source of airborne virus. J Infect. 20 20; 81: 647–679. Published online 2020 May 15. doi:
11. Amirav I, Newhouse MT. COVID-19: Time to embrace MDI+ valved-holding chambers!.J Allergy Clin Immunol. 2020 Aug;146(2):331. doi: 10.1016/j.jaci.2020.04.046.
12. Ari A. Practical strategies for a safe and effective delivery of aerosolized medications to patients with COVID-19. Respir Med 2020;167:105987.
13. Dhand R, Dolovich M, Chipps B, Myers TR, Restrepo R, Farrar JR. The role of nebulized therapy in the management of COPD: evidence and recommendations. COPD. 2012 Feb;9(1):58-72. doi: 10.3109/15412555.2011.630047.
14. Tran K, Cimon K, Severen M, Pessoa-Silva CL, Conly J. Aerosol generating procedures and risk of transmission of acute respiratory infections to healthcare workers: a systematic review. PloS One 2012;7:e35797
15. Shen K, Hong J, El Beleidy A, Furman E, Liu H, Yin Y, Cano -Salas MDC, AlJassim FM, Al-Shammari N, Lochindarat S, Dieu Thuy NT. International expert opinion on the use of nebulization for pediatric asthma therapy during the COVID -19 pandemic. J Thorac Dis. 2021 Jul;13(7):3934- 3947. doi: 10.21037/jtd-21-841.
16. Hess D, Dhand R. Delivery of inhaled medication in adults. Available at https://www.uptodate.com/contents/delivery -ofinhaled-medication-inadults?search=delivery%20of%20inhaled%20medication%20in%20adults§ionRank=1&usage_type=default&anchor. Accessed 10.10.2021.
17. Heinzerling A, Stuckey MJ, Scheuer T, Xu K, Perkins KM, Resseger H, Magill S, Verani JR, Jain S, Acosta M, Epson E. Transmission of COVID-19 to health care personnel during exposures to a hospitalized patient. MMWR Morb Mortal Wkly Rep. 2020 Apr 17;69(15):472-476. doi: 10.15585/mmwr.mm6915e5.
18. Hui DS, Chan MT, Chow B. Aerosol dispersion during various respiratory therapies: a risk assessment model of nosocomial infection to health care workers. Hong Kong Medical Journal 2014;20 Suppl 4:9 -13.
19. Hui DS, Chow BK, Chu LCY, Ng SS, Hall SD, Gin T, Chan MTV. Exhaled air and droplet dispersion during application of a jet nebulizer. Chest . 2009;135:648-53.
20. Blood TC, Jr., Perkins JN, Wistermayer PR, Krivda JS, Fisher NT, Riley CA, Ruhl DS, Hong SS. COVID -19 airway management isolation chamber. Otolaryngol Head Neck Surg. 2021;164; 74- 81.
21. Chan VW, Ng HH, Rahman L, Tang A, Tang KP, Mok A, et al. Transmission o f severe acute respiratory syndrome coronavirus 1 and severe acute respiratory syndrome coronavirus 2 during aerosol -generating procedures in critical care: A systematic review and meta-analysis of observational studies. Crit Care Med. 2021;49(7):1159 -1168
22. Judson SD, Munster VJ. Nosocomial transmission of emerging viruses via aerosol -generating medical procedures. Viruses. 2019;11(10):940.
23. Jackson T, Deibert D, Wyatt G, Durand-Moreau Q, Adisesh A, Khunti K, et al. Classification of aerosol -generating procedures: a rapid systematic review. BMJ Open Respir Res. 2020;7(1):e000730.
24. van Doremalen N, Bushmaker T, Morris DH, Holbrook MG, Gamble A, Williamson BN, et al. Aerosol and surface stability of SARS-CoV-2 as compared with SARS-CoV-1.
Drug Delivery to the Lungs , Volume 32, 2021 - Nebulizers and COVID-19: Aerosol Generation vs. Aerosol Dispersion
20
25. Halpin DMG, Criner GJ, Papi A, Singh D, Anzueto A, Martinez FJ, et al. The 2020 GOLD science committee report on COVID-19 and chronic obstructive pulmonary disease. Am J Respir Crit Care Med. 2021;203(1):24 -36.
26. Respiratory Care Committee of Chinese Thoracic S ociety. Expert consensus on preventing nosocomial transmission during respiratory care for critically ill patients infected by 2019 novel coronavirus pneumonia. Zhonghua Jie He He Hu Xi Za Zhi. 2020;43(4):288-296.
27. National Institute for Health and Care Excellence, COVID-19 rapid guideline: severe asthma (NICE guideline [NG166]) 2020.https://www.nice.org.uk/guidance/ng166.
28. British Thoracic Society, COVID-19: information for the respiratory community. Advice about the safety of nebuliser use. https://www.brit-thoracic.org.uk/about-us/covid-19-information-for- the-respiratory-community.
29. CDC, Coronavirus Disease, 2019. Interim US Guidance for risk assessment and public health management of healthcare personnel with potential exposure in a healthcare setting to patients with coronavirus disease 2019 (COVID-19) April 15, 2020. Available at https://www.cdc.gov/coronavirus/2019-ncov/hcp/guidance-risk-assessment-hcp.html
30. Li J, Harnois L, Alolaiwat A, Fink JB, Dhand R. Efficacy of various interfaces i n reducing fugitive emissions from nebulizers: a randomized crossover trial in healthy volunteers. Respiratory Care. Accepted for publication
31. Jain GK, Seth S, Chandra N, Gogtay J, Lopez, M, More S, Dhand R. Dispersion of radiolabeled exhaled droplets d uring tidal breathing, coughing, sneezing, and jet nebulization in healthy subjects. Submitted for publication
32. Wittgen BP, Kunst PW, Perkins WR, Lee JK, Postmus PE (2006). Assessing a system to capture stray aerosol during inhalation of nebulized liposomal cisplatin. J Aerosol Med;19:385-91.
33. Schuschnig U, Ledermuller R, Gramann J. Efficacy of the PARI filter-valve set to prevent environmental contamination with aerosol during nebulizer therapy. Preprint July 2020. : https://www.researchgate.net/publication/342987954
JET NEBULIZER USE IN HOSPITAL
Before Entering the Room
During the pandemic treat every patient as potentially infected because asymptomatic infected patients can shed virus
Put on PPE for aerosol and droplet protection ( N-95mask, face shield, gloves, and gown). Use additional PPE such as PAPRs, if available, for high risk procedures
Wash hands and put on fresh gloves (preferably use double gloves)
After Entering the Room
Use proper aseptic technique to avoid contamination of aerosol reservoirs and medication
Perform nebulization in a negative pressure room fo r COVID-19 patients, or rooms with high air exchange rates (6–12 air exchanges/hour)
Have tissues available and face mask to cover the patient’s mouth during coughing or sneezing; discard used tissue immediately
Filling the Nebulizer
Assemble apparatus
Add medication to nebulizer cup
Use a fill volume of 3 to 6 mL
Attach a compressor or a pressurized gas supply (eg, compressed air or oxygen) with a flow of 6 to 8 L/min. If using a compressor, ensure that it is compatible and recommended for us e with the nebulizer brand#
Drug
to the
,
-
MD,
FACP, FAARC, FRSM, ATSF
Delivery
Lungs
Volume 32, 2021
Rajiv Dhand,
FCCP,
Table 1: General Procedures for Nebulizer Administration during COVID -19 Pandemic
21
Drug Delivery to the Lungs , Volume 32, 2021 - Nebulizers and COVID-19: Aerosol Generation vs. Aerosol Dispersion
Use a mouthpiece with a filter attached to the exhalation port
Maintain distance of 3 to 6 feet or more from patient
Try to stay at least 1 foot (dispersion distance with medical aerosol) away from the patient’s airway
Administration of Nebulizer Treatment
Have patient sitting up or partially supine in a comfortable position (there is a risk of spillage if the patient is lying flat)
Instruct patient to use a slow breathing pattern with a normal tidal volume and an occasional de ep breath (there is no need to take deep breaths)
Keep the nebulizer upright during the treatment
Periodically tap nebulizer to return impacted droplets to reservoir
Continue treatment for a few minutes (~5 to 12 minutes)**and stop when the nebulizer sputt ers despite tapping
Nebulizer Cleaning and Disinfection
Discard any remaining solution from the medication cup
Rinse with soapy tap water
Allow to air dry
Store the plastic tubing and medication chamber in a plastic bag between uses
Change nebulizer daily
# Matching a nebulizer with a compressor is important for optimal performance and to ensure delivery of an adequate therapeutic dose.
** Time for the treatment may vary depending on the type of nebulizer, volume of solution and air flow rate.
22
Pat Burnell Young Investigator Award
Conference Papers
23
24
Investigating the Effects of Fluid Composition on Bacterial Aerosol Production
Mathura Thirugnanasampanthar1, Rod G Rhem2, Myrna B Dolovich2,3 & Zeinab Hosseinidoust1,4,5
1McMaster University, Department of Chemical Engineering, 1280 Main Street West, Hamilton, ON, L8S 4L8, Canada
2St. Joseph’s Healthcare, Firestone Research Aerosol Laboratory, 50 Charlton Ave East, Hamilton, ON, L8N 4A6, Canada
3McMaster University, Faculty of Health Sciences, Department of Medicine, 1280 Main Street West, Hamilton, ON, L8S 4K1, Canada
4McMaster University, School of Biomedical Engineering, 1280 Main Street West, Hamilton, ON, L8S 4K1, Canada
5McMaster University, Micheal DeGroote Institute for Infectious Disease Research, 1280 Main Street West, Hamilton, ON, L8S 4K1, Canada
Summary
Airway lining mucus (ALM) is a complex hydrogel composed of 98% (w/v) water and 2% (w/v) solids content.1 Biological aerosols, including infectious aerosols, are believed to originate from shear -stress induced breakup of the ALM. Understanding how the composition and viscoelastic properties of the ALM affects infectious aerosol production can provide valuable insight into airborne tran smission mechanisms. In this study we examined the effect of fluid composition on bacterial aerosol production Solutions containing different concentrations of peptone water, a microbial growth medium rich in protein content, were used to suspend the bacterial pathogen, Staphylococcus aureus (S. aureus). Peptone water solutions were aerosolized using the single je t Blaustein Atomizer module. Polydisperse bacterial aerosols were size fractioned using a viable six -stage cascade impactor. Size and counts of bacterial aerosols generated from the three peptone water solutions were compared. Mean particle size of bacterial aerosols increased as the concentration of the peptone solution was increased from 1.5% (w/v) to 5.0% (w/v) and 10% (w/v) peptone content. Additionally, the number of bacterial aerosols generated from a 1.5% (w/v) peptone water solution was significantl y greater as compared to the number of aerosols produced from a 10% (w/v) peptone water solution.
Key Message
Bacterial aerosols were generated from solutions formulated to mimic the solids concentration of the ALM. Significant changes in size and quantity of bacterial aerosols were observed as the concentration of the peptone water solution was altered, demonstrating the influence of fluid composition on the production of pathogen containing aerosols.
Introduction
A superspreader transmission event is a phenomenon where a small fraction of infected individuals account for a disproportionately high number of transmission events within a population. 2 Studies of superspreader events have produced the 20/80 rule, where 20% of infecte d individuals cause 80% of all transmission events.2,3 Individuals with active respiratory infections capable of producing high quantities of infectious aerosols may exhibit greater transmission probability. 3 Exhaled bioaerosol quantification studies indicate airborne transmission may follow a superspreader distribution pattern. 3–5 Within a group of 194 healthy humans participants, approximately 18% of individuals were shown to produce an extremely high number of bioaerosols, accounting for 80% of total aerosol production by the group.3,4 Furthermore, changes to surface tension properties of the ALM, induced through saline or surfactant delivery, transiently attenuated or exacerbated bioaerosol production from human participants.4,5 Relating changes in ALM with changes in infectious aerosol production can provide valuable insights into the mechanism of airborne transmission.
Evidence exists that physiological factors that alter the ALM leading to changes in aerosol production, can impact transmissibility of respiratory diseases. 1,3 For instance, the solids concentration of the ALM is altered with the onset and severity of muco-obstructive diseases.6 Solids concentration of the mucus layer, described as the dry weight percentage per given volume, is made up of a mixture of salts, lipids, globular proteins, mucin biopolymers and cellular debris. 1 While sputum samples from healthy individuals contain between 1.5 – 2.5% (w/v) solids concentration, samples from individuals with cystic fibrosis contain between 5 – 9% (w/v) solids concentration.6 Thus, physiological differences in surface tension and viscoelastic properties of the ALM resulting from muco -obstructive lung diseases can contribute to variability in bioaerosol production. 2,4
Drug Delivery to the Lungs , Volume 32, 2021 - Mathura Thirugnanasampanthar et al.
25
Production
In this study we investigated the effect of peptone water concentration on bacterial aerosol production by characterizing size and quantity of bacterial aerosols. Peptone water solutions were formulated to reflect physiologically relevant airway mucus solids concentrations. A 1.5% (w/v) peptone water solution was used to simulate the solids concentration in healthy A LM, whereas 5% (w/v) and 10% (w/v) peptone water concentrations were used to mirror mucus solids concentrations in moderate and severe cases of muco-obstructive lung disease, respectively. 1
Experimental Methods and Materials
Media Preparation: Tryptic soy broth was prepared by dissolving 30 g/L tryptic soy broth (BD Bacto™) in deionized water. Tryptic soy agar (TSA) media was prepared by dissolving 30 g/L tryptic soy broth (BD Bacto™) and 15 g/L agar (Fisher BioReagents™) in deionized water. P eptone water solutions were prepared by dissolving 15 g/L, 50 g/L, and 100 g/L of peptone water (Thermo Scientific™ CM0009) in Milli-Q® water. All solutions were sterilized by autoclaving at 121°C for 20 minutes.
Bacterial Culture Preparation: A 3 mL volume of tryptic soy broth was inoculated from a glycerol stock of Staphylococcus aureus subsp. aureus Rosenbach 6538™ stored at -80°C. Bacteria was cultured for 20 – 24h at 37°C in a shaking incubator set to perform 180 orbital rotations per minute. Appropria te volumes of bacterial culture were added to peptone water solutions to achieve a concentration of 5x10 4 CFU/mL. Solution concentrations were verified by plating 100 µL of twice diluted sample on TSA plates in triplicates. Plate colony counts were performed after 20 – 24 h of incubation at 37°C.
Nebulization and Size Fractioning of Bacterial Aerosols : Figure 1A depicts the experimental test setup used to generate and size fraction bacterial aerosols. The test setup was constructed based on specifications outlined in the ASTM International standard F2101 -19.7 Polydisperse bacterial aerosols were generated with the Blaustein Atomizer Single -Jet Model (CH Technologies ARGBLM2) operated in atomizer mode using the 10-40 single jet expansion plate (CH Technologies ARGBLM0031). Bacterial solution was dispensed from a 5 mL syringe (BD Luer -Lok™ Tip) at a rate of 200 µl/min controlled using a syringe pump (Fisherbrand™14831200). Air flow through the Blaustein nebulizer was maintained at 1.5 LPM, controlled using an IMI NORGREN pressure gauge and monitored using a TSI flow meter (5300 Series). A downstream vacuum pump was used to draw air through the impactor at a rate of 28.3 LPM and was monitored using an OMEGA flow meter (FMA-A2317). The 6 Stage Viable Impactor (Tisch Environmental TE-10-800) was used to fraction bacterial aerosols into six aerodynamic size ranges: 0.65 – 1.1, 1.1 – 2.1, 2.1 – 3.3, 3.3 – 4.7, 4.7 – 7.0, and > 7.0 µm (Fig. 1A). Glass petri dishes (Corning® 3160-100 Pyrex®) containing 27 mL of TSA were inserted beneath each of the six stages of the impactor to collect aerosols through impaction (Fig. 1B). TSA collection plates were incubated in a static incubator at 37°C for 20 – 24 hours. Bacterial colonies were counted, and the positive -hole correction factor was applied to account for co-incidence error.8
Total Particle Counts = C1 + C2 + C3 + C4 + C5 + C6
1 6 = Impactor Stages; P = Stage cut off diameter (µm); C = Corrected colony counts as described by Macher et al 8
Results
The size of bacterial aerosols is based on the cut-off diameter (d50) of the stage on which it was collected. Impactor stages have the following cut-off diameters: 0.65, 1.1, 2., 3.3, 4.7, and 7.0 µm.8 Stage cut-off diameter (d50) describes a 50% collection efficiency for particles with the specified aerodynamic
Drug Delivery to the Lungs , Volume 32, 2021 - Investigating the Effects of Fluid Composition on Bacterial Aerosol
C1+C2+C3+C4+C5+C6
Mean Particle Size (µm) = P1∗C1+P2∗C2+P3∗C3+P4∗C4+P5∗C5+P6∗C6
Figure 1 – (A) Aerosol sampling apparatus; (B) Fractioning of bacterial aerosols by aerodynamic size.
A. B. 26
diameter.8 Aerodynamic diameter of a particle is based on its inertial properties, specifically the settling velocity in a fluid medium, such that airborne particles with different sizes, shapes, and densities can be compared 8 All references to particle size is based on the aerodynamic diameter determined using the six-stage cascade impactor. The mean size of bacterial aerosols is calculated from the fraction of aerosols collected on each of the six stages of the impactor. Mean particle size of bacterial aerosols generated from 1.5% (w/v), 5% (w/v) and 10% (w/v) peptone water solutions was found to be 3.23 ± 0.03 µm, 3.72 ± 0.05 µm, and 3.99 ± 0.04 µm, respectively (Fig. 2A). Total bacterial aerosols generated from 1.5% (w/v), 5% (w/v) and 10% (w/v) peptone water solutions was found to be 4053 ± 834, 2933 ± 284, and 2467 ± 478, respectively (Fig. 2B).
-way ANOVA followed by Tukey’s post-hoc test, *p<0.05, **p< 0.01, ***p<0.001, ****p<0.0001.
Bacterial aerosol fractions collected on each of the six stages of the impactor are shown in Figure 3A. The 7.0 µm cutoff diameter stage collected 8.03%, 13.42% and 17.53% of aerosols generated from 1.5% (w/v), 5% (w/v) and 10% (w/v) solutions, respectively (Fig. 3A). Similarly, the 4.7 µm cutoff diameter stage collected 19.03%, 25.06%, and 28.24% of aerosols generat ed from 1.5% (w/v), 5% (w/v) and 10% (w/v) peptone solutions, respectively (Fig. 3A). The 3.3 µm cutoff diameter stage collected 32.98%, 33% and 29.7% of aerosols generated from 1.5% (w/v), 5% (w/v) and 10% (w/v) solutions, respectively (Fig. 3A). The frac tion of aerosols collected on 4.7 µm and 7.0 µm cutoff diameter stages increased with peptone concentration (Fig. 3A). The opposite trend was observed for stages with 0.65, 1.1, and 2.1 µm cutoff diameters, where the collected fraction decreased as peptone water concentration increased (Fig. 3A). The 2.1 µm cutoff diameter stage collected 24.57%, 19.87%, and 18.09% of aerosols generated from 1.5% (w/v), 5% (w/v) and 10% (w/v) solutions, respectively (Fig. 3A). The 1.1 µm cutoff diameter collected 15.12%, 8.61% and 6.43% of aerosols generated from 1.5% (w/v), 5% (w/v) and 10% (w/v) solutions, respectively (Fig. 3A). Lastly, the 0.65 µm cutoff diameter stage collected 0.28%, 0.04%, and 0.01% of aerosols generated from 1.5% (w/v), 5% (w/v) and 10% (w/v) solutio ns, respectively (Fig. 3B).
Discussion
In this study we intended to answer whether changes in protein and salt concentrations influence bacterial aerosol production and if so, whether these changes alter airborne transmission potential. S.
Drug Delivery to the Lungs , Volume 32, 2021 - Mathura Thirugnanasampanthar et al.
Figure 2 - Effect of peptone water concentration on (A) mean aerodynamic size and (B) total particle counts of bacterial aerosols generated. Results from three replicate trials are presented. Results were analysed by one
Figure 3 - Effect of peptone water concentration on (A) aerodynamic size distribution and (B) cumulative distribution of bacterial aerosols. Data represented as mean ± SD (n = 3)
B. A. A. B 27
aureus containing aerosols were produced from peptone w ater solutions formulated to mimic physiologically relevant solids concentrations of the ALM. Significantly fewer bacterial aerosols were produced from 10% (w/v) peptone solutions as compared to 1.5% (w/v) peptone solution (Fig. 2B). Furthermore, the mean size of bacterial aerosols increased significantly with increase in peptone water concentration (Fig. 2A). Thus, changing the concentration of the peptone water solution produced significant changes in the quantity and size of bacterial aerosols. The sizes of bacterial aerosols produced through nebulization of peptone water solutions correlates well with sizes of pathogen containing aerosols identified in clinical studies. Lindsley et al. in a 2009 study used personal cascade samplers to collect airborne particles containing Influenza A RNA exhaled by patients at an urgent care clinic.9 Approximately 48% of Influenza A RNA was isolated from particles < 4.9 µm in size, while 32% of Influenza A RNA was isolated from particles < 1.7 µm in size. 9 Additionally, in the study by Tsay et al., particle sampling was performed in surgical and medical ICU areas to detect airborne bacterial pathogens. Bacterial pathogens were predominantly isolated from three size fractions of airborne particles: 1.1 – 2.1, 3.3 – 4.7, and > 7 µm.10 This demonstrates our system can generate pathogen containing aerosols of clinically relevant size ranges.9–11
Airborne transmission depends on the quantity as well as the size of infectious aerosols produced. 11,12 Particle size is the most important determinant of particle behaviour in the air and dictates the duration of time a particle remains airborne. 11,12 Larger infectious aerosols will have a shorter lifespan in the air due to faster settling velocities which in turn decreases the risk of airborne transmission. 11 Settling velocities of 7.5, 30 and 119 µm/sec were calculated for 0.5, 1 and 2 µm sized particles, respectively.12 Additionally, settling velocities of 746 and 2985 µm/sec were calculated for 5 and 10 µm sized particles, respectively.12 The different rates of settling means that while a 5 µm particle can remain airborne for 22 minutes, a 1 µm particle can remain airborne for over 9 hours before settling 1 meter in still air. 12 A greater percentage of bacterial aerosols generated from 1.5% (w/v) peptone water solution was collected on 0.65, 1.1, and 2.1 µm cutoff diameter stages in comparison to bacterial aerosols generated from 5% (w/v) and 10% (w/v) peptone water solutions (Fig . 3B). The opposite trend was observed for stages with 4.7 and 7.0 µm cutoff diameters which collected larger fractions of bacterial aerosols produced from 5% (w/v) and 10% (w/v) peptone water solutions (Fig. 3A). These results suggest that more of the finer aerosols generated from 1.5% (w/v) peptone water solution can remain airborne for longer which in turn increases the risk of transmission.
Conclusion
In this study, we have demonstrated that changing the concentration of the fluid produces significant changes in both the quantity and size of bacterial aerosols. Specifically, increasing the concentration produced fewer, larger bacterial aerosols, whereas decreasing the concentration produced smaller, more numerous bacterial aerosols. Thus, the transmissi on potential of bacterial aerosols was effectively altered by changes in solution concentration.
References
[1] Boucher RC. Muco-obstructive lung diseases. New England Journal of Medicine. 2019 May 16;380(20):1941 -53.
[2] Lloyd-Smith JO, Schreiber SJ, Kopp PE, Getz WM. Superspreading and the effect of individual variation on disease emergence. Nature. 2005 Nov;438(7066):355-9.
[3] Edwards DA, Ausiello D, Salzman J, Devlin T, Langer R, Beddingfield BJ, Fears AC, Doyle -Meyers LA, Redmann RK, Killeen SZ, Maness NJ. Exhaled aerosol increases with COVID-19 infection, age, and obesity. Proceedings of the National Academy of Sciences. 2021 Feb 23;118(8).
[4] Edwards DA, Man JC, Brand P, Katstra JP, Sommerer K, Stone HA, Nardell E, Scheuch G. Inhaling to mitigate exhaled bioaerosols. Proceedings of the National Academy of Sciences. 2004 Dec 14;101(50):17383 -8.
[5] Edwards D, Salzman J, Devlin T, Langer R. Nasal calcium -rich salts for cleaning airborne particles from the airways of essential workers, students, and a family in quarantine. Molecular Frontiers Journal. 2020 Sep 29:1-0.
[6] Hill DB, Vasquez PA, Mellnik J, McKinley SA, Vose A, Mu F, Henderson AG, Donaldson SH, Alexis NE, Boucher RC, Forest MG. A biophysical basis for mucus solids concentration as a candidate biomarker for airways disease. PloS one. 2014 Feb 18;9(2):e87681.
[7] ASTM. F2101-19 Standard Test Method for Evaluating t he Bacterial Filtration Efficiency (BFE) of Medical Face Mask Materials, Using a Biological Aerosol of Staphylococcus aureus. ASTM International. Ann. ASTM Standard. 2019.
[8] Macher JM. Positive-hole correction of multiple-jet impactors for collecting viable microorganisms. American Industrial Hygiene Association Journal. 1989 Nov 1;50(11):561-8.
[9] Lindsley WG, Blachere FM, Davis KA, Pearce TA, Fisher MA, Khakoo R, Davis SM, Rogers ME, Thewlis RE, Posada JA, Redrow JB. Distribution of airborne influenza virus an d respiratory syncytial virus in an urgent care medical clinic. Clinical Infectious Diseases. 2010 Mar 1;50(5):693-8.
[10] Tsay MD, Tseng CC, Wu NX, Lai CY. Size distribution and antibiotic-resistant characteristics of bacterial bioaerosol in intensive care unit before and during visits to patients. Environment International. 2020 Nov 1;144:106024.
[11] Fennelly KP. Particle sizes of infectious aerosols: implications for infection control. The Lancet Respiratory Medicine. 2020 Jul 24.
[12] Scheuch G. Breathing is enough: for the spread of influenza virus and SARS -CoV-2 by breathing only. Journal of Aerosol Medicine and Pulmonary Drug Delivery. 2020 Aug 1;33(4):230-4.
Drug Delivery to the Lungs , Volume 32, 2021 - Investigating the Effects of Fluid Composition on Bacterial Aerosol Production
28
An adaptable dual-chamber microfluidic platform to investigate Pseudomonas aeruginosa biofilm growth at the air-liquid interface under controlled hydro and aerodynamic flows
1 School of Mechanical Engineering, Faculty of Engineering, Macquarie University, Sydney, NSW, Australia
2 Woolcock Institute of Medical Research, Sydney, Australia.
3 Department of Biomedical Sciences, Faculty of Medicine, Health and Human Sciences, Macquarie University, Sydney, NSW, Australia
4 Department of Marketing, Macquarie Business School, Macquarie University, Sydney, NSW, Australia
Summary
Pseudomonas aeruginosa (P. aeruginosa) biofilm colonizing and growing in the human respiratory tract is a known cause of reduced antimicrobial response in several chronic respiratory diseases. Although numerous in vitro models have been developed to provide important insights about biofilm structure and promising treatments for biofilm-related infections, most models are still based on mono-interface culture. The handful of air-liquid interface (ALI) models developed, are incapable of manipulating the airflow dynamics, an essential feature to mimic different respiratory regions and disease conditions. The failure to reproduce the host environment may lead to misleading results. In this study we developed a dual-chamber microfluidic device and set up a dynamic platform capable of establishing an ALI model to closely mimick the lung environment. Using this platform, 48 h old P. aeruginosa biofilms were cultured, and their development studied as a function of nutrient supply conditions, in addition to aerodynamic shear forces. The biofilm samples were investigated in a cross-sectional study to compare their viable cell number, morphology, antibiotic susc eptibility to a model antiobiotic, ciprofloxacin hydrochloride (CIP), and biofilm matrix permeability.
Key Message
Our study shows that biofilms developed in nutrient-rich conditions are thicker, less permeable, and more resistant to antibiotics compared to those grown in nutrient-depleted conditions Under nutrientrich conditions, mechanical shear forces induced from airflow dynamics produced thinner and less permeable biofilms, but no apparent alternation in antibiotic susceptibility were observed Moreover, it was found that the minimum biofilm eradication concentration (MBEC) of CIP using our device was significantly higher than the conventional microtiter plate method. These findings indicate that using less physiologically relevant biofilm in vitro models could lead to an overestimation of drug efficacy , potentially leading to clinical failure
Introduction
Biofilms have been recognized as a form of antimicrobial resistance where the microbial communities adhere to surfaces and are encased within a self -produced extracellular polymetric substance (EPS) This biofilm feature enhances microbial tolerance to all sorts of adverse conditions including limited nutrients and high concentrations of antimicrobial agents such as biocides, antibiotic and antifungal compounds [1] The formation of biofilm starts with planktonic bacteria adhering to a surface forming irreversible attachments. Subsequently, anchored bacteria start to multiply and produce EPS, gradually forming a complex 3D biofilm structure that will mature over time, finally followed by the dispersal of cells from the biofilm colony to colonise other areas [2] It has been estimated that 65 - 80% of human infections are associated with biofilms, with P. aeruginosa biofilms being the major cause of nosocomial and ventilator-associated pneumonia and responsible for many chronic lung infections in individuals with reduced mucociliary clearance such as cystic fibrosis, chronic obstructive pulmonary disease and bronchiectasis Once established, biofilm infection in the lung is difficult if not impossible to eradicate [3]
Biofilm’s properties are not only determined by the genes of bacteria strains but also shaped by many external environmental factors. This includes surfaces, flow conditions and interfaces, which can be further categorized as an air-liquid interface (ALI), liquid-liquid interface, solid-liquid interface, and solidair interfaces. The biofilms proliferating in the lung environment should be modelled in an ALI environment with diverse conditions to simulate the different regions of the respiratory tract The majority
Drug Delivery to the Lungs , Volume 32, 2021 – Zhang Ye1,2 et al.
Zhang Ye1,2, Dina M. Silva2, Daniela Traini2,3, Paul Young2,4, Shaokoon Cheng1, Hui Xin Ong2,3
29
Drug Delivery to the Lungs , Volume 32, 2021 - An adaptable dual-chamber microfluidic platform to investigate Pseudomonas aeruginosa biofilm growth at the air-liquid interface under controlled hydro and aerodynamic flows
Title of Your Paper
of current in vitro biofilm research has been modelled as a solid-liquid interface (SLI) biofilm [4]; with only a few models available for culturing biofilm at the ALI [9, 10]. In addition, these models have been conducted in static nutrient-depleted conditions, and do not allow for flow manipulation of the air phase, failing to represent the physiological conditions of the respiratory system
To address this problem, our study presents an adaptable dual-chamber microfluidic device and set up a dynamic platform capable of establishing an ALI model, providing a controllable aerodynamic and hydrodynamic environment for biofilm culture to mimics the respiratory environment.
Experimental methods
Device fabrication: The adaptable dual-chamber microfluidic device has two Polydimethylsiloxane ( PDMS) (Dow Corning, USA) chips containing flow cells compartmentalized with an interchangeable membrane mechanically bonded with two plexiglass covers and silicon sheets using screw and nuts (Fig. 1 A). The design layout of the flow chamber is shown in Fig. 1 (B). The PDMS flow chamber is cast using 3-D printing microfluidic technique [5]

Figure 1. Microfluidic platform for culturing biofilm on ALI under dynamic conditions. (A) Schematic components and optical image of assembly of reversible bonding dual -chamber biofilm microreactor; (B) Schematic diagram of dual-chamber; (C) construction of dynamic platform setup.
Dynamic platform setup: The airflow is generated by an DC12. OV/370-02PM air pump (Makeblock, USA) and the filter sterilized before placing in the top chamber. The airflow rate is measured and altered by a valve control flowmeter. The Chemyx Fusion 200 syringe pump (Chemyx Inc., USA) is used to provide a continuous media (Cation-adjusted Mueller Hinton Broth, CAMHB) supply in the basal chamber.
Biofilm culture: P. aeruginosa (PAO1 ATCC 15692) inoculum with OD600 = 0.4 was prepared and injected into the top chamber and incubated at 37 °C for 2 h to allow bacteria attachment. After attachment, the experiments were conducted by culturing ALI biofilm in three setups: (1) Static condition- where a defined volume of broth (100 μL) was supplied to the basal chamber and stagnant air in the top chamber; (2) Hydrodynamic condition- where the broth was continuously infused into the basal chamber at a flow rate of 50 μL/h for the 48 h culture and stagnant air in the top chamber(τw=0); and (3) Aerodynamic condition- where the broth was continuously infused into the basal chamber at a flow rate of 50 μL/h for the 48 h culture while air was continuously flowing at a rate of 30ml/min (τw=0.3pa) in the top chamber.
Biofilm characterization: Biofilm viability was assessed via viable colony forming units (CFU) number of end-point samples. Biofilm morphology and spatial distribution were visualized using JMC-6000 NeoScopeTM Benchtop scanning electron microscopy (SEM) (JEOL, USA) and inverted FV 3000RS IX83 confocal laser scanning microscopy (CLSM) (Olympus FluoView, Janpan). The averaged thickness of biofilm was determined at 10 locations using Image J (National Institutes of Health and the Laboratory for Optical and Computational Instrumentation, University of Wisconsin , USA) PAO1 susceptibility to CIP was tested by exposing the biofilm to a range of CIP solutions ( 50, 200, 800 and1600 μg/mL) from the basal chamber for 6 h at 37 °C. The permeability of the biofilm matrix structure was evaluated using sodium fluorescein (flu-Na) permeability assay [6]
Results
SEM images (Fig. 2- Top row) showed that biofilms statically cultured with defined nutrient supply have a rough morphology with ‘mushroom-shaped aggregates’ on the surface In contrast, the dynamic culture that provided constant nutrients to the biofilm displayed a smoother surface. Moreover, the CFU was 10 fold higher under dynamic conditions, forming a densely packed and thick biofilm structure. The apparent thickness differences between the three conditions can be observed in the CLSM images (Fig 2- Middle and bottom row). The average thickness of static culture biofilm was ≈ 8 μm, while increased
30

significantly for the biofilm cultured under hydrodynamic conditions (≈ 40 μm) (Fig.3 A) The CFU in biofilms cultured under dynamic conditions was significantly higher than static cultured biofilm (Fig. Fig 3, B) No significant difference between the CFU for biofilm cultured without and with the influence of aerodynamic flow were observed. However, under continuous nutrient supply, the presence of aerodynamic shear force resulted in a thinner biofilm (≈35 μm) compared to the biofilm (≈ 45 μm) developed without airflow
The flu-Na permeability measurement of the different biofilm growth is displayed in Fig. 3C. A significant decrease in permeability compared to an empty membrane was observed after biofilm formation In addition, the permeability of dynamic cultured biofilms was significantly lower than static cultured biofilms. Moreover, the airflow-induced shear force further reduces the permeability of flu-Na in biofilm.
Subsequently, the response of the biofilms cultured at different flow conditions towards CIP is presented in Fig. 3D. The graphs represent the percentage of viable bacteria after CIP treatment compared to untreated. In general, after being treated with the same CIP concentration, the percentage of surviving bacteria of static cultured biofilm (0~0.4%) was significantly lower than dynamic cultured biofilm (0.1 8%). Moreover, the antimicrobial effects of CIP from 50 to 200 μg/mL were similar, with a significant drop from 200 to 800μg/ml for static cultured biofilm For the dynamic cultured biofilm, a gradual decrease was observed when the concentration of CIP increased from 50 to 800μg/ml, reaching a plateau at 800 to 1600 μg/mL. The MBEC is defined as the lowest concentration of an antimicrobial substance that eradicates 99.9% of biofilm -embedded bacteria (3 log10 reductions in CFU/mL) compared to growth controls in the same conditions [7]. It shows that the MBEC (Fig. 3 D) for static cultured biofilm is 800 μg/mL, while for all dynamic cultured biofilm, this value reaches 1600
Drug Delivery to the Lungs , Volume 32, 2021 – Zhang Ye1,2 et al.
Figure 2. Representative SEM and CLSM images of biofilms cultured under static and dynamic (τw=0 and τw=0.3pa)
31
Figure 2. Comparison of A) averaged biofilm thickness; B) Biofilm bacteria cell number-CFU;C) Permeablity and D) Antibiotic susceptblity. (N=6, mean+SD). Significant difference is shown for the indicated comparison (*, P-value<0.05; **, P-value<0.01; ***, pvalue<0.001). MBEC (red dash line)
Drug Delivery to the Lungs , Volume 32, 2021 - An adaptable dual-chamber microfluidic platform to investigate
Pseudomonas aeruginosa biofilm growth at the air-liquid interface under controlled hydro and aerodynamic flows Title of Your Paper
μg/mL. However, there is no significant difference in antibiotic susceptibility observed between biofilm formed with and without aerodynamic shear stress.
Discussion and conclusion
This work presented a novel dual-chamber microfluidic system capable of establishing air -liquid interfaces and controlling both aero- and hydrodynamic flow environment as an in vitro platform to mimic the physiological features of the respiratory system. In our study, the impacts of the hydrodynamic condition on nutrient supply and aerodynamic shear forces have been investigated on 48 h Pseudomonas aeruginosa biofilms. Results demonstrated that the biofilm development on ALI in the static condition is heterogenous, displaying a rougher surface with ‘mushroom’-shaped aggregates scatted sporadically across the membrane . However, dynamic conditions provided adequate nutrient supply allowing the ALI biofilm structure to develop a smooth surface. It is expected that well-nourished biofilms contain higher bacteria numbers and are much thicker since the proliferation is largely determined by the accessibility to nutrient resources. This in turn results in a more densely packed biofilm structure, which presents a lower permeability and result ing in higher tolerance to antibiotic treatment. Furthermore, the shear force exerted on the top of biofilm produced by airflow is likely to have a further compressed biofilm matrix, resulting in a thinner but more compacted structure, which displayed a lower flu-Na permeability. Enhanced antibiotic resistance of dynamic cultured biofilm to CIP compared to static cultured biofilm was observed but similar resistance was displayed by biofilms developed under different aerodynamic shear stress conditions Moreover, the MBEC of CIP assayed using our device was 1600 μg/mL, which is significantly higher than that reported by others using a microtiter plate (64 μg/mL) [8] Overall, our results suggest that nutrient and aerodynamic conditions have direct impacts on biofilm properties. Thus, to develop and test more targeted biofilm control approaches, it is critical to have a more physiological relevant tool that better mimics the real biofilm growth environment
References
[1] Lebeaux, D., Chauhan, A., Rendueles, O. and Beloin, C. From in vitro to in vivo Models of Bacterial BiofilmRelated Infections. pathogens, 2 (2013), 288-356.
[2] Ranganathan, V. Biofilms: Microbial Cities of Scientific Significance. Journal of Microbiology & Experimentation, 1, 3 (2014), 84‒98.
[3] Maurice, N. M., Bedi, B. and Sadikot, R. T. Pseudomonas aeruginosa Biofilms: Host Response and Clinical Implications in Lung Infections. American journal of respiratory cell and molecular biology , 58, 4 (2018), 428-439.
[4] Azeredo, J. Critical review on biofilm methods. Critical Reviews in Microbiology (2017).
[5] Amin, R., Katebifar, S., Knowlton, S., Messina, M., Hart, A., Yenilmez, B., Khademhosseini, A., Ghaderinezhad, F. and Tasoglu, S. 3D-printed microfluidic devices. Biofibracation, 8 (2016), 022001.
[6] Gholizadeh, H., Ong, H. X., Bradbury, P., Kourmatzis, A., Traini, D., Young, P., Li, M. and Cheng, S. Real -time quantitative monitoring of in vitro nasal drug delivery by a nasal epithelial mucosa -on-a-chip model. Expert opinion on drug delivery (2021), 1-16.
[7] Barry, A. L. Methods for determining bactericidal activity of antimicrobial agents: approved guideline . National Committee for Clinical Laboratory Standards Wayne, PA, 1999.
[8] Wang, H., Wu, H., Song, Z. and Høiby, N. Ciprofloxacin shows concentration -dependent killing of Pseudomonas aeruginosa biofilm in vitro. Journal of cystic fibrosis , 9 (2010), S41-S41.
32
Pulmonary delivery of bedaquiline-loaded cubosomes for non-small cell lung cancer (NSCLC) treatment
Suyash M. Patil1, Shruti S. Sawant1 & Nitesh K. Kunda11 Department of Pharmaceutical Sciences, College of Pharmacy and Health Sciences, St. John's University, Jamaica, NY 11439, USA
Summary
Non-small cell lung cancer (NSCLC) is the leading cause of cancer deaths globally. The available treatment options are limited by adverse effects and development of drug resistance. Hence, newer drug candidates and drug delivery systems that have minimal adverse effects with significant anticancer efficacy are required. For NSCLC treatment, inhalation route of drug delivery is highly beneficial as it delivers drugs directly into the lungs, requires lower doses, and limits systemic toxicity. Bedaquiline (BQ), an anti-tuberculosis drug has previously shown excellent anti -cancer efficacy, but the drug’s poor aqueous solubility limits its delivery via the lungs. In this project, we developed inhalable BQ -loaded cubosome (BQLC) nanocarriers for NSCLC treatment. The BQLC were prepared using a solvent evaporation technique and displayed a particle size of 150.2 ± 5.1 nm, zeta potential of (+) 35.4 ± 2.3 mV, and encapsulation efficiency of 51.85 ± 4.83%. The solid -state characterization (DSC and PXRD) confirmed drug encapsulation within the cubosomes. The BQLC nanocarriers showed excellent aerodynamic properties after nebulization (MMAD of 4.21 ± 0.53 μm and FPF > 75%). The BQLC displayed enhanced cytotoxicity with a ~3-fold reduction in IC50 compared to free BQ in NSCLC (A549) cells, after 48 h treatment. Additionally, 3D-tumor simulation studies established the anticancer efficacy of cubosomal nanocarriers as compared to free BQ.
Key Message
This is the first study exploring the potential of cubosomes for inhaled therapy. Further, the results suggest that bedaquiline-loaded cubosomes could be a promising NSCLC treatment with optimum particle characteristics, excellent aerosolization performance, and enhanced anti-cancer activity.
Introduction
Lung cancer is one of the leading causes of cancer related deaths worldwide with more than 85% of the cases associated with non-small cell lung cancer (NSCLC). The low overall 5-year survival rate of ~23% for NSCLC patients prompts the need for new treatments. There is an urgent need for new treatment strategies with enhanced anticancer activity and minimal toxicity to healthy cells. Drug repurposing significantly shortens the drug development timeframe and helps identify promising drug candidates for NSCLC treatment with limited cytotoxicity. We and others have previously shown that bedaquiline (BQ), an anti-tuberculosis drug, has potent anti-cancer efficacy against NSCLC 1,2. However, the traditional route of anticancer therapy (oral or parenteral) often leads to systemic toxicity, frequent dosing, and low drug concentrations at tumor site in the lungs. Hence, inhalation therapy of the anticancer agents can be a promising alternative to other delivery routes as the drug gets deposited directly into the lungs with potentially reduced systemic side effects and reduced dosing. Further, to increase the efficacy and enable pulmonary delivery of bedaquiline, we used cubosomes as drug delivery carriers. Cubosomes are a lipidic nanocarrier system with cubic inner crystalline structure formed by the self -assembly of an amphiphilic molecule in excess water. Cubosomes can load both hydrophilic and hydrophobic drug s, offer high thermodynamic stability, robust physical structure , and improved drug loading compared to conventional liposomes 3 . In this study, we developed bedaquiline-loaded cubosomes (BQLC) capable of providing localized inhalation therapy against NSCLC. The BQLC was fabricated using singleemulsion solvent evaporation method and characterized regarding their size, surface potential, morphology, and encapsulation efficiency. The solid -state characterization was performed to validate the encapsulation of the BQ within cubosomes. The aerosolization performance was optimized for BQLC formulation using NGI after nebulization Further, in vitro anticancer activity of the BQLC and free BQ was estimated by MTT assay and 3D tumor simulation studies on NSCLC (A549) cells
Drug Delivery to the Lungs , Volume 32, 2021 - Suyash M. Patil et al.
33
Drug Delivery to the Lungs , Volume 32, 2021 - Pulmonary delivery of bedaquiline-loaded cubosomes for nonsmall cell lung cancer (NSCLC) treatment
Experimental Methods
Preparation of BQLC formulation: A single emulsion solvent evaporation method was used to formulate BQLC 4. Briefly, BQ (5 mg) , glyceryl monooleate (GMO, 100 mg), Poloxamer 188 (P188, 20 mg), and propylene glycol (270 mg) were dissolved in 5 mL of chloroform and stirred overnight to facilitate solvent evaporation. After, distilled water (1 mL) was added to the lipid precursor and probe sonicated to obtain BQLC formulation. The free drug in the formulation was separated by dialysis using dialysis cassettes (Thermo-Scientific, Waltham, MA, USA) in an aqueous system.
Formulation characterization: The encapsulation efficiency and drug loading were reported based on the amount of BQ entrapped, analysed using an established high performance liquid chromatography (HPLC) method after direct vesicle lysis of BQLC Particle size, poly dispersity index (PDI), and zeta potential were measured using dynamic light scattering , Zetasizer Nano ZS (Malvern Instruments Ltd., Malvern, UK). The morphology of the cubosomes was visualized using cryogenic transmission electron microscopy (cryoTEM), Titan Halo 80-300 (FEI, Hillsboro, OR, USA). The thermograms of BQ, BQLC (freeze-dried), and blank cubosomes (freeze-dried) were generated using differential scanning calorimetry instrument, DSC 6000 (PerkinElmer, Waltham, MA, USA) over a range of 20-260 °C with a sealed empty aluminum pan serving as a reference. Powder X-ray diffraction (PXRD) spectroscopy was performed using XRD-6000 (Shimadzu, Kyoto, Japan) in the range of 10-80° at a scanning speed of 2° (2θ)/min.
Aerosolization Performance: The aerosolization performance of BQLC was evaluated by Next Generation Impactor (NGI) M-170 (MSP Corporation, Minneapolis, MN, USA), using previously published method 5. Prior to the run, the NGI was cooled by refrigerating at 4 °C for 90 min to minimize heat evaporative effects. Briefly, 2 mL of formulation was nebulized with PARI LC PLUS® nebulizer and passed through induction port into the NGI using HCP5 Vacuum Pump (Copley Scientific, Nottingham, UK) at a flow rate of 15 L/min for 4 min. A lysis solvent (binary mixture of acetonitrile and water) was used to collect the deposited samples from the NGI stages and evaluated using HPLC. Mass median aerodynamic diameter (MMAD) and geometric standard deviation (GSD) were calculated using logprobability analysis (n=3). The fine particle fraction (FPF, %) was defined as fraction of emitted dose deposited in the NGI from stage 3.
In vitro anticancer activity : The in vitro cytotoxicity of the free BQ and BQLC on A549 cells was evaluated using MTT (3-(4,5-dimethylthiazol-2-yl)-2,5-diphenyltetrazolium bromide) assay. A549 cells (5 x 10 3 cells/well) were seeded in 96-well tissue culture plates, incubated overnight, and treated with different concentrations of BQLC, blank cubosomes, or BQ for 48 h After, MTT was added to the wells and t he formed formazan crystals were solubilized using dimethyl sulfoxide and the absorbance was measured at 570 nm using a plate reader , Synergy H1 (BioTek, Winooski, VT, USA) The cell viability was calculated as the ratio of absorbance between treatment groups and untreated control wells In vitro tumor simulation studies were performed to better mimic in vivo tumor conditions and involves growing cells as a 3D spheroid. Briefly, cells were seeded at a density of 750 cells/well in an ultra-low attachment 96-well U bottom plate (Corning®, Kennebunk, ME, USA) and grown for 3 days before treatment. The multiple doses regimen involved treating cells every 3 days until day 15 with BQLC or BQ (15 M; IC50 concentration). The optical imaging of tumors (n = 6) was carried out using an inverted Leica microscope (Leica Microsystems, Chicago, IL, USA) and the spheroid diameter (d) was calculated using an ImageJ software.
34
Results and Discussion
The BQLC were successfully fabricated with a particle size of 150.2 ± 5.1 nm and a PDI of 0.24 ± 0.02. The developed nanocarriers were cationic with a zeta potential of (+) 35.4 ± 2.3 mV , encapsulation efficiency of 51.85 ± 4.83 % w/w and drug loading of 20.45 ± 3.55 g of BQ per mg of lipid content (Fig. 1A). The cryoTEM micrographs depicted nearly spherical cubosomes with irregular polyangular shapes (Fig. 1B). The BQ thermograms showed an endothermic melting peak at 215 ºC. Blank cubosomes consisting of a lipid and surfactant displayed a glass transition peak at 40 ºC, corresponding to GMO melting point as per manufacturers datasheet. The BQLC thermogram was similar to blank cubosomes with absence of BQ melting peak suggesting successful encapsulation in cubosomes (Fig. 1C). Diffractometry studies revealed BQ characteristic peaks over 10º to 30º 2θ range (Fig. 1D). Blank and BQ-loaded cubosomes showed characteristic peaks at 18º and 23º 2θ values, corresponding to a partially ordered structure of P188 6 and absence of BQ characteristic peaks between 10°– 30° 2θ values further confirming the successful encapsulation of BQ.
Drug Delivery to the Lungs , Volume 32, 2021 - Suyash M. Patil et al.
Figure 1. Physicochemical characterization of BQLC A. Formulation characterization. B. Morphological analysis of cubosomes depicted by cryoTEM images. C. Thermograms of BQ, BQLC and blank cubosomes generated by differential scanning calorimetry (DSC). D. Diffraction patterns of BQ, BQLC and blank Cubosomes ob tained using powder X-ray diffraction (PXRD).
35
Figure 2: A. In vitro aerosolization performance of BQLC after nebulization for diluted and undiluted formulations. B. Stage-wise drug deposition (%) of BQLC in NGI. (Mean ± SD, n = 3).
Drug Delivery to the Lungs , Volume 32, 2021 - Pulmonary delivery of bedaquiline-loaded cubosomes for nonsmall cell lung cancer (NSCLC) treatment
The aerosolization performance (Fig. 2A & B) of cubosomes was assessed using NGI. The prepared BQLC (referred to as undiluted BQLC) formulation demonstrated MMAD of 5.12 ± 0.03 μm with FPF of 67.97 ±1.40%. The developed cubosomal formulations were viscous in nature and resulted in higher MMAD, as increased viscosity increases MMAD as well as im pacts aerosol deposition for jet nebulizers
7. So, to reduce the viscosity of the formulation, BQLC was diluted with water (1:1) . The diluted BQLC displayed enhanced aerosolization performance with MMAD of 4.21 ± 0.53 μm, GSD of 2.23 ± 0.07 a nd FPF of 78.94 ± 5.66%. Hence, the aerosolization performance suggests BQLC can be administered via inhalation route, facilitating local delivery to the deep lungs, thus resulting in reduced exposure to other organs and limiting adverse events.
The IC50 of free BQ (52.05 ± 1.47 μM) was significantly reduced using the BQLC formulations (16.49 ± 2.38 μM; p < 0.0001) as shown in Fig. 3A. A ~3-fold lower IC50 of cubosomal nanoparticles, compared to the free drug, could be attributed to enhanced solubility of BQ and rapid internalization of cubosomes (data not shown). The safety of nanocarriers (blank cubosomes) was ascertained w ith 84.67 ± 3.11 % of cell viability when used around the IC 50 concentrations (0.5 mg of formulation). The 3D -spheroids resemble the appearance of a tumor in vivo and better mimic the tumor behaviour providing physiologically relevant results 8. The BQLC showed a significant inhibition in spheroid volume, compared to free BQ (p < 0.01) and control (p < 0.001), as shown in Fig. 3B & C. The spheroid volume of untreated group was 0.51 ± 0.06 mm3, a 4-fold increase in spheroid volume from day 1 (0.12 ± 0.03 mm3). The spheroids treated with 15 μM BQLC exhibited a 0.24 ± 0.04 mm 3 spheroid volume with significant inhibition as paralleled to 0.40 ± 0.05 mm 3 of 15 μM free BQ. The physicochemical properties of nanocarriers, such as small particle size and positive surface charge are crucial for effective tumor penetration, and it can be concluded that BQLC having these characteristics facilitates the entry of drug into solid tumor core which could be inaccessible to free BQ. Therefore, our results suggest that BQLC can be a promising strategy to repurpose BQ for NSCLC treatment at reduced dose. Moreover, the ability to deliver these cubosomes locally and directly to the primary tumor site in the lu ngs may further reduce the required dose and decrease systemic side effects compared to systemic delivery.
Conclusion
This is the first study focusing on inhaled delivery of bedaquiline -loaded cubosomal nanocarriers for the treatment of NSCLC. The developed BQLC nanocarriers showed suitable particle characteristics and efficient drug entrapment. Further, upon nebulization the cubosomal nanocarriers demonstrated suitable aerodynamic properties (MMAD and FPF) for inhalation delivery The positively charged BQLCs enhanced cytotoxicity compared to free BQ in A549 cells. The ability of the BQLC to inhibit tumor growth in 3D spheroid studies further provides preliminary evidence for translation of developed drug delivery system to a preclinical setup
Figure 3: A. Cytotoxicity studies after 48 h treatment with BQ, BQLC and blank cubosomes determined using MTT assay in A549 cells. B. Spheroid growth characterization of A549 cells after multiple doses of BQ and BQLC treatments. C. Representative images of spheroids after multiple dose treatment demonstrating tumor suppression at days 0, 3, 9 and 15. (Mean ± SD, n = 6). Statistical analysis (two-way ANOVA) was performed using Prism software (GraphPad, USA). Scale bar = 200 μm. ** p < 0.01, *** p < 0.001.36
Acknowledgements
This study was supported by funds provided to NKK by the Dep t. of Pharmaceutical Sciences, St. John’s University. The author(s) would like to acknowledge the Imaging Facility of CUNY Advanced Science Research Centre for helping us in acquiring the TEM images.
References
1. Parvathaneni V, Elbatanony RS, Goyal M, Chavan T, Vega N, Kolluru S, Muth A, Gupta V, Kunda NK: Repurposing Bedaquiline for Effective Non-Small Cell Lung Cancer (NSCLC) Therapy as Inhalable Cyclodextrin -Based Molecular Inclusion Complexes. International Journal of Molecular Sciences 2021;22(9):4783 (1-18).
2. Wu X, Li F, Wang X, Li C, Meng Q, Wang C, Huang J, Chen S, Zhu Z: Antibiotic bedaquili ne effectively targets growth, survival and tumor angiogenesis of lung cancer through suppressing energy metabolism. Biochem Biophys Res Commun 2018;495(1):267-272.
3. Chang C, Meikle TG, Drummond CJ, Yang Y, Conn CE: Comparison of cubosomes and liposomes for the encapsulation and delivery of curcumin. Soft Matter 2021;17(12):3306-3313.
4. Rizwan SB, Assmus D, Boehnke A, Hanley T, Boyd BJ, Rades T, Hook S: Preparation of phytantriol cubosomes by solvent precursor dilution for the delivery of protein vacci nes. Eur J Pharm Biopharm 2011;79(1):15-22.
5. Vartak R, Patil SM, Saraswat A, Patki M, Kunda NK, Patel K: Aerosolized nanoliposomal carrier of remdesivir: an effective alternative for COVID-19 treatment in vitro. Nanomedicine 2021.
6. Dong W, Su X, Xu M, Hu M, Sun Y, Zhang P: Preparation, characterization, and in vitro/vivo evaluation of polymer -assisting formulation of atorvastatin calcium based on solid dispersion technique. Asian J Pharm Sci 2018;13(6):546-554.
7. Broniarz-Press L, Ochowiak M, Matuszak M, Włodarczak S: The effect of shear and extensional viscosity on atomization in medical inhaler. International Journal of Pharmaceutics 2014;468(1):199-206.
8. Shukla SK, Kulkarni NS, Farrales P, Kanabar DD, Parvathaneni V, Kunda NK, Muth A, Gupta V: Sorafenib Loaded Inhalable Polymeric Nanocarriers against Non-Small Cell Lung Cancer. Pharm Res 2020;37(3):67 (1-19).
Drug Delivery to the Lungs , Volume 32, 2021 - Suyash M. Patil et al.
37
38
Drug Delivery to the Lungs, Volume 32 , 2021 – Hanieh Gholizadeh et al.
A human nose-on-a-chip as a physiologically relevant in-vitro model for nasal drug delivery
Hanieh Gholizadeh1,2, Shaokoon Cheng2, Agisilaos Kourmatzis3, Zara Sheikh1, Daniela Traini1,4, Paul Young1,5 & Hui Xin Ong1,4
1Respiratory Technology, The Woolcock Institute of Medical Research, Sydney, NSW 2037, Australia
2 School of Engineering, Macquarie University, Sydney, NSW 2109, Australia
3School of Aerospace, Mechanical and Mechatronic Engineering, The University of Sydney, Sydney, NSW 2006, Australia
4Department of Biomedical Sciences, Faculty of Medicine, Health, and Human Sciences, Macquarie University, Sydney, NSW 2109, Australia
5 Department of Marketing, Business School, Macquarie University, Sydney, NSW 2109, Australia
Summary
A dual-channel nose-on-a-chip (NOC) was developed incorporating an air-liquid interface model of human nasal epithelial cells as a novel platform for testing nasal drug delivery in-vitro. The novelty of the NOC lies in mimicking realistic deposition of drug aerosols in the apical donor microchannel, where the cells are exposed to a flow-induced shear stress of 0.23 Pa, mimicking the in-vivo nasal airflow during inhalation In addition, a pulsatile fluid flow within the acceptor basolateral microchannel mimics the systemic circulation through the vasculatures in the human nasal mucosa This dynamic microenvironment significantly influences the transport profile of ibuprofen (IBU-model drug) across the nasal epithelium. The pulsatile flow in the basolateral microchannel significant ly increases the rate of drug transport and the delivery of aerosolized drug under flow conditions in the apical microchannel causes a further increase in the percentage of transported IBU. Furthermore, the barrier function of the nasal epithelium remains unaffected throughout the study, as assessed by the in-situ transepithelial electrical resistance measurements Hence, this NOC highlights the significant effect of the biomechanical factors such as shear stress on nasal drug delivery assay results and the importance of incorporating these physiological dynamic conditions for in-vitro nasal drug testing The miniaturized platform of the NOC with in-built electrochemical and impedance sensors is rapid and relatively economical for quantification of IBU transport and epithelial integrity , respectively Importantly, these sensors are sufficiently accurate for the quantification of the IBU transport and comparable to current analytical methodologies
Key Message
Nasal drug delivery testing using the physiologically relevant dynamic microenvironment recreated by the NOC demonstrated the impact of biomechanical factors such as shear stress and dynamic real aerosol deposition on drug permeability. Hence, NOC can serve as a potential alternative to the conventional static models and enhance in-vitro in-vivo correlations
Introduction
In-vitro evaluation of nasal drug formulations includes investigating the toxicity and transport of drugs across the human nasal mucosa before reaching the target site to elucidate its pharmacological action [1] Therefore, establishing a physiologically relevant in-vitro model of the human nasal mucosa barrier is of paramount importance for these assessments to accurately predict clinical outcomes. The current in-vitro models of the human nasal mucosa used for nasal drug testing were developed using the airliquid interface (ALI) model of the nasal epithelial cells on Transwell/Snapwell inserts, where the transport of drugs across the epithelium is evaluated using drug solution or suspension under static conditions These models fail to simulate the physiology of human nasal mucosa in terms of the aerosol deposition and dynamic biomechanical stimuli such as fluid and air flow over the mucosa This can potentially affect the ability of these conventional approaches to accurately predict the efficacy of nasal therapeutics in-vivo [2] In addition, these conventional assays typically require multiple steps including samples preparation before analyses and subsequent drug quantification. These steps are often timeconsuming and require extensive use of solvents and consumables , as well as expensive analytical instruments As a result, there is a need to develop novel nasal drug testing platforms with improved physiological relevance that could also act as an analytical tool that is time and cost-efficient. This study aims to develop a human nose-on-a-chip (NOC) model that mimics the realistic flow of aerosolised nasal formulations and deposition of particles on the nasal mucosa that enables testing of nasal formulations under in-vivo-inspired fluid dynamic conditions In addition, the NOC is integrated with miniaturised analytical sensors for in-situ drug quantification and epithelial barrier function monitoring to study realtime drug transport across the epithelium and the potential effects on the barrier integrity. Ibuprofen (IBU) is used as a model drug in this study due to its effect in the management of Alzheimer’s disease and the growing interest in dosing it via direct nose-to-brain drug delivery route [3].
39
Drug Delivery to the Lungs , Volume 32, 2021 - A human nose-on-a-chip as a physiologically relevant in-vitro model for nasal drug delivery
Experimental methods
Fabrication of the NOC and its use to emulate the delivery of the nasal aerosol particles in-vitro
The design and fabrication of the NOC have been reported elsewhere [4] Briefly, the NOC comprises of two microchannels made of polydimethylsiloxane, sandwiching a transparent polystyrene membrane (12 μm thickness, 0.4 μm pore size, 2 × 10 6 pores/cm2). Slight changes are made in the design, including the insertion of a 2.5 cm long vacuum resistant Tygon ® tube (OD = 2 mm, ID = 0.8 mm) horizontally at the inlet of the donor microchannel for aerosol deposition as shown in Fig. 1. Four platinum (Pt) wire electrodes are inserted into the microchannels (two electrodes in each microchannel) and carbon nanofibers (CNFs)-modified carbon electro de (CNFs-C) is integrated into the acceptor microchannel (Fig. 1). These electrodes enable in-situ transepithelial electrical resistance (TEER) and drug transport monitoring, respectively [4] RPMI 2650 (CCL-30) cell line was cultured under ALI condition in the donor microchannel for 14 days as optimized previously [4] for tight junctions (TJs) formation and mucus secretion.
To simulate the airflow inside the device, the apical donor microchannel outlet was connected to a vacuum pump and the inlet was connected to a Flow Meter 4040 (TSI instruments Ltd, U K) to adjust the airflow rate to 0.5 L/min. Given the dimensions of the donor microchannel cross -section (1 × 1 mm), this flow rate results in shear stress of 0.23 Pa on the cells as calculated by ���� = 6�������� ℎ2 ���� ⁄ [5], where τ is the shear stress (Pa), μ is the dynamic viscosity of air (kg.m-1.s-1), Q is the airflow rate (m3.s-1), h is the channel height (m), and w is the channel width (m). This applied shear stress for drug deposition simulates the shear stress in the inferior and middle turbinates of the human nasal cavity in-vivo (0.2 up to 1.2 Pa) during breathing [6-8]
To deposit the drug aerosols in the NOC, the donor inlet was connected to a PARI LC® Sprint jet nebulizer, driven by a PARI Turbo Boy S compressor (Starnberg, Germany) to generate aerosols while 0.5 L/min air flow rate was applied This nebulizer generates aerosol particles of similar size (mass median diameter = 3.5 µm) to the PARI Sinus, which is used for efficient sinu s targeting and aerosol administration into the nasal cavity [9] To visualize the depos ited particles in the NOC, Hank’s balanced salt solution (HBSS) was loaded with sodium fluorescein (flu-Na) with 2.5 mg/mL concentration. After deposition of the aerosolized particles to the apical donor microchannel, microscopic images were taken with an x20 objective of a Nikon Elipse TI time -lapse microscope To study the drug transport by NOC , ibuprofen (IBU) was added to HBSS (2 mg/mL) as a model drug This concentration of I BU was selected based on the standard solubility of the drug in PBS , which did not show toxic effects on nasal epithelial cells in vitro [10]. The drug transport was studied under three different settings: (I) the apical microchannel was filled with 35 µL of IBU-HBSS and the basolateral microchannel was filled with phosphate buffer (PBS; 0.1 M, pH 7) under static conditions; (II) a pulsatile flow of PBS at the rate of 0.5 mL/min through the basolateral microchannel was applied while the apical microchannel was filled with IBU-HBSS; and (III) the aerosolized IBU-HBSS was deposited in the donor microchannel with 0.5 L/min airflow rate in addition to the pulsatile flow of PBS in the basolateral microchannel
In-situ TEER measurements by the NOC
Pre-warmed cell culture was injected into the donor and acceptor microchannels and the NOC was incubated for 15 min for equilibration. One pair of the Pt electrodes (one electrode in the donor and one in the acceptor channel) were connected to a potentiostat (PGSTAT204, Metrohm Autolab, Netherlands) and small amplitude (0.01 VRMS) AC excitation signal (1 mA) with a frequency sweep (10 -1 – 106 Hz) was applied and the amplitude and phase respon se of the resulting current were recorded. An equivalent electrical circuit representing the resistance and capacitance of the cell layer was then fitted to the recorded data using NOVA 2.1.2 software (Metrohm Autolab, The Netherlands) to determine the
Figure 1. The schematics of NOC structure, deposition of the aerosol particles in the donor microchannel, and connection of the electrodes to a potentiostat to monitor the drug transport in real-time.40
electrical resistance of the cell layer . The measurement was repeated for the second pair of the Pt electrodes.
Real-time nasal drug transport monitoring by the NOC
After the introduction of IBU into the NOC, the IBU transfer across the epithelium to the acceptor microchannel was quantified in-situ For this, one of the Pt wires in the acceptor channel was replaced with a silver/silver chloride wire electrode. This electrode with the CNFs -C and the Pt electrode in the acceptor microchannel were connected to the potentiostat. The transported IBU into the basolateral channel was quantified based on electrochemical analysis by performing square wave voltammetry within 0.8 – 1.4 V potential range with 5 mV step potential, 20 mV modulation amplitude, 10 Hz frequency, and 0.1 s interval time as optimized previously for detection of IBU [4] The assay was conducted up to 4 h as this is the widely accepted time for evaluating respiratory drug delivery in vitro [1,10, 11] as the biological properties and viability of the cells are maintained throughout the assay. To validate the IBU quantification by the NOC, a sample collected from the acceptor microchannel at the end of the experiment was analyzed by high-performance liquid chromatography (HPLC) as reported previously [10]. Briefly, the mobile phase was 60% V/V acetonitrile solution in water with pH adjusted at 3.5 using acetic acid. The analyses were conducted by a Shimadzu Prominence UFLC system equipped with the SPD-20A UV-Vis detector (Shimadzu Corporation, Japan) and C18 column (5 μm, 250 × 4.6 mm). The detection was performed at 254 nm wavelength and 1.5 mL/min mobile phase flow rate, 100 μL injection volume, and retention time of 4.5 min.
Results and discussion
Deposition of nasal formulation aerosols in the NOC
The microscopic image obtained from the apical donor microchannel of the NOC after deposition of the HBSS aerosols loaded with flu-Na is shown in Fig. 2 The obtained images were analyzed with Image J software to measure the area of each particle and calculate the diameter of the particle The frequency distributions of the measured particles size were obtained and a range of particles size between 1 – 30 µm was determined This can mimic the aerosol deposition in regions of the human nasal cavity such as the olfactory region, where deposition of particles with 8 – 12 µm size is reported [12]. Delivery of nasal drugs to the olfactory region is essential for direct nose -to-brain drug delivery. This results in skipping blood-brain barrier and efficiently targeting brain tissue to treat neurological disorders [10]
The evaluation of the mucosal barrier function of the NOC under dynamic conditions
The in-situ TEER measurements by the Pt electrodes in the NOC allowed for monitoring the barrier properties of the modelled nasal epithelium before and after exposing the cells to the flow of the aerosolised formulations It was found that the TEER measured before and after exposure of the cells to the flow of aerosolised particles was not statistically different (373.48 ± 73 Ω.cm2). Therefore, the integrity of the nasal epithelium in the NOC under the simulated dynamic conditions was not negatively affected under the time scale studied Hence, we can confidently study the nasal formulations under the in-vivo-relevant dynamic conditions without affecting the barrier function of the epithelium
Real-time nasal drug transport monitoring by the NOC
Fig. 3a shows the time-course of cumulative IBU mass detected in the acceptor microchannel by the CNFs-C sensor in three different conditions: (I) static condition in NOC, (II) static apical and pulsatile flow in the basolateral microchannel, and (III) aerosol flow in the apical and pulsatile flow in the basolateral microchannels. To evaluate the effects of the dynamic pulsatile flow conditions in the basolateral microchannel on the rate of the IBU transport, the obtained profiles of the static NOC and dynamic basolateral microchannels were statistically compared based o n the Moore and Flanner fit factors [11]. According to this analysis, the difference (f1) and similarity (f2) factors were calculated to compare the obtained profiles. It is the FDA requirement to evaluate the fulfilment of both f1 and f2 factors to consider two profiles different or similar [11]. The f1 and f2 factors were calculated as 53.76 and 47.72, respectively. Since f1 ≥ 10 and f2 ≤ 50, the difference between the two profiles is statistically
Drug Delivery to the Lungs, Volume 32 , 2021 – Hanieh Gholizadeh et al.
Figure 2 Microscopic image taken from HBSS aerosols deposited into the donor microchannel of the NOC when 0.5 L/min airflow rate was applied. The scale bar shows 50 μm.
41
Drug Delivery to the Lungs , Volume 32, 2021 - A human nose-on-a-chip as a physiologically relevant in-vitro model for nasal drug delivery
different [11]. The basolateral flow resulted in a significant increase i n the rate of drug transport over time This can be associated with the increase in the convective mass transfer coefficient in the basolateral microchannel as a result of the fluid flow condition s [4] Similarly, the profile of the IBU mass transport was compared between the dynamic basolateral only and dynamic apical and basolateral conditions. For these two profiles, f1 and f2 were calculated a s 87.66 and 36.17, respectively, showing a statistically significant difference.
When the IBU aerosol was deposited on the epithelium under the dynamic condition, IBU transport rate was significantly slower compared to transport rates in both the static conditions when IBU solution was administered. The slower IBU transport rate may be related to the lower IBU mass that was delivered to the cells by the aerosolised particles compared to the other two experiments, where the donor microchannel was filled with IBU solution under static conditions Importantly, IBU aerosols deposited on the nasal epithelium requires an additional step of wetting and diffusion across the mucus layer prior to drug absorption. This is also in agreement with the observation of a gradual increase in the rate of IBU transport 2 hrs after start of the experiment
Further, the in-situ drug quantification by the NOC was validated versus HPLC. Fig. 3b shows the IBU mass detected by the NOC and HPLC at the endpoint of the three experiments (4 h) For the experiments under static condition, dynamic basolateral microchannel, and dynamic api cal and basolateral microchannels, no significant difference (P = 0.7258, 0.8761, and 0.3639, respectively) was found between the measurements obtained using the NOC and HPLC methods, the latter is currently used as the gold standard analytical technique in the pharmaceutical industry. This data shows the reliability of the NOC for drug quantifications.
Conclusions
A novel NOC platform was successfully developed with capabilities to emulate the dynamic microenvironment of the human nasal mucosa to enhance the physiological relevance of the in-vitro nasal drug tests to in-vivo clinical performance . The simulation of in-vivo-inspired shear stress in the apical donor microchannel of the NOC , as well as the circulating pulsatile flow in the basolateral acceptor microchannel, were found to significant ly affect nasal drug transport studies. The NOC with its improved in-vitro in-vivo relevance facilitated drug quantification and TEER assessments using the in-built analytical capability and could potentially be used as a rapid and economic alternative to conventional analytical testing by HPLC. Furthermore, the CNFs-C electrode used in the NOC has great potential to be used for quantification of different drug compounds to broaden the applicability of the NOC for testing different drugs. However, this platform may need optimization of the electrode composition and supplied voltage depending on how different the electroactivity of the test drugs can be Future research will investigate the simulation of localized therapies in the dynamic microenvironment of the NOC and assess its performance against in-vivo results.
Figure 3 (a) The IBU mass transported across the RPMI 2650 cell layer under ALI in the NOC after deposition of the aerosolized IBU-HBSS at different static and dynamic conditions. (b) The IBU mass in the bottom channel of the NOC detected electrochemically by the CNFs-C electrode integrated into the acceptor microchannel versus IBU quantifications by HPLC for (I) static condition in NOC, (II) static apical and pulsatile flow in the basolateral microchannel, and (III) aerosol flow in the apical and pulsatile flow in the basolateral microchannel (n = 3, mean ± StD).42
References
1. Pozzoli M, Ong HX, Morgan L, Sukkar M, Traini D, Young PM, Sonvico F: Application of RPMI 2650 nasal cell model to a 3D printed apparatus for the testing of drug deposition and permeation of nasal products, European Journal of Pharmaceutics and Biopharmaceutics 2016; 107:223-233.
2. Esch EW, Bahinski A, Huh D: Organs-on-chips at the frontiers of drug discovery, Nature reviews Drug discovery 2015; 14:248-260.
3. Lehrer S: Nasal NSAIDs for Alzheimer's disease, American Journal of Alzheimer's Disease & Other Dementias® 2014; 29:401-403.
4. Gholizadeh H, Ong HX, Bradbury P, Kourmatzis A, Traini D, Young P, Li M, Cheng S: Real-time quantitative monitoring of in vitro nasal drug delivery by a nasal epithelial mucosa -on-a-chip model, Expert Opin Drug Deliv 2021; 18:803-818.
5. Kim L, Toh Y-C, Voldman J, Yu H: A practical guide to microfluidic perfusion culture of adherent mammalian cells, Lab on a Chip 2007; 7:681-694.
6. Li C, Farag AA, Maza G, McGhee S, Ciccone MA, Deshpande B, Pribitkin EA, Otto BA, Zhao K: Investigation of the abnormal nasal aerodynamics and trigeminal functions among empty nose syndrome patients, In: International forum of allergy & rhinology. Volume 8: Wiley Online Library; pp444-452, 2018.
7. Inthavong K, Shang Y, Tu J: Surface mapping for visualization o f wall stresses during inhalation in a human nasal cavity, Respiratory physiology & neurobiology 2014; 190:54-61.
8. Kim D-W, Jo G, Na Y: Flow kinematics in regions with flow recirculation inside nasal cavity, Journal of Mechanical Science and Technology 2019; 33:1263-1269.
9. Hosseini S, Golshahi L: An in vitro evaluation of importance of airway anatomy in sub -regional nasal and paranasal drug delivery with nebulizers using three different anatomical nasal airway replicas of 2 -, 5- and 50-Year old human subjects, International Journal of Pharmaceutics 2019; 563:426-436.
10. Gholizadeh H, Cheng S, Pozzoli M, Messerotti E, Traini D, Young P, Kourmatzis A, Ong HX: Smart thermosensitive chitosan hydrogel for nasal delivery of ibuprofen to treat neurological dis orders, Expert opinion on drug delivery 2019; 16:453-466.
11. Ong HX, Traini D, Bebawy M, Young PM: Epithelial profiling of antibiotic controlled release respiratory formulations, Pharmaceutical research 2011; 28:2327-2338.
12. Yarragudi SB, Kumar H, Jain R, Tawhai M, Rizwan S: Olfactory targeting of microparticles through inhalation and bi-directional airflow: effect of particle size and nasal anatomy, Journal of aerosol medicine and pulmonary drug delivery 2020; 33:258-270.
Drug Delivery to the Lungs, Volume 32 , 2021 – Hanieh Gholizadeh et al.
43
44
FLASH Speakers Conference Papers
45
46
Targeting Deep Lungs with Swellable Nano/Microgels for the Delivery of Suramin
David Encinas-Basurto1, Kiley McCombs 1, Ernest Vallorz1 & Heidi Mansour1,21 Skaggs Pharmaceutical Sciences Center, College of Pharmacy, The University of Arizona, 1703 E. Mabel St, Tucson, Arizona 85721, USA.
2 Department of Medicine, Division of Translational and Regenerative Medicine, The University of Arizona College of Medicine, Tucson, AZ, USA
Summary
In this study, novel biodegradable cross -linked carboxymethyl chitosan (CMC) nano/microgels were developed and evaluated in vitro as potential carriers for sustained pulmonary suramin salt (Sur) delivery. Upon deposition, aerosols must first go through efficient aerodynamic filtration to reach the deep lung, where they must then avoid rapid macrophage clearance to grant a local sustained release Therefore, developing swellable nano/microparticles with respirable aerodynamic diameters in a dry state but larger geometric size via swelling is a promising approach to avoid alveolar macrophage clearance and achieve high deposition. This study designed nano/microgels by spray -drying CMC for suramin salt delivery with L-Leucine (Leu) as an aerosolize enhancer molecule. Particle size distribution, in vitro lung deposition, and in vitro release profile were tested in each formulation. NGI parameters showed satisfactory aerosol properties for inhalation, with fine particle fraction (FPF) over 30%, a respirable fraction (% RF) over 80 %, and MMAD as low as 1 µm. In addition, in vitro dissolution test of nano/microgels exhibited sustain ed Sur for more than 48 h with swelled particles
Key Message
The addition of Leu into CMC nano/microgels shows suitable properties to be used for dry powder inhalation targeting deep lung for sustain release of suramin salt and once swell, escape from macrophages clearance.
Introduction
The pulmonary route has raised a great interest recently as several therapeutic molecules can be used to achieve both local and systemic effects. Benefits of pulmonary drug delivery over alternative delivery routes include a thin epithelial barrier, considerable vascularization, large alveolar surface area, low enzymatic metabolic activity, and the absence of the first -pass effect, all of which are helpful to drug absorption [1]. However, the mechanisms of inherent lung clearance and the development of respirable carrier systems with suitable aerodynamic qualities that can confer a sustained release remain. In general, particles targeting deep lungs should have an aerodynamic diameter of 0.5 –5 µm to prevent particles from depositing in upper airways Microparticles of this size range are rapidly cleared from the lungs by alveolar macrophages [2]. Because of its biodegradability, biocompatibility, and low toxicity, chitosan, a natural carbohydrate polymer, has long been studied for drug administration and medical uses, and there is evidence that chitosan particles are being degraded after deposition by lysozyme activity which is available in the human body especially in the lungs [3].
Swellable particles with respirable aerodynamic diameters while dry but larger geometric sizes when swollen is a promising approach to avoid macrophage clearance El‐Sherbiny, McGill [4] produced swellable microparticles using PEG-chitosan co-polymer combined with Pluronic-F-108 by cryomilling. They showed a delay in phagocytosis by macrophages in comparison with non-swellable 1 μm polystyrene particles. In this sense, we designed nano/microgels formulation by spray drying technique using CMC for suramin salt delivery with Leu as aerosolization enhancer. Additionally, particles have reversible swelling properties for targeting deep lung deposition and avoid macrophages clearance
Preparation of Formulations by Advanced Co-Spray Drying
CMC (MW:249.12)n deacetylation degree=90 %, Santa Cruz Biotechnology, Inc., USA), Sur, and genipin (GNP) (Sigma Aldrich, USA) were dissolved in a 30 EtOH/70% water solution at 45 °C around 4 hours until a deep purple solution was observed (0.2 % w/v of CMC; 1:0.1 weight ratio (CMC:GNP)) Prior atomization using Büchi Mini Spray Dryer B-290 (Büchi Labortechnik, Flawil, Switzerland) coupled to a B-296 dehumidifier, different L-Leu amounts (2.5 %, 5 %, and 10 % w/w of CMC) (Sigma Aldrich, USA) were added to the nano/microgel suspension. The atomization gas (ultra-high purity (UHP)
Drug Delivery to the Lungs , Volume 32, 2021 - David Encinas-Basurto et al.
47
Drug Delivery to the Lungs , Volume 32, 2021 - Targeting Deep Lungs with Swellable Nano/Microgels for the Delivery of Suramin
nitrogen) flow rate was set at 600 L/h (55 mmHg), aspirator rate of 35m 2/h (100 %), inlet temperature 125°C, and pump rate of 100 %. For drug-loaded CMC nano/microgels preparation, 10 % w/w Sur was added directly to the CMC/GNP solution.
Co-Spray Dried Solid-State characterization
Analysis of particle size and morphology was measured using scanning electron microscopy (SEM). Particle size distribution of swelled nano/microgels were determined using 5 mg/mL of the different formulations in MQ water, after 3 h of equilibration, laser diffraction (SALD-7101, Shimadzu Scientific Instruments, Columbia, MD, USA) was used.
In Vitro Aerosol Dispersion Performance
In vitro, aerosol dispersion study was conducted in accordance with US Pharmacopeia (USP) Chapter <601> specification on aerosols. The Next-Generation Impactor® (NGI®) (Copley Scientific, Nottingham, UK) with a stainless-steel induction port (USP throat) attachment was used at a flow rate of 60 L/min with an actuation time of 10 seconds through the inhaler device. The aerosol dispersion performance was tested using an FDA-approved Aerolizer® inhaler (Novartis AG, Basel, Switzerland) Quali-V clear HPMC size 3 inhalation-grade capsules (Qualicaps, RTP, NC, USA) were filled with 10 mg of powder. Critical quality attributes of aerosols such as fine particle fraction with respect to the emitted dose (fraction of amount of powder released from the capsule) (%FPF), the respirable fraction with respect to recovering dose (%RF) (Mass of particles deposited on stages 2 to 7 relative to mass deposited in all stages), mass median aerodynamic diameter (MMAD) and geometric standard deviation (GSD) All experiments were done in triplicate (n=3).
In Vitro Drug Diffusion Studies Using the Franz Cell
The drug dissolution rate of the Sur-loaded gels was evaluated using a modified Franz diffusion cell (VB6; PermeGear Inc., Hellertown, PA, USA) with Spectr a/Por® membrane disc (12-14,000 MW). Briefly, 5 mL of PBS was used as acceptor media at 37 ± 0.5 °C. 5 mg of dry powder was deposited in acceptor's vessel using dry powder Insufflator™-Model DP-4M (Penn-Century, Wyndmoor, Philadelphia) by aerosolization. At desired time points, 0.2 ml aliquot was removed with replacement of the same volume of fresh media. Samples were analyzed by HPLC. All experiments were done in triplicate (n=3).
Results
The SEM images of Co-Spray dried (Co-SD) CMC samples are shown in Figure 1. The 0 % Leu formulation showed irregular and wrinkled morphology , in contrast with 10 % Leu dry powder that showed a smooth surface and spherical shape. In addition, there was no apparent difference when the drug is added prior to spray drying. Optical images were taken of the swollen nano/microgels in solution
Swell particle diameter increases from 0.61±0.2 µm, 0.4±0.13 µm and 0.63±0.17 µm to 5.36 ±1.85 µm, 4.41±1.07 µm and 5.9±1.52 µm, for 0 % Leu, 10 % Leu and 10 % Leu CMC/Sur, respectively (Figure. 1)
48
Figure 1. Overview of the spray-dried batches. SEM and optical micrographs of CMC nano/microgels. SEM scale bar is 5 µm, and Optical images present 50 µm scale bar.
Size distribution measured by laser diffraction (n=3) showed values (X50) of swell formulations of: 11.67 ± 0.6 µm , : 3.2± 1.2 µm and 8.56 ± 2.1 µm for Co-SD CMC 0% Leu, Co-SD CMC 10% Leu and Co-SD CMC 10% Leu with Sur, respectively. In addition, X90 presented values of: 26.53 µm, 8.83 µm and, 25.58 µm, respectively, with span values of 1.70, 1.87, and 2.41
The aerosol properties of the formulated Co-SD particles were evaluated, showing FPF, RF, MMAD, and GSM parameters in Table 1 Increasing Leu % resulted in a higher FPF value, indicating a significant difference between all concentrations (p<0.05) , except when Sur is present. The same trend is observed for the ratio of mass deposited in stage 2-7 to stage 1 (% RF), with 10 % Leu showing the highest value. In addition, when suramin salt is present in the formulation, there is a slight decrease in FPF and RF %. On the contrary, MMAD values decreased with increasing Leu content in the solution, as shown in Table 1, observing values range from 11.3 µm to 1.0 µm (p<0.05).

Figure 2A shows the actual aerosol dispersion performance of the form ulated dry powder aerosols by showing the percent deposition of the particles on each NGI™ stage. The aerosol deposition was measured on all stages, and, in particular, remarkably high deposition can be observed in the deep lung region. It is observed that particle mass deposition is switching to lower cut -off stages by increasing Leu %. For example, 0% of Leu deposits more than 60% of the total mass in stage 1 (8.06 µm). Formulations with 2.5 %, 5 %, and 10 % Leu (w/w) showed a % mass deposition of 44.2±0.9 %, 27.7±2.0 %, 14.6±1.3 %, respectively. Th ese results indicate Leu’s capability to improve and achieve high deep lung deposition.
In vitro release of Sur was evaluated after gels were deposited by aerosolization with Dry Powder Insufflator™ into the donor vessel of Franz cells Figure 2B shows a burst release at the first time, around 40 % of total Sur released in the first 6 hours After 48 h, 80% of the Sur was released from formulation
Discussion
Previous studies indicated that alveolar macrophages remove particles with a diameter of 1 –5 µm with an optimum particle size of 2–3 µm [5, 6] Despite the obvious benefits of drug administration through the lungs, the lungs have defense mechanisms such as macrophage phagocytosis and mucociliary clearance Therefore, different efforts have been made to modify inhalable microparticles' s ize, shape, surface charge, and solubility to avoid macrophage clearance [7-10] For evading macrophage clearance, the nano/micro CMC gels were developed to have a respirable (desired aerodynamic size) when dry but swell to a larger size once deposited in the lung. Ni, Zhao [11] formed nanocrystal of cinaciguat and chitosan to prepare respirable swellable microparticles, in vitro evaluating the chitosan
Drug Delivery to the Lungs , Volume 32, 2021 - David Encinas-Basurto et al.
Table 1 Aerodynamic parameters of CMC nano/microgels loaded with Sur (mean ± SD, n = 3). Different letters mean significant differences among columns (p≤0.05).
Figure 2 A). In vitro aerodynamic deposition of nano/micro CMC gel in the NGI after aerosolization using Aerol izer® DPI. Values are mean ± SD, n = 3. B). In vitro Suramin salt release from Co-SD CMC/Sur 10 % Leu nano/microgel particles in PBS over 2 days at 37°C using Franz diffusion cell. (n=3, ave±SD)
49
Drug Delivery to the Lungs , Volume 32, 2021 - Targeting Deep Lungs with Swellable Nano/Microgels for the Delivery of Suramin
microparticles that might be tailored to act as potential respirable swellable carriers for pulmonary sustained drug delivery. In this study, Leu was used as an aerosolization enhancer as previous studies have shown this behavior when nano/microcarriers are combined with Leu [12]. These features contribute to the reduced surface tension of the aqueous feedstock solution, result ing in decreased droplet size during the spray-drying atomization process. In addition, during evaporation solvent, Leu crystalizes an outer shell, forming a hydrophobic layer able to reduce intermolecular forces, reducing particle density, hence their MMADs [13].
Conclusion
CMC nano/microgels were successfully sp ray-dried to produce a suitable inhalable formulation, as indicated by NGI results. In addition, a high % mass deposition was observed when Leu was spraydried along with CMC formulations. Optical microscope images and laser diffraction probed swell characteristics of particles. The CMC gels were designed to have a small size (0.3 -1 µm) when dry but become larger swollen once deposited in the lung to avoid the macrophage clearance. Sustained release of Sur was achieved for more than 24 h ours. All this indicates that this novel approach can be used to deliver large molecular weight drug salt like suramin with swellable CMC nano/microgels
References
1. Mansour, H.M., Y.-S. Rhee, and X.J.I.j.o.n. Wu, Nanomedicine in pulmonary delivery. 2009. 4: p. 299.
2. Geiser, M.J.J.o.a.m. and p.d. delivery, Update on macrophage clearance of inhaled micro -and nanoparticles. 2010. 23(4): p. 207-217.
3. Dumoulin, M., R.J. Johnson, V. Bellotti, and C.M. Dobson, Human lysozyme, in Protein misfolding, aggregation, and conformational diseases. 2007, Springer. p. 285-308.
4. El‐Sherbiny, I.M., S. McGill, and H.D. Smyth, Swellable microparticles as carriers for sustained pulmon ary drug delivery. Journal of pharmaceutical sciences, 2010. 99(5): p. 2343-2356.
5. Hirota, K., T. Hasegawa, H. Hinata, F. Ito, H. Inagawa, C. Kochi, G. -I. Soma, K. Makino, and H. Terada, Optimum conditions for efficient phagocytosis of rifampicin -loaded PLGA microspheres by alveolar macrophages. Journal of controlled release, 2007. 119(1): p. 69-76.
6. Baranov, M.V., M. Kumar, S. Sacanna, S. Thutupalli, and G. Van Den Bogaart, Modulation of immune responses by particle size and shape. Frontiers in immunology, 2020. 11: p. 3854.
7. Wang, Q., Y. Shen, G. Mi, D. He, Y. Zhang, Y. Xiong, T.J. Webster, and J. Tu, Fumaryl diketopiperazine based effervescent microparticles to escape macrophage phagocytosis for enhanced treatment of pneumonia via pulmonary delivery Biomaterials, 2020. 228: p. 119575.
8. Li, J., H. Zheng, X. Li, J. Su, L. Qin, Y. Sun, C. Guo, M. Beck -Broichsitter, M. Moehwald, and L. Chen, Phospholipidmodified poly (lactide-co-glycolide) microparticles for tuning the interaction with alveolar macro phages: In vitro and in vivo assessment. European Journal of Pharmaceutics and Biopharmaceutics, 2019. 143: p. 70-79.
9. Liu, T., M. Han, F. Tian, D. Cun, J. Rantanen, and M. Yang, Budesonide nanocrystal-loaded hyaluronic acid microparticles for inhalation: In vitro and in vivo evaluation. Carbohydrate polymers, 2018. 181: p. 1143-1152.
10. Takeuchi, I., Y. Taniguchi, Y. Tamura, K. Ochiai, and K. Makino, Effects of L-leucine on PLGA microparticles for pulmonary administration prepared using spray drying: Fi ne particle fraction and phagocytotic ratio of alveolar macrophages. Colloids and surfaces A: physicochemical and engineering aspects, 2018. 537: p. 411-417.
11. Ni, R., J. Zhao, Q. Liu, Z. Liang, U. Muenster, and S. Mao, Nanocrystals embedded in chitosan-based respirable swellable microparticles as dry powder for sustained pulmonary drug delivery. European Journal of Pharmaceutical Sciences, 2017. 99: p. 137-146.
12. Lamy, B., D.R. Serrano, P. O’connell, W. Couet, S. Marchand, A.M. Healy, and F. Tewes, Use of leucine to improve aerodynamic properties of ciprofloxacin-loaded maltose microparticles for inhalation. European Journal of Pharmaceutical Research, 2019. 1(1): p. 2-11.
13. Alhajj, N., N.J. O'Reilly, and H. Cathcart, Leucine as an excipient in spray dried powder for inhalation. Drug Discovery Today, 2021.
50
Improving Physical and Aerosol Stability of Spray Dried High -dose Dry Powder Inhaler Formulations
NiveditaShetty1,2,
Heejun Park2, Dmitry Zemlyanov3 & Qi (Tony) Zhou21Department of Small Molecule Pharmaceutical Sciences, Genentech, Inc., One DNA Way, South San Francisco, CA 94080
2 Department of Industrial and Physical Pharmacy, College of Pharmacy, Purdue University, 575 Stadium Mall Drive, West Lafayette, IN 47907, USA
3 Birck Nanotechnology Center, Purdue University, 1205 West State Street, West Lafayette, IN 47907, USA
Summary
Dry powder inhalers (DPI) have been one of the most promising developments in drug delivery systems because powders tend to be more stable than nebulized solution or suspension, do not require propellants and are portable. However, delivering high-dose antibiotics through a DPI is still a challenge. Spray drying is popular for producing DPI formulations as it enables engineering of drug particles; but many spray dried compounds are amorphous in nature and physically unstable. This study aimed to develop dry powder inhaler (DPI) combination formulations of ciprofloxacin and colistin for use in respiratory infections. Effects of colistin on physical stability and a erosolization of spray-dried ciprofloxacin were examined. Our work has shown that recrystallization of amorphous spray dried ciprofloxacin led to significant changes in aerosol performance of DPIs upon storage, which cause critical quality and safety concerns. Our study demonstrated, for the first time, that co -spray drying ciprofloxacin with colistin not only enhances the physical stability of the amorphous powder formulation through intermolecular interactions, but also improves the aerosolization through surface enrichment of colistin We have successfully incorporated synergistic antibiotics in a single particle which ensure s the simultaneous delivery of combinations to the same infection sites, potentially maximizing antimicrobial synergy.
Key Message
This study provides a fundamental understanding in storage -induced physical and aerosol instability of the spray dried powder formulations. Also, it offers novel strategies to tackle both the multi-drug resistant problem and physical stability issue of spray dried formulations by combining two synergistic antibiotics into a single formulation
Introduction
Pulmonary drug delivery has gained popularity in treating lower respiratory tract infections ( LRIs) because drugs can be delivered directly to the infection sites in the lungs with minimum systemic exposure [1]. Dry powder inhalers (DPI) have been one of the most preferred inhaler devices because they can deliver high-dose of antibiotics directly to the lung s as a convenient administration whilst minimizing systemic adverse effects [2] . Spray drying is popular for producing DPI formulations as this process enables modifying particle morphology, size and surface properties o f drug particles[3]; however, many spray dried compounds are amorphous in nature and physically unstable
In our previous study, we had observed that the spray d ried powder of ciprofloxacin was amorphous in nature and crystallized on storage at RH > 55%, thereby altering the aerosol performance [4]. Such significant changes in aerosol performance of DPIs upon storage may cause critical quality concerns in product stability. Therefore, it is crucial to understand the mechanisms of such impact of crystallization on aerosol performance to ensure the quality and stability of the DPI products. Our study has systematically examined the impact of crystallization of spray dried drug particles o n aerosol performance after storage at different values of relative humidity (RH) The proposed study aimed to address physical stability issue using spray drying to combine two synergistic antibiotics into a single DPI formulation with satisfactory physic al stability and aerosol performance.
We proposed a novel solution to overcome physical instability associated with spray dried amorphous ciprofloxacin. Through this project we aimed not only to improve our understanding of this problem, but also to offer an innovative solution for preventing instability of spray dried ciprofloxacin powder due to crystallization, through co-spray drying with synergistic antibiotics such as colistin An additional advantage of this novel appr oach might be a better cure or control of respiratory tract infections associated with multidrug resistant bacteria, through synergistic activity of multiple drugs.
Drug Delivery to the Lungs , Volume 32, 2021 - Nivedita Shetty et al.
51
Materials and Methods
Chemicals
Colistin sulfate (referred to as colistin) and ciprofloxac in hydrochloride monohydrate (abbreviated as Col and Cipro, respectively) were purchased from ßetaPharma ® Co., Ltd (Wujiang City, JiangSu Province, China). Acetonitrile (HPLC grade) and magnesium nitrate were supplied by Fischer Scientific (Fair Lawn, NJ, USA).
Methods
The combination DPI formulations were produced by co -spray drying colistin and ciprofloxacin in mass ratios of 1:1, 1:3 and 1:9. The spray-dried powders were divided into two equal parts and stored at the following conditions: (1) in a desiccator containing silica gel to maintain 20 ± 2% RH at 20 ± 2 °C; (2) in a humidity chamber containing saturated magnesium nitrate solution to maintain 55 ± 2% RH at 20 ± 2 °C (3) in a desiccator containing saturated sodium chloride solution to maintain 75% ± 2% RH at 20 ± 2 °C. The physical and aerosolization stability of the selected co -sprayed formulations stored at the above conditions were examined. Formulation characterizations were carried out using powder X-ray diffraction (PXRD) for crystallinity and scanning electron microscopy (SEM) for morphology . Particle surface analysis was performed using X-ray photoelectron spectroscopy (XPS) and energy dispersive X-ray spectrometry (EDX) Potential intermolecular interactions were studied using Fourier -transform infrared spectroscopy (FTIR). Fine particle fraction (FPF) which represents particles with aerodynamic diameter less than 5 micron was evaluated using a multi-stage liquid impinger (MSLI) delivering the dry powder-generated aerosol from a RS01 plastiape device. FPF also referred to as aerosol performance for simplicity,
Results and Discussion
The PXRD diffractograms showed the spray -dried ciprofloxacin powders stored at 20% RH were amorphous; whereas those stored at 55% RH and 75% RH had crystallized (Figure 1) Crystallization under humid conditions altered the surface morphology of ciprofloxacin particles and affected the aerosol performance. Interestingly, there was an improvement in FPF of the spray dried ciprofloxacin formulation stored at 55% RH. This outcome was due to moisture-induced crystallization that caused increase in surface roughness and consequent decrease in ‘particle -particle interactions’ (Fig ure 1). On the other hand, there was a drastic decrease in aerosol performance at 75% RH which was due to particle fusion in presence of excessive moisture (Figure 1).
Adding Colistin to the formulation inhibited the tendency of amorphous ciprofloxacin to crystallize when stored at 55% RH (Figure 2A). PXRD diffractograms showed that the co -spray dried colistinciprofloxacin formulation in the mass ratio (1:1) was amorphous at 55% RH for u p to 60 days; whereas the co-spray dried colistin-ciprofloxacin (1:3) and colistin-ciprofloxacin (1:9) crystallized after storage at 55% RH. However, the extent of crystallization for the combination formulations was less as compared to the spray-dried ciprofloxacin alone formulation (Figure 2A) Such inhibitory effect could be due to polymer-like properties of colistin that acts as a matrix material and reduces the molecular mobility of
Drug Delivery to the Lungs , Volume 32, 2021 - Improving Physical and Aerosol Stability of Spray Dried High -dose Dry Powder Inhaler Formulations
52
Ciprofloxacin, as proved by FT -IR results (Figure 2C). FT-IR results suggested that intermolecular interactions like hydrogen bonding between colistin and ciprofloxacin inhibited crystallization of amorphous spray-dried ciprofloxacin, and this inhibition effect was most significant at the weight ratio of 1:1 From the significant changes in IR spectra of co -spray dried ciprofloxacin and colistin, it can be suggested that hydrogen bond can be formed between the carboxyl C=O group of ciprofloxacin as a hydrogen acceptor and the amide II N -H of colistin as a hydrogen donor Therefore, all these changes in FT-IR spectrum provide strong evidence for the intermolecular interactions via a hydrogen bond between ciprofloxacin and colistin molecules
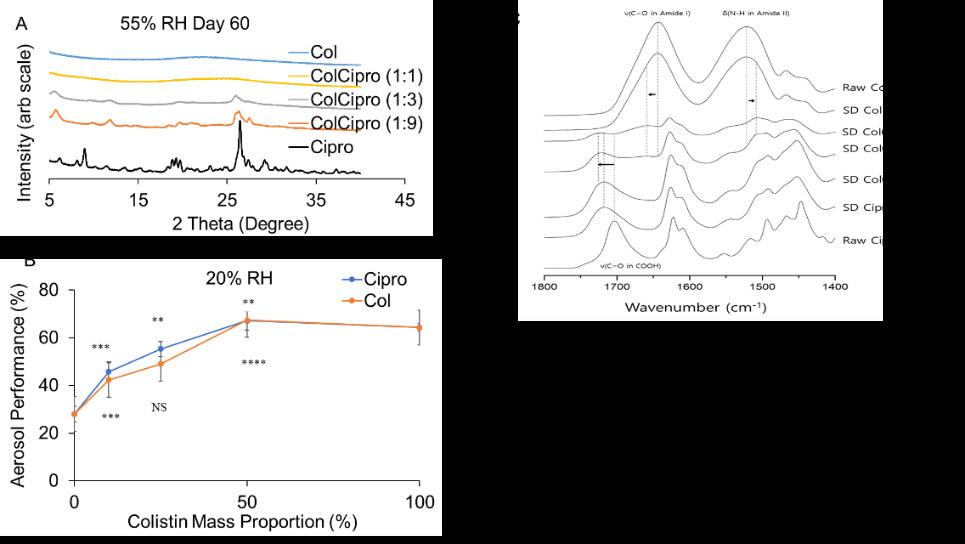
Thus, FPF of co-spray dried colistinciprofloxacin formulation in the mass ratio (1:9), (1:3) and (1:1) were significantly higher (p < 0.0001) than that of spray-dried ciprofloxacin alone (Figure 2B) We hypothesize that colistin improved the FPF by enriching on the particle surfaces, which was confirmed by XPS (Table I) The surface colistin concentration was higher than the theoretical colistin composition for each formulation (Table I). XPS detected 74% of the surfaces were colistin for the ColCipro (1:1) formulation, compared with 50% theoretical colistin based on carbon c omposition Thus, for all 3 formulations the measured XPS surface composition for colistin was significantly higher than the corresponding theoretical values, indicating enrichment of colistin on the particles surface in the co -spray dried colistinciprofloxacin formulations. Our earlier studies showed colistin has self -assembling and surface-active properties [5] with low surface energy [6]; thus, surface enrichment of colistin resulted in improved aerosolization and intermolecular interactions due to hydrogen bondi ng inhibited crystallization of ciprofloxacin.
Drug Delivery to the Lungs , Volume 32, 2021 - Nivedita Shetty et al.
Formulations ColCipro_1:1 ColCipro_1:3 ColCipro_1:9 Theoretical Composition (%) colistin 10 25 50 ciprofloxacin 90 75 50 Measured Surface Composition (%) as determined by C 1s curve-fits colistin 35 60 74 ciprofloxacin 65 40 26 53
Table I: Surface compositions (% mass ratio) measured by XPS for the co-spray dried colistin-ciprofloxacin formulations compared to theoretical composition
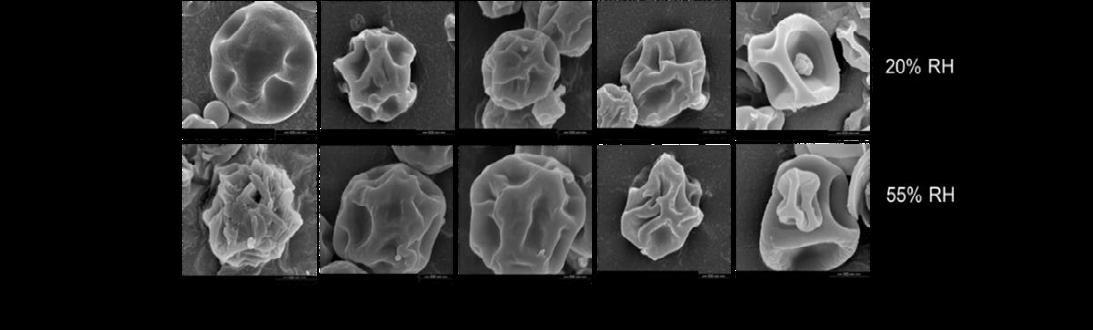
There was no change in the particle morphology and no significant change in FPF (p > 0.05), which indicated the physical and aerosolization stability (Figure s 3 and 4, respectively). The co-spray dried
ColCipro formulation in the mass ratios (1:3) and (1:9) crystallized after 3 days of storage at 55% RH; however, no change in particle morphology and FPF was observed in these formulations at 55% RH for up to 60 days (Figures 3 and 4, respectively).
Conclusions
We have developed combination DPI formulations of ciprofloxacin and colistin through co-spray drying. Colistin in the formulation inhibited the tendency of amorphous ciprofloxacin to crystallize when stored at 55% RH, resulting in enhanced physical stability. Such inhibitory effect could be due to polymer -like properties of colistin that acts as a matrix material and reduces the molecular mobility of ciprofloxacin, as indicated by the FT-IR results. Moreover, addition of colistin improved the FPF as compared to the spray dried ciprofloxacin alone formulation, which is attributed to enrichment of colistin on the surface of the co-spray dried formulation as measured by XPS
Drug Delivery to the Lungs , Volume 32, 2021 - Improving Physical and Aerosol Stability of Spray
High -dose Dry Powder Inhaler Formulations
Dried
B C D 0 20 40 60 80 Cipro FPF Col FPF Average mass recovered (%) ColCipro (1:9) 20% RH Day 1 55% RH Day 1 55% RH Day 3 55% RH Day 60 0 20 40 60 80 Cipro FPF Col FPF Average mass recovered (%) ColCipro (1:3) 20% RH Day 1 55% RH Day 1 55% RH Day 3 55% RH Day 60 0 20 40 60 80
Col FPF Average mass recovered (%) 20% RH Day 1 55% RH Day 1 55% RH Day 3 55% RH Day 60 ColCipro (1:1)
Figure 3: SEM images of the spray dried drug alone and co-spray dried colistin-ciprofloxacin powder formulations stored at 20%and 55% RH for 60 days.
Cipro FPF
54
Figure 4: Fine particle fraction of ciprofloxacin and colistin in the co -spray dried (1:1), (1:3) and (1:9) mass ratios stored at 20% RH for 1 day and 55% RH for 60 days
Drug Delivery to the Lungs , Volume 32, 2021 - Nivedita Shetty et al.
Our study demonstrated that co-spray drying ciprofloxacin with the synergistic antibiotic, colistin, not only enhanced the physical stability of amorphous powder formulation through intermolecular interactions, but also improved the aerosolization through surface enrichment of colistin.
References
1. Zhou, Q.T., et al., Emerging inhalation aerosol devices and strategies: where are we headed? Advanced drug delivery reviews, 2014. 75: p. 3-17.
2. Lin, Y.-W., et al., Powder production and particle engineering for dry powder inhaler formulations. Current pharmaceutical design, 2015. 21(27): p. 3902-3916.
3. Vehring, R., Pharmaceutical particle engineering via spray drying. Pharmaceutical research, 2008. 25(5): p. 999-1022.
4. Shetty, N., et al., Effects of Moisture-Induced Crystallization on the Aerosol Performance of Spray Dried Amorphous Ciprofloxacin Powder Formulations. Pharmaceutical Research, 2018. 35.
5. Wallace, S.J., et al., Self-assembly behavior of colistin and its prodrug colistin methanesulfonate: implications for solution stability and solubilization. The Journal of Physical Chemistry B, 2010. 114(14): p. 4836-4840.
6. Jong, T., et al., Investigation of the changes in aerosolization behavior between the jet -milled and spraydried colistin powders through surface energy characterization. Journal of pharmaceutical sciences, 2016. 105(3): p. 1156-1163.
55
56
Drug Delivery to the Lungs , Volume 32, 2021 - Joana T. Pinto et al.
Spray-congealing and wet-sieving as alternative processes for the engineering of D-mannitol carriers
Joana T. Pinto1, Sarah Zellnitz1, Tomaso Guidi2, Francesca Schiaretti2, Hartmuth Schroettner3,4, Amrit Paudel1,5
1Research Center Pharmaceutical Engineering GmbH, Inffeldgasse 13, 8010 Graz, Austria
2Chiesi Farmaceutici S.p.A., R&D Department, Largo F. Belloli 11/A - 43122 Parma, Italy
3Austrian Centre for Electron Microscopy and Nanoanalysis, TU Graz, Steyrergasse 17/III, 801 0 Graz, Austria
4 Graz Centre for Electron Microscopy, Steyrergasse 17/III, 8010 Graz, Austria
5Institute of Process and Particle Engineering, TU Graz, Inffeldgasse 13, 8010 Graz, Austria
Summary
D-mannitol has emerged as potential alternative carrier for dry powder inhalation (DPI). Herein, we explored different innovative particle engineering processes, i.e. wet-sieving and spray-congealing, to produce D-mannitol particles suitable for inhaled delivery. T o evaluate the impact of these on the particle properties, the resulting powders were characterized concerning their solid -state, micromeritics and flowability. Afterwards, D-mannitol was blended with beclomethasone dipropionate (BDP) to form low dose (1 wt%) DPI formulations and the in vitro aerosolization performance was evaluated using a NEXThaler®. Wet-sieving generated D-mannitol particles with a narrow particle size distribution (PSD) and spray-congealing free-flowing spherical particles. The more uniform pumice particles with deep voids of wet-sieved D-mannitol were beneficial carriers to drug aerosolization, only when used in combination with 10 wt% of a ternary agent. In turn, the spray-congealed D-mannitol has shown to be promising in terms of the relative increase of deposited drug, when used without the addition of ternary agents.
Key Message
Wet-sieving generated carriers with a narrow particle size distribution and enable d better control of the number of fines in the formulation, which showed to play a critical role in the aerodynamic performance. Spray-congealing generated smooth free-flowing spherical particles able to enhance the in vitro aerosolization of binary mixtures
Introduction
To reach the lower respiratory airways, dry powder inhaled drug particles have to be in the size range between 0.5/1.0-5.0 µm and are thus, very cohesive, possessing poor flow. The flowability and dispersibility of this drugs can be improved by mixin g this with coarse excipient particles, the carrier . αlactose monohydrate (α-LH) is the material typically used to achieve this end. α-LH can be blended solely with the active pharmaceutical ingredient ( API), forming binary blends or can be mixed with the drug and other excipient particles that are added to improve the aerosolization [1]. These excipient particles, presenting a size smaller than the coarse carr ier, are usually known as ‘fines’. Excipient fines are usually magnesium stearate (MgSt) or lactose particles alone or in a mixture. Although, α-LH has been typically used as a carrier, D-mannitol, a sugar approved for inhalation, is regarded as a good alternative. Herein, we explored spray-congealing and wet-sieving as particle engineering processes to produce alternative D-mannitol carriers for DPIs [2] To evaluate the impact of engineering on particle properties, the D-mannitol powders were characterized concerning their solid-state, micromeritics and flowability. Afterwards, D-mannitol was blended (in binary and ternary mixtures) with low doses (1 wt%) of BDP. The resulting blends were tested in combin ation with a NEXThaler® to evaluate their aerosolization performance.
Materials and Methods
D-mannitol (Pearlitol® 300DC) was purchased from Roquette (France). InhaLac120 ® was obtained from Meggle (Germany). BDP with a mean particle size of 1.05 µm was provided by Chiesi Pharmaceutici S.p.A, Italy. MgSt and acetone were purchased from Merck KGaA (Germany).
Particle Engineering
For wet-sieving D-mannitol and acetone (anti-solvent) were mixed in a 1:2 wt% rat io and placed in an ultrasonic bath for 5 min. The resulting mixture was transferred to the top of a sieve tower placed on a
57
Drug Delivery to the Lungs , Volume 32, 2021 - Spray-congealing and wet-sieving as alternative processes for the engineering of D-mannitol carriers
vibratory sieve shaker (AS200, Retsch, Germany). The wet -sieving of the powder was then carried out by consecutively rinsing the sample with acetone (400 ml for 20 g of powder) as the tower was vibrating (0.2 intensity). When the process was finished, the washed material was transferred to a filter paper and placed under a fume hood to dry for 24 h. For spray-congealing D-mannitol was first placed in an oven at 190°C and once a melt was obtained this was transferred to a heated vessel kept at 200°C. The molten fluid was pumped at 20.0 ± 1.4 g/min from the vessel to a heated bi -fluid nozzle (ø 1.2 mm) and atomized (0.44 bar) into a glass tower chilled at -10°C, using a nitrogen flow of 0.6 m 3/min (4M8-TriX spray-congealer, ProCepT, Belgium) [3]. The solidified particles were separated from the air stream using a cyclone at a pressure drop of 13 mbar and collected in a glass vessel at 13°C. During processing no evidence of any yellowish samples ( characteristic of the degradation of sugars due to caramelization ) was observed Thus it was inferred that D-mannitol was stable enough to be processed via spraycongealing.
Particle Characterization
To observe the samples, the powders were sputtered with gold -palladium and then examined using a Zeiss Ultra 55 scanning electron microscope (Zeiss, Germany), operating at 5 kV. The PSD was determined by laser light diffraction (HE LOS/KR, Sympatec GmbH, Germany). For this the powders were dispersed (Rodos, Sympatec) at 1.0 bar and analyzed within the size range between 0.45 875.0 µm. The solid-state of the particles was characterized by wide-angle X-ray scattering (WAXS, S3MICRO camera, Bruker AXS GmbH, Germany). For this, the powder samples were filled into 2 mm glass capillaries and analyzed under constant rotation (9 rpm) between the angular range of 17 27° 2θ during 600 s at 30 counts/s (22 ± 2°C).
Powder Flowability
The flowability of the powders was measured using a FT4 Powder Rheometer (Freeman Technology, UK), using a pre-conditioning cycle and shear of 7, 6, 5, 4, and 3 kPa. The flowability parameters of the powders were obtained from the Mohr’s stress circles. The major princip al (δ1) and unconfined yield (δc) stresses are the highest values at which the larger and smaller Mohr’s stress intercept the x axis. The cohesion (Coh) is the point of intersection of the yield locus (normal stress = 0). The flow function coefficient (ffc) is the ratio between the major principal stress and the unconfined yield stress. The angle of internal friction (AIFeff) was determined from the effective yield locus.
Evaluation of the performance for dry powder inhalation
To evaluate the applicability of the D-mannitol powders as carriers for inhalation, the particles were blended in a Turbula blender TC2 (Willy A. Bachofen Maschinenfabrik, Switzerland) with BDP in binary and ternary blends (using either 0.2 wt% MgSt or 10 wt% ‘Preblend’ (Preb), composed of InhaLac® 120 and 0.2% MgSt). After mixing all the blends presented a relative standard deviation (RSD) < 7% and were found appropriate to be further tested c oncerning their in vitro aerodynamic performance. The shot weight consistency was analyzed by firing the inhalers 10 times into a DUSA (dosage unit sampling apparatus) and determining the mass delivered via each actuation using the weight difference, before and after emission. The mean weight of 10 shots and respective standard deviation (SD) were calculated to evaluate the mass consistency. The aerodynamic performance of binary and ternary DPI blends was assessed via the Next Generation Impactor (NGI, Copley Scientific, UK). For each NGI experiment, one shot of the conditioned (at 60% RH) NEXThaler ® was discharged. A flow rate was of 60 L/min was applied for 4 s to ensure that 4 L of air were drawn via the mouthpiece o f the inhaler. The drug content in each part of the impactor was quantified using HPLC (high performance liquid chromatography ).
Results and discussion
Impact of engineering on the particle properties
In Figure 1a it can be observed that Pearlitol® 300DC (Pearl300) was composed of large rough particles with a notable quantity of smaller particles filling its cervices. Laser diffraction (Figure 2a) showed that Pearl300 had a notable fraction of particles < 10 µm (2.08%). Wet-sieving of Pearl300 (Pearl300_WS) significantly decreased the percentage of fine particles (0.45%). However, a lthough we fractionated the larger faction of particles of D-mannitol (> 100 µm), there was a notable decrease of the Dv 0.5. As observed in Figure 1b, due to the fines of Pearl300 being washed way, wet-sieving resulted in particles with a pumice appearance Accordingly, the rough surface of Pearl300 became apparent. Likewise, we hypothesize that the pronounced irregularities at the surface of Pearl300_WS led to higher -angle
58
scattering posing an explanation why smaller Dv 0.5 and Dv0.9 were observed after washing. In turn, spraycongealing of Pearl300 (Pearl300_SC) resulted in the production of spherical particles. The particles produced also presented a notably smaller Dv0.5. Additionally, they also presented a larger SPAN Indeed, in Figure 1c, it is possible to observe the presence of single spherical particles of diverse sizes. During spray-congealing, by the use of a twin -fluid nozzle, the viscous melt was injected into a high velocity gas leading to the formation of droplets. Thus, when compared to other melt solidification techniques, that rely on hydrodynamic instabilities, twin -fluid atomization tends to lead to the formation of smaller particles; and because jet-breakage is more uncontrollable, droplets of various sizes are formed, leading particles with a wider size SPAN [2]. Likewise, the Pearl300_SC samples also s howed a considerable amount of particles < 10 µm (1.88%). The WAXS analysis (Figure 2b) of the raw Pearl300 revealed that the sample was composed of β-mannitol particles. Washing with acetone did not result in any detectable changes in the solid-state of Pearl300_WS. In turn, the WAXS patterns of Pearl300_SC showed that the sample was predominately composed of the α-form of D-mannitol with trace amounts of the δ one. The presence of trace amounts of δ -mannitol in Pearl300_SC raised concerns about the stability of the particles hence, the sample was conditioned for 24 h at 93% RH [3] and afterwards blended with BDP.
Impact of engineering on powder flowability
Pearl300 and Pearl300_WS, revealed a ffc of 2.21 ± 0.52 and 4.07 ± 0.19, respectively. Thus, according to the Jenike classification, the two powders were classified as cohesive. For Pearl300, the surface treatment notably decreased the Coh. Pearl300_SC showed a notably smaller value of cohesion and a ffc of 15.87 ± 4.03. Engineering by spray -congealing changed the flow of D-mannitol from cohesive to free flowing. The AIFeff supplies information about the frictional forces within the powder ( particleparticle) during flow and thus, an important parameter to also evaluate In relation to Pearl300, Pearl300_WS presented a smaller AIFeff We hypothesize that for this sample the differences in the AIF eff were mostly driven by washing out the smaller sized particles (< 100 µm) and that the fractionation of the powders led to the reduction of particle-particle contacts. Likewise, friction within the powder was decreased and an improvement in the flow of Pearl300_WS was observed (lower coh and ffc). Interestingly, the AIFeff value of the Pearl300_SC and Pearl300_WS were very similar. Thus, it is suggested that for Pearl300_SC the improvement in flow was mostly due to the different packing state of the powder bed and not to decreased particle -particle contacts. Due to the spherical and smooth nature of Pearl300_SC particles, the powder will present similar density in its packed and dilated conditions, facilitating flow.
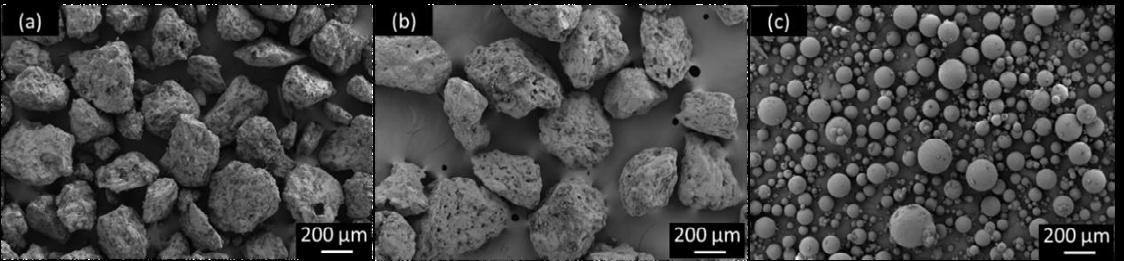
Drug Delivery to the Lungs , Volume 32, 2021 - Joana T. Pinto et al.
59
Figure 1 – Scanning electron microscopy (SEM) images of (a) Pearl300, (b) Pearl300_WS and (c) Pearl300_SC.

Impact of engineering on shot weight consistency
It is generally reported that rough and irregular carrier particles have a higher loading capacity compared to smooth ones Likewise, due to the very smooth uniform surface morphology of Pearl300_SC no ternary blends were prepared with this carrier. In Figure 3a, it can be observed that for the binary blends, Pearl300_WS led to lower inter-device variability. We propose, this was a consequence of producing more uniform sized powders via wet-sieving. Due to the disparity between device performances containing Pearl300 as a carrier, no clear inference concerning the effect of wet -sieving on intra-device variability could be made. A crucial observation was that Pearl300_SC led to a higher mean mass of powder being dosed per shot (9.9 to 13.4 mg). Spherical shaped materials are known to pack more uniformly compared to irregular ones, so for the same recess volume a higher powder mass of Pearl300_SC could be dispensed. It was also observed that for Pearl300_SC the two devices tested showed identical performances. Here, this cannot be attribu ted to the SPAN of the material, h owever, Pearl300_SC demonstrated better flow, which has been associated with more consistency during powder filling and could potentially explain the observed results. Still, Pearl300_SC showed a larger intra-device variability (RSD ~ 6%). The addition of MgSt to the blends of Pearl300 + BDP did not have any notable impact on the inter - and intra-device variability. However, for Pearl300_WS the use of the salt led to the deterioration of inter- and intra-device variability. The reason underlying this behavior needs to be clarified. The addition of Preb to Pearl300, increased the mass (9.5 to 10.9 mg) of the emitted dose (ED) and improved inter-device variability. Whereas, for Pearl300_WS, the addition of Preb did not have any notable impact on inter-device variability, but increased the intra -device RSD from ~ 4.5% to 9.2%. We hypothesize, that the different impact of Preb on the D -mannitol carriers was related to the very distinct surface topography between Pearl300 and Pearl300_WS. For Pearl300, it is speculated that the concentration of Preb plus the initial fines content were ideal to adequately coat its rough surface, originating a denser packing that produced an increase of the emitted mass. In contrast, for the rougher surface of Pearl300_WS with reduced initial amount of fines, the concentration of Preb was not enough to cause potential changes in the powder bed packing. Thus, no differ ences in the emitted mass were observed. With respect to intra -device variability, generally, higher RSDs were observed for Pearl300_WS and Pearl300_SC blends. It is suggested that the more efficient detachment of fine particles from Pearl300_WS and Pearl300_SC (shown by their higher fine particle fraction (FPF)) could have resulted in higher RSDs, due to a more efficient de-agglomeration. That is, the latter led to more particles of different sizes being generated within the vortexes of NEXThaler® and this, resulted in higher variability due to segregation
Impact of engineering on in-vitro aerodynamic performance
Considering that only duplicates were tested, no statistical analysis was performed, thus in this in this section the impact of engineering on the aerodynamic performance will only be discussed in relative terms In the binary blends, the ED values were comparable between s tarting and wet-sieved material, in line with the shot weight results , where no difference in emitted mass was observed. Pearl300_WS showed a slightly lower fine particle mass (FPM) than Pearl300. By contrast, Pearl300_SC showed 75% higher ED and 168% higher FPM than Pearl300. Concerning the FPF of the various D-mannitol carriers
Drug Delivery to the Lungs , Volume 32, 2021 - Spray-congealing and wet-sieving as alternative processes for the engineering of D-mannitol carriers
Figure 2 – Particle size distribution (a) and WAXS spectra (b) of the D-mannitol powders (n = 3, mean ± SD)
60
(Figure 3b), a slight increase in the FPF was observed when using Pear300_SC, indicating better API de-attachment. Hence, it can be inferred that the improvement in ED and FPM was mainly due to two factors; the better API de-attachment and the increase in the mass delivered per shot ( ca. 40% more). The addition of ternary agents is reported to increase the deposition of the API at the lower stages of the NGI by varying mechanisms [1]. Likewise, it was not surprising to verify that the addition of MgSt and Preb, overall, increased the FPM of D-mannitol In Figure 3b, one can clearly see how the different carriers and ternary agents affected drug de-attachment. The highest FPF of all the tested formulations was achieved using Pearl300_WS + Preb. For this system, the wet-sieved carrier showed a notably better performance than the starting material. This can be explained by the deep cl efts on the surface of Pearl300_WS being filled up with Preb during the blending process and allowing BDP to be more efficiently detached from its surface. In contrast, the comparably smaller amount of MgSt was not enough to cause this effect. In turn, for Pearl300, the addition of Preb did not further increase the FPF compared to the ternary blends with MgSt. For Pearl300, the total amount of intrinsic fines plus API seemed already too high, for the addition of Preb to cause a positive effect. The FPF delivered from the spray-congealed carrier was notably higher when compared to the FPF of the starting material. Comparison of the FPF of Pearl300_SC to the one from Pearl300_WS, shows that the use of the latter without ternary agents did not notably impact the FPF of D -mannitol. Likewise, without the addition of ternary agents, Pearl300_SC has shown to be promising in terms of the relative increase of the FPF, in comparison to the starting material.
Conclusions
Wet-sieving and spray-congealing have shown to be innovative particle engineering proce sses able to produce carriers for inhalation. Wet-sieving, generated carriers with a narrow PSD that enabled to better control the number of fines in the formulation. However, the wet-sieved materials only had a beneficial effect over the raw material when combined with 10 wt% of fines (Preb) Spray-congealing generated smooth spherical particles that were able to enhance the in vitro aerosolization of binary blends, due to their improved flowability and API detachment.
References
[1] Grasmeijer F, Lexmond A J, van Den Noort M, Hagedoorn P, Hickey A J, Frijlink H W, et al. New mechanisms to explain the effects of added lactose fines on the dispersion performance of adhesive mixtures for inhalation. PLoS One 2014;9.
[2] Pinto J T, Zellnitz S, Guidi T, Schiaretti F, Schroettner H, Paudel A. Spray-Congealing and Wet-Sieving as Alternative Processes for Engineering of Inhalation Carrier Particles: Comparison of Surface Prop erties, Blending and In Vitro Performance, Pharm Res 2021; 38: pp.1107–23.
[3] Guidi T, Paudel A, Zellnitz S, Teixeira Pinto J. Novel carrier particles for dry powder formulations for inhalation. World Intellectual Property Organization (WO 2020/020957 A1); 2020. p. 33.
Drug Delivery to the Lungs , Volume 32, 2021 - Joana T. Pinto et al.
Figure 3 – (a) shot weight consistency, where the grey dots represent one inhaler each (n = 10, mean, maximum and minimum values are represented), (b) FPF of the D-mannitol carriers (n = 2, mean ± range).
61
62
Using microscopic high-speed imaging to quantify agglomerate-to-wall impaction in dry powder inhalers
Athiya Azeem1, Gajendra Singh1, Hak-Kim Chan3, Lunjian Li2, Runyu Yang2, Agisilaos Kourmatzis11School of Aerospace, Mechanical and Mechatronic Engineering, The University of Sydney, NSW 2006, Australia
2School of Materials Science and Engineering, UNSW Sydney, NSW 2052, Australia
3School of Pharmacy, The University of Sydney, NSW 2006, Australia
Summary
The lack of predictability in the performance of dry powder inhalers (DPI) has long been a challenge in the field of inhaled drug delivery This is due to complex interactions between device and powder formulation that remain poorly understood, most notably, in the process of deagglomeration This study demonstrates an image processing technique that is able to quantify agglomerate to wall collision events using high-speed microscopic images taken from an optically accessible device. Mannitol of particle aerodynamic diameter, d50 = 2.92 µm (M3) and d50 = 4.96µm (M5), at a constant flow rate of 30 SLPM (inlet: 10 m/s) and 60 SLPM (inlet: 20 m/s) were used to compare the effect of particle size distributi on and flowrates
Both flowrate and particle size were found to influence collision frequencies For M3 powder, an increase in flow rate resulted in a significant increase in collision frequency over the field of view (FOV) examined; however, as the particle size increased, the effect of flow rate diminished It was also observed that at 30 SLPM the particle size played a more significant role in the frequency of agglomerate-to-wall collisions than they did at 60 SLPM for the location examined in this device.
Additional fields of view must be analysed in conjunction with global imaging to better understand the overall flow behaviour in future. However, these results have demonstrated the utility of advanced image processing in quantitatively characterizing agglomerate -to-wall collision events, which would ultimately correlate with the production of fine particles
Key Message
A methodology was developed to identify collision frequency of agglomerate-to-wall impaction from highspeed microscopic images . This work demonstrates an ability to quantify significant differences that arise from change in flow rate and powder constituent s ize The technique leads to an improved understanding of deagglomeration mechanisms within dry powder inhalers.
Introduction
Dry powder inhalers (DPI) have the potential to offer fast and non-invasive drug delivery to the lung in order to treat a number of conditions [1] Despite their potential, DPIs can suffer from high variability in the delivered dose [2] which arises from a number of factors that are not understood in their entirety. Recent years have seen numerous studies into the aspects of inhaler performance that improve their overall efficacy, such as design, patient interaction (as it relates to pressure drop achieved) and the powder formulation used [3]
To achieve improved drug deposition in the lungs, a greater understanding of powder dispersion in inhaler devices is necessary DPIs can deliver powder through either a carrier-based system or as a pure active pharmaceutical ingredient (API) [4] . This study examined the latter case for simplicity and focused on better quantifying the mechanisms of deagglomeration that lead to a higher fine particle fraction (FPF). Previous studies have identified three main modes of deagglomeration: 1) particle to particle impaction, 2) particle to surface impaction, and 3) turbulence [5] Several studies have noted the relative dominance of these modes of dispersion for devices/setups either through qualitative observations [5] or numerical simulations [6] One study by Kou et al. [5] addressed this qualitatively and observed varying degrees of dominance for each mode of deagglomeration depending on the agglomerated strength. Whilst some progress in our understanding has been made, t he approaches used to date have not generally been capable of identifying the root cause for a particular deagglomeration mechanism, as this requires detailed quantitative and highly resolved data on the internal dynamics of agglomerates in inhaler devices
Drug
Delivery to the Lungs , Volume 32, 2021 – Athiya Azeem et al.
63
This investigation aimed to address this gap in experimental work by providing further quantitative evidence that demonstrates the effect of particle size and flow rate on powder dispersion due to particle to surface impact. This outcome was achieved by looking at deagglomeration of pure mannitol agglomerates in a swirl chamber from an in-house inhaler device.
Materials and Methods
The powder imaged within the inhaler was spray -dried mannitol with a particle size of d50 = 2.92 µm (span, defined as (����90 ����10 ����50 )= 1.61) and d50 = 4.96µm; span = 1.87 [7] Henceforth these powders were referred to as M3 and M5 respectively. Respitose® (SV010-DFE pharma) lactose carrier particles with d50 = 104.36 µm; span = 1.68 were used for calibration as they do not agglomerate and the distribution of particle aerodynamic diameter measurements from the code could be compared with data obtained by laser diffraction using a Malvern 2000 Mastersizer
The imaging setup consisted of an Oxford Lasers Firefly 300W laser and a Photron Mini AX100 highspeed camera that was utilised to image through an optically accessible device A field of view of 528 x 768 pixels was chosen with a scale of 5.09 µm/pixel (corresponding to an area defined as 2.69 x 3.91 mm). Images were taken at a rate of 10,000 frames per second. For further details on the precise imaging set up, please see reference [7] The chosen field of view was located near a wall downstream of an air inlet where collisions have frequently been observed qualitatively as shown in Figure 1 Each powder was tested, in triplicate, at both 30 SLPM and 60 SLPM.
Raw images were then binarized and processed to extract the geometric properties and calculate trajectories for agglomerates larger than 50 µm Additional details on the image processing and velocity calculation procedures can be found in previous works [8] The predictive particle-to-wall collision algorithm used the velocity and position of agglomerates to estimate where the agglomerate would appear in the next frame as shown in Figure 2. If the agglomerates were at an acceptable distance from the wall, defined here as when the centroid is half the major axis length from the wall, then it is predicted that a collision should occur in the next time step. This method was calibrated with images generated from discrete element method (DEM) simulations where the particle size and velocity before and after particle-wall collisions were known. For more details on the DEM simulations, the reader is directed elsewhere [9]
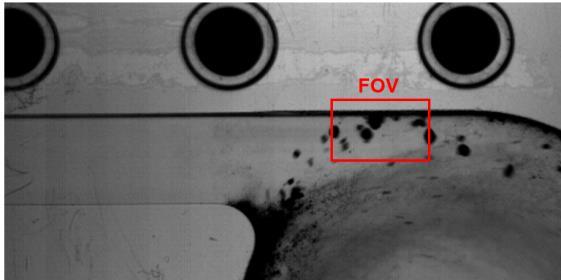
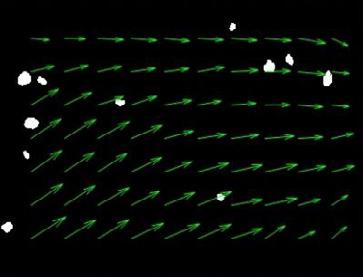
Drug Delivery to the Lungs , Volume 32, 2021 –
to-wall impaction in dry powder inhalers
Using microscopic high-speed imaging to quantify agglomerate -
Figure 1 – Field of View for Imaging (left) and time averaged flow field within the FOV (right)
64
Figure 2 - Wall Collision Detection. From left to right: 1) Raw unprocessed image, 2) Binarized image, incoming particle trajectory and predicted collision location shown in green. 3) Agglomerate to wall Impact. 4): Agglomerate bouncing off the wall.
Results and Discussion
Discussion of Image Processing
The process of predicting wall collisions using agglomerate trajectories was required because all agglomerates that physically contact the wall in any given frame are considered one object through standard image segmentation, and therefore it cannot be determi ned how many collisions occur. The method used here allows for multiple collisions to be detected at once, even in cases of significant wall deposition. However, the number of collisions detected is limited by the code’s ability to track particles, which is largely a limitation that arises from the method of velocity calculation, as described in detail elsewhere [8]. When tested on lactose carrier SV010, it was possible to track and calculate a velocity for 30% of the particles. For mannitol tracking, around 16% were tracked and the result was more variable due to wall deposition in the device and dense powder dispersion obscuring the view. The velocity calculation error was found to be 5% when tested against DEM data which is consistent with previous work where this image processing method was compared to phase Doppler anemometry data from turbulent sprays [8]
Discussion of flow field analysis
The proposed method was demonstrated by analysing four cases: two with M3 at 30 SLPM and 60 SLPM and two with M5 at the same flow rates. The application of this process is shown in Figure 3, comparing collision detections over time for both M3 and M5. These flows can have a varying density of dispersed particles with time which is illustrated below The method enabled quantification of both the number agglomerates in the image over time as well as the total number of detected collisions. The proportion of agglomerates that collided with the wall every 100 valid frames was examined (Figure 4) to analyse this process further. A valid frame was defined where the field of view, when binarized, was not blocked by particles which occupied more than 70% of the image area.
Drug Delivery to the Lungs , Volume 32, 2021 – Athiya Azeem et al.
Figure 3 – Comparing number of agglomerates (black) detected to the number of collisions (red) detected per 100 valid frames Secondary axis scaled to 5 times the primary axis. Left: M3 at 30 SLPM. Right: M5 at 30 SLPM.
0.0% 5.0% 10.0% 15.0% M3 M5 Proportion of Wall Collision (%) Powders 30 SLPM 60 SLPM 0 10 20 30 40 50 60 70 0 50 100 150 200 250 300 350 0 0.05 0.1 0.15 0.2 Number of Collisions Total Agglomerate Count Time (s) M3-30 SLPM Total Count Collision Count 0 500 1000 1500 0 2000 4000 6000 8000 0 0.05 0.1 0.15 0.2 Number of Collisions Total Agglomerate Count Time (s) M5-30 SLPM Total Count Collision Count 65
Figure 4: Average proportion of particles that collide with the wall in each case tested.
Drug Delivery to the Lungs , Volume 32, 2021 – Using microscopic high-speed imaging to quantify agglomerateto-wall impaction in dry powder inhalers
For every 100 valid frames, the total number of collisions were divided by the total number of agglomerates for which a velocity could be calculated. These data points were then averaged giving the predicted percentage of wall collisions for each case, sho wn in Figure 4. The increase in flow rate for M3 was shown to have a significant increase on the frequency of particles that collide with the interior surface. In contrast M5 demonstrates a lesser difference when the flow rate was increased from 30 to 60 SLPM. Visual assessment of the flow (not shown) revealed that M5 was far more dispersed at both flowrates. This outcome occurred because the M5 powder was less cohesive, hence resulting in adequate dispersion even at lower flowrates
The effect of changing the mannitol particle size c ould be quantified when the flowrate was kept constant. At 30 SLPM the percentage of particles that collide with the interio r wall increased significantly from 8.3 to 13.6% for M3 compared to M5, respectively. Figure 4Figure 4 also shows a similar proportion of colliding particles occurred for M3 and M5 at 60 SLPM but the large standard deviation prevents any conclusive interpretation of that data at this stage
Conclusion
This work demonstrates the ability of the developed code to successfully identify collision statistics from high-speed microscopic images. The methodology uses velocity and proximity of agglomerates from a surface to analyse collision and agglomerate population as a function of flowrate and powder properties In future applications, collision detection will be applied over a broader range of conditions and combined with agglomerate break-up analysis and velocity estimation to obtain detailed metrics which can define the efficacy of a dry powder inhaler device and potentially correlate device design features with downstream FPF.
[1] A. Misra, A. Shahiwala, and SpringerLink, Novel Drug Delivery Technologies Innovative Strategies for Drug Re -positioning, 1st ed. 2019. ed. Singapore: Springer Singapore, 2019, p. xxiv+431.
[2] N. Islam and M. J. Cleary, Developing an efficient and reliable dry powder inhaler for pulmonary drug delivery A review for multidisciplinary researchers , Medical Engineering & Physics, vol. 34, no. 4, pp. 409-427, 2012/05// 2012, doi: 10.1016/j.medengphy.2011.12.025.
[3] M. Hoppentocht, P. Hagedoorn, H. W. Frijlink, and A. H. de Boer, Technological and practical challenges of dry powder inhalers and formulations, (in en), Advanced Drug Delivery Reviews, vol. 75, pp. 18-31, 2014/08// 2014, doi: 10.1016/j.addr.2014.04.004.
[4] V. S. Kulkarni, Handbook of non-invasive drug delivery systems: science and technology . Elsevier, 2009.
[5] X. Kou, S. T. Wereley, P. W. S. Heng, L. W. Chan, and M. T. Carvajal, Powder dispersion mechanisms within a dry powder inhaler using microscale particle image velocimetry , (in English), Int. J. Pharm., Article vol. 514, no. 2, pp. 445-455, 2016, doi: 10.1016/j.ijpharm.2016.07.040.
[6] Z. Tong, Numerical Study of the Fundamental Mechanisms of Powder Dispersion in Pharmaceutical Aerosol Inhalers , Doctor of Philosophy, School of Materials Science and Engineering, University of New South Wales, 2012.
[7] A. Lowe, G. Singh, H. K. Chan, A. R. Masri, S. Cheng, and A. Kourmatzis, Fragmentation dynamics of single agglomerate-towall impaction, Powder Technology, vol. 378, pp. 561-575, 2021, doi: 10.1016/j.powtec.2020.10.021.
[8] G. Singh, A. Kourmatzis, A. Lowe, A. R. Masri, H. K. Chan, and S. Cheng , Extending the range of back -lit imaging in twophase flows using an interrogation-window based method, Measurement, vol. 176, p. 109155, 2021/05/01/ 2021, doi: https://doi.org/10.1016/j.measurement.2021.109155
[9] Z. B. Tong, R. Y. Yang, K. W. Chu, A. B. Yu, S. Adi, and H. K. Chan, Numerical study of the effects of particle size and polydispersity on the agglomerate dispersion in a cyclonic flow, Chemical Engineering Journal, vol. 164, no. 2, pp. 432-441, 2010/11/01/ 2010, doi: https://doi.org/10.1016/j.cej.2009.11.027.
66
A Propellant Dispersible Tablet for Preparation of Salmeterol/Fluticasone Combination pMDIs using Low-GWP HFC152a
Wiktoria Wegrzyn1,Rachael Kay & Cuong Hoa Tran
1i2c Pharmaceutical Services, Cardiff Medicentre, Cardiff. CF14 4UJ. UK.
Summary
Introduction The current drive to produce the next generation pressurised metered dose inhalers (pMDIs) using low global warming potential (GWP) propellants presents ongoing challenges for the pharma industry. Respitab® is a propellant dispersible tablet technology, consisting of one or more jetmilled micronized active pharmaceutical ingredients (APIs) and approved inhalation excipients e.g. lactose and menthol. It is designed to overcome manufacturing challenges such as drug loss and suspension inhomogeneity, and offers flexibility in separating drug dispensing from propellant filling, which will provide advantages when utilising flammable propellants. Propellant dispersible tablets provide consistent delivered dose and efficient aerosol properties
Research Hypothesis To investigate the application of Respitab pMDI technology to formulate a salmeterol xinafoate (SX) & fluticasone propionate (FP) combination pMDI using the low-GWP propellant HFC 152a.
Methods SX/FP combination product was prepared with menthol and lactose (Lac) and dispensed into plain aluminium 14 ml canisters. After crimping with metering valves, propellant HFC 152a was pressured filled into the canisters Standard pharmacopoeial tests were conducted to determine delivered dose uniformity and aerodynamic particle size distribution (APSD)
Results and Discussion SX/FP pMDI containing HFC 152a produced high fine particle fraction (FPF, %<5.0 µm) values and uniform delivered dose throughout product life. This development formulation was non-optimised in terms of API particle size, and excipient properties Nevertheless, APSD profiles compared favourably with a marketed reference product i.e. Seretide
Conclusion Respitab SX/FP pMDI produces a consistent, uniform and high quality aerosol utilising the next generation low-GWP propellant HFC 152a.
Key Message
Respitab SX/FP combination pMDI exemplifies a novel approach to pMDI manufacture , reducing the challenges and complexities of using HFC 152a, while producing high performance pMDIs. The use of a propellant dispersible tablet enables flexible manufacturing and separation of drug dispensing from propellant filling, a significant advantage when using flammable propellants.
Introduction
Pressurised metered dose inhalers are one of the most commonly used devices for inhaled drug therapy of asthma and chronic obstructive pulmonary disease. However, current ly used HFC 134a and HFC 227ea propellants have come under scrutiny due to their high GWP. Similar to the transition from ozonedepleting chloroflurocarbons (CFC-11 and CFC-12), there is now concerted effort to identify alternative low-GWP propellants to sustain the pMDI as a therapeutic option. One propellant under development with lower GWP is HFC 152a. Data on prototype formulations [1] have shown good pharmaceutical performance despite a significant density difference between the propellant and most commonly prescribed respiratory drugs However, as HFC 152a is classed as flammable careful consideration of the manufacturing process is required, particularly in the preparation of the bulk formulation and during pMDI filling
To avoid the use of large scale pressure vessels and reduce the risks arising from flammable propellants, the approach of adding the API into canisters in propellant dispersible tablet form has been investigated. In this process standard jet-milled micronized API is blended with inhalation grade lactose (excipient) and menthol (dispersant) to form a uniform blend. The blend is quality control (QC) checked to establish content uniformity prior to compression into tablets. Further QC tests are performed to confirm the drug content of the tablets. Each tablet typically contains sufficient API for one months’ dosing. The propellant dispersible tablet is dispensed into the pMDI canister followed by crimping of the
Drug
to the Lungs , Volume 32, 2021 -
Wegrzyn et al.
Delivery
Wiktoria
67
Drug Delivery to the Lungs , Volume 32, 2021 – A Propellant Dispersible Tablet for Preparation of Salmeterol/Fluticasone Combination pMDIs using Low-GWP HFC152a
metering valve and pressure filling of the propellant. The tablet dispersion occurs as the propella nt is pressure filled into the canister.
This study was conducted to characterise a long -acting -agonist (LABA) / inhaled corticosteroid (ICS) combination SX/FP pMDI dosage form. LABA/ICS combinations dominate the global market as the highest value class of drugs and the second highest in terms of number of doses by volume [2].
Aerosol assessments of SX/FP pMDIs formulated in HFC 152a were compared to a marketed HFA 134a pMDI Seretide® 125 Evohaler®
Experimental Methods
SX/FP combination formulation was prepared using menthol and inhalation grade lactose The raw materials were blended together using low shear mixing (Turbula® Mixer) . The formulations delivered 120 nominal doses of 25 µg of SX (expressed as salmeterol base) and 125 µg of FP.
Prior to dispensing into canisters quantitative analysis (see below) was performed to determine the content uniformity of each of the APIs. Dosage forms were dispensed into plain aluminium canisters (14 mL, Presspart Manufacturing Ltd, UK) and crimped with a metering valve (Aptar Pharma, France), HFC 152 was pressured filled through the valve. Filled canisters were stored inverted, for the industry standard two-week quarantine period at ambient conditions, during which time the APIs were fully dispersed within the propellant.
Aerodynamic Particle Size Distribution (APSD) were determined by inertial impaction testing using the Next Generation Impactor (NGI) at a flow rate of 30 L/min. Dose Content Uniformity (DCU) through canister life was assessed with the Dose Unit Sampling Apparatus (DUSA) at a flow rate of 28.3 L/min. Three canisters of the test formulation and Seretide were characterised through canister life for both APSD and DCU. For each APSD determination, five actuations per canister were collected in the NGI and quantitatively recovered
Simultaneous analysis of SX and FP was conducted using a validated high performance liquid chromatography (HPLC) method. In brief, a Zorbax Eclipse XDB-C18 column (4.6 x 150 mm 5µm), with a flow rate of 1.0 mL/min (80% methanol), a 100 µL injection volume, and UV detection at 278 nm, was used. The retention time of SX was 2 min whilst FP had a retention time of 2.7 min.
Results
The QC checks of dosage form content uniformity prior to dispensing into the canisters was good, with relative standard deviations (RSD’s ) of 2.87% and 3.17% (n=5) for SX and FP respectively
DCU data from a single batch of SX/FP test pMDIs are presented in Figure 1. The limits on the graph show ± 25% and ± 35% of the mean metered dose of each API. The data show that the metered dose s of SX & FP were close to the respective targets of 25 and 125 µg. There was good reproducibility between test pMDIs and the results were comparable to Seretide (data not shown)
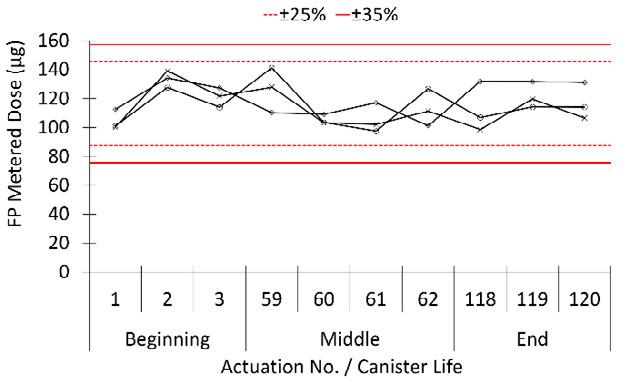
68
Figure 1. Through Can Life Dose Content Uniformity (µg) of SX/FP in HFC 152a (n=3).
All individual pMDI canisters complied with the specification, i.e. within ±25% of the nominal value with no values outside of ±35%. The DDU data showed consistent through canister life metered doses indicating effective dispersion and suspension stability of test formulation
The particle size distributions of SX & FP from the test HFC 152a formulation and Seretide are shown in Figure 2. The recovered doses from both the test formulation and Seretide were within ±15% of target. Within the impactor comparable particle size distributions were observed for the test formulation and Seretide, with the largest amounts, approximately 47 and 45% of the emitted dose , of SX/FP respectively deposited on stages 4 & 5 for the test formulation, while for Seretide it was approximately 45 and 44% of SX/FP respectively Deposition on the induction port was lower for the test formulation (30%) than for Seretide 37%.
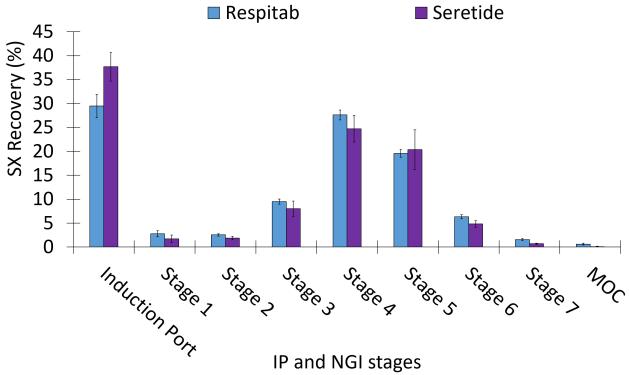

The results of NGI evaluations are summarised by key aerosol parameters in Table1. For the test product and Seretide the distribution of both APIs in the NGI was closely matched. Thus the m ean through canister life FPF (%<5µm) for SX/FP for the test formulation was approximately 61%, and 55% for Seretide. As expected from the broadly similar NGI deposition profiles shown in Figure 2 the mean MMAD and GSD aerosol parameters for the test formulation and Seretide were broadly comparable, p > 0.05
and
Respitab Seretide Evohaler HFC 152a HFC 134a
Respitab Seretide Evohaler
134a
*p < 0.05
Discussion and Conclusion
This study demonstrates that efficient SX/FP combination pMDI using low -GWP propellant HFC 152a may be manufactured from propellant dispersible tablets. The in-vitro performance of the aerosols produced from the test formulation in HFC 152a was similar to the commercial comparator i.e. Seretide.
The propellant dispersible tablet formulation was prepared using standard hardware components i.e. plain aluminium canisters and metering valves , jet-milled API and regulatory approved excipients us ed in other inhalation products The propellant dispersible dosage form was completely dispersed and homogeneously suspended in HFC 152a as demonstrated by consistent through canister life DCU and APSD test results.
Drug Delivery to the Lungs , Volume 32, 2021 - Wiktoria Wegrzyn et al.
Figure 2. Through Can Life Aerodynamic Particle Size Distribution (µg) of SX/FP in HFC 152a & Seretide 125 Evohaler (Mean values, n=9 determinations ± SD).
Table 1. Summary of Key Aerosol Parameters for SX and FP from HFC 152a pMDIs
Seretide Evohaler HFC 134a (Mean values, n=3 ± SD).
SX: FPF (% < 5 µm) 61.07 ± 0.74 55.36 ± 3.08 SX: MMAD (µm) 2.63 ± 0.03 2.55 ± 0.14 SX: GSD 1.67 ± 0.02 1.66 ± 0.16
HFC
HFC
FP: FPF (% < 5 µm) 61.39 ± 1.35 55.97 ± 3.16 *FP: MMAD (µm) 2.63 ± 0.03 2.47 ± 0.15 FP: GSD 1.65 ± 0.02 1.70 ± 0.16
152a
69
Drug Delivery to the Lungs , Volume 32, 2021 – A Propellant Dispersible Tablet for Preparation of Salmeterol/Fluticasone Combination pMDIs using Low-GWP HFC152a
Propellant dispersible tablets provide a novel method for manufacturing pMDIs offering unique advantages when dealing with flammable propellants, in particular the separation of drug dispensing and propellant filing. Additional advantages include avoiding the use of pressure and mixing vessels and associated drug and propellant losses, and also eliminating post manufacture cleaning procedures. These benefits save costs and reduce the overall carbon footprint.
References
[1] Kay R, Tran C, Sarrailh S: A dispersible salbutamol sulphate tablet for an environmentally sustainable HFC 152a propellant. Drug Delivery to the Lungs, Volume 31, 2020. (online only)
[2] Pritchard J N: The Climate is Changing for Metered-Dose Inhalers and Action is Needed. Drug Design, Dev. Ther. 2020: 14 3043-3055
Acknowledgements
The authors thank the following companies for their generous provision of materials: Koura UK – HFA 152a; Aptar Pharma – metering valves
70
Effects of Realistic In Vitro Test Factors on the Aerosol Properties of Metered-Dose Inhalers (MDIs)
Sneha Dhapare1, Abhinav Mohan1, Bryan Newman1; Mårten Svensson2; Peter Elfman2; Dennis Sandell3,#, Larry Winner 4 , Simon Berger5, Jürgen Bulitta5, Günther Hochhaus5
1 Office of Research and Standards, Office of Generic Drugs, Center for Drug Evaluation and Research, Food and Drug Administration, Silver Spring, MD, USA
2 Emmace Consulting AB, Scheelevägen 22, SE-223 63 Lund, Sweden
3 S5 Consulting, Ekvägen 8, SE-275 62 Blentarp, Sweden; # In Memoriam, October 29, 2020
4 Department of Statistics, College of Liberal Arts and Sciences, University of Florida, Gainesville, FL, USA
5 Department of Pharmaceutics, College of Pharmacy, Univer sity of Florida, Gainesville, FL, USA
Summary
The size of droplets and particles emitted by a metered dose inhaler (MDI), and passing through the mouth-throat (MT) region play a key role in determining lung deposition. Realistic in vitro studies that measure the amount and size distribution of aerosols exiting an anatomical MT model are expected to improve predictability of in vivo lung deposition In this paper, we present a systematic analysis of the effects of five different in vitro test factors (MT models, inhalation profiles (IP), MT model coatings, MDI insertion angles (IA) into the MT models and MDI firing point (FP)) on the aerodynamic particle size distribution (APSD) and droplet size distribution (DSD) of three commercial MDIs using the cascade impactor and laser diffraction (LD) methods, respectively. The goal of this research was to investigate the effects of these factors on the particle size distribution of two model suspension MDIs, Flovent® HFA (fluticasone propionate, 0.22 MG/INH) and Symbicort® (budesonide, 0.16 MG/INH; formoterol fumarate, 0.0045 MG/INH) and a model solution MDI, Atrovent ® HFA (ipratropium bromide, 0.021 MG/INH). MT geometries appeared to have the strongest effects on the APSD -derived parameters, while the effects of IP depended on the product type. In comparing the cascade impaction and LD methods, limited correlations were observed between MMAD, fine particle fraction < 5 μm, fine particle dose < 5 μm and Dv50, which were dependent on the type of product and the active ingredient .
Key Message
The MT geometry had the strongest effect on the APSD-derived parameter of the investigated suspension and solution based commercial MDIs Overall, the effects of the investigated factors on the DSD were often product-specific and unrelated to the formulation type (i.e ., suspension or solution).
Introduction
APSD measured using a cascade impactor is the most common technique for assessing size distribution of an MDI aerosol as it provides quantitative link between mass of the drug deposited and the aerodynamic size [1]. In an effort to obtain more accurate predictions of the drug loss in the extr athoracic region, and hence provide better predictability of lung deposition, extrathoracic airway models (commonly referred to as MT models) have been developed and explored as potential substitutes for the compendial United States Pharmacopeial (USP) induction port [2]. To mimic the moist surfaces of the human MT region, these MT models are often coated using different types of materials (e.g , glycerol-Brij35 aqueous solution and silicone) Use of IPs to simulate the realistic breathing in these studies, along with the variation in the MT model size, can help provide an estimate of intersubject variability often seen with inhalation products [3] The choice of the MT model and IP, along with the other experimental factors (i.e., coating type (CT), IA of the MDI into the MT models, MDI FP with respect to the IP) is usually made by each individual laboratory, and the impact of each of the choic es on the APSD of MDI products has not been systematically assessed In contrast to the impactor-based measurements, LD provides assessment of the DSD of the entire aerosol plume over the duration of the spray . Measurement of DSD using LD is included as part of the recommended in vitro studies for establishing bioequivalence (BE) found in FDA product-specific guidances (PSGs) for nasal sprays However, PSGs for MDI products do not currently recommend this in vitro study for establishing BE, and whether the LD based DSD of aerosols exiting MT models are relevant for MDI product performance has not been established . We were interested in comparing both methods for evaluating characteristics of the aerosol that passed through an anatomical MT model. We undertook a systematic analysis of the effects of five different factors (MT models, IP, CT, IA and FP) on the APSD by next generation impactor (NGI) and DSD by LD of two model suspension MDIs . Our goal was to understand the effects of the experimental factors on DSD and APSD of the MDI’s emitted aerosol in a realistic in vitro set -up. We used Flovent® HFA
Drug
Delivery to the Lungs, Volume 32 , 2021 - Sneha Dhapare et al.
71
Drug Delivery to the Lungs, Volume 32, 2021 - Effects of Realistic In Vitro Test Factors on the Aerosol Properties of Metered-Dose Inhalers (MDIs)
(fluticasone propionate, 0.22 MG/INH) and Symbicort® (budesonide; formoterol fumarate, 0.16 MG/INH; 0.0045 MG/INH) and a model solution MDI, Atrovent ® HFA (ipratropium bromide, 0.021 MG/INH). Attempts were made to correlate the APSD-derived parameters with the LD measurements.
Methods
A total of five factors including 10 different MT models were studied (Table 1)
Table 1. In vitro test factors studied for evaluating the APSD-derived parameters of the MDIs in a reduced factorial design
Mouth Throat (MT) Model
• USP Induction Port metal (USP Me) and plastic (USP Pl)
• Alberta Idealized Throat metal (AIT Me) and plastic (AIT Pl)
• Oropharyngeal Consortium small (OPC S), medium (OPC M) and large (OPC L) geometries
• Virginia Commonwealth University’s small (VCU S), medium (VCU M) and large (VCU L) geometries
Coating Type (CT)
• Brij
• silicone
Insertion Angle (IA; angle with respect to the MT)
• Normal
• Tilted (25o)
Inhalation Profile (IP) [3]
• Weak
• Medium
• Strong
Firing Point (FP; seconds after the start of the IP)
• 0.2 s
• 0.5 s
The USP plastic and AIT plastic models were 3D -printed in-house using polyamide 12, based on the geometry of the commercial metal versions. The USP throat was not coated in any of the experiments, as per standard practice [4]. For the assessment of APSD, a Nephele mixing inlet (RDD online, US) was used to enable generation of different IPs, while sampling at a fixed flow rate through the NGI. A breathing profile generator (F-SIG 6300, Sweden) was used to create the IPs and an automated MDI-trigger was used to actuate the device at a specified time after the sta rt of the IPs. The three MDIs, Flovent® HFA, Symbicort® and Atrovent® HFA, were actuated five times during each run and a total of three NGI runs were performed for each experimental combination in the reduced factorial design. Fine particle fractions of particles smaller than 5 µm (FPF<5 μm; fine particle dose divided by total emitted dose), fine particle dose of particles smaller than 5 µm (FPD<5 μm), mass median aerodynamic diameter (MMAD) and in vitro lung dose (dose exiting the MT model) were determined from the NGI stage deposition.
In another set of experiments, DSD of the aerosol from the three MDIs exiting the MT models was characterized using Malvern Spraytec (Malvern Panalytical, UK) for the five factor combinations, also using a reduced factorial design approach. Volumetric diameters (μm), Dv10, Dv50, Dv90 and average transmission (AT, %; proportion of laser beam that is unobscured) of the aerosol emitted from the MT were measured with the inhalation cell connected to the breath simulator, as described before [4]. The results were analysed by ANOVA using the five factors MT, CT, IA, IP and FP as fixed effect s. Partial Fstatistics, least squares means, and eta-squared effect size statistics (ratio of the partial sums of squares for each factor to the total sum of squares), were obtained. Correlations were computed between the least square means estimates based on interaction models between the APSD parameters and the LD measurements (e.g., MMAD and Dv50) and correlation coefficients (|r| values) were obtained.
Results and Discussion
The choice of the MT model significantly (p<0.05) affected the APSD parameters FPF<5 μm, FPD<5 μm, MMAD and in vitro lung dose for all the three MDI products. Figure 1 shows the FPF<5 μm of the four active ingredients in the three MDI products, Flovent ® HFA, Symbicort® (formoterol fumarate dihydrate (FF) and budesonide (Bud)) and Atrovent® HFA (ipratropium bromide) as a result of four factors (IP, CT, IA and FP) within a given MT model type In general, there were observable differences in the FPF<5 μm obtained with different MT models and in the FPF<5 μm obtained as a result of different factors within a MT model type. The impact of different sizes of MT on the FPF<5 μm appeared to be product -specific and was more prominent for OPC MT (e.g. OPC S and OPC L) than the VCU MT models (e.g. , VCU S and VCU L) for Symbicort® (FF and Bud). Comparisons of FPF<5 μm for the metal and plastic USP (USP Me and USP Pl) and AIT (AIT Me and AIT Pl) were made using Student’s t-test. For Symbicort® (FF and Bud), metal versions of the USP and AIT resulted in around 15 % higher FPF<5 μm than the plastic version. However, significant effects of the type of material on FPF<5 μm were not seen for Flovent ® HFA and Atrovent® HFA. Similarly, prominent effects of the size of MT models were also seen for MMAD of Symbicort® (FF and Bud). Significant (p<0.05) effects of the different IPs on APSD parameters such as FPF<5 μm, FPD<5 μm and in vitro lung dose were only seen in case of Flovent ® HFA and Atrovent® HFA, while significant (p<0.05) effects of the different IPs on MMAD were seen for all the MDI products
72
Drug Delivery to the Lungs, Volume 32 , 2021 - Sneha Dhapare et al.
The eta-squared values, a parameter quantifying the size of the effect of a given factor, are shown in Table 2 for FPF<5 µm, in vitro lung dose and MMAD of the three pr oducts. The choice of the MT model had the strongest effect on all the APSD parameters (FPF <5 µm, in vitro lung dose and MMAD). The effect of IP were the strongest for Atrovent ® HFA, while CT, IA and FP had a much smaller effect as compared to the other factors for all the MDIs tested. Strong effects of the MT models followed by IPs have also been seen on Dv10, Dv50, Dv90 of the aerosol from the three MDI products [4].
Flovent® HFA Symbicort® - FF Symbicort® - Bud Atrovent® HFA
1. Fine Particle Fraction<5
of Flovent® HFA, Symbicort® (Formoterol Fumarate Dihydrate (FF) and Budesonide (Bud)) and Atrovent® HFA for the different MT models. Individual data point: mean (N=3) for a given test condition. Horizontal line represents the median. FF: formoterol fumarate dihydrate, Bud: budesonide, Me: metal, Pl: plastic, S: small, M: medium and L: large.
Table 2. Summary of eta-squared values for each test factor for Flovent ® HFA, Symbicort® (Formoterol Fumarate Dihydrate (FF) and Budesonide (Bud)) and Atrovent® HFA. Eta-squared = 0.06 indicates a medium effect and eta-squared = 0.14 indicates a large effect. Values ≥ 0.14 are therefore shown in red and values ≥ 0.06 are shown in blue.
eta-squared
Table 3 shows the correlation coefficient (|r| value) for least square means of APSD-derived parameters and LD based Dv50 and AT for the MDI products tested MMAD, FPF<5 µm and FPD<5 µm of Symbicort® (Bud) showed highest correlation (|r|>0.6) to Dv50, while relatively low values (|r|<0.6) were obtained for Atrovent® HFA, Flovent® HFA and Symbicort® (FF). The correlation were insignificant when examining
Figure μm (FPF<5 μm)MDI Parameter
Mouth-Throat (MT) Inhalation Profile (IP) Coating Type (CT) Insertion Angle (IA) Firing Point (FP) Flovent® HFA FPF<5 µm 0.7216 0.0324 0.0031 0.0062 0.0122 In vitro lung dose 0.6012 0.1258 0.0005 0.0088 0.0381 MMAD 0.7780 0.0153 0.0092 0.0079 0.0000 Symbicort®FF FPF<5 µm 0.7086 0.0095 0.0009 0.0009 0.0094 In vitro lung dose 0.6300 0.0167 0.0065 0.0001 0.0141 MMAD 0.6035 0.0897 0.0228 0.0002 0.0078 Symbicort®Bud FPF<5 µm 0.7269 0.0070 0.0018 0.0001 0.0072 In vitro lung dose 0.6535 0.0122 0.0069 0.0001 0.0147 MMAD 0.6360 0.0960 0.0185 0.0000 0.0067 Atrovent® HFA FPF<5 µm 0.3501 0.2941 0.0006 0.0069 0.0851 In vitro lung dose 0.3652 0.2480 0.0007 0.0074 0.0737 MMAD 0.5824 0.1826 0.0038 0.0093 0.0112
0 10 20 30 40 50 60 70
μ m (%)
FPF<5
USP Me USP Pl AIT Me AIT Pl OPC S OPC M OPC L VCU S VCU M VCU L 73
Drug Delivery to the Lungs, Volume 32, 2021 - Effects of Realistic In Vitro Test Factors on the Aerosol Properties of Metered-Dose Inhalers (MDIs)
relatinships between other APSD-derived parameters like in vitro lung dose and LD based AT, suggesting that the density of the aerosol plume exiting the MT is less likely to be related to the in vitro APSD based parameters, including the lung dose.
Conclusions
The use of more realistic in vitro studies for the development of branded and generic inhalers should consider the effect of different experimental conditions, particularly the type of MT model and IP on APSD of solution or suspension MDIs. Limited and pro duct-specific correlations between the APSD-derived parameters and LD measurements suggests that the LD may serve as an additional supporting characterization method rather than an alternative to cascade impactor -based realistic in vitro methods for the estimation of lung deposition for MDIs.
References
1. Bonam, M., Christopher, D., Cipolla, D., Donovan, B., Goodwin, D., Holmes, S., ... & Wyka, B. (2008). Minimizing variability of cascade impaction measurements in inhalers and nebulizers. Aaps Pharmscitech, 9(2), 404-413.
2. Wei X, Hindle M, Delvadia RR, Byron PR : In Vitro Tests for Aerosol Deposition. V: Using Realistic Testing to Estimate Variations in Aerosol Properties at the Trachea. J Aerosol Med Pulm Drug Deliv 2017; 30(5): pp339-348.
3. Delvadia RR, Wei X, Longest PW, Venitz J, Byron PR: In vitro tests for aerosol deposition. IV: Simulating variations in human breath profiles for realistic DPI testing. J Aerosol Med Pulm Drug Deliv 2016; 29: pp196–206.
4. United States Pharmacopeia (USP) Chapter <6 01> Inhalation and Nasal Drug Products: Aerosols, Sprays, and Powders Performance Quality Tests. In: USP43-NF38. 45:6: pp6819.
5. Dhapare S, Newman B, Svensson M, Elfman P, Sandell D, Winner L, Bulitta J, Hochhaus G: Factors Influencing Plume Characteristics of Metered Dose Inhalers (MDIs) Following Passage through Biorelevant Mouth-Throat Model (Abstract). Presented at: Respiratory Drug Delivery 2021, Virtual Conference May 4-7, 2021; 1; 301-306; (online only).
Table 3 Summary of correlation for APSD-derived parameters and LD-based Dv50. Correlation coefficient (|r|) values > 0.6 are shown in red.MDI APSD-derived parameters Laser diffraction- based Dv50 Laser diffraction-based AT Flovent® HFA MMAD 0.2106 0.3358 FPF<5 µm 0.1217 0.1657 FPD<5 µm 0.1010 0.0990 Symbicort® - FF MMAD 0.2796 0.0194 FPF<5 µm 0.0893 0.0007 FPD<5 µm 0.1238 0.0044 Symbicort® - Bud MMAD 0.7460 0.1578 FPF<5 µm 0.6669 0.2232 FPD<5 µm 0.7508 0.0476 Atrovent® HFA MMAD 0.4249 0.0462 FPF<5 µm 0.5073 0.0081 FPD<5 µm 0.5267 0.1380 74
Drug Delivery to the Lungs , Volume 32, 2021 – Prakash Khadka et al.
High-dose inhaled rifampicin powder formulations: preparation, in vitro characterization and in vivo evaluation
Prakash Khadka1, Shubhra Sinha2, Ian G. Tucker1, Jack Dummer3, Philip C. Hill4, Rajesh Katare2 & Shyamal C. Das1
1School of Pharmacy, University of Otago, Adams Building, 18 Frederick Street, P.O. Box 56, Dunedin 9054, New Zealand
2Department of Physiology, HeartOtago, School of Biomedical Sciences, University of Otago, 270 Great King Street, P.O. Box 913, Dunedin 9054, New Zealand
3Department of Medicine, Dunedin School of Medicine, University of Otago, P.O. Box 56, Dunedin 9054, New Zealand
4Centre for International Health, Department of Preventive and Social Medicine, Dunedin School of Medicine, University of Otago, PO Box 56, Dunedin 9054, New Zealand
Summary
Despite several studies on inhaled rifampicin in the literature, there have been no reports on the in vivo safety and pharmacokinetics of high-dose (>20 mg/kg) inhaled rifampicin. A high-dose of rifampicin is necessary to achieve drug high concentration in the lungs and the systemic circulation to treat both pulmonary and extra-pulmonary TB. While the use of high-dose of rifampicin from the oral route is associated with increased risk of toxicity including hepatotoxicity, the pulmonary delivery is an alternative approach to achieving higher drug concentration in the lungs and the systemic circulation with a lower dose than that from oral route. In this study, high-dose amorphous and crystalline powder formulations were prepared and characterized in vitro . Then, the safety and pharmacokinetics of rifampicin were studied after repeated administration to Sprague Dawley rats by intra-tracheal insufflation once daily for seven days. Among the powder formulations prepared, the amorphous and the crystalline dihydrate formulation showed better aerosolization stability compared to the crystalline pentahydrate formulations and were selected for further in vivo evaluations. Repeated intra-tracheal administration of high-dose rifampicin powder formulations (50 mg/kg) were well tolerated by laboratory rats and were safe to the lungs and the liver. The intra-tracheal administration of rifampicin achieved significantly higher area under the plasma concentration-time curve (AUC) compared to that from oral rifampicin at the same dose. Inhaled administration of high-dose rifampicin, therefore, has the potential to achieve higher systemic bioavailability than oral rifampicin and can be beneficial in improving TB treatment.
Key Message
Intra-tracheal administration of rifampicin results in significantly higher systemic drug bioavailability compared to the oral rifampicin at the same dose suggesting the potential of inhaled rifampicin in achieving better therapeutic effects in TB treatment.
Introduction
Rifampicin is one of the potent, highly effective first -line drugs for the treatment of Tuberculosis (TB). The maximum recommended dose of rifampicin for TB treatment is 10 mg/kg per day from the oral route [1]. While doses higher than the recommended dose are found to be more effective in clinical studies [2], higher oral doses of rifampicin have not been approved for therapeutic use. The use of high doses of rifampicin via the oral route increases the risk of systemic toxicity of rifampicin, mainly the risk of rifampicin induced hepatotoxicity increases with chronic use of high dose s
During TB infection, Mycobacterium tuberculosis mainly localize in the lungs, known as pulmonary TB This is characterized by the presence of bacteria within the granulomatous lesions in the lungs that are devoid of vasculature. TB infection also spreads to and affects other organs termed extra-pulmonary TB. A high concentration of a drug is therefore necessary in both the lungs and the systemic circulation for an efficient bactericidal effect. Inhaled delivery of rifampicin is an alternative approach to deliver a high concentration of the drug to the lungs as well as the systemic circ ulation at a dose lower than that from the oral route. A higher systemic concentration of rifampicin can be achieved due to the absence of hepatic first pass metabolism from the pulmonary route. Moreover, pulmonary administration allows delivery of higher drug concentrations to the vicinity of lung lesions and facilitates effective penetration of the drug into the lesions where highly sequestered mycobacteria reside [3]
75
Drug Delivery to the Lungs , Volume 32, 2021 - High-dose inhaled rifampicin powder formulations: preparation, in vitro characterization and in vivo evaluation
Several studies on inhaled rifampicin formulations and their in vitro and in vivo behaviour have been reported in the literature. However, no study has reported high-dose rifampicin formulations for inhalation, which are clinically relevant for TB treatment. Moreover, there have been very few studies to compare the oral and inhaled pharmacokinetics of high-dose rifampicin. Studies reported in the literature either evaluated a low dose ( ≤20 mg/kg) inhaled rifampicin or the formulation reported contained excipients suggesting a low payload formulation . Similarly, there were no reports on the pharmacokinetics of rifampicin after repeated inhaled administration, prior to this study. For inhaled rifampicin therapy to be a part of the anti-TB regimen, its documented in vivo respiratory tract safety, together with a demonstrat ion of its potential to achieve higher bioavailability than the oral route, is necessary.
This study aimed to investigate the in vivo safety and pharmacokinetics of inhaled high-dose rifampicin in comparison to oral rifampicin in labor atory rats. The formulations tested were amorphous and crystalline high-dose powder formulations of rifampicin to investigate if they resulted different in vivo effects
Experimental methods
Materials: The following materials were purchased: British Pharmacopoeia grade Rifampicin from Hangzhou Dayangchem Co., Ltd. (Hangzhouzhejiang, China) ; phosphate buffered saline (PBS) tablets from Fisher scientific New Zealand; p araformaldehyde and sucrose (≥99.5%) from Sigma -Aldrich (St. Louis, USA); alanine transaminase ( ALT) and aspartate aminotransferase (AST) activity assay kits from Abcam, Cambridge, United Kingdom; paraformaldehyde, sucrose (≥99.5%), and mass spectrometry grade ammonium formate and formic acid from Sigma -Aldrich (St. Louis, USA); and high-performance liquid chromatography (HPLC) grade solvents from Merck, Darmstadt, Germany.
Preparation of rifampicin powder formulations: Inhalable rifampicin powder formulations were prepared by spray drying and crystallization methods. Spray drying was perfo rmed at an inlet temperature of 90°C using a Buchi B-290 Mini Spray-Dryer (Buchi Labortechnik AG, Flawil, Switzerland) in a closed -mode. Rifampicin solution (0.5% w/v) in ethanol:water (90:10 v/v), was the feed solution for the spray drying method. For crystallization, ethanol was used as the crystallization solvent. Raw rifampicin was added to ethanol, and the mixture was exposed to ultrasonic waves. Crystallization of rifampicin particles occurred by solid-state transformation of the raw rifampicin. The resulting suspensions were centrifuged at 2000 rpm to obtain the particles. Powder formulations were obtained by drying the sediment in an oven at 60°C for 48 h.
Particle sizing and crystallinity: Particle sizing was performed by laser lig ht diffraction technique (Horiba LA-950 particle size analyzer, Japan). Crystallinity was determined by X -ray powder diffraction (XRPD).
In vitro aerosolization: In vitro aerosolization performance was studied using a Next Generation Impactor. Powders (20 mg) were actuated using Aerolizer ® at 100 L/min for 4 seconds. The fine particle fration (FPF) was calculated as percentage fraction of particles with cut -off diameters ≤5 μm, in recovered dose.
Animals and ethical considerations: Male Sprague Dawley Rats (275 to 325 g) were obtained from the Hercus Taieri Resource Unit, University of Otago, Dunedin, New Zealand. The study was approved by the Animal Ethics Committee at the University of Otago (Pro tocol number AUP-18-199).
Administration of rifampicin powder formulations: Intra-tracheal powder insufflation of 25 mg/kg or 50 mg/kg rifampicin was performed using a dry powder insufflator. The efficiency of the insufflation was between 92.8% and 96.7% depending on the powder formulation. For oral administration, rifampicin powder (50 mg/kg), suspended in normal saline, was administered by oral gavage using a feeding tube connected to a syringe
Blood sampling, euthanasia and tissue collection: For the pharmacokinetic study, blood samples were collected from cannulated jugular vein at different time points for 24 h after drug administration on Day 0 and Day 6. Rats were euthanized 24 h after final drug administration (Day 7), and the lungs and blood samples were collected.
Liver enzymatic activity assay: Alanine transaminase (ALT) activity was measured in serum using ALT assay kits following manufacturer’s protocol.
76
Histopathology of lungs: Lung tissues were frozen at -20°C in optimal cutting temperature compound , and thin sections (8 to 10 µm in thickness) were prepared by cryo -sectioning using a Leica Cryostat Microtome (Leica Biosystems, Germany) . The sections were mounted on superfrost glass slides and stained by Hematoxylin and Eosin (H&E) stain. Images were captured using a slide scanner (Leica Biosystems Nussloch GmbH)
Quantification of rifampicin in plasma and tissues : Rifampicin quantification in biological samples (rat plasma and lung tissue homogenates) was performed using liquid chromatography tandem mass spectrometry (LC-MS/MS) analysis in positive ionization mode. The stationary phase used was a Kinetex EVO C18 column (5 µm, 2.1 X 100 mm; Phenomenex, California, USA) with the mobile phase comprising of 40:60 (v/v) acetonitrile (containing 0.05% formic acid) and 10 mM ammonium formate in water Linearity of the assay was verified for a concentration range of 5 ng/mL to 240 ng/mL with the bias and precision within the specified limits (≤15%).
Statistical analysis: Data represent mean ± standard deviation (SD). Statistical comparison was performed by one-way analysis of variance (ANOVA) and Student -Newman-Keuls post-hoc tests were using GraphPad Prism 5 software (GraphPad Software, San Diego, US A). Differences were considered significant when p values were less than 0.05.
Results and discussion
The powder formulations prepared were amorphous (RIF A), crystalline pentahydrate (RIF C1 and RIF C2) and crystalline dihydrate (RIF C 3) formulations of rifampicin (Figure 1) as determined by XRPD. All powder formulations had mean particle size <5 µ m, emitted dose (ED) greater than 75% and FPF greater than 50% [4]

The serum alanine transaminase (ALT) activity assay showed significantly higher ALT activity, compared to the control group, after single and repeated oral administration and after repeated intratracheal administration of 50 mg/kg RIF A (Figure 2). In the case of RIF C3, significantly higher ALT activity was observed also in the repeated intra-tracheal 25 mg/kg group. The results suggested a lesser drug burden on the liver after intra-tracheal administration of rifampicin compared to its oral administration.
Drug Delivery to the Lungs , Volume 32, 2021 – Prakash Khadka et al.
Figure 1 - X-ray diffraction patterns of rifampicin powder formulations (A); and the in vitro aerosolization parameters (B)
77
Figure 2 - Serum alanine transaminase (ALT) activity measured 24 h after single an d repeated administration of RIF A and RIF C3 powder formulations in rats. Asterisk represents significant difference compared to the non -treated control group.
Drug Delivery to the Lungs , Volume 32, 2021 - High-dose inhaled rifampicin powder formulations: preparation, in vitro characterization and in vivo evaluation
The histopathological evaluation suggested no toxicological changes in rat lung sections after intratracheal administration of up to 50 mg/kg rifampicin powder formulations for seven days. Although mild bronchial changes and epithelial thickening were observed in the intra-tracheal administration group (as shown by red arrows in Figure 3), they were not due to rifampicin toxicity (as indicated by absence of lymphocyte and eosinophil infiltration, alveolar septal thickening, macrophage accumulation or lesions) but a response to foreign particle inhalation by sensitive airways of rats [5]
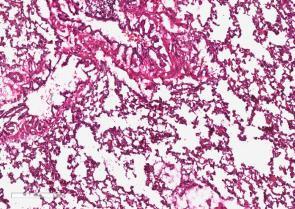
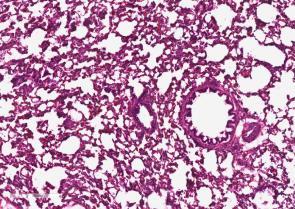

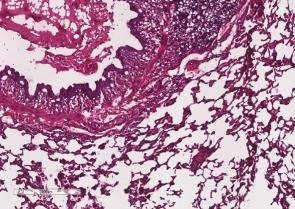
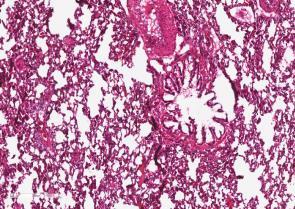

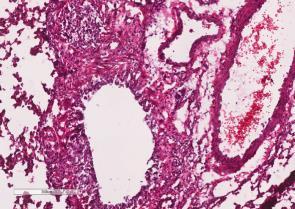

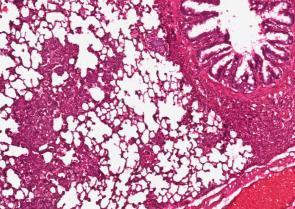
The plasma-concentration time profiles of rifampicin showed significantly higher plasma concentrations from the intra-tracheal 50 mg/kg group compared to the oral rifampicin at the same dose (Figure 4). After administration of seven repeated doses of rifampicin , there was an accumulation of rifampicin in the systemic circulation, as shown by increased plasma concentrations on Day 6 (Figure 4B) This suggested that enzyme auto-induction behaviour of rifampicin was not observed in this study, which might be because of the high-dose used or because the enzyme auto-induction phenomenon had not started by Day 6. The effects after administration of RIF C3 was similar in which the intra-tracheal administration led to significantly higher plasma concentrations compared to the oral administration at the same dose (Figure 5). However, the plasma concentrations were lower compared to that from RIF A suggesting lower systemic bioavailability of rifampicin from the crystalline formulation after both oral and intra-tracheal administration. Repeated administration of RIF C3 showed increased plasma concentration of rifampicin compared to that after a single dose (Figure 5B), suggesting absence of enzyme auto-induction behaviour also in the case of the crystalline formulation. For both formulations, there was no significant difference in the lung tissue concentration of rifampicin at 2 hours after oral and intra-tracheal administration of 50 mg/kg rifampicin


No treatment A B C D E F 300 µm 300 µm 300 µm 300 µm 300 µm 300 µm 300 µm PA B3 B2 B2 BV B1 B2 B1 B2 BV B3 BV B1 PA PA PA B 78
Figure 4 - Average log scale plasma concentration–time profiles of rifampicin after single (A) and repeated (B) administration of amorphous powder formulation (RIF A) by oral (50 mg/kg) and intra-tracheal (25 and 50 mg/kg) administration to Sprague Dawley rats.
Conclusions


The results from ALT activity assay suggested that intra-tracheal administration of rifampicin leads to reduced drug burden on the liver compared to oral rifmapicin by avoiding hepatic first pass metabolism after intra-tracheal administration. The histopathological evaluation suggested that both amorphous and crystalline powder formulations of rifampicin were safe to rat lungs after seven repeated administration of up to 50 mg/kg rifampicin. The plasma concentration -time profiles indicated that intra-tracheal rifampicin can achieve significantly higher systemic bioavailability compared to oral rifampicin at the same dose. Amorphous rifampicin was preferable to the crystalline rifampicin formulation due to its higher systemic bioavailability. These findings are encouraging for further pre-clinical and clinical development of high-dose rifampicin powder formulations for inhaled anti-TB therapy.
References
1 van Ingen J, Aarnoutse R E, Donald P R, Diacon A H, Dawson R, Plemper van Balen G, Gillespie S H, Boeree M J: Why do we use 600 mg of rifampicin in tuberculosis treatment? Clin Infect Dis 2011; 52(9): pp194-199.
2 Diacon A H, Patientia R F, Venter A, van Helden P D, Smith P J, McIlleron H, Maritz J S, Donald P R: Early Bactericidal Activity of High-Dose Rifampin in Patients with Pulmonary Tuberculosis Evidenced by Positive Sputum Smears Antimicrob Agents Chemother 2007; 51(8): 2994-2996.
3 Muttil P, Wang C, Hickey A J: Inhaled drug delivery for tuberculosis therapy. Pharm Res 2009; 26(11): 2401-2416.
4 Khadka P, Hill P C, Zhang B, Katare R, Dummer J, Das S C: A study on polymorphic forms of rifampicin for inhaled high dose delivery in tuberculosis treatment. Int J Pharm 2020; 587: 119602.
5 Owen K: Regulatory toxic ology considerations for the development of inhaled pharmaceuticals . Drug Chem Toxicol 2013; 36(1): 109-118.
Drug Delivery to the Lungs , Volume 32, 2021 – Prakash Khadka et al.
Figure 5 - Average log scale plasma concentration–time profiles of rifampicin after single (A) and repeated (B) administration of crystalline powder formulation (RIF C3) by oral (50 mg/kg) and intra-tracheal (25 and 50 mg/kg) administration to Sprague Dawley rats.
A B 79
80
Respirable powder containing Cyclosporine A loaded liposomes as immunosuppressive agent suitable for lung transplant rejection and the containment of severe lung inflammation
Davide D’Angelo1 , Eride Quarta1,2, Stefania Glieca1, Veronica Chierici1, Giada Varacca1, Fabio Sonvico1, Francesca Buttini1
1Food and Drug Department, University of Parma, Parco Area delle Scienze 27/A, 43124 Parma, Italy
2 Plumestars srl, Strada Inzani 1, 43125 Parma, Italy
Summary
The work led to the formulation of a powder of calcium phosphate coated liposomes containing cyclosporine A (CsA). The formulation was designed to reduce the dose of CsA to be administered following lung transplantation Potentially this formulation can be used also to contain the inflammatory process due to SARS-CoV-2
Calcium phosphate (CaP) is a material found in bones and teeth and considered non -toxic and biocompatible and this coating could reduce the recognition by alveolar macrophages and increase the cell uptake Moreover, CaP is insoluble at physiological pH (7.4), while it solubilizes easily at pH below 5. This could favor drug release in the cell after pinocytosis and in inflamed tissues, while reducing drug release at physiological pH [1]
The liposomes produced were evaluated in terms of size, surface charge and drug loading. The presence of the CaP coating was verified by calcium titration, variation of the zeta potential and by cryogenic transmission electron microscopy (cryo-TEM). The highest loading was obtained in the formulation containing CsA at 7% (w/w) Cholesterol was added to liposomes at two different concentrations in order to improve the stability of the nanostructure and reduce the drug leakage However, cholesterol did not bring any improvement to the formulation. The inhalation powder produced by spray drying with the best aerosolization performance (fine particle fraction of coated liposomes powder 33.691.6% and 50.500.6% for the uncoated liposomes powder) was obtained using a 1:3 weight ratio between liposomes and excipients using mannitol as bulking agent and 15% L-leucine
Key Message
This work aimed to develop a respirable dry powder for inhalation containing CsA for the local treatment of lung immune diseases. CsA was efficiently loaded into CaP-coated liposomes and transformed into a respirable powder by spray -drying. The inhaled immunosuppressive product would offer multiple advantages related to drug deposition at the target site. Furthermore, the coating of the liposomes governs the release of the drug which will occur only at only at biological acidic conditions.
Introduction
Lung transplantation is one of the latest resources applied for the resolution of serious and irreversible lung pathological conditions. Despite oral or intravenous CsA treatment , about 30% of transplant patients develop bronchiolitis obliterans syndrome (BOS) [2], which is considered a marker of chronic rejection. Alongside this application, many works, more recently, are underlining the possible use of CsA in the containment of the cytokine storm that characterizes the infection due to the SARS-CoV-2 and is responsible for the related severe lung inflammation [3]
CsA is a cyclic peptide of eleven amino acids with a powerful immunosuppressive action on T lymphocytes and currently administered intravenously or orally. The bioavailability of oral Cs A is only 30% and furthermore its absorption is strongly influenced both by food and by interpatient variability This requires the use of high dosages between 5 and 15 mg/kg/day which can lead to nephrotoxicity and hepatotoxicity.
The administration of t he drug directly to the lung could increase the efficiency of the immunosuppressive effect of CsA by minimizing the dose administered and therefore the side effects and would allow a better clinical outcome [4] Furthermore, alongside the typical advantages of an inhalation administration, the inclusion of the drug in CaP -coated liposomes would offer additional favourable characteristics. In particular, this coating offers a pH dependent release: the drug would b e released only at pH <5.5 i.e. in inflamed tissues or within intracellular lysosomes. Finally, there is a reduction in removal by macrophage clearance as calcium phosphate is a biocompatible material [1,5] and an increased cellular uptake by clathrin-mediated endocytosis or pinocytosis [6]
The aim of this work was to develop a novel type of inhalation powder containing CsA loaded liposome for local administration to the lung. The project involved a first phase of optimization and loading of the
Drug Delivery to the Lungs , Volume 32, 2021 – Davide D’Angelo et al.
81
Drug Delivery to the Lungs , Volume 32, 2021 - Respirable powder containing Cyclosporine A loaded liposomes as immunosuppressive agent suitable for lung transplant rejection and the containment of severe lung inflammation
drug into the CaP-coated liposomes. In a second step, the CsA liposomes were incorporated in mannitol-based powders produced by spray drying. Characterization in terms of particle size, drug loading and respirability was performed.
Experimental Methods
Liposomes were prepared dissolving 1.75 g of lecit hin (Lipoid S80®-Lipoid GmbH, DE) in 10 mL of ethanol. CsA was dissolved in 60 mL of water:ethanol 66:33 under stirring at 500 RPM. The amount of CsA dissolved was of 100, 150 and 200 mg representing Batch A, B and C respectively. Both solutions were heated up to 70°C. Under these experimental conditions CsA did not show thermal degradation. Then the lecithin solution was dispersed into the hydroalcoholic solution of CsA under stirring at 500 RPM Finally, the obtained dispersion was processed using the high-pressure homogenizer (HPH, Panda Plus 2000, GEA Niro Soavi SpA, IT) for 5 minutes at 800 bar.
Moreover, two batches of liposomes were prepared by replacing a part of the lecithin with cholesterol in order to improve the stability of the nanosystem. 20% or 30% of the phospholipids (calculated on the number of moles) were replaced by cholesterol.
Then, 10 mL of the CsA liposome dispersion were added to 87 mL of ultrapure water and 1.5 mL of a CaCl2 2H2O solution (50 mM). After 1 hour, 1.5 mL of a Na 2HPO4 2H2O solution (50 mM) was added and the liposomal dispersion was left under stirring for 1 hour. Finally, the 100 mL volume dispersion of liposomes was dialyzed for 24 h using a Spectra/Por® 3 dialysis membrane with 3.5 kDa MW cut-off (Spectrum Laboratories Inc., Rancho Dominguez, CA, USA) in a hydroalcoholic (4.28% EtOH) medium volume of 9 L. All the batches were prepared in triplicate.
The concentration of the solid in the liposomal dispersion was determined by gravimetric analysis after evaporation of the solvent (24h at 40°C). The presence and coating of the calcium phosphate salt present in the formulation, was carried out by calcium back -titration as described in USP 35 [7] Liposome formulations were dissolved in acetone in the ratio 1:3 and the CsA was quantified by HPLC as described in the literature [8] The morphological analysis was performed by Cryo-TEM using a CM200-FEG (Philips, Eindhoven, NL) after freezing 1.5 µL of liposome sample.
Liposome dispersions were transformed in dry powders by spray drying using a Büchi Mini Spray Dryer
B-290 (Büchi Labortechnik, Flawil, CH) equipped with 0.7 mm size nozzle using an inlet temperature of 140°C, the feed rate was 3.5 L min-1. Powders were produced using mannitol as bulking agent and a 15%(w/w) of L-leucine or a 0.5 %(w/w) of sodium stearate (liposome:excipient in ratio 1:3). The final solute concentration of the dispersion was in the range 1-1.3 % (w/v)
For the aerodynamic analysis the Next Generation Impactor (Copley Scientific Limited, Nottingham, UK) was used. RS01 (Plastiape, IT) device was employed in order to aerosolize 20 mg of spray -dried powders filled in a size 3 HPMC capsules ( Quali-V®-I) The flow rate was set at 60 L/min to obtain a pressure drop of 4 kPa and the duration at 4 seconds Emitted dose, fine particle fraction below 5 µm and mass median aerodynamic diameter (MMAD) were calculated according to Ph. Eur 10 The CsA found in the induction port, in the pre -separator, in the different stages and in the MOC of the NGI was collected using water: acetonitrile (70:30 v/v) ; the residual API in the device and in the capsule was collected with water: methanol ( 50:50 v/v) and assayed by HPLC using the analytical method reported by Grimaudo et al [8]
Results
The batches of liposomes produced, whose composition is shown in Table 1, were initially characterized in terms of solid content, drug concentration and calcium concentration after dialysis.
From the CsA content data before and after dialysis it is possible to observe that the drug was almost completely trapped in the liposomal structures (encapsulation efficiency 95-100%). In detail, a concentration of 0.14 mg/m L post dialysis within 2.37 mg of solid per mL results in a loading equal to 5.4% w/w. The maximum drug loading value was obtained with the preparation of batch B which led to a value of 8.6% w/w (0.2 mg/ml of CsA in a 2.34 mg/ml of solid). A larger amount, as it has been used for the preparation of Batch C, corresponding to 200 mg of CsA (9. 0% w/w) did not allow the formation of liposomes, instead, a white precipitate was observed both in the dialysis tube and in the medium at the end of the process.
Subsequently, the composition of Batch B was slightly changed to improve the stability and the quality of the nanosystem by the addition of cholesterol Despite cyclosporine was efficiently encapsulated in liposomes, as Batch B without cholesterol, the presence of cholesterol crystals was observed following dialysis and there was also an increase in PDI.
82
- 1-
CaP
dialysis. Three different batches of lecithin
three concentrations of CsA (4.8, 7.0 or 9.0% w/w in respect to the solid content) were produced. Two batches of liposomes of were prepared by replacing 20 or 30% (calculated relative to the number of moles) of the lecithin. EE%=Encapsulation Efficiency.
The final size of the cholesterol-free liposomes of batches #A and #B did not increase after the coating process. This means that the CaP coating layer was very thin and did not change the initial size around 40-60 nm (Figure 1A). It must be specified that the initial measurement also considers any residual material which can then be dissolved and removed during the dialysis process. On the other hand, for the last two batches, the ones with cholesterol, the increase in the size of the nanostructures after dialysis was due to the formation of cholesterol crystals. As previously mentioned, the addition of cholesterol led to formulations with low physical stability which tended to aggregate and precipitate. For this reason, these two preparations were excluded from subsequent studies.
The use of cholesterol leads also to a more polydisperse formulation, characterized by a PDI of the final liposome of about 0.4. This polydisperse distribution was also highlighted by the cryo-TEM images (Figure 2). The final zeta potential values for the liposomes are lower, in absolute value, than the initial, suggesting a change in the surface of the nanostructures due to the CaP presence. The zeta potential values ranged from about -50 mV, before the coating, to about -20 mV in every batch.
The same results were obtained in other studies [5]
Drug Delivery to the Lungs , Volume 32, 2021 – Davide D’Angelo et al.
Table
Summary of the quali-quantitative composition of CsA liposomes coated with
before and after the
liposomes (Lipoid S80®) containing
Figure 1 – Value of the size as median hydrodynamic particle diameter (A), PDI (B) and surface charge as zeta potential (C) of CsA liposomes before and after CaP coating The initial measurement was conducted after the CsA liposome formation upon High Pressure Homogenization. The after measurement was conducted after CaP coating process and upon 24 h of dialysis.
Figure 2 – Cryo-TEM images of uncoated liposomes (A); coated liposomes (B) and coated liposomes containing cholesterol (C). Sample liposome suspensions were frozen and analysed. (mg/mL) Composition of CsA liposome after dialysis (mg/mL) EE % CsA conc (w/w%) Batch (CsA initial conc) CsA Lipoid Chol Na2HPO4 CaCl2 Solid content CsA Ca2+ A (4.8% w/w) 0.14 2.54 - 0.13 0.11 2.3±0.1 0.14±0.01 0.030.01 100 5.40.01 B (7.0% w/w) 0.21 2.54 - 0.13 0.11 2.3±0.1 0.20±0.03 0.030.02 95.2 8.60.7 C (9.0%w/w) 0.29 2.54 - 0.13 0.11 precipitation of drug crystals and no liposome formation B_Chol30 0.21 1.77 0.40 0.13 0.11 2.0±0.1 0.20±0.02 0.02±0.01 95.2 9.90.2 B_Chol20 0.21 2.01 0.27 0.13 0.11 2.0±0.1 0.18±0.01 0.03±0.01 85.7 9.302 A B C 83
Composition of CsA liposome pre-dialysis
Drug Delivery to the Lungs , Volume 32, 2021 - Respirable powder containing Cyclosporine A loaded liposomes as immunosuppressive agent suitable for lung transplant rejection and the containment of severe lung inflammation
The presence of the coating was also observed in the images obtained by cryo-TEM. This technique allows the observation of the samples following a rapid freezing, preserving the structures and a voiding the formation of artifacts [9] Morphology differences between the uncoated (Figure 2A) and coated liposomes without and with cholesterol (Figure 2B and 2C) were observed. In particular, the presence of the CaP coating led to a more evident and often even more evident outer layer when cholesterol was not added to the formulation. Another difference that can be pointed out is the fact that the CaP coated liposomes had a different behavior if compared to the ones uncoated: they are not isolated from one to each other, but they keep together in group or pairs. A suitable explanation for this is the fact tha t the coating leads to a change in the surface charge, due to the presence of ions on the surface of the nanoparticle, as confirmed with the change in zeta potential, resulting in stronger attractive forces. CsA liposome suspensions were efficiently transf ormed in dry powders by spray drying with a yield greater than 60% using mannitol as bulking agent. Respirability parameters were studied comparing the powder with only mannitol to the one with L-leucine. In particular, the first ones have a very low fract ion of fine particles and the MMAD is higher than 8 µm, also the presence of sodium stearate in the concentration used did not favor the formation of a respirable powder. In addition, considering the distribution of the particles in the stages, for these p owders most of the powder deposits in the IP or in the stage 1, and only small quantities in the last stages or the MOC. L -leucine, on the other hand, allowed the formation of powders with good flowability with an MMAD of 4 µm for the powder of uncoated liposomes and of 5 µm for the powder containing coated liposomes.
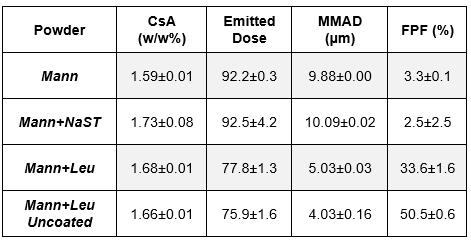
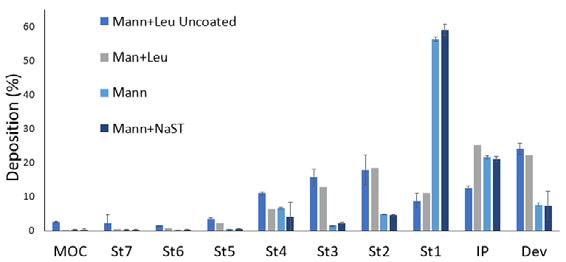
a 1: 3
between liposomes and excipients. Mann =mannitol; Mann + NaST= mannitol with 0.5% w / w of sodium stearate; Mann + Leu = mannitol with 15% w/w of L-leucine; Emitted dose: % amount of CsA emitted by the inhaler with respect to the loaded dose. Right, the distribution of powders in the NGI
Discussion
Although the inhalation route would allow a reduction in the dosage of CsA compared to the oral since the drug would be deposited on the site of action, the dose of CsA to be administered is consistent and would be around 510 mg/daily. For this reason, it is important to have the drug content high in the formulation in order to contain the mass of powder to be inhaled by the patient. The most immediate choice in this regard is to make a micronized drug-excipient formulation, for example by spray-drying. This approach was applied by us obtain ing respirable CsA: mannitol 80:20 microparticles with an increased dissolution rate compared to CsA raw material [10]
This work, on the other hand, has the ambition to produce a more sophisticated formulation in which the loading of the drug into the liposomes should result in a targeted intracellular release and l ess dispersion of the drug in the lung fluid due to the pH dependent release.
The transformation of the liposome suspension into a respirable powder allows to obtain further advantages and to bypass the problems of administration by means of a nebulizer, i.e long time of treatment and device cleaning Batch B was therefore spray-dried by adding mannitol and leucine. This formulation showed an efficient emission from the device (ED> 75%) and a fraction below 5 µm of around 33%. The potential advantages in terms of drug release using coated liposomes will be investigated by in vitro (cell culture) and in vivo studies.
Surely, given the low CsA content in the DPI liposomal formulation, the amount of powder to be inhaled to take the 10 mg dose would be about 500 mg/day and therefore could be difficult for a patient. However, a robust dose-effect correlation for this formulation has not yet been performed. Only after the in vivo studies it will be confirmed whether the assumed 10 mg are needed or whether lower doses of the drug can be administered
Conclusions
From the results obtained it was possible to conclude that CsA can be loaded into liposomes at a maximum value of 7% (w/w). Such liposomes were efficiently coated with a CaP layer. The addition of cholesterol to the nanosystem did not help neither the physical stability nor the uniformity of the size of the liposomes. Finally, CsA liposomes were transformed into a respirable powder using mannitol and L-leucine as excipients. Future work
Figure 3 – Left, aerodynamic characteristics of spray dried powders produced with weight ratio84
Drug Delivery to the Lungs , Volume 32, 2021 – Davide D’Angelo et al.
includes in vitro cell line studies to evaluate the safety of the formulation and its anti -inflammatory effect and pharmacodynamics and pharmacokinetics profile investigation in rats.
References
[1] L. D. Esposti, F. Carella, A. Adamiano, A. Tampieri, and M. Iafisco, “Calcium Phosphate -Based Nanosystems for Advanced Targeted Nanomedicine,” Drug Dev. Ind. Pharm., vol. 44, no. 8, pp. 1223–1238, 2018.
[2] J. Behr et al., “Lung deposition of a liposomal cyclosporine a inhalation solution in patients after lung transplantation,” J. Aerosol Med. Pulm. Drug Deliv. , vol. 22, no. 2, pp. 121–129, 2009.
[3] A. Molyvdas and S. Matalon, “Cyclosporine: an old weapon in the fight against coronaviruses,” Eur. Respir. J., vol. 56, no. 5, p. 2002484, 2020.
[4] T. E. Corcoran et al., “Preservation of post-transplant lung function with aerosol cyclosporin,” Eur. Respir. J., vol. 23, no. 3, pp. 378–383, 2004.
[5] H. P. Thakkar, A. K. Baser, M. P. Parmar, K. H. Patel, and R. Ramachandra Murthy, “Vincristine -sulphateloaded liposome-templated calcium phosphate nanoshell as potential tumor-targeting delivery system,” J. Liposome Res., vol. 22, no. 2, pp. 139–147, 2012.
[6] S. M. Schmidt et al., “Uptake of calcium phosphate nanoshells by osteoblasts and their effect on growth and differentiation,” J. Biomed. Mater. Res. - Part A, vol. 87, no. 2, pp. 418–428, 2008.
[7] “United States Pharmacopeia and National Formulary. Rockville. Anhydrous dibasic calcium phosphate Monograph. United States Pharmacopeial Conv. USP35 NF30, ‘Anhydrous Dibasic Calcium Phosphate,’” p. no. c, pp. 2011 –2012, 2021.
[8] A. M. Grimaudo, S. Nicoli, P. Santi, A. Concheiro, and C. Alvarez -lorenzo, “Cyclosporine-loaded cross-linked inserts of sodium hyaluronan and hydroxypropyl- β -cyclodextrin for ocular administration,” Carbohydr. Polym., vol. 201, no. August, pp. 308–316, 2018.
[9] P. L. Stewart, “Cryo-electron microscopy and cryo-electron tomography of nanoparticles,” Wiley Interdiscip. Rev. Nanomedicine Nanobiotechnology, vol. 9, no. 2, pp. 1–16, 2017.
[10] D. D’Angelo, F. Buttini, and F. Sonvico, “Inhalable cyclosporine powder for immunosuppressive treatment,” pp. 26 –26, 2021.
85
86
Protein DPI production: discriminating destabilising influences during spray drying
Friederike Roth, Regina ScherließDepartment of Pharmaceutics and Biopharmaceutics Kiel University, Grasweg 9a, Kiel, 24118, Germany
Summary
Protein formulations are especially challenging since proteins tend to aggregate or denaturise easily, resulting in a possible function los s. Most protein drugs are parenteral solutions having several disadvantages; an alternative would be a dry powder formulation for inhalation. Being a dry powder the drug should be more stable and, since sterility is not necessary for inhalation, easier to formulate. In this study, chymotrypsin as model protein and mannitol as stabilising excipient were investigated to examine the influence of the drying process in a Nano Spray Dryer B -90 HP on the protein structure. The focus laid on the impact of the different stress factors during the stages of spray drying on the protein. During pumping shear forces and adsorption to tubing material, during atomisation shear forces and ultrasonic sound and during drying, air -liquid-interfaces, thermal stress and dehydration occur. All stress factors can possibly lead to denaturation or aggregation. To detect structural changes the chymotrypsin activity assay and the measurement of changes in the fluorescence emission spectra of the fluorescent dye anilinonaphthalene-8-sulfonic-acid were used. It was found that mannitol stabilises the protein against high temperatures. Different results occurred for the stages of spray-drying. The pumping process did not cause structural changes. Atomisation, however, seems to influence the protein structure, although the enzyme activity did not change. The drying did not only influence the protein structure but a lso caused a small decrease in enzyme activity. Further studies will be conducted to find the best production parameters to get a stable product.
Key Message
To achieve stable protein DPI products, it is important to identify destabilising factors during production to address these with stabilising excipients. Individual stages in spray drying caused different structural changes, drying even decreased enzyme activity. Mannitol stabilised the protein against heat, whereas for other stress factors excipient selection is ongoing.
Introduction
Nowadays, protein drugs are usually formulated as solutions for parenteral application. The formulation is especially challenging because the drug has to be sterile, isotonic and isohydric but also needs a stabilising environment for the protein. Usually those formulations have to be stored cool. Proteins being sensitive drugs are likely to undergo structural changes during production and storage [1]. This could influence the drug´s effect. Proteins in dry powder formula tions are less prone to aggregate or denaturise [1]. This can lead to longer shelf life and may make cooling unnecessary [1]. A possible formulation would be a dry powder formulation for inhalation (DPI).
Pulmonary delivered protein drugs like Dornase alf a against cystic fibrosis are especially important for the local treatment of respiratory diseases, since the protein drug´s di stribution to the lung from systemic circulation is often limited [2]. However, pulmonary protein delivery can also be suitable for systemic targeting for protein drugs with a good ability to cross the blood -air barrier [2]. Furthermore, these formulations do not need to meet the criteria for parenteral use, therefore making protein stabilisation easier. For protein DPI production, spray drying is a suitable formulating option. However, during different stages of spray drying, stress factors occur and can be challenging for the proteins ´ structural stability. At first, the pumping process exposes the protein to possible ads orption stress at tubing-liquid interfaces and shear forces. During atomisation more shear forces occur. In case of nebulisation an additional stress factor would be ultrasonic frequency. Last, during drying, air -liquid-interfaces, thermal and dehydration stresses occur. All these could lead to aggregation or denaturation [3].
In general, sugars, like trehalose, are known stabilising excipients against heat and dehydration for protein drugs. This effect seems to rely on the hydrogen bonds between sugar and protein, mostly based on the theory of replacing the molecular water or causing a steric hindrance [3].
To investigate these phenomena, a study utilising the peptidase chymotrypsin, a model protein with a molecular weight about 25 kDa and good analytical properties, and mannitol, a not reducing sugar alcohol as excipient for inhalation, was performed.
Drug Delivery to the
32, 2021 – Friederike
Lungs, Volume
Roth, Regina Scherließ
87
Drug Delivery to the Lungs, Volume 32, 2021 - Protein DPI production: discriminating destabilising influences during spray drying
Experimental methods
For discrimination of the possible destabilising influences during spray drying, the performed study investigated the different stress factors separately. For all stress factors, protein-stabilising properties of mannitol were also evaluated The first part of the study, a thermal stability study in liquid, investigated the influence of storage at elevated temperature. Second, the protein was exposed to the different steps of spray drying: pumping, atomisation and drying (Table 1) . For this, a construction was built allowing collection of the samples directly after atomisation to investigate the influence of atomisation Furthermore, protein solutions were spray -dried to study the dehydration in heat. To investigate the influence of pumping on the protein, the remaining solution, after pumping through the tubing system during spray-drying, was also collected.
Table 1 Overview of evaluated samples
Sample name
Evaluated sample
Thermal stability study protein concentration: 1.5 mg/mL/ 3.0 mg/mL/ 7.5 mg/mL in 15 mL centrifuge tubes (Sarstedt AG & Co. KG; Nümbrecht, Germany)
Pumped
Temperatures
50°C for 1 d, 4 d, 7 d, 14 d
Solution in the tubing system after spray -drying Inlet: 120°C
Atomised Atomised in construction outside of the spray dryer Room temperature
Spray-dried collection of the spray-dried product Inlet: 120°C, Outlet: ca. 45°C
Thermal stability study: Different concentrations of chymotrypsin (lyophilis ed α-chymotrypsin from bovine pancreas, Sigma-Aldrich, Traufkirchen, Germany) were dissolved in a saturated (25 mg/mL) mannitol (Parteck® M DPI, Merck KGaA, Darmstadt, Germany) solution in milliQ water or pure milliQ water. Triplets of samples containing either 100 µL mannitol - and chymotrypsin solution or containing 100 µL pure chymotrypsin solution were analysed (Table 1). The samples were analysed with the chymotrypsin activity assay.
Nano spray dryer: Spray drying was performed with the Nano Spray Dryer B-90 HP (Büchi Labortechnik AG, Essen, Germany) The spray dryer mainly consists of the drying chamber including a high voltage particle collector for the product. The feed solution is pumped in a circle through the piezo electric spray head (medium membrane, produced droplets: medium mass diameter of 5 -8 µm, frequency: 125 Hz, pumping rate: 100%, spray rate: 80%), only parts of the solution are sprayed at the time. Triplets of samples containing a concentration of 4.0 mg/mL chymotrypsin or samples containing a concentration of 4.0 mg/mL chymotrypsin and 4.0 mg/mL mannitol in milliQ water were trea ted different ways (Table 1). The protein concentration of the pumped and atomis ed samples was determined using the Pierce-BCA assay kit by Thermo Fischer Scientific, Waltham, USA. As standard a 2.0 mg/mL chymotrypsin solution was used for the calibration curve. The samples were diluted to a concentration about 1 mg/mL. 25 µL of each sample and each dilution were pipetted in triplicate into a 96 well plate and 200 µL of the reacting agent containing cupric sulphate in an alkaline buffer were added. The plate was incubated for 30 min at 37 °C and analysed at 562 nm with a Tecan Spark ® plate reader (Tecan Trading AG, Männedorf, Switzerland).
Chymotrypsin enzyme activity assay: A chymotrypsin enzyme activity assay similar to the one described by Worthington Biochemical Corporation, Lakewood, USA was performed [5]. Prior to the measurement, the sample was diluted to an estimated concentration of 2.75 U/mg with 0.001N HCl. For the assay, 50 µL of the prepared sample, 50 µL of 0.001 N HCl and 2.9 mL of a freshly prepared mixture of 135 mL 0.08 M Tris-HCl buffer pH 7.8 containing 0.1 M calcium chloride (Merck KGaA) and 126 mL 0.00107 M Benzoyl-L-tyrosine ethyl ester (BTEE) (Sigma Aldrich) in 63% V/V methanol/ milli -Q-water were mixed in a quartz cuvette. The activity was calculated via measuring the increasing absorption at 256 nm for 5 minutes using the kinetics function of the UV-Vis-spectrometer (UV-1280 by Shimadzu, Kyoto, Japan) which directly calculated the ΔA256/min. With this using the following equation (964 being the extinction coefficient of BTEE and concentration being the chymotrypsin concentration in the reaction medium in mg/mL), the enzymatic activity of chymotrypsin in U/mg was calculated.
���������������������������������������������������� ����⁄�������� = 1000 ∗ ∆����256 964 ∗ ����������������������������������������������������
Fluorescence emission spectra changes: To investigate if the protein structure changed, the changes in the emission spectra of the proteins fluorescence were detected using a Tecan Spark ® plate reader. The emission spectra from 400 to 600 nm of the extrinsic fluorescence of a saturated solution in water (about 0.015 mg/mL) of the fluorescent dye anilinonaphthalene -8-sulfonic acid (ANS) using an excitation wavelength of 375 nm w ere recorded. ANS is almost nonfluorescent in water but interacts with the
88
hydrophobic parts of a protein leading to an increase in the intensity of the emission. An increase in hydrophobicity caused by changes in the tertiary structure or protein aggregation can lead to a blue shift and an even higher intensity [4]. The atomised and pumped samples were measured without further treatment; the spray-dried samples were dissolved in milliQ water to a theoretical concentration of 4.0 mg/mL chymotrypsin. Also a sample of the native protein as positive control and of the denaturised (100°C for 3 h) protein as negative control were analysed at a concentration of 4.0 mg/mL.
Results
The performed study investigated the impact the stress factors during pumping, atomisation and spray drying had on the samples either containing only chymotrypsin or containing additionally mannitol as stabiliser. Additionally, the stability of different samples containing chymotrypsin or chymotrypsin and mannitol were examined in a thermal stability study. The results show differences in the destabilising properties of the different stages of spray -drying such as a stabilising potential of mannitol.
Thermal stability study: Figure 1 shows the results of the thermal stability study in liquid. Compare d to the samples containing only chymotrypsin the samples containing additionally mannitol show a higher activity after all storage times at 50°C. The activity decreases with increasing protein concentration of the samples, an effect that can be seen for b oth the pure chymotrypsin samples and for the samples containing additionally mannitol.
and minimum, the outer lines of the box the first and third quartile and the inner line the median
Spray drying process: The enzyme activity was also determined for the chymotrypsin and chymotrypsin & mannitol samples after pumping, atomisation and drying. Compared to the original activity the pumped and atomised samples did not change significantly in activity whereas a sm all activity decrease was found in the spray -dried samples (Figure 2).
The ANS fluorescence emission spectra differed for the investigated samples; the atomised and the spray-dried samples differed from the native protein (Figure 3).
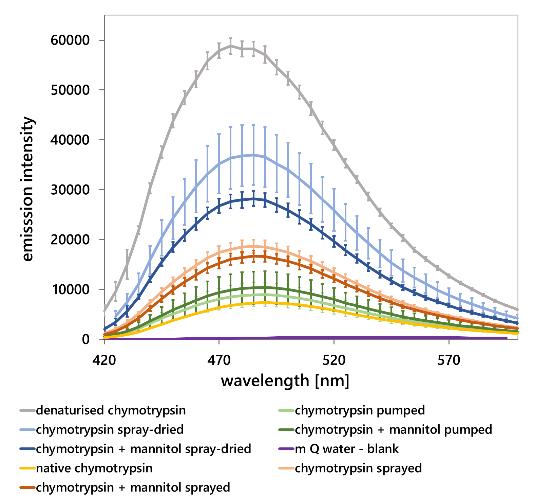
For these samples, the emission intensity was between the denaturised and the native protein. However, the spray-dried samples showed an even higher increase compared to the native protein. In this assessment, the denaturised samples showed an increase in intensity and a blue shift for the emission maximum was visible.
For the native protein and the pumped samples, emission maximum was around 490 nm, for the atomised and spray dried samples 485 nm and for the denaturised protein 475 nm. For the spray-dried samples, a lower increase of intensity for the samples containing mannitol was observed. Neither could difference be found between the atomised samples with and without mannitol nor could changes be found for the pumped samples.
Drug Delivery to the Lungs, Volume 32, 2021 – Friederike
Roth, Regina Scherließ
Figure 1: Enzyme activity after storage in 50° C for 1 d, 4 d, 7 d and 14 d, 1.5/ 3.0/ 7.5 mg/mL being the chymotrypsin concentration, the samples with mannitol are saturated with mannitol; n= 3; error bars= 95% CI
Figure 2: Enzyme activity after processing with the nano spray dryer compared to the native protein; showing the distribution of the 9 measurements (n=3 with performed measurements in triplicate), with the whiskers showing maximum
89
Figure 3: Extrinsic fluorescence of the fluorescence dye ANS after processing with the nano spray dryer compared to native a nd denaturised chymotrypsin; n= 3; error bars= S
Discussion
The results of the thermal stability study of samples containing chymotrypsin or chymotrypsin and mannitol in liquid clearly indicate a stabilising effect of mannitol against heat induced denaturation of chymotrypsin during storage. This is probably cause d by stabilising hydrogen bonds with the protein. Furthermore, self-destructing properties of the peptidase chymotrypsin seem likely due to the activity decrease for the samples with higher protein concentration [6].
Processing with the nano spray dryer seems to have an overall impact on the protein structure. An effect of the pumping process could not be found, possibly due to the stress factors here being least intense. While the atomisation by itself did not cause a decrease in enzyme activity, shear for ces and ultrasonic sound influenced the protein structure as seen in the fluorescence assays. The blue shift and the intensity increase can be explained by an increase of the protein’s hydrophobicity and so of the binding sites for ANS. This can be caused by a structural change leading to either aggregation or denaturation. However, it is possible that this effect is either reversible by dilution prior to the enzyme assay or does not influence the protein’s overall activity. For the spray -dried samples, a small decrease in the enzyme activity was found which is attributed to the dehydration process. For the spray-dried samples with and without mannitol, an increase in the intensity and a blue shift of the maximum of the fluorescence emission indicate an increase of the proteins’ hydrophobicity. During spray -drying a combination of tubing-liquid interfaces, shear forces, ultrasonic stress, air -liquid-interfaces, thermal and dehydration stress occur. They all possibly lead to aggregation or denaturation and thu s a decrease or effect loss of a protein drug.
However, since no structural changes occurred during pumping and only minor changes occurred during atomisation, it seems likely that heat and dehydration had the highest effect on the protein structure. Adding mannitol did not preserve the protein structure during atomisation under the examined conditions. A small stabilising effect during drying seems likely, since more pronounced changes in the fluorescence emission spectra for the pure protein samples were found. These observations seem logical, since small sugars being structurally related to mannitol are known to be good stabilisers against heat and dehydration stress but less so against shear forces [3]. It is also possible that the mannitol concentration used in this setting was not high enough to show additional protection during atomisation. It had been shown that mannitol was able to stabilise the protein as thermoprotectant against heatinduced loss of activity in solution, however a clear stabilisi ng effect of mannitol could not be seen in the product. This emphasises the need of additional or alternative excipients, like amino acids or polysorbates, to stabilise the protein as a lyoprotectant during the dehydration step.
Conclusion
Although mannitol showed good stabilising effects during the thermal stability study in liquid, only smaller effects during drying and no effect during the atomisation occurred. The atomisation as well as the drying process influenced the protein structure of chymotrypsin . However, drying had the major impact. Further studies will be conducted using different mannitol concentrations and extending the study to further excipients. Furthermore, different spray drying settings and other model proteins will be investigated to get a deeper understanding of destabilising processes and the rational use of stabilisers for protein drug production by spray drying.
References
[1] Divisha Jain, S. Shahe Mahammad, Pirthi Pal Singh, Ravinder Kodipyaka: review on parenteral delivery of peptides and proteins, Drug Development and Industrial Pharmacy, vol 45, june 2019, pp 1403-1420.
[2] Elsa Bodier-Montagutelli, Alexie Mayor, Laurent Vecellio, Renaud Respaud, Nathalie Heuzé -Vourc’h: Designing inhaled protein therapeutics for topical lung delivery: what are the next steps? Expert Opinion on Drug Delivery, vol 15, july 2018, pp 729-736.
[3] Maarten A. Mensink, Henderik W. Frijlink, Kees van der Voort Maarschalk, Wouter L.J. Hinrichs: How sugars protect proteins in the solid state and during drying (review): Mechanisms of stabilization in relation to stress conditions, European Journal of Pharmaceutics and Biopharmaceutics, vol. 114, may 2017, pp 288 -295.
[4] Robert A. Poole, Andrea Hawe, Wim Jiskoot, Kevin Braeckmans: Fluorescence spectroscopy to characterize protein aggregates and particles, In: Hanns-Christian Mahler, Wim Jiskoot: Analysis of aggregates and particles in protein Pharmaceuticals, Wiley and sons, Hoboken, New Jersey; pp 201-227, 2012.
[5] Worthington Biochemical Corporation: Chymotrypsin Assay (only online: https://www.worthingtonbiochem.com/CHY/assay.html)
[6] Awanish Kumar and Pannuru Venkatesu: Overview of the Stability of α-Chymotrypsin in Different Solvent Media, Chemical Reviews 2012, vol. 112, pp 4283−430
Drug Delivery to the Lungs, Volume 32, 2021 - Protein DPI production: discriminating destabilising influences during spray drying
90
91
92
On-Demand Speakers Conference Papers
93
94
Inhalable cannabidiol dry powders with enhanced solubility
Waiting Tai1, Lyndsey Leigh Anderson2, Jonathan Carl Arnold2, Hak-Kim Chan1 & Philip Chi Lip Kwok11Advanced Drug Delivery Group, Sydney Pharmacy School, Faculty of Medicine and Health, The University of Sydney, NSW 2006, Australia
2Lambert Initiative for Cannabinoid Therapeutics, Brain and Mind Centre, The University of Sydney, NSW 2050, Australia
Summary
Inhalation is a promising administration method for cannabidiol (CBD) due to its higher bioavailability than that from oral delivery The low solubility of CBD poses a delivery challenge. In this study, spray freeze dried CBD powders with enhanced solubility were produced with dipalmitoylphosphatidylcholine and a hydrophilic bulking agent (mannitol or trehalose dihydrate), referred to as Formulation M and Formulation T, respectively. Formulation M was crystalline, while Formulation T was amorphous. Both showed higher CBD solubility than raw CBD, with Formulation T having the highest value (raw CBD vs Formulation M vs Formulation T: 3.8 µg/mL vs 11.17 µg/mL vs 16.30 µg/mL). The mass median aerodynamic diameter of Formulation T was smaller than that of Formulation M (4.47 µm vs 5.56 µm), as reflected in its higher fine particle fraction < 5 µm (42.7% vs 33.6%). Formulation T may thus be further tested in vivo and adapted to deliver other cannabinoids by inhalation.
Key Message
Both the spray freeze-dried cannabidiol dry powders with mannitol (crystalline) and with trehalose dihydrate (amorphous) were dispersible and with enhanced cannabidiol solubility.
Introduction
Cannabis sativa has been used as an herbal medication for millennia. Cannabidiol (CBD) is the second most prevalent cannabinoid in cannabis and is non-psychoactive [1]. Its potential pharmacological actions have attracted much attention in recent years, for example, it is effective for treating seizures associated with Lennox-Gastaut and Dravet syndromes [2] The United States FDA approved Epidiolex®, an oral CBD solution, for these indications in June 2018 [3] However, CBD has a low oral bioavailability of about 6%, making ingestion an inefficient route of administration [4] Pulmonary delivery is a promising alternative [4]. Inhalation via smoking and vaporising are currently the most common delivery methods for cannabis. More importantly, the pulmonary bioavailability of CBD is approximately 31%, which is 5-fold higher than that from oral delivery [4] Hence, the inhaled doses can be lowered and thus potentially reduce systemic adverse effects.
Problems with aqueous solubility and chemical stability must be overcome to deliver CBD efficiently The reported aqueous solubility of CBD is approximately 0.1 µg/mL [1]. One approach to improve solubility is to form micelles to entrap and keep the drug in solution by using surfactants [5] There are endogenous surfactants in the lungs, which mainly consist of phospholipids [6] One of them is dipalmitoylphosphatidylcholine (DPPC), which is also an active ingredient for treating respiratory distress syndrome in preterm infants and an excipient for improving powder dispersion [7] This surfactant was utilised as a solubility and dispersion enhancer for the dry powders in this study. Formulating CBD as dry powders may also improve its chemical stability. CBD is prone to degradation by light, temperature, and oxygen during storage [8]. Studies have shown that CBD was more stable when stored in a powder form at room temperature than in solutions, regardless of the type of solvent [9]. Therefore, formulating CBD as dry powders is better than as solutions.
In this study, inhalable dry powder formulations of CBD with DPPC were produced Mannitol and trehalose dihydrate were added as hydrophilic bulking agents to improve the wetting of the powders Their crystallinity, CBD solubility, and aerodynamic particle size distribution were investigated.
Experimental methods
Materials
CBD was bought from THC Pharm (Frankfurt, Hesse, Germany). Trehalose dihydrate, Tween 80 and tert-butanol were purchased from Sigma-Aldrich (St. Louis, Missouri, United States). Mannitol was bought from Roquette (Geneva, New York, United States), while DPPC was supplied by Cayman
Drug Delivery to the Lungs, Volume 32, 2021 - Waiting Tai et al.
95
Chemical (Ann Arbor, Michigan, United States) Ethanol and phosphate buffered saline (pH 7.4) were purchased from Chem-Supply Pty Limited (Adelaide, South Australia, Australia) and POCD Healthcare (Sydney, New South Wales, Australia), respectively. Ultrapure water was obtained from a Milli-Q® Direct Water Purification System (Millipore, Bedford, Massachusetts, United States).
Methods
Spray freeze drying
Powders of two formulations (Formulation M: CBD+DPPC+mannitol; Formulation T: CBD+DPPC+trehalose dihydrate) were spray freeze dried. The total solute concentration was 20 mg/mL, using 60:40 water:tert-butanol by volume as the co-solvent The CBD-to-DPPC-to-carbohydrate mass ratio was 1:1:3. The solutions were fed at a flow rate of 0.5 mL/min via a syringe pump into an ultrasonic nozzle (Sono-Tek, Milton, New York, United States), which was connected to a Sono-Tek ultrasonic generator for controlling the atomizing frequency and power at 48 kHz and 2 W, respectively The ultrasonic nozzle was positioned 10 cm above the surface of the liquid nitrogen contained in a stainless-steel collection cup The liquid nitrogen was allowed to evaporate after finished spraying a solution. The frozen droplets were then lyophilised for 48 h at -20 ºC in a freeze dryer (Martin Christ Gefriertrocknungsanlagen GmbH, Osterode am Harz, Niedersachsen, Germany). After that, the temperature was ramped upwards at a rate of 10 ºC per hour until 20 ºC was reached, at which point the samples were kept for another 20 h before removal from the freeze dryer.
X-ray powder diffraction (XRD)
An X-ray diffractometer (X’Pert Powder; Malvern Panalytical Ltd., United Kingdom) was employed to characterise the diffraction patterns of the samples. The powders were spread on zero diffraction plates and subjected to Cu Kα radiation under ambient temperature. The current and voltage were 45 mA and 40 kV, respectively. The scattered intensity was recorded from 5 to 50° by a detector with a scan speed of 0.04° 2θ per second.
Solubility test
An excess amount of a spray freeze dried powder was added into 10 mL of 0.002% w/v Tween 80 in phosphate buffered saline at pH 7.4. Tween 80 was chosen because it was used in previous studies to differentiate the dissolution profiles of lipophilic basic drugs [10-12], of which CBD is an example The concentration of Tween 80 should be as low as possible to minimise artefacts in increasing the solubility of CBD, and was therefore used at its critical micelle concentration in water [13] The solution was stirred continuously at 37 ºC for 2 hours, during which the degradation of solubilised CBD was not significant After it was centrifuged at 29756 × g for 10 min, the supernatant was taken as a sample for the quantification of CBD by high pressure liquid chromatography. The solubility test of raw CBD was conducted in the same dissolution medium as a control. The test was performed in triplicate.
Cascade impaction
The aerodynamic particle size distributions (APSDs) of the two formulations were determined using the Next Generation Impactor (Copley, Nottingham, United Kingdom), in which all eight stages were coated with 0.6% w/v Tween 80 in ethanol Five milligrams of powder was loaded into a Size 3 hydroxypropyl methylcellulose capsule (Capsugel, Sydney, New South Wales, Australia). One capsule per run was dispersed from a low resistance Osmohaler® (Pharmaxis, Frenchs Forest, New South Wales, Australia). The flow rate and duration of dispersion were 95 L/min (equivalent to a 4 kPa drop across the inhaler) and 2.5 s, respectively, allowing 4 L of air to pass through the inhaler. The mass of CBD collected on each part and stage of the Next Generation Impactor was quantified by high pressure liquid chromatography The emitted fraction (EF), fine particle fraction (FPF), mass median aerodynamic diameter (MMAD), and geometric standard deviation (GSD) were calculated. The EF and FPF were defined as the emitted dose and fine particle dose with respect to the recovered dose, respectively MMAD was the aerodynamic diameter that divided the particle size distribution by mass in half. The GSD was the square root of the ratio of the aerodynamic diameter at 84% undersize to that at 16% undersize The experiments were carried out in triplicate
Statistical analysis
Jamovi (Sydney, New South Wales, Australia) was used to conduct statistical analyses. The statistical tests for analysing the significance of the aerosolisation performance and solubility were Student’s t-test and ANOVA with the Tukey post hoc test, respectively. The significance level was p ≤ 0.05 for the t-test and ANOVA, and ɑ ≤ 0.05 for the post hoc test
Drug
to
enhanced
Delivery
the Lungs, Volume 32, 2021 - Inhalable cannabidiol dry powders with
solubility
96
Results and Discussion
The XRD patterns of the raw materials and both formulations are depicted in Figure 1. The raw materials and Formulation M were crystalline, as confirmed by the distinct diffraction peaks. Most of the peaks of Formulation M corresponded to those of mannitol as it was the major composition. However, raw mannitol and the mannitol in Formulation M did not share the same peaks. Their peaks indicated that the raw mannitol and the mannitol contained in Formulation M were in beta and delta form, respectively [14]. The polymorphic change of mannitol may be attributed to its rapid precipitation during spray freeze drying [15]. The peaks of DPPC and CBD in Formulation M were either low in intensity or they overlapped with other peaks, thus it was difficult to determine their crystal form in this powder. The halo pattern of Formulation T indicates that it was amorphous.
Raw DPPC
Raw Mannitol
Raw CBD
Formulation M
Formulation T
Figure 1. X-ray diffraction patterns of the raw materials and spray freeze dried powders.
The saturated concentrations of CBD from Formulations M and T were significantly higher than that of raw CBD (raw CBD vs Formulation M vs Formulation T: 3.8 µg/mL vs 11.17 µg/mL vs 16.30 µg/mL; control vs formulations: p ≤ 0.05; Formulation T vs Formulation M: p > 0.05), showing the effect of DPPC in enhancing solubility. The lower solubility of CBD from Formulation M compared to that of Formulation T might be due to the difference in crystallinity. Mannitol in Formulation M was crystalline and formed an orderly packed structure on its own, leaving DPPC and CBD out of the matrix. Therefore, it provided limited enhancement in the wetting and dissolution of CBD, suggesting that its solubility was increased mainly by DPPC. In contrast, DPPC and CBD fitted well into the glassy matrix of the amorphous Formulation T. Therefore, CBD in that powder was wetted better and dissolved easier, reaching a higher saturated concentration.
The mass recoveries, APSDs, EFs, and FPFs of the powders measured by cascade impaction are shown in Figure 2. The recovery was close to 100%, indicating that almost all the CBD was accounted for in the drug assay. Formulation T had slightly less powder retained inside the capsule than Formulation M, hence the EF for the former was slightly higher but the difference was not statistically significant. Less CBD from Formulation T deposited on Stage 1 but more deposited on the lower stages. Therefore, Formulation T had significantly higher FPFs than Formulation M, suggesting that more particles from Formulation T could reach the deep lung The MMAD of Formulation M was significantly larger than that of Formulation T (5.56 µm vs 4.47 µm; p ≤ 0.05), but their GSDs were comparable (2.51 vs 2.52; p > 0.05). Stability study is required to investigate the change in aerosol performance under different storage conditions.
Drug Delivery to the Lungs, Volume 32, 2021 - Waiting Tai et al.
5 10 15 20 25 30 35 40 45 50 2-Theta (°) R e l a t i v e i n t e n s i t y
97
Capsule Inhaler Adaptor Throat Stage1(>6.29µm)Stage2(6.29µm)Stage3(3.51µm)Stage4(2.24µm)Stage5(1.34µm)Stage6(0.74µm)Stage7(0.42µm) Micro-orificecollcector(0.25µm)RecoveryEmittedfraction Fineparticlefractionrecovered<5µmFineparticlefractionrecovered<2µm
Conclusion
CBD was spray freeze dried with DPPC and mannitol or trehalose dihydrate to obtain inhalable particles with enhanced solubility Both formulations showed acceptable aerodynamic performance for pulmonary delivery. Despite the powder having different crystallinity, the significant enhancement of the aqueous solubility of CBD may lead to a higher drug absorption from the lungs. Formulation T performed better overall than Formulation M, owing to its higher FPF and CBD solubility. It may thus be further tested in vivo and adapted to deliver other cannabinoids by inhalation.
References
[1] N. Koch, O. Jennotte, Y. Gasparrini, F. Vandenbroucke, A. Lechanteur, B. Evrard: Cannabidiol aqueous solubility enhancement: Comparison of three amorphous formulations strategies using different type of polymers, Int J Pharm 2020; 589: 119812.
[2] E. Perucca, M. Bialer: Critical aspects affecting cannabidiol oral bioavailability and metabolic elimination, and related clinical implications, CNS Drugs 2020; 34: 795-800.
[3] The United States Food and Drug Administration, FDA approves first drug comprised of an active ingredient derived from marijuana to treat rare, severe forms of epilepsy https://www.fda.gov/news-events/pressannouncements/fda-approves-first-drug-comprised-active-ingredient-derived-marijuana-treat-rare-severe-forms, 2018, accessed 26/07/2021.
[4] S.A. Millar, R.F. Maguire, A.S. Yates, S.E. O'Sullivan: Towards better delivery of cannabidiol (CBD), Pharmaceuticals (Basel) 2020; 13: 219.
[5] K.T. Savjani, A.K. Gajjar, J.K. Savjani: Drug solubility: Importance and enhancement techniques, ISRN Pharm 2012; 2012: 195727.
[6] P.O. Nkadi, T.A. Merritt, D.A. Pillers: An overview of pulmonary surfactant in the neonate: Genetics, metabolism, and the role of surfactant in health and disease, Mol Genet Metab 2009; 97: 95-101.
[7] B. Cuvelier, P. Eloy, C. Loira-Pastoriza, B. Ucakar, A.A. Sanogo, C. Dupont-Gillain, R. Vanbever: Minimal amounts of dipalmitoylphosphatidylcholine improve aerosol performance of spray-dried temocillin powders for inhalation, Int J Pharm 2015; 495: 981-990.
[8] A.I. Fraguas-Sanchez, A. Fernandez-Carballido, C. Martin-Sabroso, A.I. Torres-Suarez: Stability characteristics of cannabidiol for the design of pharmacological, biochemical and pharmaceutical studies, J Chromatogr B Analyt Technol Biomed Life Sci 2020; 1150: 122188.
[9] E. Kosovic, D. Sykora, M. Kuchar: Stability study of cannabidiol in the form of solid powder and sunflower oil solution, Pharmaceutics 2021; 13: 412.
[10] E. Amini, A. Kurumaddali, S. Bhagwat, S.M. Berger, G. Hochhaus: Optimization of the Transwell® system for assessing the dissolution behavior of orally inhaled drug products through in vitro and in silico approaches, Pharmaceutics 2021; 13: 1109.
[11] S. Bhagwat, U. Schilling, M.J. Chen, X. Wei, R. Delvadia, M. Absar, B. Saluja, G. Hochhaus: Predicting pulmonary pharmacokinetics from in vitro properties of dry powder inhalers, Pharm Res 2017; 34: 2541-2556.
[12] Y.J. Son, M. Horng, M. Copley, J.T. McConville: Optimization of an in vitro dissolution test method for inhalation formulations, Dissolution Technol. 2010; 17: 6-13.
[13] S. Deechongkit, J. Wen, L.O. Narhi, Y. Jiang, S.S. Park, J. Kim, B.A. Kerwin: Physical and biophysical effects of polysorbate 20 and 80 on darbepoetin alfa, J Pharm Sci 2009; 98: 3200-3217.
[14] M.G. Cares-Pacheco, G. Vaca-Medina, R. Calvet, F. Espitalier, J.J. Letourneau, A. Rouilly, E. Rodier: Physicochemical characterization of D-mannitol polymorphs: The challenging surface energy determination by inverse gas chromatography in the infinite dilution region, Int J Pharm 2014; 475: 69-81.
[15] S.M. D'Addio, J.G. Chan, P.C. Kwok, B.R. Benson, R.K. Prud'homme, H.K. Chan: Aerosol delivery of nanoparticles in uniform mannitol carriers formulated by ultrasonic spray freeze drying, Pharm Res 2013; 30: 28912901.
Drug Delivery to the Lungs, Volume 32, 2021 - Inhalable cannabidiol dry powders with enhanced solubility
Figure 2. The recovery, APSD, emitted fraction, and fine particle fraction of Formulation M (light grey) and Formulation T (dark grey). (n = 3; mean ± standard deviation; *p ≤ 0.05)
0 20 40 60 80 100 M a s s ( % ) Formulation M Formulation T ✱ ✱ 98
Drug Delivery to the Lungs, Volume 32, 2021 – Matthew Potts et al.
Developing Analytical Methodology and Test Apparatus to Study Drug Deposition in the Throat
Matthew Potts1, Ben Myatt1, Sam Apoola2 & Peter Healey11Kindeva Drug Delivery Limited, Charnwood Campus, 10 Bakewell Road, Loughborough, LE11 5RB, United Kingdom
2School of Mechanical Engineering, Leeds University, Woodhouse Lane, Leeds, LS2 9JT, United Kingdom
Summary
Drug deposition in the mouth/throat is a common problem with many respirable medicines. To aid the development of products which reduce this deposition, suitable analytical methodology must be developed. Knowing more about where the drug is impacted within the mouth/throat can allow for greater insight into the causes of the deposition and what changes to the product may have the greatest impact on reducing this deposition. A split anatomical throat was designed, manufactured and then incorporated into analytical methodology developed to determine regional throat deposition and the fine particle mass/fraction (FPM/FPF). The methodology was developed utilising a Fast Screening Impactor (FSI) to achieve rapid screening of device prototypes and novel formulations
Key Message
We developed novel anatomical throat apparatus and analytical methodology to accurately determine regional oropharyngeal drug deposition of inhaled respiratory medicines, enabling rapid screening of device prototypes and novel formulations The drug deposition data is comparable to that generated using a standard OPC anatomical throat and Next Generation Impactor testing setup
Introduction
Drug deposition in the throat is a common problem with many respirable medicines. One of the most significant disadvantages of the pMDI is inherently high oropharyngeal (mouth/throat) deposition, greater than 70% in some marketed products[6]. A significant mass of active pharmaceutical ingredient is deposited in the oropharyngeal cavity in-vivo which does not lead to patient therapeutic effect. Understanding where the drug deposits within the mouth and throat can lead to insights into the causes of this deposition and therefore inform any developed solutions to address this This leads to more efficient medicines and devices, in turn driving improved patient outcomes and reducing costs for manufacturers, customers and patients
Analytical measurements using compendial techniques to determine pharma performance of an inhalation product utilise the USP-IP (United States Pharmacopeial Induction Port) as an interface between the test product and the cascade impactor apparatus. Recently, anatomically relevant throat models have become more commonly used during in-vitro cascade impaction measurements[1] because they more accurately represent the in-vivo geometry of the human throat, that the drug droplets/particles produced by a device must navigate through prior to entry to cascade impaction particle sizing equipment. Correlation of in-vitro lab data to in-vivo lung deposition data generated in a clinical setting has been shown to be much higher when using anatomically relevant throat models compared to the USP-IP[2][3]
The objective of this work was to develop test apparatus and analytical methodology which could be used to assess the regional drug deposition within the mouth and throat, and if possible, couple this with existing in-vitro cascade impaction measurements.
1. Developing the Testing Apparatus
To accurately understand where inhaled drug is deposited in the mouth/throat, the internal geometry of the equipment used is critical. Based on the work of the Oropharyngeal Consortium (OPC) [4] an anatomical throat, manufactured by Emmace Consulting, (Lund, Sweden), is commercially available to the inhalation community to use when performing in-vitro cascade impaction measurements. The medium OPC throat design was taken as the base geometry for design of a mouth/throat geometry which could be split into sections for regional assay. The geometry was split into four regions of interest: the tongue, oral cavity, oropharynx and laryngopharynx, indicated in Figure 1.
The outline of the tongue was approximated using a curved geometry along the region where the tongue and wall of mouth meet, as a vertical cutting plane. The oral cavity was taken as the remainder of the geometry above the tongue from the front of the cavity to a vertical plane intersecting the tip of the uvula. The oropharynx was taken as the region behind the uvula and above a horizontal plane intersecting the tip of the epiglottis with the laryngopharynx the remaining region below
99
Drug Delivery to the Lungs, Volume 32, 2021 – Developing Analytical Methodology and Test Apparatus to Study
Drug Deposition in the Throat
Oral Cavity
Uvula
Oropharynx
Tongue
Laryngopharynx
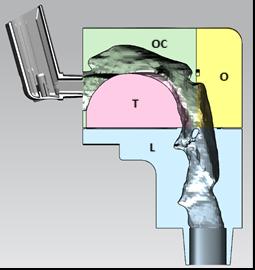
Epiglottis
The four components of the Kindeva Drug Delivery (KDD) split anatomical throat were additively manufactured by Emmace Consulting, (Lund, Sweden) using the same material and manufacturing processed as the standard, commercially available OPC anatomical throats. Gas tight sealing of the individual sections was achieved using a gasket (orange component in Figure 2), a seal fitted in the groove in the yellow oropharynx component, and a nitrile sleeve placed over the assembled throat.
2. Analytical Methodology Testing Apparatus
The KDD split anatomical throat was coupled to a Fast Screening Impactor (FSI) operating at 30L/min and containing a 30L/min 5-micron pre-separator insert (Copley Scientific Limited, Nottingham, UK) to determine regional mouth/throat deposition and the fine particle fraction/mass of the delivered drug. The KDD split anatomical throat can also be coupled to a full NGI apparatus if a more extensive analysis of the respirable fraction is required. Sample analysis was performed using a UV Spectrophotometer or, when required for reasons of specificity, HPLC analysis. For each sample analysis methodology (UV & LC) specificity was assessed with respect to the gasket and rubber seal materials.
Comparison to OPC Throat coupled with NGI Apparatus
Figure 1 – Sectioning the Regions of the Mouth/Throat Figure 1: Cross-sectional view of KDD split anatomical throat showing location of pMDI during testing. OC = oral cavity, T = tongue, L=laryngopharynx, O = oropharynx Figure 2 - KDD split anatomical throat exploded view Figure 3 - KDD split anatomical throat assembled view100
A pMDI containing 5mcg/act Tiotropium was tested (n=5) using the KDD split anatomical throat coupled to the FSI. The same product was also tested using a medium anatomical OPC throat coupled to a NGI. The flow rate through both devices was set to 30L/min and the pMDI plumes fired horizontally
Each component part of the KDD split anatomical throat was assayed, using a suitable diluent to recover the deposited drug The determination of Tiotropium drug deposition was performed using a chromatographic system (HP1100 series, Agilent Technologies) equipped with a binary pump, autosampler and a variable wavelength detector.
3. Results and Discussion
Comparison of KDD split anatomical throat coupled to FSI with medium OPC throat coupled with NGI
The deposition of drug in the medium OPC throat and in each section/region of the KDD split anatomical throat can be seen in Figure 4. Although there is an observed small reduction in total drug recovered from KDD split anatomical throat, it is still comparable to that recovered from the medium OPC throat and provides valuable insight into the deposition sites within the throat. The increased variability, observed between test replicates, in the total throat drug deposition for the KDD split anatomical throat, when compared to the standard medium OPC throat, (5.3% vs 1.2%) is not unexpected due to the increased sample recovery complexity and potential for cumulative error.
KDD Spilt Anatomical Throat & FSI Medium OPC & NGI
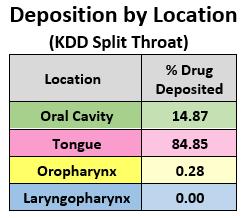
Identifying that 85% of the total drug deposition in the throat was located on the Tongue, and that virtually all the drug was deposited in the upper throat, informed further product development activities. The high drug deposition in the mouth/throat agrees with previously published work concerning oropharyngeal drug deposition of aerosolised particles[5][6] . However, this technique is undoubtably faster and less costly, and with the advantage of higher throughput, when compared to gamma scintigraphy for quantifying mouth/throat deposition
The percentage mass balance (%MB), Fine Particle Mass (FPM) and Fine Particle Fraction (FPF) values for the two systems are shown in Figure 4. These values are broadly similar, with the slightly lower mass balance observed for the KDD split anatomical throat system within acceptable pharmacopeial limits. Therefore, the KDD split anatomical throat is acceptable for use as an indicative fast screening tool It is possible that further improvements such as rinse methodology, surface coatings and component sealing of the KDD split anatomical throat system could reduce the test variability in line with the medium OPC throat system.
Drug Delivery to the Lungs, Volume 32, 2021 – Matthew Potts et al.
Figure 4 – Comparison of Device and Throat Drug Deposition
Figure 4: Comparison of drug deposition on the device and throat between the KDD split anatomical throat (coupled with FSI) and the medium OPC throat (coupled with NGI).
0.0 0.5 1.0 1.5 2.0 2.5 3.0 3.5 Device Throat (total) Oral Cavity Tongue Oropharynx Laryngopharynx Deposition ( µ g/act)
101
Rapid Screening
The use of a FSI coupled with the KDD split anatomical throat, proved an efficient way of generating information on FPF and the location of drug deposited on the throat. The number of samples to recover and analyse was reduced from twelve (full NGI) to eight (FSI), with subsequent testing reduced to only five samples (valve and actuator recovery eliminated and pre-separator recovery, where insignificant, was eliminated). This saved time during the HPLC analysis and data analysis (reduced sample numbers), and even accounting for the assembly/disassembly of the KDD split throat, saved time during the drug recovery steps Solvent usage in the laboratory was reduced, and in some cases, testing times could be reduced still further by using UV analysis instead of HPLC
4. Conclusions
Regional breakdown of throat deposition offers additional real data and insight into drug deposition location post pMDI mouthpiece, enabling informed product design modification decisions Coupling the KDD split anatomical throat with the FSI enables an innovative, fast and efficient methodology for assessing product design changes. The reduction in testing time from using the fast screening methodology is significant and enables a quicker turnaround from new prototype or formulation to invitro product performance data. The data produced using the KDD split anatomical throat with FSI showed good agreement with full Anatomical Throat / NGI testing, with respect to predicted Pharma performance (FPF, FPM etc), indicating it is a useful product development analytical tool, particularly in the rapid development of next generation, high efficiency inhalation products.
We found, for the product tested, that tongue deposition was most significant in the mouth/throat region and can be a hugely significant factor for some pMDI products. Developing products that minimise throat, and specifically tongue, deposition could lead to much more efficient products, reducing costs, and improving the patient experience
Drug Delivery to the Lungs, Volume 32, 2021 – Developing Analytical Methodology and Test Apparatus to Study Drug Deposition in the Throat
5 –
Mass
Figure
Comparison of
Balance, FPM and
FPF
Figure 4: Comparison of mass balance and FPF between the KDD split anatomical throat (coupled with FSI) and the medium OPC throat (coupled with NGI).
0 10 20 30 40 50 60 70 80 90 100 110 Mass Balance FPF Percentage (%) KDD Spilt Anatomical Throat & FSI Medium OPC & NGI 0.0 0.5 1.0 1.5 2.0 FPM <5um Amount (µg/act)
Medium OPC & NGI 102
KDD Spilt Anatomical Throat & FSI
Drug Delivery to the Lungs, Volume 32, 2021 – Matthew Potts et al.
References
[1] Samantha Holmes, Alex Slowey: A comparison of Different Anatomical Throats vs The USP Throat. Drug Delivery to the Lungs (DDL2017), 2017.
[2] Stephen P. Newman, Hak-Kim Chan: In vitro-in vivo correlations (IVIVCs) of deposition for drugs given by oral inhalation Advanced Drug Delivery Reviews, 167 (2020), 135-147
[3] Xiangyin Wei, Michael Hindle, Anubhav Kaviratna, Bao K. Huynh, Renishkumar R. Delvadia, Dennis Sandell and Peter R. Byron: In Vitro Tests for Aerosol Deposition. VI: Realistic Testing with Different Mouth–Throat Models and In Vitro In Vivo Correlations for a Dry Powder Inhaler, Metered Dose Inhaler, and Soft Mist Inhaler. Journal of Aerosol Medicine and Pulmonary Drug Delivery, Volume 31, Number 6, 2018
[4] Patricia K.P. Burnell, Lars Asking, Lars Borgström, Steve C. Nichols, Bo Olsson, David Prime, Ian Shrubb: Studies of the Human Oropharyngeal Airspaces Using Magnetic Resonance Imaging IV The Oropharyngeal Retention Effect for Four Inhalation Delivery Systems, Journal of Aerosol Medicine Vol. 20, No. 3, 2007
[5] Stephen P Newman, Demetri Pavia, Folke Moren, Noirin F Sheahan, Stewart W Clarke: Deposition of pressurised aerosols in the human respiratory tract. Thorax, 36(1), pp. 52-55, 1981.
[6] Y.S. Cheng, C.S. Fu, D. Yazzie, Y. Zhou: Respiratory deposition patterns of salbutamol pMDI with CFC and HFA-134a formulations in a human airway replica, Journal of Aerosol Medicine Vol. 14, No. 2, 2001
103
104
HFA-152a Inhaler Dose Release
Alan P. McKiernan1, Treasa M. Thomas1 & Cathal Duignan11Prior PLM Medical, IDA Business & Technology Park, Carrick-on-Shannon, N41 WK46, Ireland
Summary
Background: With new regulations on the horizon, the industry is looking at switching inhaler propellants to greener alternatives. These new propellants may have different properties and so their effect on the dose delivery mechanics and fluid dynamics needs to be carefully studied.
Methods: We have used phase contrast X-ray imaging at a synchrotron to investigate the sump/orifice region of off-the-shelf pMDI actuators during dose release with HFA 134a and HFA152a propellants. We have used Schlieren imaging, an optical technique that is sensitive to refractive index gradients which are often present in pMDI plumes due to gas density variations , to have observe plume expansion up to 120 mm from the same commercial pMDIs.
Results: It was observed that HFA 152a drives marginally faster plumes than HFA134a despite a slightly lower vapour pressure. Propellant boiling/cavitation behaviour appears similar for both propellants. The liquid/gaseous spray cones from each type of propellant behave similarly
Conclusions: While further investigations will certainly be undertaken by the industry in the coming years to evaluate through-life performance of shot-weight and particle size distribution, component compatibility etc. we have seen that the inhaler dose release dynamics are broadly similar between the two propellants in placebo form
Key Message
The inhaler dose release dynamics are broadly similar between the HFA134a and HFA152a propellants in placebo form in commercial actuators which suggests that HFA152a may be a suitable greener alternative, notwithstanding other aspects of inhaler performance that need further exploration.
Introduction
Concern has risen in recent years regarding the global warming potential of pMDI devices and the dominant contributing component has been identified as the hydrofluoroalkane propellant[1] Switching to DPI’s has been proposed as an alternative[2] however, while this is estimated to reduce GHG emissions by 96%, other environmental impacts increase[1] and DPI’s are not always suitable from a clinical perspective[3] . HFA-152a has been identified as a low GWP propellant which would reduce pMDI environmental impact to levels comparable to DPI devices[1]
Switching pMDIs to a new propellant has been achieved in the past with the CFC phase out but this is not a trivial task. Ultimately this will involve patients and clinical trials but in these early stages work has been underway to understand the physical/chemical performance of devices and components on incorporation of HFA-152a into devices. Modelling has been carried out predicting plume forces[4] and experimental work looking at plume temperatures[5], actuator sump temperatures/pressures[6], and using X-ray scattering to measure spray density[7]
Schlieren imaging[8] is an optical method that is sensitive to the refractive index gradient of visible light . Essentially, a region with a refractive index gradient causes the light beam passing through it to deviate slightly and this is captured by a high-speed camera. Imaging based on X-ray absorption has been in use for well over a century. In recent decades powerful synchrotron sources have become available with coherence properties capable of enabling phase contrast imaging (XPCI)[9] These techniques can provide additional information to scientists and engineers to increase their understanding of their device designs with HFA-152a. We have observed and present the dynamics of the dosing event internally and the external plume from several commercial pMDI actuator using HFA 152a and HFA 134a placebofilled canisters. Another alternative propellant, HFO 1234Ze, was not studied.
Experimental Methods
A monochromatic X-ray beam of energy 26 keV and bandwidth 0.4% was used at beamline ID19 at the European Synchrotron Radiation Facility, Grenoble, France. The pMDI devices were first shaken at 3Hz for 5 seconds using a custom-built rig with a motor-driven shaking before being actuated by a linear actuator on the rig. The linear actuator and shaking function were driven by an Arduino microcontroller.
Drug Delivery to the Lungs, Volume 32, 2021 - Alan P McKiernan et al
105
The camera running at 2200-7000 fps, 143-455 µs exposure times) had a resolution of 6.5 or 10 µm/pixel
Prior PLM Medical’s large field of view z-type mirror-based Schlieren system was used to image the inhaler plume onto a high-speed CMOS camera running at 2000 fps using a 4000-lumen white LED and 413 mm diameter parabolic mirrors. The spatial resolution was measured as 0.14 mm /pixel. Video postprocessing was performed using FIJI’s kymograph feature10
Three off-the-shelf commercial pMDI device designs were investigated with canisters containing either HFA 152a or HFA 134a placebo propellant (61 µL dose volumes) inserted into the actuators having orifice diameters of 0.30, 0.40 and 0.53 mm respectively. The devices were not modified in any way. Each actuator design was coupled in turn with both canister/propellant options. Each device was primed/ dosed according to manufacturer’s instructions.
Results and Discussion
Phase contrast X-Ray images of the liquid/gas spray mixture in the sump and orifice channel are shown in Figure 1 at 115.9 ms after dose release commencement Comparing the top row of images (HFA134a) with the corresponding actuators on the bottom row (HFA152a), we can see a broadly similar spread of large and small bubble sizes and liquid present in the sump. These devices contain 100% propellant, but the addition of ethanol is known to change the bubble size distribution towards more smaller bubbles which may be of relevance for some product formulations. In most of the images shown in Figure 1 liquid jets are visible exiting the orifice
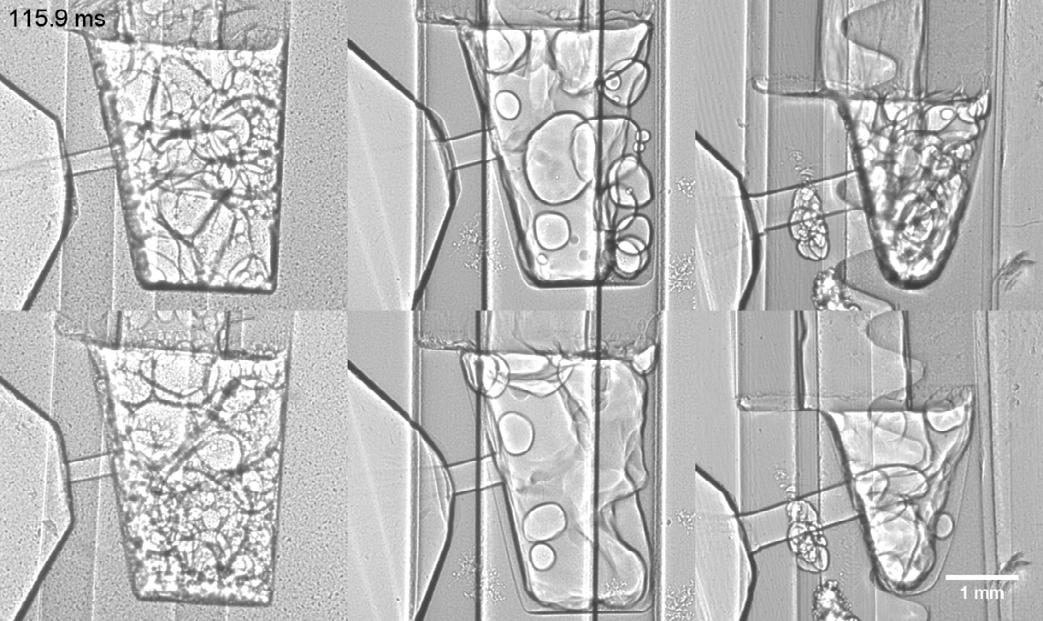
Lungs, Volume 32, 2021 -
Drug Delivery to the
HFA-152a Inhaler Dose Release
Figure 1: Stills of propellant cavitation/boiling taking place in sump: Top - HFA134a, Bottom - HFA 152a; orifice diameter left to right - 0.3, 0.4 and 0.53 mm
Orifice
Stem
106
Liquid film
Sump floor
The sump geometries are quite different between the three actuators and while timing was synchronised between the actuation equipment and the synchrotron equipment so that timings are comparable the different geometries and orifice channels affect the dynamics evolution and the throughput. Fluid can be seen descending through the stem and filling the sump in the high-speed video footage. This is predominantly liquid with some two-phase mixture evident. Rapid boiling takes place in the full sump volume for a short time after the input from the canister ceases. This bulk boiling duration generally lessens with increasing actuator orifice diameter as is expected as the larger orifice facilitates faster emptying. Boiling continues at the sump floor for a longer period after the bulk of the sump has been emptied. A liquid film is also seen to form on the actuator surface just outside the orifice. In this region the actuator plastic is often rather thin and, while the flash boiling event is often approximated as adiabatic, some cooling may be occurring here due to heat exchange between plastic and boiling propellant (similar cooling is often observed in canisters where doses are fired rapidly) which could impede propellant boiling/evaporation in this area Indeed, API deposition is often observed here. It should be noted that more than 5 minutes elapse between actuations so components would be expected to be in thermal equilibrium.
Kymographs enable us to generate a time series or streak image from a line of pixels from each successive frame in a video (stacked side-by-side). Kymographs generated along the central axis of the stem/sump, are displayed in Figure 2 showing this time evolution of propellant boiling in the actuator together with the longer period of slowly evaporating liquid on the sump floor. Figure 3 displays a plot of the corresponding boiling liquid durations. The HFA152a propellant boiling is completed in a slightly shorter time than HFA134a but the difference does not appear significant.
Similar Kymographs were generated from the X-Ray videos across the orifice channel and in the external spray cone area and used to calculate the times during which liquid is present in the channel and liquid jets are emitted (Figure 4). The liquid/droplet jets are typically present while liquid is fed through the orifice channel but are also made up by some of the cool external liquid film seen outside the orifice. Also displayed are the durations of high-density plume captured with the schlieren technique. These times are a little shorter than the orifice/jet timings from X-Ray footage but are recorded outside the mouthpiece so that some droplet evaporation may have taken place in transit thus reducing the plume high-density duration observed.
Drug Delivery to the Lungs, Volume 32, 2021 - Alan P McKiernan et al
Figure 2: Kymographs for HFA134a (left) and HF152a (right); orifice diameter top to bottom - 0.3, 0.4, 0.53 mm. Position denotes height above the sump floor, propellent enters from above
liquid
107
Boiling liquid
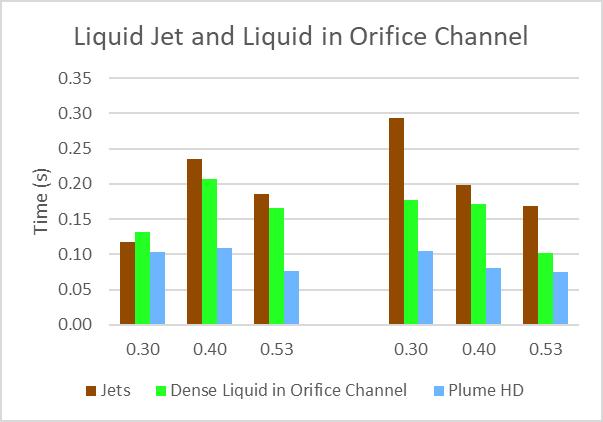
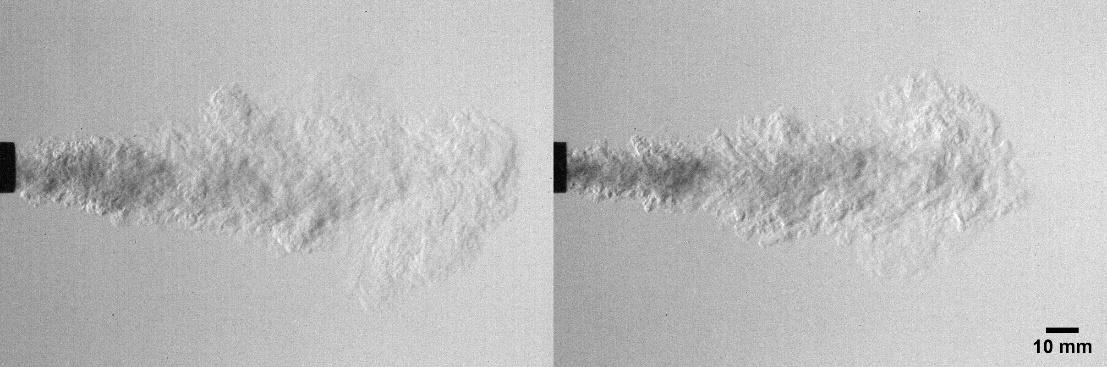
Figure 5 displays still images taken from videos of HFA134a and HFA 152a spray plumes recorded with the Schlieren technique. Kymographs were also generated from such videos of inhaler spray plumes and used to calculate the velocity of the plume leading edge (Figure 6) and the spray cone angles (Figure 7) The spray velocities for both propellants follow similar patterns of decay. At shorter distances from the MP (up to 60 mm) the differences in plume leading edge speeds between propellants in the same actuators do not appear to be significant but may be at distances beyond this with the HFA 134a plumes being marginally slower than those of HFA 152a at longer distances from the mouthpiece. Looking at the differences between plume spray cone angle between propellants in the same actuator do not appear to be significant.
Conclusion
We have observed and present the dynamics of the dosing event internally and the external plume from several commercial pMDI actuator using HFA 152a and HFA 134a placebo-filled canisters. HFA 152a has a 13% lower room temperature saturated vapour pressure and a 35% lower molecular mass than HFA134a and is of interest as a lower GWP alternative for pMDIs HFA 152a is also of lower density than HFA 134a, however, using XPCI we can see that for placebo formulation the boiling/cavitation
Drug Delivery to the Lungs, Volume 32, 2021 - HFA-152a Inhaler Dose Release
Figure 3: Duration of boiling liquid in the actuator sump for both HFA134a and HFA152a in three off-the-shelf actuators
Figure 4: Duration of liquid in the orifice channel, liquid jets from orifice and high density plume for both HFA134a (left) and HFA152a (right) in three commercial actuators
Figure 5: Still images from Schlieren videos of HFA134a inhaler spray plumes (left) and HF152a (right)
Figure 6: plume velocities for HFA 134a and 152a for 3 commercial actuators
Figure 7: plume spray angles for HFA 134a and 152a for 3 commercial actuators
108
HFA134a HFA152a
Drug Delivery to the Lungs, Volume 32, 2021 - Alan P McKiernan et al
behaviour in the sump is similar for both propellants as are the boiling durations so that density may not be the most dominant factor in the behaviour in the sump. We have presented the dynamics of liquid in the orifice and liquid jets at the orifice exit with the jet durations typically slightly longer Both durations last longer than the high-density plume detected via Schlieren imaging. Also studied with Schlieren imaging were the plume leading edge velocities where the HFA152a plumes were seen to travel slightly faster than those of HFA134a which may reflect the lower density, especially as the distance from the actuator mouthpiece increases.
While further investigations will certainly be undertaken by the industry in the coming years to evaluate through-life performance of shot-weight and particle size distribution, component compatibility etc. we have seen that the inhaler dose release dynamics are similar between the two propellants in placebo form.
1 Harish Kumar Jeswani, Adisa Azapagic: Life cycle environmental impacts of inhalers, Journal of Cleaner Production, Volume 237, 2019, 117733
2 Wilkinson AJK, Braggins R, Steinbach I, Smith J : Costs of switching to low global warming potential inhalers. An economic and carbon footprint analysis of NHS prescription data in England. BMJ Open2019
3 Levy M. Inhaler devices and global warming: flawed arguments; BMJ open; 7 November 2019. https://bmjopen.bmj.com/content/inhaler-devices-and-global-warming-flawed-arguments
4 Barzin Gavtash, Andy Cooper, Sarah Dexter, Chris Blatchford & Henk Versteeg: Development of a theoretical model to predict pMDI spray force, using alternative propellant systems, Presented at: DDL2018
5 Ben Myatt, Stephen Stein & Barzin Gavtash: Plume temperatures of current and future low GWP pMDI propellants measured in an anatomical throat geometry , Presented at: DDL2020
6 Ben Myatt, Stephen Stein & Barzin Gavtash: Pressure and temperature measurements of current and future low GWP pMDI propellants in the actuator sump, Presented at: DDL2020
7 Daniel J Duke, Brandon Sforzo, Alan Kastengren, Paul Young & Damon Honnery: X-ray and optical assessment of alternative propellant P-152a in pMDI sprays, Presented at: DDL2019
8 G.S. Settles, Schlieren and shadowgraph techniques: visualizing phenomena in transparent media. Berlin ; New York: Springer, 2001.
9 A. Rack, F. Garcia-Moreno, C. Schmitt, O. Betz, A. Cecilia, A. Ershov, T. Rack, J. Banhart and S. Zabler: On the possibilities of hard X-ray imaging with high spatiotemporal resolution using polychroma tic synchrotron radiation, Journal of X-Ray Science and Technology 18 (2010) 429–441
10 A.P.McKiernan: Inhaler Spray Investigation Using High-Speed Phase-Contrast X-ray and Schlieren Imaging, Pharm Res (2019) 36: 120
109
110
Towards a More Realistic Method for Measuring Nebulized Aerosols: Measurement of Fine Particle Fraction During Simulated Adult Breathing with a Nephele Mixing Inlet and Laser Diffraction with Simultaneous Drug Dose Analysis
Lois Slator1,2, Owen Currie1, Markus Hijlkema1 & Darragh Murnane21Respironics Respiratory Drug Delivery (UK) Ltd, a business of Philips Electronics UK Limited, Chichester, West Sussex, UK
2School of Life and Medical Sciences, University of Hertfordshire, Hatfield, UK
Summary
The pursuit of more clinically relevant in vitro tests for nebulizers and other inhalation devices continues, as the desire to demonstrate bioequivalence using in vitro data and to refine the predictions of in vivo behaviour is still an ambition. Use of laser diffraction to determine particle size with simulated breathing showed only a minimal decrease in fine particle fraction. Simultaneous measurement of particle size by laser diffractometry and delivered dose by HPLC whilst using the Nephele mixing inle t to introduce a standard adult breathing pattern was assessed and compared to the same parameters recorded under continuous flow extraction. A small decrease in fine particle fraction was observed when a breathing profile was introduced, in line with the previous observations. A much larger percentage decrease in the delivered dose was recorded, even with the sampling time corrected for time spent inhaling. This results in a fine particle dose in the range reported by Svensson et al. in 2018. This outcome suggests that the observed decrease is mainly due to a reduction in drug being delivered to the test system and only slightly due to a change in the aerosol particle size distribution.
Key Message
The reduction in fine particle dose observed when using the Nephele mixing inlet compared to the pharmacopeial method is primarily due to a reduction in drug delivered, whilst the fine particle fraction of that drug is only slightly reduced.
Introduction
The pursuit of more clinically relevant in vitro tests for nebulizers and other inhalation devices continues, as the desire to demonstrate bioequivalence using in vitro data and to refine the predictions of in vivo behaviour is still a shared ambition in industry 1
Use of the Nephele mixing inlet to introduce an adult breathing pattern to the droplet size measurement of nebulizers has previously been demonstrated with the cascade impactor where the fine particle dose collected using the Nephele mixing inlet was only 72% of the pharmac opeial method2. Use of the same test setup on the Spraytec laser diffractometer indicated that there was no significant difference in the volume median diameter ( VMD) calculated between the continuous flow method and the simulated breathing pattern method and therefore no significant difference in fine particle fraction 3 This work aimed to investigate further the relative importance of the contributing factors to the difference in fine particle dose observed by Svensson et al.
Method
Five InnoSpire Go mesh nebulizers (Respironics Respiratory Drug Delivery (UK) Ltd, Chichester, UK) with a range of VMD were selected for the tests using a previously described method3.
Each device nebulised salbutamol sulphate solution (5mg/2.5ml) under the following conditions:
Continuous flow
Simulated breathing
Delivered dose was collected on a 200g electrostatic blended synthetic fibre filter at the outlet of the Spraytec inhalation cell with an extraction of 30 L/min for 30s, with simultaneous measurement of particle size by laser diffraction.
Delivered dose was collected on a 200g electrostatic blended synthetic fibre filter at the outlet of the Spraytec inhalation cell with an extraction of 30 L/min and a simulated adult breathing pattern (Vt=500mL, I:E=1:1, f=15bpm) for 60s, with simultaneous measurement of particle size by laser diffraction.
Drug Delivery to the Lungs, Volume 32 , 2021 - Lois Slator et al.
111
Drug Delivery to the Lungs , Volume 32, 2021 - Towards a More Realistic Method for Measuring Nebulized Aerosols: Measurement of Fine Particle Fraction During Simulated Adult Breathing with a Nephele Mixing Inlet and Laser Diffraction with Simultaneous Drug Dose Analysis
The sampling time during the simulated breathing method was doubled to 60 seconds compared with the corresponding duration for the continuous flow method to enable similar amount of drug to be delivered to the sampling area, as aerosol was only collected during the inspiratory phase of the breathing simulation. Average VMD and fine particle fraction < 5 µm for each device with the continuous flow and simulated breathing methods were recorded by laser diffractometry. The mass of drug deposited onto the filter for both methods was analysed and quantified by a validated HPLC method
Results and Discussion
Spraytec-measured VMD increased by more than an order of magnitude in the range of 0.02-0.14 µm from continuous flow to simulated breathing. This increase was consistent with previous observations 3 As the VMD and the fine particle fraction < 5 µm are inversely related, it is not surprising to find that the
Figure 1. Schematic test setups for (A) continuous flow and (B) simulated breathing methodsVMD Fine particle fraction < 5 µm Continuous flow Mean (µm) (SD) Simulated breathing Mean (µm) (SD) Simulated breathing VMD as a % of continuous flow VMD Continuous flow Mean (%) (SD) Simulated breathing Mean (%) (SD) Simulated breathing fine particle fraction as a % of continuous flow fine particle fraction Device 1 (n=3) 4.07 (0.06) 4.21 (0.05) 103.5 63.93 (1.22) 60.69 (0.66) 95.0 Device 2 (n=3) 4.80 (0.01) 4.82 (0.06) 100.5 52.66 (0.19) 52.25 (0.74) 99.2 Device 3 (n=3) 3.90 (0.01) 3.97 (0.07) 103.2 67.29 (0.30) 65.17 (1.82) 96.9 Device 4 (n=3) 3.58 (0.01) 3.66 (0.04) 103.7 73.22 (0.76) 69.99 (1.33) 95.6 Device 5 (n=3) 3.91 (0.03) 4.03 (0.03) 102.7 66.69 (0.49) 63.56 (0.48) 95.3 All devices (n=5) 4.05 (0.02) 4.14 (0.01) 102.15 (1.13) 64.76 (7.57) 62.33 (6.57) 96.39 (1.74)
Table 1. Mean VMD (standard deviation;SD) and fine particle fraction < 5 µm (standard deviation; SD) of InnoSpire Go nebulizers tested under continuous flow and simulated breathing methods.
112
fine particle fraction < 5 µm for simulated breathing decreased to 95.0 -99.2% of that recorded for the continuous flow method, which was significant (p aired t(4)=4.44, p=0.011).
The delivered dose for the simulated breathing method was found to have significantly decreased (paired t(4)=4.80, p=0.009) to 79.9-95.7% of the delivered dose recorded for the continuous flow method. Fine particle dose < 5 µm was estimated by multiplying the fine particle fraction < 5 µm and the delivered dose captured on the filter
Table 2. Mean delivered dose (standard deviation; SD) and mean fine particle dose < 5 µm (standard deviation; SD) of InnoSpire Go nebulizers tested under continuous flow and simulated breathing methods.
There was a significant reduction in the estimated fine particle dose < 5 µm with the simulated breathing method to 78.0–91.2% of that observed with the continuous flow method (paired t(4)= 7.40, p=0.002)
(Table 2) Figure 2 shows the mean percentage reduction in fine particle fraction < 5 µm, delivered dose (µg) and fine particle dose < 5 µm (µg) between the continuous flow method and the simulated breathing method. The outcome indicates that the reduction in amount of drug delivered was the greatest contributing factor to the reduction in fine particle dose < 5 µm, as previously reported 2
Drug Delivery to the Lungs, Volume 32 , 2021 - Lois Slator et al.
Delivered dose Fine particle dose < 5µm Continuous flow Mean (µg) (SD) Simulated breathing Mean (µg) (SD) Simulated breathing delivered dose as a % of continuous flow delivered dose Continuous flow Mean (µg) (SD) Simulated breathing Mean (µg) (SD) Simulated breathing fine particle dose as a % of continuous flow fine particle dose Device 1 (n=3) 528.19 (29.33) 443.18 (54.36) 83.8 337.45 (13.93) 269.08 (34.83) 79.7 Device 2 (n=3) 654.13 (41.10) 523.35 (61.91) 79.9 344.40 (20.64) 273.73 (36.21) 79.4 Device 3 (n=3) 537.44 (44.09) 434.53 (57.91) 80.6 361.60 (29.07) 282.50 (30.07) 78.0 Device 4 (n=3) 470.86 (17.65) 397.30 (19.34) 84.4 344.86 (16.17) 277.96 (10.20) 80.7 Device 5 (n=3) 449.52 (34.71) 423.90 (96.91) 95.7 299.70 (21.33) 269.69 (63.56) 91.2 All devices (n=5) 528.03 (79.72) 444.45 (47.36) 84.89 (6.37) 337.60 (22.98) 274.59 (5.68) 81.79 (5.36)
113
Drug Delivery to the Lungs , Volume 32, 2021 - Towards a More Realistic Method for Measuring Nebulized Aerosols: Measurement of Fine Particle Fraction During Simulated Adult Breathing with a Nephele Mixing Inlet and Laser Diffraction with Simultaneous Drug Dose Analysis
Conclusions
The use of the Nephele mixing inlet to introduce an adult breathing pattern for the assessment of particle size distribution during simulated breathing resulted in only a small change to the aerosol size distribution and the fine particle fraction < 5 µm of the measured drug , but caused a much greater decrease in the amount of drug delivered, and therefore reduced the fine particle dose < 5 µm.
Acknowledgements
Owen Currie was an intern at Respironics Respiratory Drug Delivery (UK) Ltd during conduction of the study, by the time of poster presentation he was affiliated with the faculty of Biological Sciences, University of Leeds, UK. The authors acknowledge Nick Smith and John Denyer (PS5 Consultants Ltd) for editorial assistance.
References
1 Sandell D: Bioequivalence assessment of pharmaceutical aerosol products through IVIVC. Advanced Drug Delivery Reviews. 2021; 176, 113895
2 Svensson M, Berg E, Mitchell J, Sandell D: Laboratory Study Comparing Pharmacopeial Testing of Nebulizers with Evaluation Based on Nephele Mixing Inlet Methodology. AAPS PharmSciTech. 2018;19(2):pp 565 -572.
3 Slator L, Cusick N, Hijlkema M, Murnane D: Towards a more realistic method for measuring nebulized aerosols: Combining a Nephele Mixing Inlet with laser diffraction; J Aerosol Med Pulm Drug Deliv 2020.A-1-A-31
Figure 2. Mean fine particle fraction < 5 µm, mean delivered dose (µg) and mean fine particle dose < 5 µm (µg) for the simulated breathing method ( ) as a percentage of the continuous flow method ( ) (error bars show range of results)114
In Vitro Investigation into Fugitive Aerosol from a Novel 4th Generation Adaptive Aerosol Delivery (AAD) System
Adam P Metcalf, Steven P Cowley & Lucy EA Hardaker
Respironics Respiratory Drug Delivery (UK) Ltd , a business of Philips Electronics UK Limited, Chichester Business Park, City Fields Way, Chichester, PO20 2FT, United Kingdom
Summary
The recent Covid-19 pandemic has drawn attention to the amount of fugitive aerosol that is emitted by nebulizers. The novel I-neb Advance Adaptive Aerosol Delivery (AAD) System incorporates an improved AAD algorithm intended to reduce treatment times compared with earlier AAD devices We conducted an in vitro test to determine the amount of fugitive aerosol that is e mitted from the I-neb Advance (AAD) System. Three production equivalent investigational I-neb Advance nebulizers fitted with non-metering chambers were filled with 1.7 mL of 2 mg/mL salbutamol solution. The delivered dose was collected on a filter during operation into a simulated breathing pattern (Tv=500mL, I:E=1:1, f=15 bpm) . A second filter was fixed 1 cm away from the exhalation port of the nebulizer with an extraction flow of 60 L/min. Each nebulizer was run in triplicate Salbutamol on filters was quantitated by high performance liquid chromatography. The delivered doses had low co-efficients of variation, intra-nebulizer = 0.83 to 3% and inter-nebulizer = 0.77%. The fugitive aerosol was lower than the limit of quantification of the assay (0.18% of fill) in 2/3 of the tests. Measurable exhaled doses were all below 0.3% of the fill volume. The improved AAD algorithm used in the I-neb Advance (AAD) System delivered precise, reproducible doses with minimal fugitive aerosol emissions into a simulated breathing pattern. The minimization of fugitive aerosol emissions demonstrated by AAD nebulizers likely has an added relevance to aerosol treatment following the emergence of the Covid-19 pandemic.
Key Message
The novel I-neb Advance (AAD) System was shown to deliver reproducible doses of drug with minimal (<0.3% of the nominal dose) fugitive aerosol emissions. This observation could be important in clinical situations where there is a need to minimise escaping aerosol from nebuliser devices during use.
Introduction
Adaptive aerosol delivery (AAD) is a nebulization technology designed to deliver reproducible doses of aerosol into patient breathing. The novel I -neb Advance (AAD) System (Figure 1) packages AAD functionality into a user friendly, ergonomic design. Becaus e the AAD algorithm monitors breathing and times the pulses of aerosol for optimal delivery into the patient breathing pattern very little of the solution being nebulized is wasted as aerosol into the local atmosphere An in vivo scintigraphy test of the I-neb (AAD) System, a 3rd generation AAD System, showed that less than 1% of the dose emitted from the nebulizer was exhaled.(1) The recent Covid-19 pandemic has drawn attention to the amount of fugitive
Drug Delivery to the Lungs , Volume 32, 2021 - Adam P Metcalf et al.
Figure 1. The I-neb Advance (AAD) System
115
aerosol that is emitted by nebulizers. (2-5) Constant flow jet nebulizers and constant output mesh nebulizers both continue to generate aerosol during exhalation, which is emitted into the local atmosphere and has been considered a risk for those in the vicinity of the person undergoing treatment.(6,7) We conducted an in vitro test to determine the amount of fugitive aerosol that is emitted from the novel I-neb Advance (AAD) System when run on a typical simulated breathing pattern.
Method

Three production equivalent investigational I-neb Advance (AAD) System nebulizers fitted with nonmetering chambers were washed and dried before use. Each nebulizer was weighed and filled with 1.7 mL of 2 mg/mL salbutamol solution (Breath, Accord Healthcare Limited, Barnstaple, UK) using a pipette. The filled nebulizer was weighed and connected to a filter attached to a breathing simulator (Figure 1), the mouthpiece connection was sealed with Parafilm ( Alcan packaging, Neenah, WI, USA). A second filter was fixed 1 cm away from the exhalation port of the nebulizer and an extraction flow of 60 L/min was applied. The nebulizer and breathing simulator were switched on in turn. The breathing simulator was switched off 5 seconds after the end of the treatment, indicated automatically by the nebulizer. The nebulizer was weighed and the two filters were eluted for quantification of the amount of salbutamol by high performance liquid chromatography. The process was repeated in triplicate for each of the three Ineb Advance (AAD) System nebulizers.
Drug Delivery to the Lungs , Volume 32, 2021 - In Vitro Investigation into Fugitive Aerosol from a Novel 4th Generation Adaptive Aerosol Delivery (AAD) System Figure 1 - Experimental setup116
The delivered doses from the three nebulizers had low intra-nebulizer co-efficients of variation (0.83 to 3%) and a low inter-nebulizer co-efficient of variation (0.77%), and all results were within the dose range specification for AAD nebulizers.
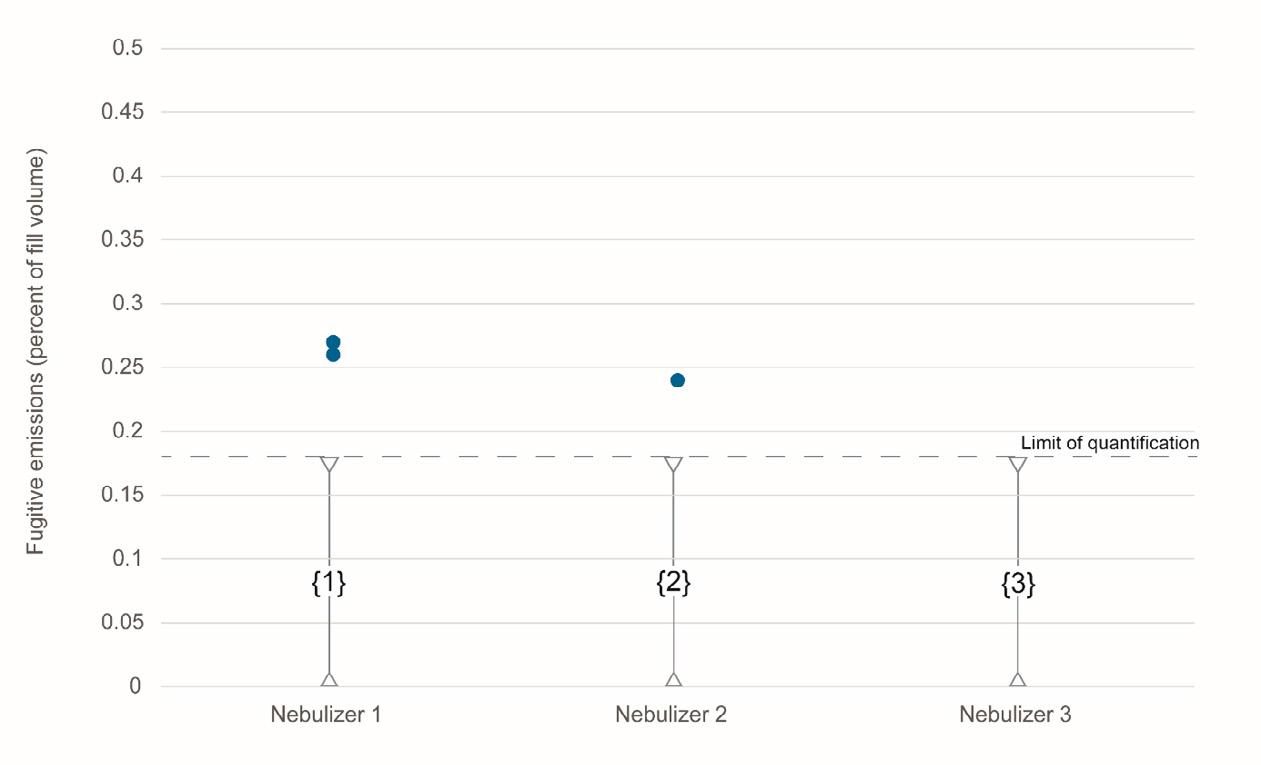
The exhaled fraction of the fill volume was low er than the limit of quantification of the assay in the majority of the tests and all the fugitive emissions were <0.3% of the fill volume.
Drug Delivery to the Lungs , Volume 32, 2021 - Adam P Metcalf et al.
Results
Figure 2 - Delivered dose from three I-neb Advance AAD System nebulizers run in triplicate.
Figure 3 - Fugitive aerosol captured at the exhalation ports of the I -neb Advance AAD System nebulizers as a percentage of fill volume. Numbers in curly brackets { } indicate the number of results that were below the limit of quantification.
117
Discussion
The primary advantage of adaptive aerosol delivery systems has been the ability to deliver precise, reproducible doses of aerosol into different patient breathing patterns The I-neb Advance nebulizer has been developed with an improved AAD algorithm which is intended to facilitate the delivery of precise, reproducible doses in a shorter treatment time compared with the 3rd generation I-neb AAD System The delivered doses from the I-neb Advance nebulizers showed low variability when run into a common simulated breathing pattern , additional testing is required to determine the precision and reproducibility of dosing into a range of simulated breathing patterns Recent publications concerning the Covid-19 pandemic have highlighted the advantage of breath activated mesh nebulizers in the minimization of fugitive aerosol emissions.(4,5) The results of these tests shows that in vitro fugitive emissions from the I-neb Advance nebulizer are extremely low, and suggest that use of the I-neb Advance (AAD) System in vivo would be associated with very low levels of fugitive aerosol productio n, as has been previously demonstrated with the I-neb AAD System.(1)
Conclusions
The delivered doses from the production equivalent investigational I-neb Advance nebulizers showed low variability when tested on a single simulated breathing pattern The improved AAD algorithm used in the 4th generation I-neb Advance (AAD) System can be expected to minimize fugitive aerosol emissions in a similar manner to the minimization observed in vivo with the 3rd generation I-neb (AAD) System. The minimization of fugitive aerosol emissions demonstrated by AAD nebulizers likely has an added relevance to aerosol treatment following the emergence of the Covid-19 pandemic.
Acknowledgements
The authors thank John Denyer and Nick Smith (PS5 Consultants Ltd) for editorial assistance.
References
[1] Nikander K, Prince I, Coughlin S, Warren S, Taylor G Mode of breathing - tidal or slow and deep - through the I-neb Adaptive Aerosol Delivery (AAD) system affects lung deposition of 99mTc -DTPA J Aerosol Med Pulm Drug Deliv 2010;23(Suppl 1):S37-43
[2] Ari A. Practical strategies for a safe and effective delivery of aerosolized medications to patients with COVID19. Respir Med 2020; 167: 105987.
[3] Mac Giolla Eain M, Joyce M, O'Sullivan A, McGrath JA, MacLoughlin R. An in vitro investigation into the release of fugitive medical aerosols into the environment during manual ventilation J Hosp Infect. 2021 Feb;108:135-141.
[4] Cazzola M, Ora J, Bianco A, Rogliani P, Matera MG. Guidance on nebulization during the current COVID -19 pandemic. Respir Med. 2021 Jan;176:106236.
[5] Fink JB, Ehrmann S, Li J, Dailey P, McKiernan P, Darquenne C, Martin AR , Rothen-Rutishauser B, Kuehl PJ, Häussermann S, MacLoughlin R, Smaldone GC, Muellinger B, Corcoran TE, Dhand R. Reducing Aerosol-Related Risk of Transmission in the Era of COVID -19: An Interim Guidance Endorsed by the International Society of Aerosols in Medicine. J Aerosol Med Pulm Drug Deliv. 2020 Dec;33(6):300 -304.
[6] Benge CD, Barwise JA. Aerosolization of COVID-19 and Contamination Risks During Respiratory Treatments. Fed Pract. 2020 Apr;37(4):160-163.
[7] Sethi S, Barjaktarevic IZ, Tashkin DP. The use of nebulized pharmacotherapies during the COVID -19 pandemic Ther Adv Respir Dis. 2020 Jan-Dec;14:1753466620954366.
Drug Delivery to the Lungs , Volume 32, 2021 - In Vitro Investigation into Fugitive Aerosol from a Novel 4th Generation Adaptive Aerosol Delivery (AAD) System
118
Aerodynamic particle size distribution and delivered dose efficiency of a continuous-output mesh nebuliser and a novel breath-actuated device using terbutaline sulphate
Edgar H. Cuevas Brun, Huei-An Tsai, Ciou-Ting Wang, Yuan-Ming Hsu & Ke-Ting ChenHCmed Innovations Co. Ltd., Rm. B, 10F., No.319, Sec.2, Dunhua S. Rd., Taipei City, 10669, Taiwan
Summary
The integration of breath actuation in a mesh nebuliser has introduced new solutions that can achieve higher levels of drug delivery efficiency, while reducing the emission of fugitive aerosols. As several novel treatments involving biologic drugs tend to choose liquid formulations to protect the stability and bioactivity of inhaled drugs post-nebulisation, nebulisers have encountered a growing field for their implementation in the development of combination products. The scope of this study was intended to compare the aerosol performance and delivered dose efficiency of a continuous-output mesh nebuliser and a novel breath-actuated device using terbutaline sulphate nebulising solution . Aerodynamic particle size distribution studies revealed that both devices were capable of delivering appropriate fine particle fractions (continuous output = 50.1±0.9%; breath actuated = 64.7±0.4%), with the breath-actuated device generating a higher percentage. The delivered dose testing using a breathing simulator to mimic an adult breathing pattern showed that the delivery efficiency of the breath-actuated nebuliser was more than twice that of the continuous-output nebuliser, reaching 88% and presenting a much lower residual mass. As aerosol was generated during inhalation only with breath actuation, the treatment time of the breath-actuated nebuliser was longer when loading the same volume of medication in both devices, as it was foreseeable. The novel breath-actuated nebuliser presented in this study was shown to provide a promising performance for its use in drug-device combination products that may require high delivery efficiency, adequate aerosol characterisation for lung deposition, and low residual mass to treat diseases by delivering drugs directly into the respiratory system.
Key Message
The novel breath actuated mesh nebuliser AdheResp ® generated a high delivered dose and good fine particle fraction data compared to a similar continuous -output nebulizer. The data indicate that the AdheResp will be a suitable device for delivering drugs to the lungs
Introduction
Due to the characteristics of several respiratory conditions, the use of nebulisers – medical devices that are able to transform liquid medication into fine aerosol – is preferable over other inhalation delivery systems in some particular cases [1]. This is mostly because nebulisers do not require complex coordination from users to inhale medications or high inspiratory flow to properly deliver medic ines into the lungs [2]. Moreover, in recent years, several innovative approaches involving biologic drugs for inhalation therapy have been developed relying on liquid formulations as the liquid form allows biologics, such as proteins, peptides, and nucleic acids, to better preserve their stability and bioactivity, thus further expanding the demand of nebulisers [3]
Although mesh nebulisers had been shown to enhance aerosol delivery performance when compared to conventional jet nebulisers, the amount of medication that is released in the environment during exhalation has remained an issue, especially when delivering high value drugs [4]. Breath actuation introduces a solution to this issue by allowing generation of aerosol during inhalation only, greatly reducing the emission of fugitive aerosol and the waste of active pharmaceutical ingredients (APIs) during nebulisation [5,6]. This significant advantage is attractive to the development of drug -nebuliser combination products, where higher delivery efficiency of APIs is a baseline requirement for the treatment of respiratory diseases with novel drugs.
This study examined the performance of a mesh nebuli ser that operated under continuous nebulisation and a novel breath-actuated mesh nebuliser, which operated under a tidal breathing profile Terbutaline sulphate, a short acting beta agonist commonly used to treat symptoms of asthma and bronchitis, was used as a model drug to conduct aerosol particle size distribution (APSD) studies and delivered dose testing using a breathing simulator. Considering the mechanism of the breath-actuated device, a mixing
Drug Delivery to the Lungs , Volume 32, 2021 - Edgar H. Cuevas Brun et al.
119
Drug Delivery to the Lungs , Volume 32, 2021 - Aerodynamic particle size distribution and delivered dose efficiency of a continuous-output mesh nebuliser and a novel breath -actuated device using terbutaline sulphate inlet was employed for the APSD testing of this device, which was linked to a breathing simulator to mimic adult tidal breathing [7]
Experimental Method
Two mesh nebulisers, a DeeproTM Vibrating Mesh Nebuliser (Deepro; HCmed Innovations Co. Ltd., Taiwan) (Figure 1a) that operates under continuous output and the novel AdheResp® Smart Breathactuated Mesh Nebuliser (AdheResp; HCmed Innovations Co. Ltd., Taiwan) (Figure 1b) were loaded with 2 mL of terbutaline sulphate respiratory solution (Bricanyl Respules ®; 2.5 mg/mL; AstraZeneca, UK) for each run.
Three replicates were conducted to assess aerodynamic particle size distribution with a Next Generation Pharmaceutical Impactor (NGI; Copley Scientific, UK) pre-cooled to 5-8C in an NGI cooler. Deepro was directly connected to the mouthpiece adapter of the NGI with the NGI vacuum pump operating at 15 L/min; AdheResp, on the other hand, was connected to a mixing inlet (Copley Scientific, UK), which wa s attached to the NGI, operating at 30 L/min, and to a breathing simulator (BRS2100, Copley Scientific, UK) using the adult breathing pattern in accordance with the US Pharmacopoeia (USP) <1601> (volume: 500 mL; frequency: 15 cycles/min; waveform: sinusoidal; Inspiration/Expiration ratio = 1:1 ). The breathing simulator was also linked to a compressor and a water chamber to increase the humidity in the system, operating at 29.0±0.5 L/min to balance the NGI vacuum pump The configuration of the setup for both devices is illustrated in Figure 2. API was collected by washing all the trays of the NGI , throat adapter, and micro-orifice collector (MOC) with 0.9% saline solution , and quantification of API was conducted using a UV -visible spectrophotometer (Lambda 365; Perkin Elmer, US). APSD studies recorded mass median aerodynamic diameter (MMAD), fine particle fraction (FPF; <5 μm in diameter), and geometric standard deviation (GSD).
Copley BRS2100 breathing simulator (Copley Scientific , UK) was used to examine delivered dose, treatment time, and residual mass (gravimetrically) with the two nebulisers in triplicates also in accordance with US Pharmacopoeia (USP) <1601> for the adult breathing pattern. For the delivered dose assessment, the API on the filter membranes in the breathing simulator was extracted with 0.9% saline solution. The amount of terbutaline from the extracts was assessed with UV-visible spectrophotometry at 276 nm wavelength
(a) (b)
Figure 1 - Vibrating mesh nebuliser. (a) Deepro Vibrating Mesh Nebuliser and (b) AdheResp Smart Breath-actuated Mesh Nebuliser
(a)
NGI Cooler at 5-8°C Flow Rate: 15 L/min NGI
120
Vacuum Pump
Deepro
AdheResp Mixing Inlet Controller
NGI Cooler at 5-8°C
Flow Rate: 30 L/min NGI
Vacuum Pump
Breathing Simu lator USP <1601> Adult Pattern Water Chamber
Results
The mean values along with the standard deviation (SD) for the parameters from the APSD study of nebulised terbutaline sulphate with both mesh nebuli sers are presented in Table 1 Information about the operation mode of each device and the use of the mixing inlet during testing is also listed.
Results from the breathing simulation testing are shown in Table 2. Mean values for the delivered dose, treatment time, and residual mass of the tests performed in triplicates are displayed along with the SD. The delivered dose percentage of the loaded dose was observed to double when using the breathactuated nebuliser, while the residual mass in the medication container was close to only one fifth of the residue in the continuous-output nebuliser. The treatment time was 2.7 times higher for the breathactuated device as aerosol was generated during inhalation only.
Discussion
The aerodynamic particle size distribution of the tested mesh nebuli sers exhibited droplets with MMAD values within the respirable range, which are favourable to deep lung deposition. AdheResp generated droplets with smaller mean particle size, leading to a higher percentage of fine particle fraction despite presenting a slightly higher GSD than Deepro Even though the delivery technology embedded in the two mesh nebulisers is similar, both the different orientations of the mesh membrane s and the structures of the medication reservoirs had contributed to the variations in performance among the two devices
The mesh module in AdheResp is placed horizontally, while the orientation of Deepro’s mesh module is vertical. Additionally, the location of the ventholes in these two devices also influence d the airflow with different levels of turbulence It is also important to indicate that differences in the APSD data may have arisen from the different setups of the testing equipment, which were required due to the mechanism of the two devices, continuous output and breath actuation, to collect aerosol in the NGI system.
Drug Delivery to the Lungs , Volume 32, 2021 - Edgar H. Cuevas Brun et al. (b)
Figure 2 – Configuration of setup for APSD studies with (a) Deepro and (b) AdheResp.
Device Mode Mixing Inlet MMAD (μm) FPF (%) GSD Deepro Continuous Output No 4.846±0.07 50.060±0.91 2.130±0.01 AdheResp Breath Actuated Yes 3.470±0.06 64.746±0.36 2.217±0.05
Table 1 - Aerosol Characterisation from APSD study of terbutaline sulphate (n=3; Mean±SD)
Device Delivered Dose (%) Treatment Time (mm:ss) Residual Mass (g) Deepro 42.58±0.83 03:41±0:03 0.232±0.02 AdheResp 88.04±1.47 09:59±0:30 0.049±0.04
Table 2 - Delivered dose, treatment time, and residue of terbutaline sulphate (n=3; Mean±SD)
121
Compressor Flow Rate: 29±0.5 L/min
Drug Delivery to the Lungs , Volume 32, 2021 - Aerodynamic particle size distribution and delivered dose efficiency of a continuous-output mesh nebuliser and a novel breath -actuated device using terbutaline sulphate
When it comes to the breathing simulation testing, the horizontal mesh module of AdheResp played a key role in the low residu al mass post-nebulisation as the medication concentrated above mesh membrane during the entire treatment. The delivered dose of AdheResp was 88%, while Deepro’s delivered dose remained close to 40%. This could be directly attributed to the benefits of breath actuation, which is independent from breathing pattern, in AdheResp, aerosolising medication during inhalation only. Although AdheResp’s treatment time was around 10 minutes in this study for a volume of 2 mL, which is considerably reasonable when comparing to the usual nebulisation time, it was close to 2.7 times longer than the treatment time with Deepro [8]
Conclusion
The aerosol performance of the novel breath-actuated mesh nebuliser, AdheResp, was shown to be similar to the continuous-output nebuliser, Deepro. Moreover, the breath-actuated function highly increased the delivered dose, making AdheResp a suitable device for combina tion in the development of new therapies that require a higher level of delivery efficiency. The actuation of the device under tidal breathing adds extra benefits when considering populations that may struggle to use other delivery devices which require coordination, specific flow rates and breathing patterns. The mechanism of this type of devices may further contribute to inhalation therapy with the development of new treatments where a high delivered dose is required.
References
[1] Dhand R, Dolovich M, Chipps B, Myers T R, Restrepo R, Farrar J R: The role of nebulized therapy in the management of COPD: evidence and recommendations , COPD 2012; 1: pp58-72.
[2] Geller D E: Comparing clinical features of the nebulizer, metered -dose inhaler, and dry powder inhaler, Respir Care 2005; 10: pp1313-1321.
[3] Bodier-Montagutelli E, Mayor A, Vecellio L, Respaud R, Heuzé -Vourc’h N: Designing inhaled protein therapeutics for topical lung delivery: what are the next steps? , Expert Opin. Drug Deliv 2018; 15: pp 729–736.
[4] Galindo-Filho V C, Alcoforado L, Rattes C, Paiva D N, Brandão S C S, Fink J B, Dornelas de Andrade A: A mesh nebulizer is more effective than jet nebulizer to nebulize bronchodilators during non -invasive ventilation of subjects with COPD: A randomized controlled trial with radiolabeled aerosols , Respir Med 2019; 153: pp6067.
[5] Hardaker L E, Hatley R H: In vitro characterization of the I -neb Adaptive Aerosol Delivery (AAD) system, J Aerosol Med Pulm Drug Deliv 2010; 23 (Suppl 1): ppS -11-S-20.
[6] Suggett J, Mitchell J, Schneider H, Ali R, Nagel M: Delivery of dornase alfa via breath -actuated nebulizer: Invitro measures of performance, Eur Respir J 2013; 42 (Suppl 57): pp1186
[7] Svensson M, Berg E, Mitchell J, Sandell D: Laboratory Study Comparing Pharmacopeial Testing of Nebulizers with Evaluation Based on Nephele Mixing Inlet Methodology , AAPS PharmSciTech 2018; 19(2): pp565-572.
[8] Loffert, D T, Ikle, D, Nelson, H S: A comparison of commercial jet nebulizers , Chest 1994; 106(6): pp1788–1792.
122
Is a Pressure Drop ≥10 cm H2O with any Dry Powder Inhaler (DPI) a Reasonable Threshold Above which a Patient Should Receive an Adequate Lung Dose: Method Validation and Experience with a Sample Cohort of COPD Patients?
Mark W Nagel1, Jason A Suggett 1 & Jolyon P Mitchell2
1 Trudell Medical International, 725 Baransway Drive, London, Ontario, N65 5G4, Canada
2 Jolyon Mitchell Inhaler Consulting Services Inc., 1154 St. Anthony Rd., London, Ontario, N6H 2R1, Canada
Summary
It has been claimed that an adequate lung dose should be received above a threshold pressure drop of 10 cm H2O with any DPI, based on the negative pressure generated by the patient's inspiratory effort. We report first the validation of a volumetric flow sensor/recorder simulating adult inhalation in accordance with a standard sinus flow rate-time waveform. We then used this sensor as validated to record flow profiles from 5 patients with varying severity of COPD familiar with the Turbuhaler* DPI, inhaling from a placebo Turbuhaler*, representing a DPI having medium flow resistance. Maximum inspiratory pressures were 19.2, 11.5, 12.7, 33.3 and 50.0 cm H2O for patients A to E. In the laboratory, we recreated each inhalation profile via the breathing simulator -anatomical model oropharynx coupled to the mouthpiece of a Symbicort* Turbuhaler* DPI. The simulator was located distal to a microbial collection filter, positioned at the exit of a model adult oropharynx, to capture medication likely to have deposited at the carina and therefore potentially available for lung delivery. The corresponding mass of budesonide and formoterol components (n = 3 replicates, mean ± SD) recovered from the model mimicking these inspiratory flow rate-time profiles varied widely from 13.6 ± 3.3 to 35.3 ± 1.4 μg budesonide and from 0.7 ± 0.1, to 1.8 ± 0.1 μg formoterol. These findings highlight the value in discussion around what is an ‘adequate’ lung dose and what other factors, in addition to pressure drop, may be involved.
Key Message
This laboratory simulation re-created previously generated inhalation profiles from COPD patients to assess medication delivery from the same medium resistance DPI via a model oropharynx to a collection filter with highly variable outcomes that were related to inhalation duration and maximal inspiratory pressure.
Introduction
DPIs have a wide range of inhalation flow resistance [1], and it is therefore important to understand how the patient inhalation profile might influence the efficiency of medication delivery [2]. To this end, Clark et al. have claimed, based on the negative pressure generated by the patient's inspiratory effort, a pressure drop ∼≥10 cm H2O with any DPI is a threshold above which an adequate lung dose should be received [3] The present study was undertaken in two parts with the following purposes: (a) to validate a model aerosol collection filter-adult oropharyngeal model-breathing simulator system against a standardized inhalation flow profile generated by the in-house breathing simulator; (b) to use that system to assess DPI-delivered medication delivery from inhalation profiles captured from a small cohort of COPD patients selected at random. The goal was to ascertain if the inhalation profile, in particular the maximal inspiratory pressure (MIP), influenced medication delivery efficiency by collecting the aerosol on the filter, representing the portion of the inhaled dose capable of reaching the carina and therefore potentially available for delivery to the lungs.
Experimental Methods
In the first part of the study, we validated the response from a passive flow differential pressure converter based pneumotachometer sensor (SpiroQuant H, Honeywell-Envitec, Wismar, Germany) capable of simultaneously measuring the volumetric flow-elapsed time profile and peak inspiratory pressure, in conjunction with a breath recorder (Hans Rudolph SmartLab* series 1140, Shawnee, KS, USA) sampling at 200 Hz, by coupling it to our previously calibrated in-house breathing simulator (ASL5000, Ingmar Medical, Pittsburgh, PA). The breath simulator was set to recreate the Canadian Standard adult breathing profile having a nominal tidal volume of 500 ml, inspiratory/expiratory (I:E)
Drug Delivery to the Lungs, Volume 32, 2021 - Mark W Nagel et al.
123
Drug Delivery to the Lungs, Volume 32, 2021 - Is a Pressure Drop ≥10 cm H2O with any Dry Powder Inhaler (DPI) a Reasonable Threshold Above which a Patient Should Receive an Adequate Lung Dose: Method Validation and Experience with a Sample Cohort of COPD Patients
ratio of 0.50, with a rate of 12 breaths/min [4] The sensor was oriented in the flow path as described by its manufacturer.
In the second part of the investigation, a small cohort of volunteer male patients (n = 5, designated A to E) with varying COPD severity (aged 57-83), and who were familiar with the Turbuhaler* DPI, were recruited to inhale from a placebo version of the medium flow resistance Turbuhaler* DPI (AstraZeneca Mölndal, Sweden (Figure 1A)) Each inhalation profile was recorded using the purposeconstructed attachment to the pneumotachometer evaluated in the first part of the study In the laboratory, each inhalation flow profile was subsequently replayed via the breathing simulator (n = 5 replicates). In this configuration, the mouthpiece of a Symbicort* Turbuhaler* DPI containing active formulation (100 μg budesonide (BUD) + 6 μg formoterol fumarate (FF) per actuation)) was attached to a model adult oropharynx [5] . A bacterial/viral filter was located at the distal end of the model and then to the breathing simulator (Figure 1B) to capture the portion of the dose penetrating to the carina and therefore potentially capable of lung delivery. The mass of each API recovered from the filter was subsequently assayed by an HPLC-spectrophotometric method.
Results
The pneumotachometer validation data are summarized in Table 1:
The tidal volume reported by the flow sensor/recorder was almost identical with the standard value, with the value provided by the breathing simulator being only 1.2% higher. The I:E ratios determined by either method were slightly greater than the nominal value of 0.50, and the breathing rates were correspondingly longer. However, the divergence between the measures from the two techniques were only 5.6% and 1.0% for I:E ratio and breathing rate respectively. The flow sensor/recorder was therefore deemed suitable for obtaining the patient-generated inhalation profiles
The COPD patient-generated flow rate-time profiles together with the corresponding maximum inspiratory pressure (MIP) values, are shown in Figure 2.
Figure 1: (A): Set-up for Acquiring Patient Inhalation Waveforms; (B) Arrangement for Assessing Medication Delivery via the Adult Oropharynx Model to a Bacterial/Viral Filter Located to Mimic Particle Penetration to the Carina Table 1: Inhalation Flow Waveform Characteristics from SpiroQuant* H flow sensor with Hans Rudolph Breath Recorder Responding to the Canadian Standard Normal Adult Profile compared with Metrics Reported by the ASL5000 Breathing SimulatorCanadian
Profile Mean
Spiroquant*
Sensor/Hans
Recorder Mean Values Reported by ASL 5000 Breath Simulator Tidal Volume (ml) 500 500.5 506.4 I:E ratio 0.50 0.56 0.53 Breathing Cycles/min 12 13.0 12.9 124
Metric
Standard Reference
Values Reported by
Q Flow
Rudolph
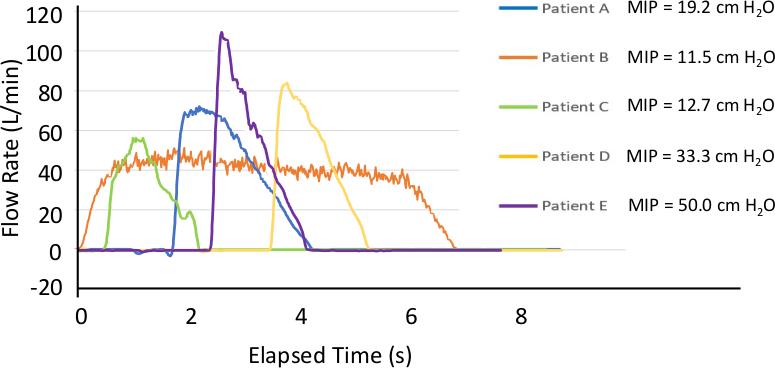
The variation in start times for the various inhalation profiles is shown explicitly rather than normalizing the data to begin at 0 s elapsed time to show the differing amount of delay from patient to patient. The inhalation flow rate-time profiles varied greatly from one patient to another in terms of both amplitude and duration, with an associated variability in MIP values ranging from a minimum value of 11.5 cm H2O (patient B) to a maximum of 50.0 cm H2O (patient E). Peak inspiratory flow rates exceeded 30 L/min for all patients, a threshold reported by Broeders et al [6] as being sufficient for the Turbuhaler* DPI to provide a therapeutic dose, although these authors also observed that a flow rate > 60 L/min would be required for optimum medication delivery to the lungs.
The mass of budesonide and formoterol components of Symbicort* collected on the filter distal to the model oropharyngeal airway (mean ± S.D.) are presented in Figure 3. The upper airway deposition (within the model airway) was recorded, with similar variability to the mass of each API recovered from the filter.
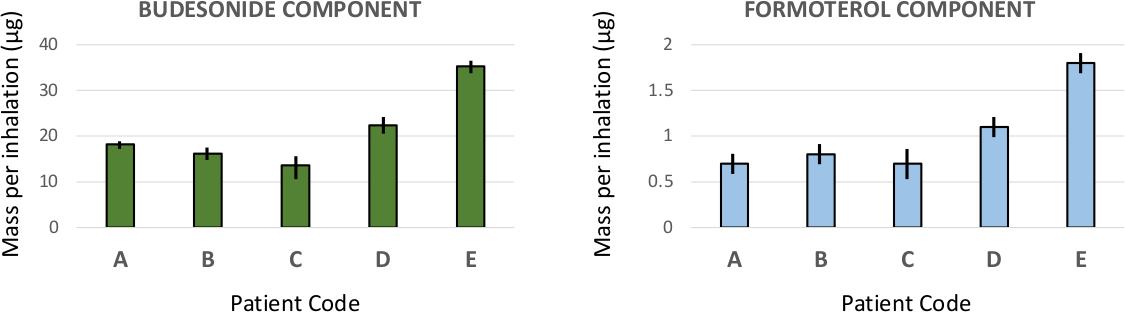
by the Pneumotachometer
Drug Delivery to the Lungs, Volume 32, 2021 - Mark W Nagel et al.
Figure 2: Flow Rate-Elapsed Time Profiles Recorded from the Signal Generated by a Validated Spiroquant H sensor by Patients Having Differing Degrees of COPD Inhaling from a Placebo TurbuHaler*
125
Figure 3. Mass of Each Component from a Symbicort* Turbuhaler* DPI Deposited on Filter Distal to the Adult Model Oropharyngeal Airway Obtained using a Breathing Simulator to recreate the COPD Patient A to E Breathing Patterns Recorded
Drug Delivery to the Lungs, Volume 32, 2021 - Is a Pressure Drop ≥10 cm H2O with any Dry Powder Inhaler (DPI) a Reasonable Threshold Above which a Patient Should Receive an Adequate Lung Dose: Method Validation and Experience with a Sample Cohort of COPD Patients
The replicate measures per patient-generated inhalation profile for each component were generally consistent, with coefficients of variation <10%, except for the data from patient C where the two coefficients of variation close to 25% without an assignable cause. More importantly, the mass of either component varied widely from one inhalation profile to another, with the largest values (35.3 ± 1.4 μg budesonide; 1.8 ± 0.1 μg formoterol) associated with patient E, who generated the highest MIP (50.0 cm H2O) and inhaled for the shortest duration (1.8 s). Conversely, the next to smallest masses of each component (16.2 ± 1.5 μg budesonide; 0.8 ± 0.1 μg formoterol) were recovered when the inhalation profile generated by patient B, who had the lowest MIP (11.5 cm H2O), inhaling for the longest duration (6.8 s).
Discussion
The large variability in the inhalation profiles was expected, as it has previously been observed in at least one carefully designed observational study that such variability exists with COPD patients when instructed to inhale through their usual device without training to achieve a target maneuver [7] . An obvious limitation of the present investigation is the small patient cohort size. Plans were made to increase the number of volunteer patients in the cohort, before the COVID -19 pandemic restrictions curtained such activity. A further limitation is that only a single profile was obtained per patient rather than the best of several attempts. In defence of this approach, the intention was not to train the patients, but to observe how they were normally using the inhaler. Once these restrictions have been lifted, further efforts will be made to expand patient numbers as well as to extend the investigation t o examine how the trends observed presently apply with lower and higher resistance DPIs. However, the present findings as they stand, indicate that setting a MIP threshold of just 10 cm H2O to receive an adequate lung dose, as proposed by Clark et al. [1] may be an insufficient criterion. There is therefore likely to be potential value in having further discussion about these questions:
a) what is an adequate dose?
b) what other factors, in addition to MIP, may be important in achieving that target?
Conclusions
This in vivo-in vitro investigation with a medium resistance DPI indicated large differences in breathing profiles and consequently large differences in observed drug delivery. It has therefore highlighted a potential mismatch between a proposed lower limit of 10 cm H2O for MIP and likely medication delivery efficacy to the lungs of
patients with COPD. Notwithstanding the limitation of a small cohort of patient profiles, we believe there is merit in further discussions around what is an ‘adequate’ lung dose and what other fact ors, in addition to pressure drop, may be involved
References
[1] Krüger P, Ehrlein B, Zier M, Greguletz R: Inspiratory flow resistance of marketed dry powder inhalers (DPI). Eur Respir J 2014; 44: article 4635.
[2] Laube B, Janssens H, de Jongh F: What the pulmonary specialist should know about the new inhalation therapies. Eur Respir J 2011; 37(6): pp 1308–1331.
[3] Clark AR, Weers JG, Dhand R: The Confusing World of Dry Powder Inhalers: It Is All About Inspiratory Pressures, Not Inspiratory Flow Rates. J Aerosol Med Pulmon Deliv 2020; 33(1): pp 1-11.
[4] Canadian Standards Association: Spacers and holding chambers for use with metered -dose inhalers. Mississauga, ON, Canada. CAN/CSA/Z264.1-02: 2002, revised 2008.
[5] Nagel MW, Suggett JA, Coppolo DP, Mitchell JP: Development and evaluation of a family of human face and upper airway models for the laboratory testing of orally inhaled products. AAPS PharmSc iTech 2017: 18(8): pp 3182-3197
[6] Broeders MEAC, Molema J, Hop WCJ, Folgering HCT: Inhalation profiles in asthmatics and COPD patients: reproducibility and effect of instruction. J Aerosol Med 2003; 16(2): pp 131-141.
[7] Azouz W, Chetcuti P, Hosker HSR, Saralaya D, Stephenson D, Chrystyn H: The inhalation characteristics of patients when they use different dry powder inhalers. J Aerosol Med Pulmon Deliv 2015; 28(1): pp 35-42.
126
Effect of an inhalation chamber without inspiratory valve and facemask for neonates use on drug delivery.
MyriamEckes
and Brenda Hervieu, Lina Fontaine & Thierry PoréeOptimHal-ProtecSom, 24 rue du Train Renard, 50700 Valognes, France.
Summary
The aim of this study was to evaluate in vitro aerosol delivery from a pressurized metered dose inhaler (pMDI) and inhalation chamber without inspiratory valve for neonatal patients compared with classic valved holding chambers (VHCs) The effect of mask holding duration to the model face on drug delivery was also investigated and measurements were performed with different numbers of breathing cycles after each pMDI dose release. Emitted drug mass was measured using a breathing simulator and aerodynamic particle size distribution (APSD) was determined with an in Vitro in Vivo Correlation (IVIVC) model from data collected with a cascade impactor at a constant flow of 15L/min. For both sets of measurements, the tidal breathing pattern of a neonatal patient was recreated by a breathing simulator Inhalation chambers with facemask s were applied on an infant face model with a 0.8 kg force. Salbutamol sulfate, fluticasone propionate and beclomethasone dipropionate, were administered in separate experiments through the inhalation chambers. The aerosol dose delivered with the inhalation chamber without inspiratory valve was observed to be about 50% higher than the aerosol dose delivered with the classic valved holding chamber. The delivered drug dose increased with the number of breathing cycles after each pMDI dose release up to 14 cycles, corresponding to 16.2 seconds mask holding duration. Using an inhalation ch amber without inspiratory valve increase d the delivered drug dose and the facemask holding duration after each pMDI actuation has an impact on drug delivery.
Key Message
Removing the inspiratory valve of an inhalation chamber increases both in vitro delivered drug with a pMDI and fine particle dose (< 5 µm aerodynamic diameter) deposited to a filter distal to a neonatal model.
Introduction
Neonates have very low tidal volume, approximately 25mL, which is much smaller than the dead space of commercialized valved holding chambers with facemasks, between 43mL and 150mL [1]. This relationship could explain the inefficiency of inhaled treatments and the very low inhaled drug dose deposited reported for neonates when using a pMDI with a valved holding chamber [2] One way to eliminate the dead space is to remove the inspiratory valve. A previous clinical study already suggested that using a spacer without inspiratory valve was more efficient to treat infants [3]
Another factor that could affect drug delivery w hen using pMDI and inhalation chambers for neonates is the cooperation of the patient. A decrease of drug deliver ed to the lungs was reported in crying children compared to quiet children [4]. Applying a mask on a baby’s face during few seconds could result in the baby’s stress and crying and reduce drug deposition to the lungs
The aim of this study was to evaluate the in vitro performance of an inhalation chamber without inspiratory valve to be used with a neonatal model and compared to the in vitro performance of a classic valved holding chamber with different drugs used to treat neonates
The effect of the number of breathing cycles after each pMDI dose release was also evaluated to determine how long it might be necessary to apply the inhalation mask on the baby ’s face after drug administration.
Materials and Methods
1) Emitted mass
A breathing simulator (BRS2000, Copley Scientific Ltd) was used to create the breathing pattern of neonates. In separate tests (n = 3 replicates), the pMDI was actuated (a) during the inspiration phase and (b) during the expiration phase to reflect coordinated and uncoordinated use respectively. A hydrophobic filter (Copley Scientific Ltd) was placed between an infant face model (Copley Scientific) and the breathing simulator to collect the drug that would likely be inhaled by a neonate
Drug Delivery to the Lungs , Volume 32, 2021 – Myriam Eckes et al.
127
Drug Delivery to the Lungs , Volume 32, 2021 - Effect of an inhalation chamber without inspiratory valve and facemask for neonates use on drug delivery
(Figure 1). In each test, the facemask was applied to the face model with a 0.8 kg force. The first set of measurements was performed with the breathing simulator operating continuously between the actuations of the pMDI of salbutamol (Ventoline®, 100µg/dose, GSK) Subsequently, in separate tests the number of cycles studie d between two actuations of beclomethasone dipropionate (QVAR Spray, 100 µg/dose, Teva) and between the last actuation and stopping the breathing simulator (holding duration in parentheses) were increased from 2 (2.6 seconds), to 4 (5.2 seconds), 6 (7.7 seconds), 8 (10.3 seconds), 10 (12.8 seconds), 14 ( 16.2 seconds) and 40 (51.2 seconds). In total, five salbutamol and five beclomethasone dipropionate doses were actuated into the inhalation chambers with 1 minute interval between individual actuations in order to have a sufficient amount of medication on the filter permitting an UV quantification.


2) Aerodynamic Particle size distribution (APSD)

APSD was measured during simulated tidal breathing using the experimental set -up (n = 3 replicate measurements) shown in Figure 2. A USP induction port (Copley Scientific Ltd.) was connected to the breathing simulator. A Next Generation cascade Impactor (NGI, Copley Scientific Ltd.) sampled the emitted aerosol by means of a T piece (mixing Inlet, Copley Scientific Ltd.). A constant flow rate of 15L/min through the NGI cascade Impactor was bala nced with a pressurized dried air source of 15 L/min (with a relative humidity less than 10%) resulting in simulated tidal breathing through the VHC and constant air flow through the NGI. The inhalation chambers with facemask were again applied to an infan t’s face model (Copley Scientific) with a 0.8 kg force. Measurements were performed with the breathing simulator running continuously between the actuations of the pMDI. In total, ten actuations of fluticasone (Flixotide ®, 125 µg/dose, GSK) were actuated during the expiratory phase with a 1 minute interval between individual actuations. The distribution of fluticasone through the different stages of the NGI was used to determine the APSD, the total mass of fluticasone recovered within the impactor (Impactor Mass, IM), the Fine Particle Dose (<5 µm, FPD5µm) and the particle Mass Median Aerodynamic Diameter (MMAD).


simulator Filter Force 0
kg Infant’s face model Inhalation chamber pMDI pMDI NGI Cascade impactor 15 L/min USP trachea VHC 15 L/min
face model Breathing simulator 128
Figure 2 - Schematic drawing of the IVIVC bench model for APSD determination
Breathing
8
Infant’s
The drug deposited in all the components of the bench model was measured to evaluate the relative drug deposition on the filter compared to the total mass emitted from the inhaler. Deposited mass was quantified by UV spectrophotometry (Multiskan GO, ThermoFisher) . Breathing parameters used were the representative tidal breathing pattern of a neonatal patient [5]: (tidal volume 24.7mL, frequency 52min1, inspiratory time/total time 0.47). Measurements were performed with the inhalation chamber
TipsHaler® (Laboratoire OptimHal-ProtecSom) without inspiratory valve compared to the classic version of TipsHaler® Results were expressed as percentage of the total mass recovered on the filter
Results are expressed as means ± standard deviations. Statistical analyses were performed with RStudio (software version 1.2.5001). For each component, the percentage of drug deposited with the inhalation chamber without inspiratory valve was compared to that obtained with the VHC. A Shapiro test was performed to determine the normality of the sample distribution. Variables normally distributed were subjected to a Student’s t-test, and a Wilcoxon-Mann-Whitney test was applied for data not normally distributed. Two levels of significance were used: p < 0.05 *, p < 0.01 ** .
Results and Discussion
1) Effect of removing the inspiratory valve on in vitro drug delivery
synchronized with inspiration non-synchronized with inspiration
without inspiratory valve with inspiratory valve
The low values of drug dose deposited on the filter with the valved holding chamber (3-4 % of the nominal dose) is consistent with drug deposition reported in previous studies to treat neonatal and infants patients [2][6]
The deposited drug mass when using TipsHaler® without inspiratory valve was significantly higher than when using the classic version of TipsHaler ® independently of the synchronization or not of the actuations with the inspiratory phase
Drug Delivery to the Lungs , Volume 32, 2021 – Myriam Eckes et al.
Figure 3 presents the percentage of the total mass of salbutamol deposited on the filter with TipsHaler ® and TipsHaler® without inspiratory valve.
Figure 3 - Drug mass deposited on the filter when using TipsHaler® and TipsHaler® without inspiratory valve.
0 2 4 6 8 10
Figure 4 shows the values of impactor total mass and fine particle total mass of fluticasone propionate obtained with the APSD measurements when using TipsHaler ® without inspiratory valve and when using the classic valved holding chamber Table 1 shows the MMAD obtained with the two inhalation chambers.
of the total mass of salbutamol (%)
** ** 129
Percent
The total mass of fluticasone collected in the NGI with the valved holding chamber is very low. This may be due to the dead volume, which includes the volume of the valved holding chamber, mask and USP throat. This dead volume is larger than the tidal volume, which should prevent drug from depositing in the impactor. It is supposed that the drug could deposit in the NGI due to the breathing pattern and the number of breathing cycles. Indeed, the inhalation profile has a higher amplitude than the exhalation profile, which could allow some drug particles to not be expelled and to en ter the impactor during the next inhalation phase.
Both impactor mass and fine particle mass were significantly higher when using TipsHaler ® without inspiratory valve in comparison with the classic version of TipsHaler ®. MMADs were not statistically different when using TipsHaler® with or without the inspiratory valve.
2) Effect of mask holding duration on in vitro drug delivery
Figure 5 presents delivery of beclomethasone dipropionate obtained as a function of the number of breathing cycles after each pMDI dose release with the inhalation chamber without inspiratory valve.
Drug Delivery to the Lungs , Volume 32, 2021 - Effect of an inhalation chamber without inspiratory valve and facemask for neonates use on drug delivery
Figure 4 – Total drug mass deposited on the impactor and fine particle dose (lower than 5µm) with TipsHaler® without inspiratory valve and TipsHaler®
without inspiratory valve with inspiratory valve MMAD (µm) 2.32 ± 0.28 2.40 ± 0.21
Table 1 – MMAD obtained with TipsHaler® without inspiratory valve in comparison with TipsHaler® with its inspiratory valve
0 10 20 30 40 50 60 70 Impactor FPD5µm Total mass of fluticasone (µg)
* * 130
without inspiratory valve with inspiratory valve
The delivered mass of beclomethasone dipropionate increased with the number of breathing cycles up to 14 cycles corresponding to 16.2 seconds holding duration. However, the mass deposited after 2 cycles was higher than 50% of the maximum dose deposited.
These in vitro results were obtained in ideal conditions. In the clinical situation, it could be interesting to consider the benefits of using a protocol involving administration of two drugs doses instead of one and applying the facemask for only 2.6 seconds twice instead of once for a16.2 second holding duration to avoid and reduce stress and crying of the baby.
Conclusions
These in vitro data offer new perspectives on how to treat neonates. The results obtained showed that drug deposition for neonates seemed to be affected by the dead spa ce volume. Indeed, the inhalation chamber without inspiratory valve w as associated with more drug mass-per-actuation deposited together with a higher fine particle mass. Pneumatic nebulizers are also associated with low drug dose deposited for neonates but are very constraining [7] Using a holding chamber without dead space volume with a pMDI could thus be an alternative to the use of a pneumatic nebulizer.
The effect of holding time of the facemask on the face model after a inhaler actuation on in vitro drug delivery was evaluated with a valved holding chamber (data not plotted) and with a device without inspiratory valve. The findings obtained raise a question: What is more beneficial for clinicians and patients, using two pMDI doses and holding the mask for 2.6 seconds twice or using one pMDI dose and holding the mask on the baby’s face for a longer time (16.2 seconds), with the risk of reducing the drug dose deposited because of the baby’s crying?
Drug Delivery to the Lungs , Volume 32, 2021 – Myriam Eckes et al.
Figure 5 - Drug mass deposited on the filter using TipsHaler® without inspiratory valve as a function of the number of breathing cycles after pMDI actuation for different facemask holding durations
0 2 4 6 8 10 12 14 2 cycles 2.6 seconds 6 cycles 7.7 seconds 10 cycles 12.8 seconds 14 cycles 16.2 seconds 40 cycles 51.2 seconds Percentage of the beclomethasone nominal dose (%) Number of respiratory cycles Facemask holding duration * ns ns * 131
Drug Delivery to the Lungs , Volume 32, 2021 - Effect of an inhalation chamber without inspiratory valve and facemask for neonates use on drug delivery
References
[1] Shah SA, Berlinski AB, Rubin BK. Force-dependent static dead space of face masks used with holding chambers . Respir. Care. 2006 Feb;51(2):140-144.
[2] Fok TF, Shelley M, Dolovich M, Gray S, Coates G, Paes B, Rashid F, Newhouse M, Kirplani H: Efficiency of Aerosol Medication delivery from a metered dose inhaler versus jet nebulizer in infants with Bronchopulmonary Dysplasia . Paediatr. Pulmonol. 1996 May;21(5):301-309
[3] Fok TF, Lam K, Chan CK, Cheung P, Zhuang H, Wong W, Cheung KL: Aerosol delivery to Non-Ventilated Infants by Metered Dose Inhaler: Should a Valved Spacer Be Used? Paediatr Pulmonol. 1997 Sep; 24(3):204-212.
[4] Murakami G, Igarashi T, Adachi Y, Matsuno M, Adachi Y, Yoshizumi A, OkadaT: Measurement of bronchial hyperreactivity in infants and preschool children using a new method. Ann Allergy. 1990 Apr; 64(4):383-387.
[5] Matthews IL, Kaldestad RH, Bjørnstad PG, Thaulow E, Grønn M: Differing lung function development in infants with univentricular hearts compared with healthy infants. Acta Pediatr. 2008 Dec;97(12):1645-1652.
[6] Salmon B, Wilson NM, Silverman M: How much aerosol reaches the lungs of wheezy infanst and toddlers? Arch Dis Child. 1990; 65(4) :401-403.
[7] Khalaf MN, Hurley JF, Bhandari V: A prospective controlled trial of albuterol aerosol delivered via metered dose inhalerspacer device (MDI) versus jet nebulizer in ventilated preterm neonates. Am J Perinatol. 2001 May; 18(3):169-174.
132
Machine Learning approach to predict the formation co -amorphous systems for inhalation therapy
Sarah Zellnitz1, Elisabeth Fink1 & Amrit Paudel1,21Research Center Pharmaceutical Engineering , Inffeldgasse 13, Graz, 8010, Austria
2 Institute for Process and Particle Engineering, Graz University of Technology , Inffeldgasse 13, Graz, 8010, Austria
Summary
The treatment of chronically obstructive pulmonary disease (COPD) , asthma and tuberculosis requires a multidrug therapy applying different active pharmaceutical ingredients ( APIs). In order to reduce the drug dose variability while administering the combination products to patients , the generation of codelivery systems like co-amorphous systems (COAMS) is suggested. Co-amorphous systems have recently gained considerable interest in the pharmaceutical field for tackling poor solubility of drugs In order to facilitate and enhance the screening for COAMS for inhalation therapy , a machine learning (ML) approach is presented herein to predict the formation of potential COAMS. A training dataset of 254 systems was built based on available literature data on COAMS and non-COAMS. Based on the training dataset, a predictive ML model was built with a predictability of 80% The resulting ML model was validated with 21 rows of validation data (not included in the training dataset), which resulted in a predictability of 76% This model was then used to predict the formation of COAMS in API -API combinations of 37 common APIs used in the treatment of the aforementioned lung disease. The predicted class of these 666 possible API-API combinations was analysed and put in correlation with the original dataset. Positive predictions were weighted by their distance, with predicted co-amorphous API-API combinations further from the training data considered with more uncertainty. This provided a rating amongst all predicted COAMS from which the top 100 systems were taken into consideration. Taking conventional medication regimen into account, the number of promising combinations was further reduced. Promising predicted combinations for COAMS will be selected and tested experimentally in order to validate the prediction.
Key Message
Based on molecular descriptors of a training dataset a predictive machine learning (ML) model was established (predictability 80%) and validated with 21 additional rows of data (predictability 76%) This model could succesfully be used to predict the formation of promising co -amorphous API-API combinations to be used in the treatment of lung disease.
Introduction
Most of the marketed inhalation products target local lung diseases such as chronically obstructive pulmonary disease (COPD) and asthma. Another emerging area for pulmonary drug delivery is the treatment of tuberculosis In both cases, a multidrug therapy applying different active pharmaceutical ingredients (APIs) is necessary, by now depending on the application of multiple different commercial products. Therefore, this work aims at rationally establishing different API -API co-particle formulation systems intended for better therapeutic outcomes of asthma/COPD or tuberculosis patients. The centre of interest here is the reduction of dose variability, thereby enhancing patient compliance and reducing the number of different medications, as well as leaner and more economic manufacturing of the same. Amorphous drugs have gained more and more interest due to their favourable properties like higher solubility, faster dissolution rates and potentially higher bioavailability compared to their crystalline counterparts. However, one disadvantage of amorphous forms is their thermodynamic instability. Here, co-amorphous systems (COAMS) have been described as a promising solution to overcome this drawback and stabilise the amorphous form. Consequently, our goal is to manufacture co -amorphous systems composed of 2 APIs intended for the therapy of asthma/COPD and tuberculosis
In this abstract, we present a machine learning (ML) approach to predict the successful formation of coamorphous systems in order to facilitate the co-amorphous pair (and their ratio) select ion during the screening phase. So far, described models for co-amorphous system formations are limited and focus on a controlled set of compounds , for example a few selected APIs and amino acids as co-former [1,2]
Drug Delivery to the Lungs , Volume 32, 2021 – Sarah Zellnitz et al.
133
Drug Delivery to the Lungs ,
Volume 32, 2021
- Machine Learning approach to predict the formation coamorphous systems for inhalation therapy
Our focus is to expand such models to predict the formation of co-amorphous systems composed of two different APIs used in the treatment of lung disease The experimental screening of all potential APIs available for asthma/COPD and tuberculosis treatment would be time consuming and expensive. A suitable ML model could facilitate and shorten the screening phase and safe time and cost.
Material and Methods
As prerequisite for the ML model, an extensive literature research was carried out and an excel database generated listing pharmaceutical co-amorphous systems described in literature and systems that were tested for co-amorphisation, but did not form a co-amorphous system (training dataset) Besides the two compounds, the molar ratio and the preparation technique divided in either thermodynamic (0) or kinetic (1) pathway [3] were added. According to the review from Liu et al., co-amorphous systems of an API exist either with (1) another API, (2) amino acids, (3) organic acids or (4) other substances [4]. Compared to previous modelling approaches, our database encompasses COAMS from all four classes The total database encompasses 254 systems, 188 co-amorphous systems and 66 non-co-amorphous systems These systems include 87 individual compounds, 47 APIs and 40 co -formers.
In a next step, the CANONICAL smiles of all compounds from the training dataset were collected from PubChem® (National Library of Medicine) and with the Python package MORDRED (moleculardescriptor calculation software program [5]) over 1800 available molecular descriptors were calculated. The number of calculated descriptors exceeds the number of training data by a multiple. Consequently, the number of molecular descriptors was reduced to 30 based on COAMS basics, literature and own understanding. The selected descriptors are listed in Table 1. Reducing the number of descriptors was necessary because if the total number of available descriptors from MORDRED exceeds the number of test cases by a multiple, the parameters of the ML model cannot be trained sufficiently.
ABC atom bond connectivity index Diameter topological diameter RNCS relative negative charge surface area
nAcid acidic group count TopoShapeIndex topological shape index RPCS relative positive charge surface area
nBase basic group count nRot rotatable bonds count TASA total hydrophobic surface area
nAromAtom aromatic atoms count SLogP Wildman-Crippen log P TPSA total polar surface area
nAromBond aromatic bond count TopoPSA topological polar surface area RASA relative hydrophobic surface area
nAtom number of all atoms GGI1 1-ordered raw topological charge RPSA relative polar surface area
nHeavyAtom number of heavy atoms apol atomic polarisability fMF molecular framework ratio
nHetero number of hetero atoms bpol bond polarisability Vabc ABC van der Waals volume
nH number of H atoms nHBAcc number of hydrogen bond acceptor VAdjMat vertex adjacency information
MW molecular weight nHBDon number of hydrogen bond donors naRing aromatic ring count
For each substance pair (COAMS or non-COAMS), the difference of molecular descriptors was calculated except for descriptors related to hydrogen bonds and acid/base nature, as here the relation of donors and acceptors or acid to base from the 2 substances is relevant. Here, parameters were calculated based on Chambers et al. [1].
These molecular descriptors were combined with the dataset obtained from the literature review. As target value for the prediction, a binary classification into not co -amorphous (0) and co-amorphous (1) was used. The models from a 50-fold cross validation on random 85%/15% splits for training and validation data were then averaged. This setup was repeated for several ML models such as gradient boosting, random forest, and KNN (K-nearest neighbour). For each ML technique, hyperparameter tuning was done via a grid search. The prediction of the best performing model is then the average of all 50 individual models, where each of them predicts 0 or 1 for COAMS or non-COAMS, respectively.
Table 1 - Selected molecular descriptors for ML predictive model134
In order to validate the ML mode l, a validation literature dataset was generated with COAMS and nonCOAMS that were not included in the training dataset (different and more recent publications). The training dataset consisted of 21 new systems, 13 positive (COAMS) and 8 negative (non-COAMS) examples.
As application of this model, 37 common APIs used in the treatment of asthma, COPD and tuberculosis [6,7] were used For the first test run all possible API-API combinations were selected, the molar ratio was fixed with 1:1, and the preparat ion method with thermodynamic only. This led to a total of 666 new combinations. A schematic of the workflow comprising model building and application can be found in Figure 1.
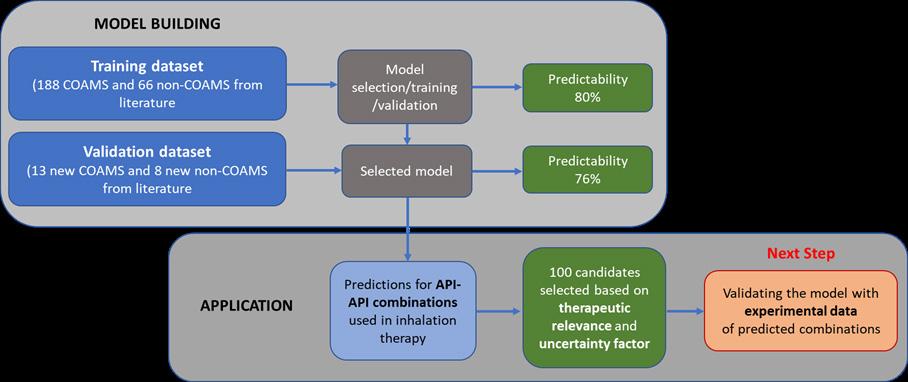
Results and Discussion
Based on the training dataset, a predictive ML model was built with a predictability of 80 %. Validating the ML model with additional data resulted in a predictability of 76%. Figure 2 shows the prediction score, where 1 represents COAMS and 0 non -COAMS combined with the Euclidean distance from the original training dataset. From these, 12 systems out of 13 were identified correctly as COAMS (Figure 2, green dots) and 4 out of 8 as non-COAMS (Figure 2, orange dots). Whereas, 4 non-COAMS were wrongly predicted as co-amorphous. For our application, the wrong prediction of positive, meaning coamorphous examples, is favoured. These combinations will be considered to be tested experimentally for co-amorphous formability. If COAMS are wrongly predicted non -COAMS, the chance of not detecting the system is higher as these systems will likely not be experim entally tested.
The blue dots in Figure 2 represent the new cases (API-API combinations). Systems with a high predicted score (close to 1) are predicted as co-amorphous. However, we can clearly see that the distance from the training dataset (horizontal axis) for certain systems is quite big. Systems far away from the training dataset are unknown to the ML model and the prediction is doubtful. Consequently , a combination of a high predicted score and a short distance from the training dataset is favoured for promising new COAMS predicted with the current ML model.
Drug Delivery to the Lungs , Volume 32, 2021 – Sarah Zellnitz et al.
Figure 1 – Flow diagram of workflow (model building to application)
135
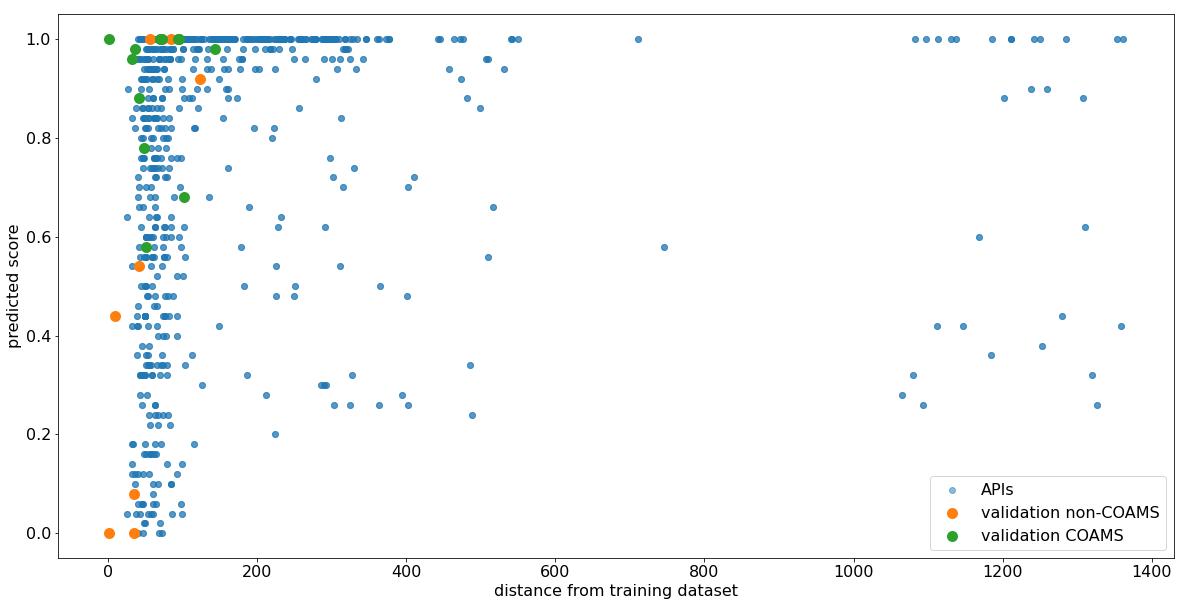
Based on that, an uncertainty factor (UF) combining predicted score and distance from the training dataset was introduced and values ranged from 37 to 11578; the lower the uncertainty, the more accurate the prediction is. Among those we considered the 100 combinations with the lowest uncertainty factor as acceptable predicted co-amorphous. These were the combinations with an uncertainty factor below 77. Those 100 combinations were screened for therapeutic relevance and several promising examples combining inhalable glucocorticoid (IGC) with either a long-acting beta-adrenoceptor agonist (LABA) or a long-acting muscarinic receptor antagonists ( LAMA) were identified. The combination of bronchodilators (LABA, LAMA) and IGCs has become the mainstay of long -term therapy to control symptoms of asthma as well as COPD. Promising combinations identified are for example Mometasone – Bambuterol (UF 57) or Mometasone – Glycopyrronium bromide (UF 58) and Budesonide-Tiotropium (UF 70) or Budesonide- Glycopyrronium bromide (UF 74). Besides that, a combination of short-acting beta adrenoreceptor agonists ( SABA) and short-acting muscarinic receptor antagonists ( SAMA), Fenoterol-Ipratropium (UF 74) was predicted COAMS. SABAS and SAMAS are used as quick-relief medications to be used on an as -needed basis in acute phases and combinations of these two drugs have proven to have a greater bronchodilator response compared to the single APIs. Other promising combinations are for example Ethambutol-Pyrazinamide (UF 47) and Ethambutol-Isoniazid (UF 51), first line drug combinations used in the therapy of tuberculosis. Noticeable is that certain APIs appear more often among the 100 selected examples, for example Theophylline, an additional/alternative API used for Asthma and COPD treatment. Therefore, also combinations with Theophylline like Theophylline –Salbutamol (UF 53) will be tested. It has to be noted that API-API combinations will be selec ted based on current therapy schemes and drug classes, for clinical relevance, further tests regarding efficacy, safety etc. are necessary and will be considered in a later phase.
Conclusion and Outlook
In this study, we used literature data to build a molecular descriptors-based ML model for predicting the co-amorphous formation potentials of two drug combination, with a special focus on inhalation therapy The predictive ML model was validated using an untrained set of literature data. In a next step, the model will be experimentally validated using selected API -API combinations near the original training set (examples mentioned above). The predictability for these is expected to be fairly accurate. Whereas, for API-API combinations far away from the training dataset, the quality of the positive prediction might be questionable. In order to further optimise the model, additionally, carefully selected predicted COAMS but with a large distance from the training dataset will be tested. The selection of these systems will aim to improve the coverage of the data space. This will improve the basis for a fine-tuned ML model, which will then be able to more accurately predict a broader range of COAMS systems for the therapy of lung disease
Drug Delivery to the Lungs , Volume 32, 2021 - Machine Learning approach to predict the formation coamorphous systems for inhalation therapy
Figure 2 – Graphical description of the predictions for the validation dataset and all new API-API combinations. Vertically the average of the predicted class (1 = COAMS, 0 = non-COAMS) from 50 ML models is depicted, horizontally the distance from the original training dataset.
136
References
[1] Chambers L I, Grohganz H, Palmelund H, Löbmann K, Rades T, Musa O M, Steed J W: Predictive identification of co-formers in co-amorphous systems, Eur J Pharm Sci 2021; 157: 105636
[2] Meng-Lund H, Kasten G, Jensen K T, Poso A, Pantsar T, Rades T, Rantanen J , Grohganz H: The use of molecular descriptors in the development of co-amorphous formulations, Eur J Pharm Sci 2018; 119: pp 31–38.
[3] Dengale S J, Grohganz H, Rades T, Löbmann K: Recent advances in co-amorphous drug formulations, Adv Drug Deliv Rev 2016; 100: pp 116-125
[4] Liu J, Grohganz H, Löbmann K, Rades T, Hempel N J. Co-amorphous drug formulations in numbers: Recent advances in coamorphous drug formulations with focus on co-formability, molar ratio, preparation methods, physical stability, in vit ro and in vivo performance, and new formulation strategies , Pharmaceutics 2021; 13 (3), 389: pp 1-43
[5] Moriwaki H, Tian Y S, Kawashita N, Takagi T. Mordred: A molecular descriptor calculator. J Cheminform. Springer International Publishing 2018; 10(1): pp 1-14
[6] Pham D-D, Fattal E, Tsapis N. Pulmonary drug delivery systems for tuberculosis treatment , Int J Pharm. 2015; 478(2): pp 517–529
[7] E.D. Bateman E D, Hurd S S, Barnes P J, Bousquet J, Drazen J M,FitzGeralde M, Gibson P, Ohta K, O’Byrne P, Ped ersen S E, Pizzichini E, Sullivane S D,Wenzel S E and Zar H J, Global strategy for asthma management and prevention: GINA executive summary, Eur Respir J 2008; 31: pp 143–178
Drug Delivery to the Lungs , Volume 32, 2021 – Sarah Zellnitz et al.
137
138
Investigation of design features on the performance of 3D -printed dry powder inhalers. Part 1: grid mesh
Yuqing Ye1,2, Ziyi Fan1, Ying Ma1,2 & Jesse Zhu*1,2
1University of Western Ontario, 1151 Richmond Street, London, N6A 3K7, Canada
2Ningbo Inhale Pharma, 2260 Yongjiang Street, Gaoxin District, Ningbo, 315000, China
Summary
The study on inhaler performance through modified inhalers with homogeneous aperture size across the full grid structure have been carried out. In our resea rch, the size of each small opening except the four in the corners of inhaler grid was kept constant , and the wire splitting the grid was designed to v ary, thus generating grids with same aperture size but different voidage (Figure 1). In addition, instead of injection moulding method, a novel 3D printing technology was employed to fabricate the modified inhalers, which is rarely studied. Therefore, the primary objective for this work is to investigate the influence of grid mesh voidage on inhaler performance, as well as confirming the feasibility of 3D -printed inhalers for pulmonary drug delivery. For the assembled 3D-printed inhaler with a voidage of 68.7%, the Fine Particle Fraction (FPF) was raised to 37 .2 compared with the inhaler with a voidage of 13. 2% and FPF of 33.8%. There was a rising trend of FPF and delivered dose when grid voidage increased, which attributed to less drug impacting on the meshes of grid and more drug passing through the apertures. The experimental results were also coupled with c omputational fluid dynamics (CFD) analysis, which provided a complementary understanding of the drug delivery performance differences.
Key Message
Modified inhalers by 3D-printing method, with constant aperture size across the full grid structure, were successfully fabricated and assembled. Inhalers with an increased voidage had higher in-vitro drug delivery performance and lower air resistance, which was proved by enhanced powder residues in the devices and more centralized powder jettin g verified by CFD.
Introduction
Dry powder inhalation (DPI) system for pulmonary drug delivery has received increasing attention and development since its advent in mid 1960s. To gain a better understanding of the influence of inhaler design on de-attachment and/or de-aggregation for better lung deposition, the mechanism and key design factors on inhalers were comprehensively studied [1]–[3] Efforts to improve DPI performance has been primarily focused on the modification of device, as well as engineering of powder formulation [4] . In terms of inhalers, the specific design features that have an essential influence on the aerosolization performance were also investigated, including mouthpiece length, mouthpiece diameter, inlet size, and grid structure design[1]–[3]. Among them, grid mesh is commonly found placed at the upstream of a DPI mouthpiece and exists to enhance de-aggregation of powdered dose through mechanical impaction [5]. In most design of DPIs, especially of capsule-based inhaler, the grid structure is present with essential functions on particle deposition in the lungs. Research by Wong et al. found grid structure is beneficial to improve break -up and aerosolization of agglomerates [3]. Fletcher et al. showed strong jetting flow exiting the device in the absence of grid while reduced jet spreading and tendency to have the particles along the center of the jet with grid at the entry of mouthpiece [6]. Zhou et al. designed a cross-grid and showed insignificant drug delivery performance between the full Aerolizer® grid and the modified cross-grid Aerolizer® while studies by Coates et al. exhibited better performances with complete Aerolizer® grid than modified grid with higher voidage [1], [2].
Although the study on grid design of inhalers have been carried out, the size of each small opening changed with heterogeneous size across the full grid structure . The work of influence of grids with homogeneous size but different grid voidage still hasn’t been done. In our research, the size of each small aperture except the four in the corners was kept constant , and the wire splitting the grid was designed to vary, thus generating grids with same size but different voidage. In addition, the traditional manufacture process of inhalers, inject molding, is complex and time-consuming, and less research is seen on the study of the whole modified inhalers. Recently, additive manufacturing, also well-known as 3D printing, as a novel technology, extended its application to the pharmaceutical field. Yet, limited research on 3D-printed DPIs is found. What we searched is that 3D-printing was employed to fabricate
Drug Delivery to the Lungs , Volume 32, 2021 – Yuqing Ye et al
139
Drug Delivery to the Lungs , Volume 32, 2021 - Investigation of design features on the performance of 3D -printed dry powder inhalers.
Part 1: grid mesh
a single part of DPIs, such as mouthpiece [7], instead of the whole inhalers. Therefore, the objectives for this work are to investigate the drug delivery performance of 3D-printed inhalers with modified grid structure, as well as verifying the feasibility of 3D-printing technology for pulmonary drug delivery.
Methods and Materials
Onbrez® capsules (Novartis Pharmaceutical Company, Switzerland) was obtained from a pharmacy
Each capsule contains inhalable Indacaterol maleate dry powder equivalent to 150 microgram indacaterol. Deionised water was purified by reverse osmosis (MilliQ, MilliPore, Canada). All chemicals used were of high-performance liquid chromatography (HPLC) analytical grade and purchased from Chem-Supply (Canada). Ethanol was purchased from VWR, Mississauga, O ntario, Canada.
Construction of 3D model of inhalers and assembly of inhalers
The 3D models of modified Breezhaler ® were created using Creo software developed by PTC (USA) and exported as .stl files to be prototyped. The 3D models with grid structures modified were shown in Figure 1. The size of each small square aperture (except the four in the corners) was kept constant, and the mesh splitting the grid was designed to v ary, thus generating openings with same size but different voidage 6´6 was used to define the grids, representing 6 small square apertures horizontally and 6 vertically with same size and voidage as the commercial Breezhaler ® with a voidage of 48.3%. Similarly, 4 4 represents 4 small square apertures horizontally and 4 vertically with a lower voidage of 13.2% while 7´7 represents 7 apertures horizontally and 7 vertically with a higher voidage of 68.7% Inhalers were then constructed from photopolymer resin (Tough 1500, ABS) by Form 3 Stereolithography (SLA) 3D printer (Formlabs Inc, USA), with an overall layering thickness of 25 μm for each single part of the inhalers 3D-printed mouthpieces with varied grid mesh and assembled 3D -printed inhalers were shown in Figure 2. The 3D-printed parts were assembled for further evaluation.
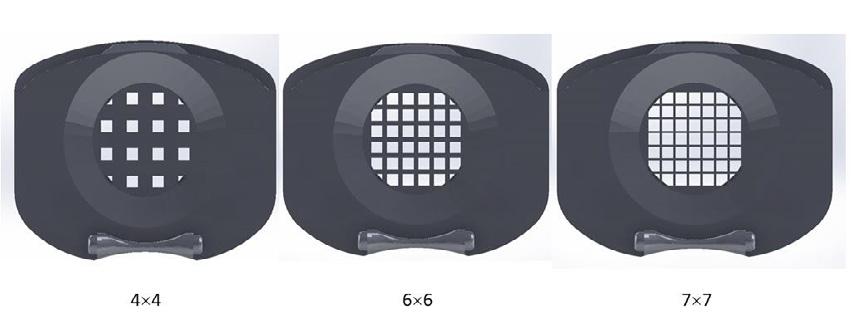
Evaluation of in-vitro aerosol performance
The aerodynamic particle distribution of Indacaterol maleate powder through the three modified inhalers was determined using a Next Generation Impactor (NGI, Copley, Nott inghamshire, UK) with a suitable mouthpiece adaptor, setup as described in the US Pharmacopeia. For each dispersion, thirteen capsules containing Indacaterol maleate dry powder formulation were used and dispersed into the NGI system through the modified in halers (IN-1, IN-2, IN-3), respectively. 50 μL of glycerol mixture containing ethanolic Brij35 was coated on each of the NGI stages. The system was run at 60 L/min for a total of 4 s with 4 L of air passing through the inhaler with 13 doses of Indacaterol maleate for each run. The cutoff size of NGI stages 1-7 at an airflow rate of 60 L/min were 8.06, 4.46, 2.82, 1.66, 0.94, 0.55 and 0.34 microns, respectively. Indacaterol maleate particles deposited on device, conduction port (CP), preseparator (PS), stage 1-7, and micro-orifice of collector (MOC), and drug residue in the capsules were collected, then assayed by high-performance liquid chromatography (HPLC) (Waters, MA) using ultraviolet detector.
Figure 1 Front view of grid mesh of modified 3D inhalers140
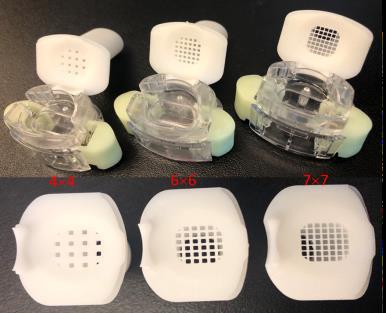
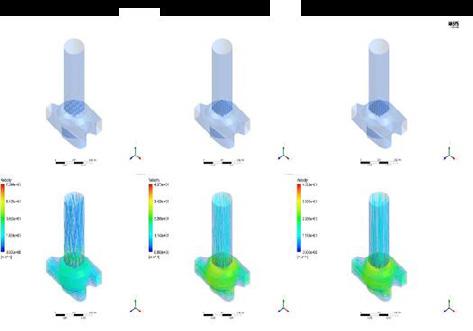
CFD modelling
CFD analyses conducted by ANSYS Fluent 2020R1 were used to provide a complementary understanding of the performance differences among these three configurations, shown in Figure 3. Shear Stress Transport (SST) model together with the constant test flow rat e of 60 L/min was chosen to generate the flow field, and particle performances were evaluated via the Lagrangian particle tracking method afterwards [1]. The mesh independent study results reached within an acceptable range of error with the help of Ansys Fluent Meshing. Additionally, pressure drop data collected at different locations along the mouthpiece by Sensirion EK-P4 was used to validate the computational results.
Results and Discussion
Evaluation of in-vitro drug delivery performance
The experimental dispersion of 13 doses of Indacaterol maleate dry powder was performed to study the effect of the grid on the aerosol performance. Figure 4 showed the particle deposition distribution on each part of NGI, with approximate 25% of Indacatero l maleate impacted on the PS and most fine particles deposited on stage 3 and stage 4. As the voidage of inhalers increased, there was also a slightly growth of the fine particle fraction (FPF) . With a voidage of 68.73% for the assembled 3D-printed inhaler with modified grids of 7´7, the FPF was raised to 37.2% compared with that of 4´4 with a FPF of 33.8%. The results showed a positively proportional relationship between voidage of inhaler grids and FPF. In addition, the delivered dose (expressed as the percentage of detected drug mass to the labelled mass) through IN-1, IN-2, and IN-3 were 80.4±0.9%, 84.5±1.3% and 92.7±0. 5%, respectively. There was a rising trend of delivered dose when grid voidage increased Since the width of the mesh splitting the grid was designed to be 0.22 mm, 0.50 mm and 1.63 mm for IN-3, IN-2 and IN-1, respectively, more drug was assumed to be impacted on the mesh instead of passing through the grids with air flow, which means smaller delivered dose. The assumption was verified by Indacaterol maleate retention shown in Table 1. Indacaterol maleate detected in the IN-1 designed with the smallest voidage and widest splitting wire, was 19.6%, larger than that in IN-2 of 15.5% and IN-3 of 7.3 % More possible reasons were explained by CFD analysis.
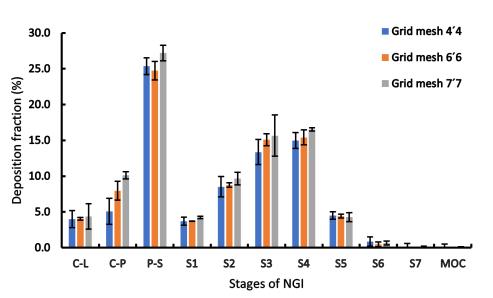
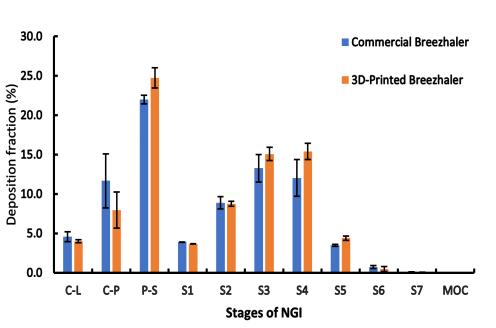
Drug Delivery to the Lungs , Volume 32, 2021 – Yuqing Ye et al
Figure 2 3D-printed mouthpieces with varied grid mesh (upper row) and assembled 3D-printed inhalers (lower row)
Figure 4 Drug deposition percentage with on each stage of NGI (CP, PS, stage 1-7, MOC) and drug residue in the capsules through three modified 3D-printed inhalers with varied grids
Figure 3 Internal fluid flow areas displayed with corresponding velocity streamlines tracking through the three inhalers with varied voidage
141
Figure 5 Drug deposition percentage on each stage of NGI (CP, PS, stage 1-7, MOC) and drug residue in the capsules through commercial Breezhaler® and corresponding 3D-printed Breezhaler
Drug Delivery to the Lungs , Volume 32, 2021 - Investigation of design features on the performance of 3D -printed dry powder inhalers.
Part 1: grid mesh
1
of modified inhalers with varied grids (n=3)
*Voidage percentage is a measure of the open area within the grid structure as a percentage of the cross -sectional area of the mouthpiece
Generally, the methods for constructing inhalers were less researched and reports on device modification were less seen, 3D-printing technology provides a new, fast, convenient, and cost-effective way for inhaler fabrication. This work also did a preliminary investigation on the aerosolization performance of 3D-printed inhalers. Figure 5 showed the particle distribution through commercial Breezhaler® and corresponding 3D-printed Breezhaler, which have an air resistance of 0.0130 and 0.0228 KPa0.5/(L/min)), respectively. The FPF of printed inhaler is 37.2%, significantly higher tha n that commercial Breezhaler® of 29.7%. This may attribute to unsatisfactory resolution used for 3D -printing. Although a relatively high resolution was used for printing, the inner surface is not as smooth as the commercial inhaler by injection molding fro m ABS (Acrylonitrile butadiene styrene), thus may generating small vortex and turbulence inside of the air flow field and leading to a higher air resistance. These minor vortex and turbulence may promote de-agglomeration and de-attachment, further enhancin g FPF and delivered dose. This could be validated by experiment results, slightly lower device retention of 15. 5% through 3D-printed IN-2 compared with 19.5% through the commercial inhalers (Table 1). The other possible reasons for better aerosolization performance of 3D-printed inhalers may attribute to properties of inhaler materials and minor leaking when air is entrained into the system. More characterization s are needed to verify the assumptions.
CFD analysis
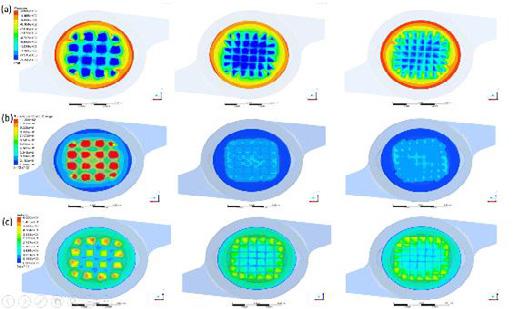
Velocity streamlines tracking through the three inhalers with varied voidage were shown in Figure 3. With the increase of grid voidage, much reduced air jet spreading and vertexing were observed. The flow fields of devices with intense openings are potentially beneficial because they are likely to focus particles along the centre and reduce the collision of particles on the mouthpiece wall. Figure 6 illustrates how inhaler grid would affect the pressure, the turbulence kinetic energy, and the velocity captured from 0.1 mm below the inhaler grid Higher values of these parameters indicate an increase of particle deagglomeration, and the probability of drug carrier detachment [1], [8] However, more collision between drug and wall, may also be introduced, thus possibly leading to lower FPF. Meanwhile, the drug particles were also likely to impact on the mesh with wider wire splitting the grid, and then retained in the device. Overall, the FPF depends on all the above factors. Take IN-1(inhaler grid 44) as an example, higher velocity and turbulence, theoretically, contributes to a higher FPF, but its experimental FPF was relatively low than inhalers with higher voidage, which results from a predominant factor of large mass impaction and drug retention in the IN-1. The explanation was also verified by the experimental results of drug retention in Table 1.
Inhaler No. Grids Voidage* (%) Air resistance (KPa0.5/(L/min)) Device retention (%) FPF (%) FPD (μg) Delivered dose (μg) IN-1 44 13.16 0.0296 19.58 33.8 ± 3.1 65.92 ± 3.9 120.63 ± 1.28 IN-2 66 48.26 0.0228 15.46 35.4 ± 2.5 69.02 ± 5.2 128.31 ± 1.96 IN-3 77 68.73 0.0208 7.27 37.2 ± 4.2 72.51 ± 4.8 139.10 ± 0.71 Commercial Breezhaler® 66 48.26 0.0130 19.46 29.7 ± 4.4 59.03 ± 3.7 120.81 ± 2.61
Table
Summary of experiment results
142
Figure 6 (a) Contour plot of pressure profiles 0.1 mm below the inhaler grid 44; (b) Contour plot of turbulence kinetic energy profiles 0.1 mm below the inhaler grid 66; (c) Contour plot of velocity profiles 0.1 mm below the inhaler grid 77
Conclusions
This work showed the feasibility of constructing inhalers by 3D -printing technology, and assemble d inhaler IN-2 had a slightly higher fine particle fraction and delivered dose than the commercial Breezhaler®, which requires further research to figure out the reasons behind. The 3D-printed inhaler with higher grid voidage and constant opening size, was found to show a modest increment on FPF and significant increase on delivered dose because of less drug retention in the device. In summary, the grid structure of capsule-based dry powder inhaler will affect in-vitro drug delivery performance but varies based on the design character, and plays an important role on particles centralization.
References
[1] M. S. Coates, D. F. Fletcher, H. -K. Chan, and J. A. Raper, “Effect of Design on the Performance of a Dry Powder Inhaler Using Computational Fluid Dynamics. Part 1: Grid Structure and Mouthpiece Length,” Journal of Pharmaceutical Sciences , vol. 93, no. 11, pp. 2863–2876, Nov. 2004, doi: 10.1002/jps.20201.
[2] Q. T. Zhou, Z. Tong, P. Tang, M. Citterio, R. Yang, and H. -K. Chan, “Effect of Device Design on the Aerosolization of a Carrier-Based Dry Powder Inhaler a Case Study on Aerolizer® Foradile®,” AAPS J, vol. 15, no. 2, pp. 511–522, Apr. 2013, doi: 10.1208/s12248-013-9458-6.
[3] W. Wong, D. F. Fletcher, D. Traini, H. Chan, J. Crapper, and P. M. Young, “Particle Aerosolisation and Break ‐up in Dry Powder Inhalers: Evaluation and Modelling of the Influence of Grid Structures for Agglomerated Systems, ” Journal of Pharmaceutical Sciences, vol. 100, no. 11, pp. 4710–4721, Nov. 2011, doi: 10.1002/jps.22663.
[4] P. W. Longest, Y.-J. Son, L. Holbrook, and M. Hindle, “Aerodynamic Factors Responsible for the Deaggregation of CarrierFree Drug Powders to Form Micrometer and Submicrometer Aerosols,” Pharm Res, vol. 30, no. 6, pp. 1608–1627, Jun. 2013, doi: 10.1007/s11095-013-1001-z.
[5] K. Elserfy, A. Kourmatzis, H.-K. Chan, R. Walenga, and S. Cheng, “Effect of an upstream grid on the fluidization of pharmaceutical carrier powders,” International Journal of Pharmaceutics , vol. 578, p. 119079, Mar. 2020, doi: 10.1016/j.ijpharm.2020.119079.
[6] D. F. Fletcher, V. Chaugule, L. Gomes dos Reis, P. M. Young, D. Traini, and J. Soria, “On the Use of Computational Fluid Dynamics (CFD) Modelling to Design Improved Dry Powder Inhalers,” Pharm Res, vol. 38, no. 2, pp. 277–288, Feb. 2021, doi: 10.1007/s11095-020-02981-y.
[7] H.-J. Lee et al., “Spiral mouthpiece design in a dry powder inhaler to improve aerosolization,” International Journal of Pharmaceutics, vol. 553, no. 1–2, pp. 149–156, Dec. 2018, doi: 10.1016/j.ijpharm.2018.10.036.
[8] T. Suwandecha, W. Wongpoowarak, K. Maliwan, and T. Srichana, “Effect of turbulent kinetic energy on dry powder inhaler performance,” Powder Technology, vol. 267, pp. 381–391, Nov. 2014, doi: 10.1016/j.powtec.2014.07.044.
Drug Delivery to the Lungs , Volume 32, 2021 – Yuqing Ye et al
143
144
Determination of an appropriate dose ratio of a synergistic combination of long-acting bronchodilators for the maintenance treatment of asthma and COPD
1 Laboratory of Pharmaceutics and Biopharmaceutics, Faculty of Pharmacy, Université libre de Bruxelles (ULB), Boulevard du Triomphe, B-1050 Brussels, Belgium, Elena.Menchi@ulb.be
2 Pharmacology, Pharmacotherapy and Pharmaceutical Care, Faculty of Pharmacy, Université libre de Bruxelles (ULB), Boulevard du Triomphe, B-1050 Brussels, Belgium
3 Immune Response, Sciensano, Rue Engeland 642, B-1180 Brussels, Belgium
Summary
Introduction. The combination of inhaled drugs used in maintenance therapy of non-communicable respiratory diseases such as asthma and chronic obstructive pulmonary disease (COPD) has shown significant improvement in symptoms and pulmonary function. As the co-administration of a long-acting β2-agonist (LABA) with a long-acting muscarinic antagonist (LAMA) could provide synergistic benefit on airway smooth muscle relaxation, pharmacological interactions between formoterol fumarate dihydrate (FOR) and tiotropium bromide monohydrate (TIO), and indacaterol maleate (IND) and TIO were studied using an ex vivo technique. Methods. An experimental model of isolated perfused guinea pig trachea l rings was used to highlight the dose ratios generating strong synergistic interactions that could be used in the formulated combinations. Recorded data were analysed with two widely used pharmacological models, the Bliss independence (BI) theory and the unified theory These enable the synergy to be identified by accurate statistical analysis and the magnitude of interaction to be quantified, respectively[1] Results. Synergistic interactions were found among the dose ratios tested, with the maximum interaction magnitudes for FOR:TIO 2:1 (w/w) and IND:TIO 10:1 (w/w). Conclusion. The dose ratio showing the strongest synergy and leading to the best dose reduction when compar ed with the same drugs as monotherapy will be chosen to be formulated. However, this synergy at the selected dose ratio requires to be confirmed on a preclinical model of asthma or COPD by assessing lung function
Key Message
It was proposed that dose ratios of LABA/LAMA (w/w) combinations resulting in synergistic airway relaxation were highlighted using an appropriate ex vivo model of isolated perfused guinea pig tracheal rings. This was done to optimise the benefits of the co-administration of these drugs in the treatment of asthma and COPD.
Introduction
The control of non-communicable respiratory diseases such as asthma and COPD remains a challenge for many patients[2][3]. Simplifying their treatment regimen by developing formulations containing combinations of drugs in a single device that can be administered at a lower daytime frequency could improve the control of these diseases, es pecially for patients with problems related to adherence or inhalation technique[4][5]. In addition, significant improvement in symptoms and lung function has been shown with combinations of drugs used in maintenance therapy[6][7]. Similarly, a recent synergistic effect has been demonstrated for the combination of LABA and LAMA for the treatment of COPD[1]. Therefore, the identification and quantification of a synergistic interaction can be included as a step before formulation in the development of an inhaled medicine comprising a combination of long -acting bronchodilators for asthma and/or COPD patients. In this context, this research is carried out by studying the impact of LABA/LAMA combinations on the contractile tone of airway smooth muscle, with a specific focus on the LABA/LAMA (w/w) dose ratio promoting an optimisation of the airway smooth muscle relaxation.
In this work, FOR and IND were each associated with TIO, the only LAMA approved for both COPD and asthma, to assess their synergistic potential The selection of these two LABAs was based on their difference in duration of action (i.e., acting for 12 hours and over 24 hours, respectively) In addition to their long duration of action, these drugs were chosen for their promising combined effects on airway relaxation in both COPD and asthma. Isolated and perfused tracheal rings from guinea pigs were used as an experimental model. This was because they allow the assessment of the relaxation effect of the drugs on airway smooth muscle on an appropriately sized organ from a small animal model with a high
Drug Delivery to the Lungs, Volume 32 , 2021 – Elena Menchi et al.
Elena Menchi1, Charaf El Khattabi2, Olivier Denis3, Stéphanie Pochet2, Karim Amighi1 & Nathalie Wauthoz1
145
Drug Delivery to the Lungs , Volume 32, 2021 - Determination of an appropriate dose ratio of a synergistic combination of long-acting bronchodilators for the maintenance treatment of asthma
degree of similarity to the human airway in terms of pharmacological receptors [8] . There is currently no ideal model for the analysis of pharmacological interactions [9] Therefore, two of the most widely used pharmacological models, the BI theory and the unified theory, were applied to the resulting data to highlight the dose ratios of LABA/LAMA (w/w) providing strong synergistic interactions . Indeed, the complementary approaches of these models, and their applicability to various experimental systems (i.e. in vitro, ex vivo, and in vivo) [10] seem to be relevant for the determination of dose ratios of new and existing inhaled LABA/LAMA combinations[1].
Materials and methods
Materials
FOR, IND, and TIO were obtained from CHEMO Industriale Chimica s.r.l. (Saronno (VA), Italy). Methacholine (MCh) was purchased from Sigma -Aldrich (St.Louis, USA) and atropine sulfate from Merck (Darmstadt, Germany). Dimethyl sulfoxide (DMSO) was purchased from Carl Roth GmbH + Co. KG (Karlsruhe, Germany). All components used for the preparation of the Krebs-Henseleit (K-H) solution (i.e., KCl, NaCl, NaHCO 3, MgSO4, KH2SO4, CaCl2 and glucose) were purchased from VWR (Pennsylvania, USA). Ultrapure water was obtained from a Purelab -Ultra system (Elga LabWater, Lane End, UK).
Solutions of bronchodilators were prepared daily using DMSO for the stock solution and were diluted in ultrapure water. Solutions of MCh and atropine sulfate were prepared in ultrapure water.
Animals
Male Dunkin Hartley guinea pigs (body weight 250-500g) were obtained from Charles River Laboratories and housed in groups of four or five in the facilities of the Belgian research institute of public health Sciensano. They received dry food (Carfil Quality, Oud -Turnhout, Belgium) and water ab libitum. All animal procedures were conducted in accordance with EU Directive 2010/63/EU for animal experiments.
Preparation of isolated trachea l rings from Dunkin Hartley guinea pig
Guinea pigs were euthanised using increasing concentrations of carbon dioxide. The trachea wa s removed and immediately placed in a K-H solution with the following composition (in mM): NaCl 118.1, KCl 4.7, MgSO4.7H2O 1.2, KH2PO4 1.2, CaCl2 2.5, NaHCO3 25, and glucose 5. After removing surrounding tissues, the trachea was cut into 3-5 mm long rings. The rings were mounted on metal rods under a 1.5 g resting tension in organ baths containing 20 mL of K -H solution gassed gently with 95% O2 / 5% CO2 and maintained at 37°C. Changes in isometric forces were measured using force displacement transducers and continuously recorded with a transducer amplifier and IOX computer software, version 1.8.3.25 (EMKA Technologies, Paris, France).
Equilibration of the bath conditions was carried out for at least 1 hour before the experimental stimulations with refreshment of the K-H solution every 20 minutes. Following equilibration, the tracheal rings were exposed to 60 mM KCl to ensure their viabil ity. Organ baths were rinsed several times to restore the resting tension before stimulating the tracheal rings with the tested drugs.
Experimental protocol
A previously defined concentration of MCh (10 µM) was added to the organ baths to obtain a stable submaximal contraction size between 50% and 70% of the maximum MCh contraction. The assessment of the tracheal relaxation was carried out on precontracted trachea l rings by multiple additions of the combined drugs in a cumulative dose fashion to generate semi-logarithmic concentration-relaxation curves. A time interval of 30 minutes between concentrations was applied. At the end of the experiment, 1 µM of atropine sulfate was added to the organ baths as full agonist to achieve the maximal relaxant response (Emax) for each tracheal ring , allowing calculation of a normalized relaxation percentage. The contractile relaxation of tracheal rings was expressed as a percentage of E max induced by atropine sulfate (1 μM) on the submaximal contractile tone induced by MCh.
For both studied combinations, two dose ratios were selected based on a preliminary screening study (data not shown) Concentration-relaxation curves were generated for these combinations at a constant dose ratio by varying only the amounts of drugs that are cumulatively added to the organ baths Recorded data were analysed using the BI theory and the unified theory, respectively. The interaction between drugs is synergistic if the delta effect (ΔE) value (i.e., the difference between the observed
146
effect and the expected calculated effect ) is positive with a positive 95% confidence interval, according to the BI theory, and if the calculated combination index (CI) value is lower than 1, according the unified theory[1][9][10] CompuSyn® software (Paramus, NJ, USA) was used to calculate the CI value.
Statistical analysis
For each studied combination, values are represented as mean ± SEM of n=5 -6 different animals. The statistical significance at each dose level was assessed by the one-way analysis of variance (ANOVA) with a Bonferroni correction. The level of statistical significance was defined as p < 0.05. Statistical analysis was performed using GraphPad Prism 5 computer software (San Diego, CA, USA).
Results and discussion
Amounts of drugs in the combinations were defined based on TIO, which has a higher relaxing potency than the LABAs in guinea pig tracheal rings (experimental pEC50 values: TIO 8.8 ± 0.3, FOR 5.4 ± 0.3, IND 5 ± 1). Consequently, this drug was added in the same way for all combinations tested, generating curves showing similar profiles (Fig.1). Synergistic interactions were identified for all combination s, but only from a certain concentration that depended on the combination and dose ratio. A combination index plot describes the magnitude of interaction due to the CI value in relation to the fraction affected (Fa), which is the relaxant effect obtained for each studied combination (Fig.1B). This plot confirms that pharmacological interactions are synergistic (CI below 1) beyond a defined dose that is cumulatively added The FOR/TIO combination with the dose ratio 2:1 (w/w) showed earlier synergistic results, although only after three cumulative additions (Fig.1).
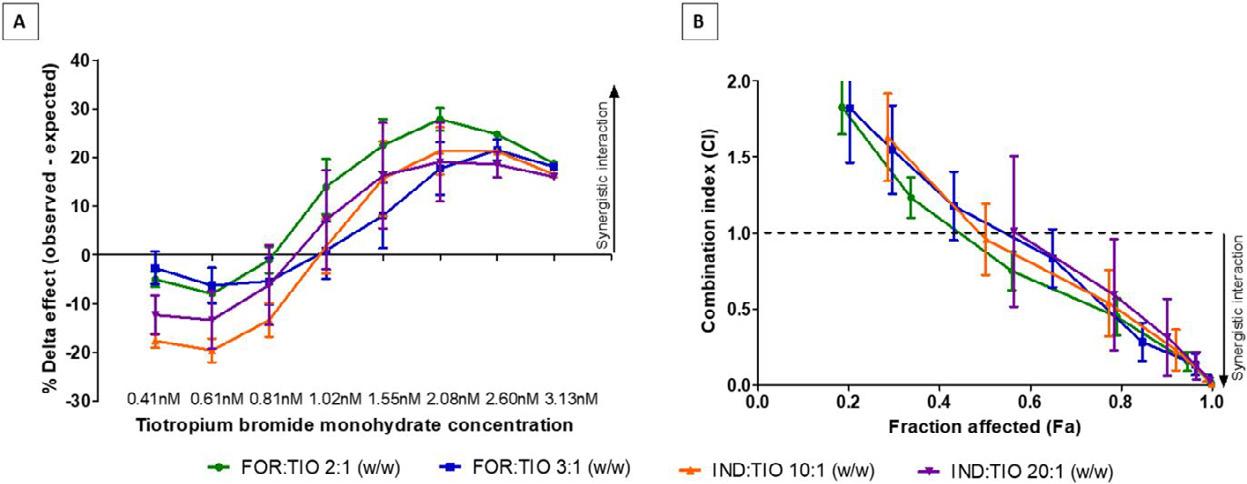
1 – Pharmacological interaction analysis in guinea pig tracheal rings induced by FOR plus TIO (green and blue curves), and by IND plus TIO (orange and purple curves) for the range of concentrations tested in the study. (A) ΔE value between observed and expected relaxant response predicted by the BI theory (B) Combination index plot obtained according the unified theory with 7 data points that are outside the axis limits. Data are expressed as mean ± SEM from experiments performed using samples from n=5-6 different subjects. BI: Bliss independence; CI: combination index; Fa: fraction affected.
Furthermore, the mean of the maximum ΔE calculated according to the BI theory for the FOR/TIO combination and the IND/TIO combination for each studied dose ratio is reported in Table 1. Considering the FOR/TIO combination, the maximum ΔE was obtained with the 2:1 (w/w) dose ratio, while the dose ratio showing a higher ΔE value with IND/TIO was 10:1 (w/w). There are no significant differences between the maximum ΔE for the constant dose ratios studied (p > 0.05) However, the slight differences for the same LABA/LAMA combination show that promoting a combination with lower concentrations could lead to stronger synergistic interactions, as also reported by certain authors [11] . As the aim is to determine an appropriate dose ratio of LABA/LAMA combinati ons resulting in synergistic airway relaxation, the dose ratio showing strong synergy and leading to the best dose reduction when compar ed with the same drugs as monotherapy was chosen to be formulated
However, the data collected must be set against the l imitations of the experimental model as relaxant responses given by the tracheal rings are concentration - and time-dependent. Furthermore, while the CI values are closely related to the amounts of drugs added to the organ baths[10], the ΔE value assessment is limited by the maximum relaxation value that can be achieved (i.e., 100% relaxation) Therefore, each pharmacological model has its advantages and limitations [1] , hence the interest in highlighting synergy through several pharmacological models [9]
Drug Delivery to the Lungs, Volume 32 , 2021 – Elena Menchi et al.
Figure
147
Drug Delivery to the Lungs , Volume 32, 2021 - Determination of an appropriate dose ratio of a synergistic combination of long-acting bronchodilators for the maintenance
–
n=5-6 different subjects.
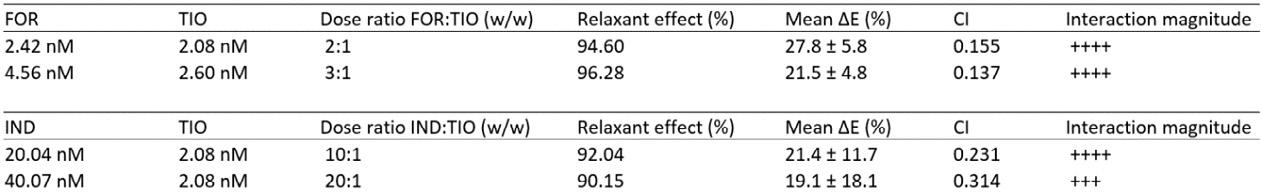
The smaller the CI value, the greater the magnitude of the interaction. - - - - - - Very strong antagonism; - - - - - strong antagonism; - - - - antagonism; - - - moderate antagonism; - -slight antagonism; - nearly additive; + slight synergism; + + moderate synergism; + + + synergism; + + + + strong synergism; + + + + + very strong synergism. CI: Combination index.
Finally, complementary kinetic studies with the selected amounts of drugs will be performed to confirm the synergy and to refine the selection of the appropriate dose ratio without the influence of previous cumulative additions of drugs on the resulting relaxatio n, while assessing the airway relaxant effect over time.
Conclusion
The use of an ex vivo model such as guinea pig tracheal rings to highlight appropriate synergistic dose ratios of LABA/LAMA combinations represents a promising strategy before the formulation step in the development of optimised synergistic LABA/LAMA (w/w) combinations in the maintenance therapy of asthma and COPD. Synergy was found for all dose ratios previously selected and assessed in this study, but only for specific concentration ranges, and with different interaction magnitudes. These experiments show that airway relaxation can be improved by combining lower concentrations of drugs than with monotherapies, which also reduces related side effects [1] The dose ratio showing synergy and leading to the best dose reduction when compar ed with the same drugs as monotherapy was chosen to be formulated (i.e., FOR:TIO 2:1 (w/w) or IND:TIO 10:1 (w/w)). However, due to the limitations of the experimental model (e.g. isolated perfused organ), the synergy at the selected dose ratio first requires confirmation on a preclinical model of asthma or COPD by assessing bronchodilation through measurement of lung function before proceeding to clinical trials [12]
References
[1] Calzetta L,. Matera M G, Cazzola M: Pharmacological interaction between LABAs and LAMAs in the airways: Optimizing synergy, Eur J Pharmacol, 2015, vol 761, pp 168–173.
[2] GINA Global Strategy for Asthma Management and Prevention, 2021. Available from: www.ginasthma.org
[3] GOLD Global Strategy for the Diagnosis, Management, and Prevention of Chronic Obstructive Pulmonary Disease , 2021. Available from www.goldcopd.org
[4] Van Boven J F M, Trappenburg J C A, Van Der Molen T, Chavannes N H: Towards tailored and targeted adherence assessment to optimise asthma management , npj Prim Care Respir Med, 2015, vol 25, pp 1-6.
[5] Kocks J W H, Chrystyn H, van der Palen J, Thomas M, Yates L, Landis S H, Driessen M T, Gokhale M, Sharma R, Molimard M: Systematic review of association between critical errors in inhalation and health outcomes in asthma and COPD, npj Prim Care Respir Med, 2018, vol 28, no 1, pp 1–6.
[6] Matsunaga K, Kawabata H, Hirano T, Sugiura H, Minakata Y, Ichinose M: Difference in time-course of improvement in asthma control measures between budesonide and budesonide/formoterol , Pulm Pharmacol Ther, 2013, vol 26, no 2, pp. 189–194.
[7] Tashkin D P, Ferguson G T: Combination bronchodilator therapy in the management of chronic obstructive pulmonary disease, 2013, Respir Researc, vol 14, no 49, pp 1–13.
[8] Canning B J, Chou Y: Using guinea pigs in studies relevant to asthma and COPD, Pulm Pharmacol Ther, 2008, vol 21, no 5, pp 702–720.
[9] Foucquier J, Guedj M: Analysis of drug combinations: current methodological landscape , Pharmacol Res Perspect, 2015, vol 3, no 3, pp 1-11 .
[10] Chou T: Theoretical Basis , Experimental Design , and Computerized Simulation of Synergism and Antagonism in Drug Combination Studies, Pharmacol Rev, 2006, vol 58, pp 621–681.
[11] Calzetta L, Matera M G, Rogliani P, Cazzola M: Dual LABA / LAMA bronchodilators in chronic obstructive pulmonary disease : why , when , and how , Expert Rev Respir Med, 2018, vol 12, no 4, pp 261–264.
[12] Cazzola M, Calzetta L, Ora J, Puxeddu E, Rogliani P, Matera MG: Searching for the synergistic effect between ac lidinium and formoterol: From bench to bedside. Respir Med, 2015 vol 109 no 10, pp 1305-1311.
treatment of asthma Table 1 Most relevant ΔE value and related pharmacological interaction values for each fixed dose ratio of FOR plus TIO, and IND plus TIO combinations, calculated according to BI theory and unified theory analysis in guinea pig tracheal rings. ΔE data are expressed as mean ± SD from experiments performed using samples from148
A Predictive Model To Explore The Effects Of Physicochemical Properties On MeshNebulisation
Annabel Flook1, Daniel Lock1 University of Bath, Claverton Down, Bath, BA2 7AY
Summary
Understanding the effects of three physicochemical properties of formulations: surface tension, conductivity and viscosity, on vibrating-mesh nebulisation has previously employed a ‘one variable at a time’ (OVAT) approach. These formulations have used a ra nge of components as physicochemical property modifiers and, as such, inter- and intra-literature comparisons are unsuitable for the exploration of physicochemical property interactions and their influences on nebulisation. Using Design of Experiment (DoE) methodology, a predictive model has been developed to parameterise and independently adjust the three physicochemical properties in the form of a generic formulation. The prepared formulations were hypothesised to replicate the output rate (OR) of any for mulation with equivalent physicochemical properties in Vectura’s FOX® vibrating-mesh nebuliser device. The model successfully mapped three active formulations to their parameterised generic formulations. When nebulised, two generic formulations adequately replicated the OR of their active counterparts (a proteinbased formulation and a mucopolysaccharide) , whereas one generic and active formulation pair (a small molecule formulation) showed a large difference in OR. Therefore, the three physicochemical prop erties alone were deemed unsuitable as predictors of OR for every formulation. The impact of viscosity on OR was also assessed. When comparing formulations comprising of the same components (the generic formulations), a strong linear relationship was obser ved. However, this relationship was not applicable to formulations comprising of differing components (the active formulations) and suggest caution should be exercised when comparing the OR of different formulations with respect to their physicochemical properties. Alternative properties, such as interfacial tension, should be explored to fully understand nebulisation and advance formulation development approaches.
Key Message
Three generic formulations were prepared to mimic the physicochemical properties : viscosity, surface tension and conductivity of three active formulations. When nebulised, they did not always show comparable output rates, suggesting alternative physicochemical properties may give a better indicator of a formulation’s nebulisation performance, leading to improved formulation development.
Introduction
A fast nebulisation rate (referred to as output rate, OR) is desirable for increasing patient compliance by improving quality of life and is deemed a critical quality attribute of nebuliser performance [1] Vibratingmesh nebulisers (VMNs) are considered suitable for the delivery of a range of formulation technologies and molecule classes [2, 3], but achieving a suitable OR is highly dependent on the physicochemical properties of the formulation being nebulised [ 1, 3]. There have been several significant attempts to understand the effects of formulation properties on the nebulisation mechanism and current research highlights three physicochemical properties: viscosity, surface tension and ion concentration, as the fundamental fluid properties impacting mesh -nebulisation [ 1, 3, 4]. Understanding the relationship between these formulation properties and nebulisation is essential for optimising drug delivery via inhalation.

Drug Delivery to the Lungs , Volume 32, 2021 – Annabel Flook et al.
149
Figure 1 - The statistical model, developed using DoE, allowed for the prediction of four component proportions required to create a solution with pre-defined physicochemical properties, and vice versa.
Drug
- A Predictive Model To Explore The Effects Of Physicochemical Properties On Mesh-Nebulisation
The effects of viscosity [1, 3, 5], conductivity (or ion concentration) [3, 4, 6] and surface tension [3, 4, 7] on OR have been previously explored in literature. However, making comparisons between literature results is exceptionally challenging due to the variati on between the formulation components, both within and between studies. Due to the complexity of fluid systems , and the difficulty of independently altering one physicochemical property whilst holding the others constant, the interactions between these properties have not comprehensively been assessed . Hence, the mechanism of nebulisation has not been fully described. As the identified physicochemical properties are founded in fluid intermolecular interactions, work to understand the inter -factor interactions may be hugely beneficial for meshnebulisation optimisation, with one author concluding that ‘a greater understanding of their role in nebulization performance is a large part of the puzzle towards improved nebulization therapies’ [ 3].
This paper aims to take the first step towards understanding this puzzle, specifically in how the aforementioned properties influence mesh-nebulisation, using Vectura’s FOX® device. Previous studies have estimated the ranges within which successful nebulisation is expected to occur An applied statistical approach, in a Design of Experiments (DoE) study has been used to parameterise a generic formulation containing specific components, in terms of surface tension, viscosity and conductivity , as visualised in Figure 1 The proposed parameterisation was carried out using a mixture design DoE study, an effective method in mapping the proportions of a formulation components with a mathematical constraint of summing to unity [8]. Several types of mixture design exist, each capable of dealing with the various restrictions and constraints that can arise when preparing formulations [9] and a custommade design is often necessary to align with the aims of the experiment. A successful model has provided valuable insight into formulation nebulisation behaviour in the FOX® device, and will help to direct formulation development decisions to achieve successful drug/device combination products as well as acting as a tool for use in further research.
Experimental
Materials: NaCl (USP Grade) and poly(ethylene glycol) (PEG, average mol wt 8,000) were purchased from Sigma-Aldrich (Gillingham, UK). Propan-2-ol (IPA, 99.5 %) was obtained from Fisher Scientific (MA, US). Deionised water was produced in-house using a Millipore Milli-Q system (MerckMillipore, MA, US). One FOX® device and three vibrating-mesh nebuliser heads (NHs) were manufactured by Vectura, Chippenham, UK. The pore size of the NHs was assessed at manufacture and NHs with a volume median diameter (VMD) of 4.1 μm ± 0.1 μm were selected
Preparation of Solutions: NaCl (10% w/v) and PEG (10% w/v) Stock Solutions: 10.00 g (± 0.01 g) of solid material was dissolved in 100 mL of deionised water. Generic Formulations : Each fluid component was added volumetrically, according to the proportions calculated by JMP Software, and inverted several times to ensure thorough mixing.
General Physicochemical Characterisation : All measurements were performed at room temperature (21 °C ± 1 °C) and the results were calculated as a mean of three measurements. Where this differs, an additional statement is added. Viscosity: Viscosity measurements were carried out using an m -VROC Viscometer (Rheosense, CA, USA) at 25 °C (± 0.15 °C). Samples were measured at a rate to o btain 20-90 % full-scale pressure and the apparent dynamic viscosity was recorded. Surface Tension: Surface tension measurements were conducted with a Sigma 700 Force Tensiometer (Biolin Scientific, Gothenburg, Sweden), using a de Noüy ring method. The Sig ma 700 Force software package was used to calculate the dynamic surface tension for 10 measurements. The surface tension of each formulation was calculated as the mean of the last five measurements. Prior to each analysis, the de Noüy ring was cleaned with n-hexane and dried under a flame. Conductivity: Conductivity measurements were performed using a conductivity probe (Mettler Toledo, Leicester, UK). Each formulation was decanted into three vials. Upon insertion of the probe, the system was stirred for se veral minutes before a reading was taken.
General Aerosol Characterisation : All aerosol testing was carried out in triplicate, with a 1 mL fill volume and a flow rate of 15.00 ± 0.5 L min-1. All experiments were conducted at room temperature (21 °C ± 1 °C), with a relative humidity between 40-60 %. Output Rate Determination: As the FOX® device is breathactuated, a simulated breath was required and set for a four second duration. The delivered dose was determined gravimetrically by taking the difference bet ween the mass of the assembled device prior and post-nebulisation. The number of breaths were recorded as the number of simulated breaths before the device empty detected and automatically turned off. The output rate was calculated using Equation 1.
Lungs , Volume
2021
Delivery to the
32,
OR (g min 1 ) = Dose delivered (g)∗ 60 s min 1 (Nebulisation duration per breath (s) ∗ Number of breaths) (1) 150
Experimental Design (DoE): The response variables were defined as the three physicochemical properties known to influence successful nebulisation: su rface tension, viscosity and conductivity. The range of the design space was determined by previous internal research. A constrained mixture design was established with the components and response variables. The DoE platform provided with the statistical software, JMP (SAS Institute) and all experiments were randomised. The proposed design comprised of 12 experimental generic formulations, including one centre point to identify two -way interactions and three replicate points to allow analysis of lack of fit . For each response variable, all experiments were conducted on the same day and as such, further design modifications to estimate day-to-day variance was considered unnecessary. Model Analysis: A regression model was fit to the experimental data for each response variable, using stepwise multiple linear regression with an Akaike Information Criterion corrected for a small sample size (AICc) to select the best model. Verification of each model was carried out with an additional 15 generic formulations using physicochemical properties across the known range of successful nebulisation. The proportions required for each verification experiment were generated using the model. The actual and predicted physicochemical properties were compared to the calculate d model prediction intervals to assess model accuracy Model Use: Three formulations containing active drug substances were identified and their physicochemical properties were mimicked using the developed model. The generic formulations were prepared, and the physicochemical properties and nebulisation characteristics of each were compared to internal data on the active counterparts. Statistical Analysis : Data is presented as mean (± S.D.). Statistics were prepared using JMP software and significance was determined to the p < 0.05 confidence interval.
Results and Discussion
A model was designed and verified to predict the proportions of four components (10 %w/v NaCl, 10 %w/v PEG, IPA and deionised water) required to produce a ‘generic formulation’ of pre -specified values of the identified physicochemical properties (surface tension, viscosity and conductivity). The accepted predictive model was used to mimic the physicochemical properties of three inhalation formulations containing an active substance. The a ctive formulations were selected so as to cover some classes of drug molecules that are commonly nebulised and are described as a mucopolysaccharide (MPS), a small molecule (SM) and protein-based formulation (PBF).
It was established that the three generic formulations were acceptable matches to the physicochemical properties of their active counterparts, the results of which are summarised in Table 1
The literature suggests that the three selected physicochemical properties are the most important in nebulisation and it was expected that generic formulations would perform comparably to the actives in the FOX® device. OR assessment of each generic and active formulation pair was carried out and the comparisons are shown in Figure 2. There is no discernible difference between the average output rates of the MPS pair, however variability in performance observed between them was noted as being potentially different, and the small disparity (0.03 g min-1) between the PBF pair is not acknowledged as unusual for the vibrating -mesh nebuliser device. A larger sample size is required to assess the significance of these r esults.
Conversely, the output rates of the active and generic SM formulations show a considerable unexplained difference (0.41 g min-1) which cannot be reasonably attributed to physicochemical property differences, nor the approximation of the active formulation surface tension. The observed difference in performances suggests that, contrary to the literature, the three selected physicoc hemical properties are not always suitable for assessing and predicting nebulisation characteristics, despite the positive MPS and PBF results.
Drug Delivery to the Lungs , Volume 32, 2021 – Annabel Flook et al.
Viscosity /mPa s (± S.D) Surface Tension /mN m-1 (± S.D) Conductivity /μS cm-1 (±S.D) Active MPS 2.2a 49a 23200a Generic MPS 2.1 (0.0) 47 (0) 27600 (0) Active SM 1.2a ~60a 3570a Generic SM 1.2 (0.0) 61 (0) 4600 (0) Active PBF 1.6a 48a 44640a Generic PBF 1.5 (0.0) 45 (0) 45700 (0)
Table 1: Physicochemical properties of formulation pairs (a – data obtained from internal Vectura reports )
151
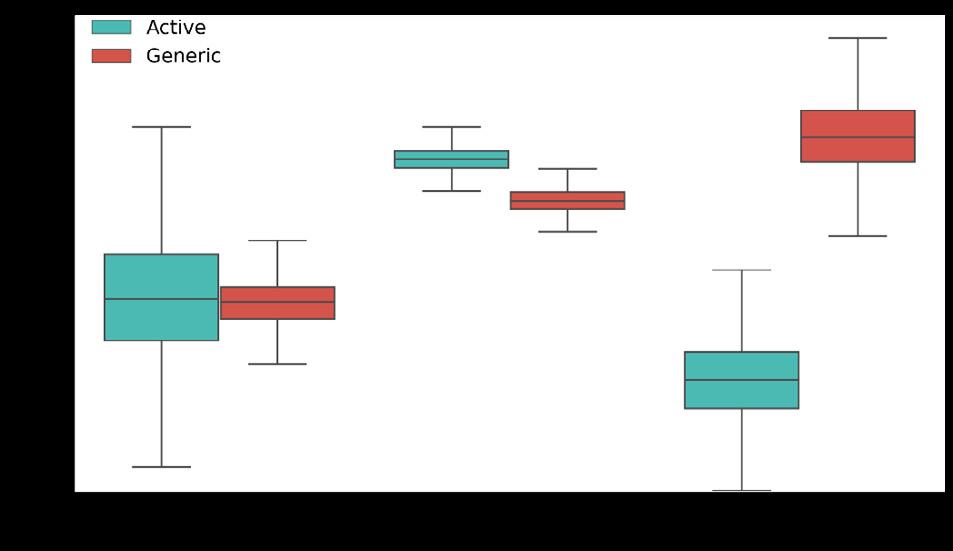
A possible explanation arises if the interfacial tension at the mesh/formulation interface is considered. As the surface tension is measured dynamically, the equilibrated surface of the SM active is not represented by the model and the mesh/mixture interfacial tension is not considered as a factor. As such, the model mathematics would be lacking in the necessary information required to model formulations in which a wetting or non-wetting behaviour may cause deviations in nebulisation performance. In practise, such deviations may arise when using an organic-based solvent to improve solvation or a modifier that changes orientation of molecules at the liquid/mesh interface, altering the surface composition at equilibrium. These deviations should be acknowledged when attempting to compare the nebulisation of multi-component formulations, as it is apparent the OR of one formulation (with specified physicochemical properties) may not be useful in guiding the development of a second formulation with differing components.
Conclusion
A predictive model, developed with a DoE methodology, can parameterise a generic formulation with four components in terms of three physicochemical properties: surface tension, conductivity, and viscosity. This model was used to successfully mimic the physicoche mical properties of three active formulations and further development will be a useful tool in exploring nebulisation characteristics and deviations thereof. The generic formulations were able to replicate output rate, a key factor in assessing nebulisation success, in two of three instances. One active formulation was poorly represented by its generic equivalent and the measured physicochemical properties were postulated to be aliasing more complex interfacial interactions. These interactions may be bette r characterised by measuring properties, such as interfacial tension at the formulation/mesh interface. This model also illustrates how formulations with differing components should be compared with caution, especially in formulation development, where modifications for the purposes of stability or solubility can drastically alter nebulisation performance regardless of similarities between the selected physicochemical properties. An alteration of this model, encompassing excipients employed in innovated inh aled pharmaceutical products as the components, may allow for increased efficiency for formulation development for further complex formulations for nebulisation
References
1 T. C. Carvalho and J. T. McConville, J. Pharm. Pharmacol., 2016, 68, 556–578.
2 R. Respaud, D. March and C. Parent, mAbs, 2014, 6, 1347–1355.
3 T. Ghazanfari, A. Elhissi, Z. Ding and Kevin. Taylor, Int. J. Pharm., 2007, 339, 103–111.
4 M. Najlah, A. Vali, M. Taylor, B. T. Arafat, W. Ahmed, D. A. Phoenix, K. M. G. Taylor and A. Elhissi , Int. J. Pharm., 2013, 456, 520–527.
5 A. Hibbitts, L. Tajber and R. Macloughlin, in Int Soc Aerosol Med. 19th International Congress , 2013.
6 T. C. Carvalho, J. P. McCook, N. R. Narain and J. T. McConville, J. Liposome Res., 2013, 23, 276–290.
7 M. Beck-Broichsitter, M.-C. Knuedeler, N. Oesterheld, W. Seeger and T. Schmehl, Int. J. Pharm., 2014, 459, 23–29.
8 D. Montgomery, Design and Analysis of Experiments, Wiley, 8th edn., 2013.
9 Y. Buruk Sahin, E. Aktar Demirtaş and N. Burnak, PAJES, 2016, 22, 297–304.
Drug Delivery to the Lungs , Volume 32, 2021 - A Predictive Model To Explore The Effects Of Physicochemical Properties On Mesh-Nebulisation
Figure 2: Output Rates for active (blue) and generic (red) formulation pairs
152
Jonathan Marie, Bruno LE CORRE & Claire CANNETTE
APTAR PHARMA Route des Falaises 27100 Le Vaudreuil France
Summary
Thermo Plastic Elastomers (TPEs) are used for the manufacturing of inhalation devices in the pharmaceutical industry. Antioxidants are often added to the plastics to prevent the degradation of the polymers or to protect them during the molding process . Due to the influence of different factors such as oxidation (e.g. air, water), these antioxidants may be degraded to form oxidation degradation products, which could migrate into the drug formulation as leachables. It is thus very important to identify these potential degradation products to verify the absence of any toxicity risk for patients. The work herein details, through the sample preparation and analytical LCMSQTOF analysis process, how such degradation products have been identified. The comparison of several extraction techniques for sample preparation are presented. This case study uses a novel thermo -plastic elastomer, COC 920, a low extractable, low water vapor transmission and efficient static leakage barr ier material used in Aptar Metered Dose Inhalers (MDIs).
Key Message
Potential extractables from a novel TPE gasket used in MDIs were isolated by various extraction techniques and identified.
Introduction
The materials used for the construction of Metered Dose Inhalers are mainly plastic polymers and elastomers. Figure 1 illustrates the different type of components in such a device.
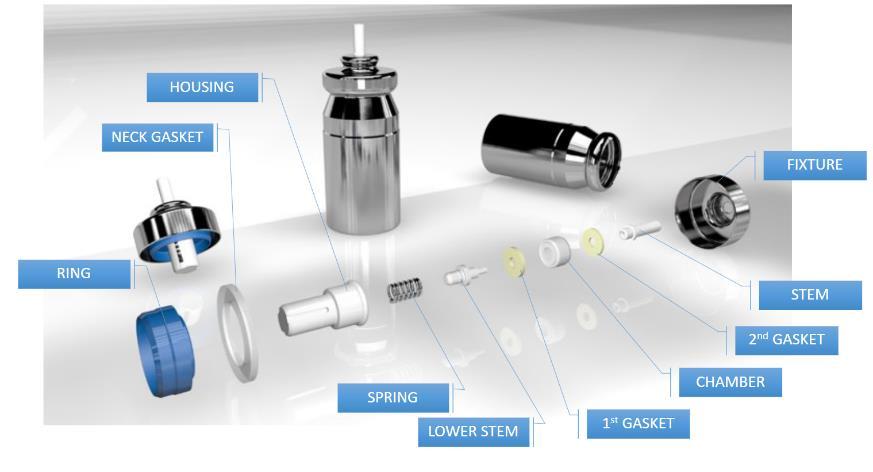
Polymers contain chemical substances i.e. additives that have the property to migrate into the can which contains the formulation active pharmaceutical ingredient(s) in suspension or solution.
Those extractables, are often antioxidants which may be degraded as oxidation related products. Although the main antioxidants have been studied over the last two decades in term of toxicity, it remains difficult to identify and assess the toxicity of the corresp onding degradation products [1]
Drug Delivery to the Lungs , Volume 32, 2021 - Jonathan Marie
Identification of potential antioxidant degradation products as Extractables from an innovative Thermo Plastic Elastomer used in Metered Dose Inhalers
Figure 1. Components description for a usual Metered Dose Inhaler
153
Drug Delivery to the Lungs, Volume 32, 2021 - Identification of potential antioxidant degradation products as Extractables from an innovative Thermo Plastic Elastomer used in Metered Dose Inhalers
This study involved the use of several extraction solvents and techniques for sample preparation and ultra high performance liquid chromatography coupled with tandem quadrupole - time of flight mass detector (LCMSQTOF) for the detection and identification of non-volatile extractables. A methodology of quantification was defined according to the level of identification obtained for the non-volatile extractables
The investigation was conducted for a novel material, a cyclic olefin copolymer elastomer (COCe) used for the manufacturing of the neck gasket, which creates a strong barrier against moisture. In this study related to non-volatile compounds, the detection of degradation products of Irganox 1010 were identified and investigated This antioxidant is commonly used as plastic additive for pharmaceutical application and the oxidation of this large molecule can le ad to several degradation products. Sample preparation was a crucial step for extractable detection and quantitation. Further, the extraction technique used must be sufficiently efficient to allow the extraction of the maximum of the chemical substances pr esent in the polymer, according to European[1] and US Pharmacopeia[3], and PQRI guidelines[4].
Materials and Methods
The COCe Polymer material is submitted to aggressive extraction conditions using solvent s of different polarities such as water, alcoholic, alkane and chlorinated solvents
Among all the extraction techniques available at laboratory scale, the following techniques are used at Aptar Pharma to perform the chemical characterization of Polymers:
- Reflux extraction,
- Microwaves oven extraction,
- Pressurized extraction (Accelerated Solvent Extraction or ASE)
The optimized extraction conditions consist ed of 2g of material extracted into 25mL of a dichloromethane
The identification of the compounds involved analysing of the extracted solution using UHPLC/MSQTOF Atmospheric Pressure Chemical Ionization (APCI) and ElectroSpray Ionization (ESI) . Ionization modes in positive and negative polarities is used to detect and identify the maximum number of chemical substances The mass data is acquired simultaneously in MS and MS/MS scans obtained at 10, 20 and 40 eV. Identification of extractable compounds is conducted using an Agilent 6545A QTOF Mass detector coupled with an Agilent 1290 Infinity II UHPLC and PDA detector.
Results
The extractable results for COCe material extracted with various techniques are presented in Tables 1 and 2
Extractables (µg/g of material) Extraction Technique Total Irganox 1010* Unknown peak 1 Unknown peak 2 Unknown peak 3 Unknown peak 4 Reflux 281 6 4 15 7 Microwaves at 45°C 267 6 4 13 7 ASE at 45°C 296 6 4 15 7 *Total of Irganox 1010 and its two degradation products detected in a reference solution
and Degrad 2 in figures below) 154
Table 1. Extractables results with various extraction techniques
(named as Degrad 1
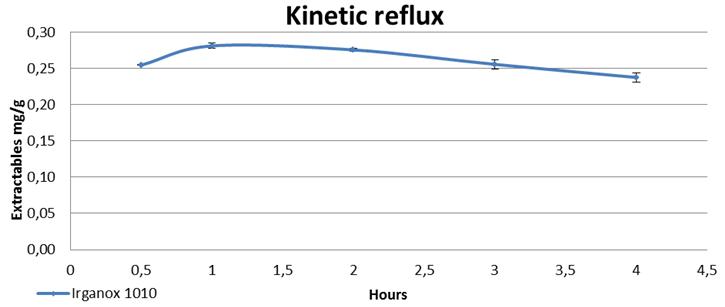
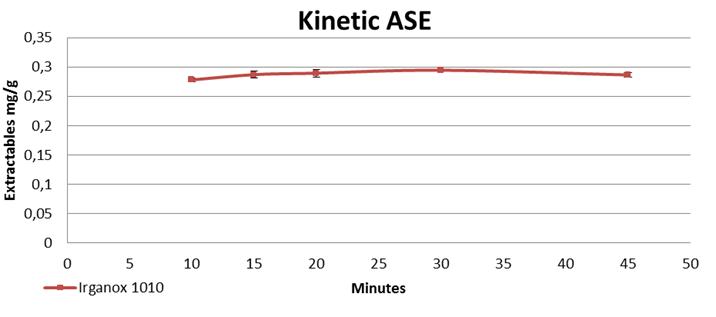
Higher amounts of extractables were obtained with Reflux and ASE and four unknown entities (peaks) were detected along with Irganox 1010. The optimum extraction time with Reflux was one hour while only 15 minutes were sufficient with ASE to obtain the same amounts of extractables.
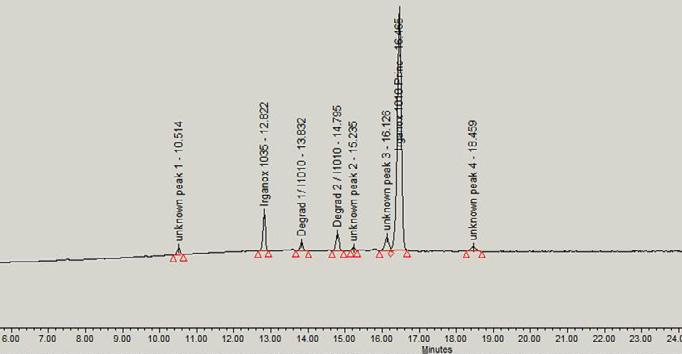
Drug Delivery to the Lungs , Volume 32, 2021 - Jonathan Marie
Figure 2 Reflux and ASE extraction kinetics results
155
Figure 3. HPLC/UV Chromatogram
ISTD
Drug Delivery to the Lungs, Volume 32, 2021 - Identification of potential antioxidant degradation products as Extractables from an innovative Thermo Plastic Elastomer used in Metered Dose Inhalers
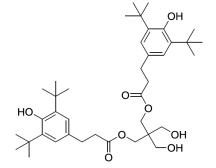
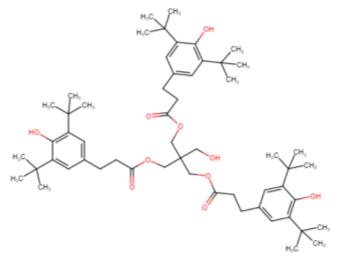
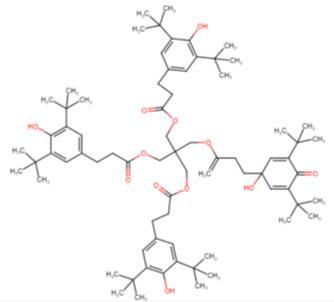
Discussion
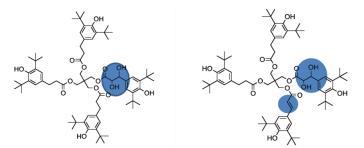
The analytical work conducted with the QTOF detectors allowed to confirm the identification of unknown peak 1 as a degradation product of Irganox 1010 antioxidant, and to propose confident identification for unknown peaks 2, 3 and 4. Although an uncertainty remains regarding the position of some functional groups on the molecule, it is certain that, based on the comparison of molecular structures, these three last compounds are related to Irganox 1010.
Conclusion
Solid/Liquid extraction using either reflux or pressurized extraction techniques coupled with a high resolution technology (LC/MS-QTOF analysis) allowed identification of some specific degradation and derivative products from the antioxidant Irganox 1010 in an innovative thermo plastic elastomer used in a MDI at Aptar. The use of high resolution technology have important advantages on the sensibility and the structural elucidation compare to LC/MS system using a simple quadrupole analyzer.
Table 2. Extractables identification by LC/MS-QTOFPeak# Retention time (min) Molecular structure Molecular Weight (g.mol-1) Formula Unknown Peak 1 10.514 656.4288 C39H60O8 Degrad 1 / I1010 13.832 916.6065 C56H84O10 Degrad 2 / I1010 14.795 1192.7790 C73H108O13 Unknown Peak 2 15.235 1208.7739 or 1206.7583 C73H108O14 or C73H106O14 Unknown Peak 3 16.126 1192.7790 C73H108O13 Irganox 1010 16.465 1176.7841 C73H108O12 Unknown Peak 4 18.459 1815.1812 C115H162O17 156
This particular COCe contains less extractables than usual elastomers. The next stage of this investigation will be to work on the quantification process, as some of the detected compounds are not commercially available and the position of some functional groups not yet defined.
References
1. “Extractable data mining from various polymeric product contact manufacturing materials ”, Ping Wang E&L London 2019
2. “Guideline on the Pharmaceutical Quality of Inhalation & Nasal Products” Document reference : EMEA/CHMP/QWP/49313/2005 Final Corr. Effective Oct -1-2006
3. United States Pharmacopeia (USP) : <1663> Assessment of Extractables Associated with Pharmaceutical Packaging/Delivery Systems
4. The Product Quality Research Institute (PQRI) Leachables and Extractables Safety Thresholds and Best Practices for Extractables and Leachables in Orally Inhaled and Nasal Drug Products , 8 September 2006.
Drug Delivery to the Lungs , Volume 32, 2021 - Jonathan Marie
157
158
M. Mehta1, E. Sternberger-Ruetzel1, H. Peters.2 & O. Imole3
1Harro Höfliger Verpackungsmaschinen GmbH , Helmholtzstraße 4, 71573 Allmersbach i.T, Germany
2DFE Pharma, Transistorweg 5, 6534 AT Nijmegen, The Netherlands
3Hosokawa Micron B.V., Gildenstraat 26, 7005 BL, Doetinchem, The Netherlands
Summary
Filling low amount of powders for inhalation into blisters is a challenging process. Limited knowledge is available on the use of magnesium stearate as ternary agent in inhaled formulations and its effect on the filling of powders into the blisters. A study was initiated to understand the interaction of lactose fines and magnesium stearate on the flow and the filling of powders into blisters. The particle size fraction below 30µm showed a strong correlation with the compressibility and permeability of the lactose and lactose magnesium stearate blends. An increase in this fraction increases the compressibility , permeability and the fill weight of the powders. Blends having permeability values higher then 6, consistently showed lower relative standard dev iation values (below 3.0%) in fill weight. This insight will help to develop robust dry powders for inhalation
Key Message
Strong correlations have been found between lactose particles below 30µm and compressibility as well as permeability for blends with and without magnesium stearate. For the membrane fill ing systems, permeability and compressibility are important parameters to tune the relative standard deviations and mean fill weight
Introduction
Dry powder inhaler (DPI) formulations traditionally contain lactose as single excipient Newer formulations entering the market contain besides lactose also magnesium stearate [1] The role of magnesium stearate in DPI formulations have been described as a lubricant [2], performance enhancer [3], water barrier [4], force control agent [5] and stabilizer [6]. While there are differences in literature in the interpretation of the role of magnesium stearate, there is a general consensus on its overall benefits in improving DPI formulations.
Number of studies have been conducted looking at the interplay of vario us lactose-based formulations and machine operating variables on specific types of automatic capsule filling machines [7]. However, for membrane filling technology there is limited understanding about the correlations between blend flow properties and filling consistency Furthermore, addition of magnesium stearate into the formulation would lead to further complexities. The current research focuses on the influence of lactose with different coarse and fines ratios and a fixed fraction of magnesium stearate on the flow and filling properties of the blends using membrane filling technology
Material and methods
Lactose: Four different standard Lactohale (LH) products, all from DFE Pharma (Borculo, The Netherlands), were used in the study with LH206 as the coarse carrier and LH300 (D50 of 4 micron), LH230 (D50 of 9 micron) and LH210 (D50 of 16 micron) as the fine lactose fractions. Magnesium stearate LIGAMED MF-2-V PREMIUM sourced from Peter Greven, (Germany) was used.
Blending: The lactose preblends were prepared using a Nauta conical screw blender (Hosokawa Micron B.V.). The Nauta is a low intensity (0.5-2 m/s), convective blender. Axial mixing in the Nauta is achieved by a rotating screw which gently lifts the powder up. An orbiting arm ensures mixing in the tangential direction (see Figure 1). The ratio of coarse and fines is as shown in Table 1. Thereafter, 1% magnesium stearate was blended with the pre-blended lactose using a 1-liter Cyclomix (Hosokawa Micron B.V). The Cyclomix is a high shear blender and its working principle has been described in literature [8] Blending speed and time were 498 rpm and 15 minutes respectively.
Characterization of blends: The particle size distributions (PSD) of the pre -blends were measured using Sympatec Helos laser diffraction instrument in conjunction with Rodos dry powder dispersing system and Vibri powder feeder (S ympatec GmbH, Germany) at a disperser pressure of 1.5 bar. In addition to considering the traditional percentiles D10, D50 and D90 in the analysis of the PSD, the Q30 (particle fraction below 30 µm) was also considered . It has been shown in earlier work th at the properties of the blend can be influenced by tuning the fraction of fines [ 9]. The powder flow and fluidization properties
Drug Delivery to the Lungs , Volume 32, 2021 – M Mehta et al. Understanding
impact of fines on flow behavior of lactose blends with and without magnesium stearate and its impact on filling using membrane filling technology
159
Drug Delivery to the Lungs , Volume 32, 2021 - Understanding impact of fines on flow behavior of lactose blends with and without magnesium stearate and its impact on filling using membrane filling technology were characterized using the FT4 powder rheometer (Freeman Technology, Welland, UK). In particular, the focus was on measuring the compressibility (change in a powder’s density as a result of a directly applied consolidating load) and permeability (resistance to air flow between particles and through the powder bed) of the different blends. For all these tests, a stress of compressive stress of 15kPa was applied.
Filling: To investigate the powder filling properties, the blends were filled into blisters using a membrane filler (SSP2, Harro-Höfliger Verpackungsmaschinen GmbH, Germany), as illustrated in Figure 2. The membrane filling consists of a filling head with powder hopper and small powder transfer nozzles, which are incorporated into the membrane surface. The filling head moves downwards onto the aluminum foil web and each blister is hermetically sealed onto the membrane surface. By means of vacuum , the air in a blister evacuates through the membrane which makes powder flow through the nozzle into the blister cavity until it was 100% filled to the rim. From the tests, the mean fill weight was calculated and recorded.
Results and discussions
Lactose preblends as well as lactose blended with magnesium stearate were characterized for particle size distribution and results are shown in Table 1.
Figure 1 Schematic representation of The Nauta blender used to prepare the lactose pre-blends (left) and the Cyclomix high shear blender for blending the different lactose grades with magnesium stearate (right) Figure 2. Schematic representation of the working principle of the membrane fillerType of fines Ratio coarse/fines (%w/w) Particle size without magnesium stearate Particle size with magnesium stearate D10 (µm) D50 (µm) D90 (µm) Q30 (%) D10 (µm) D50 (µm) D90 (µm) Q30 (%) LH210 (90:10) 9.2 70.2 131.0 21.1 18.1 76.1 133.0 15.5 (80:20) 5.1 55.4 124.5 32.3 5.2 61.0 128.1 29.2 (70:30) 3.9 41.1 119.0 41.2 3.3 46.6 120.5 40.2 LH230 (90:10) 4.7 67.3 130.7 27.3 8.5 76.9 133.8 17.9 (80:20) 2.9 46.7 122.8 42.1 2.4 51.5 123.6 39.7 (70:30) 2.3 20.3 114.9 55.4 1.9 25.9 117.8 51.9 LH300 (97,5:2,5) 6.9 77.3 120.6 15.7 30.5 81.9 134.3 9.8 (92,5:7,5) 2.5 67.5 116.8 26.9 2.8 73.1 133.6 21.8 (87,5:12,5) 1.8 54.6 110.8 38.1 1.7 61.3 129.4 33.6 160
Table 1 : Particle size data of the various lactose and magnesium stearate blends.
In all cases, it was observed that as the lactose fines increases, particle size of the blends decreases. This was evidenced by the decrease in D10, D50 and D90 and increase in Q30 values. Addition of magnesium stearate (D50, 9µm) into the lactose blends resulted in increase in the particle size. This could be due to coating effect and also due to agglomeration s. However, this feature was not observed for the blends with high lactose fines ( LH210 80:20 and 70:30) and LH230 (80:20 and 70:30) , where a decrease in D10 values was observed. This observation was not clearly understood and requires further investigations.
Flow properties for all the blends were measured using FT4 Rheometer In case of plain lactose preblends, with the increase in lactose fines concentration (Q30 µm), an increase in permeability and compressibility was observed Similar trends were observed after addition of magnesium stearate. However, when lactose blends blended with magnesium stearate were compared to plain pre-blended lactose, compressibility values decreased while permeability values were observed to be increased (Fig 3 and 5) In case of permeability, lactose blended with magnesium stearate blends LH206:LH210 and LH206:LH230 with 70:30 ratio could not be measured due to high cohesiveness of these blends.
LH206:LH300 (87.5:12.5)
All the blends were filled into the blisters using membrane filling technology. It was observed that powders with low fines concentration have higher relative standard deviations. With low fines concentration, powders have more flowability This prevents powder compaction inside the nozzle of the membrane filler leading to poor control on filling, leading to high relative standard deviations. In case
Drug Delivery to the Lungs , Volume 32, 2021 – M Mehta et al.
Figure 3– Relation between particle size below 30 micron and the compressibility of the blend (•) Lactose without magnesium stearate, (o) Lactose with magnesium stearate.
Figure 4 – Relation between compressibility and the fill weight of the blends (•) Lactose without magnesium stearate (o) Lactose with magnesium stearate.
Figure 5 – Relation between particle size below 30 micron and the permeability of the blends (•) Lactose without magnesium stearate, (o) Lactose with magnesium stearate.
Figure 6 – Relation between permeability and the RSD of the fill weight of the blends (•) Lactose without magnesium stearate, (o) Lactose with magnesium stearate.
y = 0.5326x + 3.1207 R² = 0.9698 y = 0.2396x + 3.4724 R² = 0.8127 0 5 10 15 20 25 30 35 0 10 20 30 40 50 60 Compressibility (%) Lactose below 30 µm (%) lactose without magnesium stearate lactose with magnesium stearate y = 0.0978x + 9.9218 R² = 0.7424 y = 0.2953x + 11.909 R² = 0.5235 8 10 12 14 16 18 20 22 0 5 10 15 20 25 30 35 Fill weight (mg) Compressibility (%) lactose without magnesium
magnesium
y = 0.4469x - 6.1226 R² = 0.9415 y = 0.2396x + 3.4724 R² = 0.8127 0 5 10 15 20 25 0 10 20 30 40 50 60 Permeability 15 Kpa (mbar) Particle size below 30 µm (%) lactose without magnesium stearate lactose with magnesium stearate 0 1 2 3 4 5 6 7 8 9 10 0 5 10 15 20 25 RSD fill weight (%) Permeability 15 KPa, (mbar) lactose with magnesium stearate lactose
magnesium stearate
stearate lactose with
stearate
without
161
Drug Delivery to the Lungs , Volume 32, 2021 - Understanding impact of fines on flow behavior of lactose blends with and without magnesium stearate and its impact on filling using membrane filling technology of lactose powder blends blended with magnesium stearate, pre -blends with low fines concentration specifically, LH206:LH210 (90:10) and LH206: LH300 (97.5:2.5) were not possible to fill, due to good flowability of these powders. However, remaining blends showed good filling consistency with relative standard deviation (1.87 - 2.89%).
Correlation were developed linking lactose PSD specifi cally Q30 to flow properties (compressibility and permeability). Further, the graphs were also plotted correlating the flow properties (compressibility and permeability) to mean fill weight data and relative standard deviations of the filled powders. Good correlations were observed between the Q30 and compressibility and permeability in both plain preblended lactose as well as lactose pre -blends blended with magnesium stearate (Fig 3 and 5). In case of dry powder inhalers, it is well known that the fine lactose particles such as particle below 4.5 µm have strong correlation with the fine particle fractions [9]. However, based on the correlation data, focusing on Q30 can also assist in modulating the flow properties of the powder which can have direct impact of filling as well as powder aerosolization from the device. Good correlation was observed between compressibility and mean fill weight for plain preblended lactose (Fig 4). However, poor correlation was seen in case of pre-blended lactose further blended with magnesium stearate. This lower correlation was due to batch with high concentration of micronized lactose LH206: LH300 (87.5:12.5), wherein observed mean fill weight was lower than expected (Fig 4). This lower fill weight could be due to agglomeration of the over amount of lactose fines with magnesium stearate, resulting in more void space and lower fill weight. Excluding this batch, the observed correlation between mean fill weight and compressibility was around (R2 – 0.9314). With regards to correlation between permeability and relative standard deviations, good trends were observed in both plain preblended lactose as well as preblended lactose further blended with magnesium stearate. Blends having permeability values hig her then 6, consistently showed lower relative standard deviation values (Fig 6). However, blends with poor permeability either were not possible to fill or showed higher relative standard deviations. This could be due to good flowability of the powder, which leads to poor compaction of the powder in the nozzle of the membrane filler
Conclusions
The study demonstrated good correlations between PSD of the blends, flow properties and filling performance. In case of membrane filling systems, it was observed that the powder characteristics has strong influence on the filling results. Particle size distribution and flow properties changed significantly after addition of magnesium stearate and the impact was clearly seen on mean fill weights and RSD during filling. However, filling behaviour can be further optimized by modulating particles below 30 µm. More mechanistic understanding is required to explore interactions between lactose and magnesium stearate Further studies are planned to understand the effect of blending speed and time and its impact on extent of magnesium stearate coating and its interactions on lactose surfaces.
References
[1] Shur J, Price R, Lewis D, Young P, Woollam G, Singh D, Edge S: From single excipients to dual excipient platforms in dry powder inhaler products, Int J Pharm 2016; 514: 374–383
[2] Chiesi P, Pavesi L: New pharmaceutical compositions for inhalation. European Patent 1987; EP 0,239,798
[3] Brambilla G, Ferrarini L, Gill R, Musa R, Staniforth J, Morton D: Pharmaceutical formulations for dry powder inhalers in the form of hardpellets, European Patent 2003; EP 1,274,406.
[4] Guchardi R, Frei M, John E, Kaerger J : Influence of fine lactose and magnesium stearate on low dose dry powder inhaler formulations. Int. J. Pharm 2008; 348: 10–17.
[5] Begat P, Price R, Harris H, Morton D, Staniforth J: The influence of force control agents on the cohesive-adhesive balance in dry powder inhaler formulations . KONA 2005; 23: 109–121.
[6] Monteith M, Thomas M: Pharmaceutical formulations comprising magnesium stearate. European Patent 2006; EP1,643,973.
[7] Eskandar F, Lejeune M, Edge S: Low powder mass filling of powders Drug Development and Industrial Pharmacy 2011; 37(1): 24–32
[8] Rahmanian N, Ng B, Hassanpour A, Ding, Antony, Jia, Ghadiri M, Van der Wel P, Krug-Polman A, York D, Bayly A, Tan H: Scale-up of High-Shear Mixer Granulators, KONA 2008; 26: 190-204
[9] Kinnunen H, Hebbink G, Peters H, Shur J, Price R: An Investigation into the Effect of Fine Lactose Particles on the Fluidization Behaviour and Aerosolization Performance of Carrier-Based Dry Powder Inhaler Formulations AAPS PharmSciTech 2014; 15(4):898-909.
162
Influence of material and capsule filling process with Minima® on aerosolization performances by DPIs
Annalisa Bianchera1, Ayça Altay-Benetti1, Francesca Buttini1, Pietro Pirera2 & Ruggero Bettini11Food and Drug Department, University of Parma, Parco Area delle Scienze 27/a, Parma, 43124 , Italy
2 I.M.A. Industria Macchine Automatiche S.p.A. Unipersonale, Via Emilia 428-442, 40064 Ozzano dell’Emilia (Bologna), Italy
Summary
Material characteristics and filling process have significant consequences on aerosolization performances of DPIs. Different settings of a bench -capsule filler, Minima®, were compared by means of a design of experiment to identify most significant parameters affecting capsule weight among bed powder height, compression and dosage volume. Four types of lactose were used as coarse fraction in binary mixtures with micronized lactose to simulate low dosage API for inhalation. Mixtures with three dosages of fine lactose, namely 2%, 5% or 10% , were prepared for filling capsules, to study aerosolization behaviour of low-dose DPI products, which are of particular interest for lung administration. Data indicate that Minima® provides consistent results, in terms of weight and repeatability. Compression was identified as the main parameter affecting both final weight and emitted fraction after capsule discharging by DPI RS01. On the other hand, the type of raw material mainly influences the fine particle fraction, with Lacto-Sphere® MM50 showing the best performances, with the 2% of fine lactose
Key Message
The effect of capsule filling parameters on emitted dose and fine particle fraction by a DPI was investigated using a table-top device for capsule filling. Compression was the parameter that affected weight and emitted fraction the most, while the type of coarse lactose seems to influence the fine particle fraction.
Introduction
The delivery of drugs to the lungs by dry powder inha lers (DPIs) is strongly influenced by the characteristics of formulation and process parameters involved in capsule filling [1] Powder formulations for inhalation products commonly consist of a binary adhesive mixture between a coarse carrier, typically lactose, and the active principle, to provide appropriate aerosolization performance even in the case of very low dosage drugs [2] Material attributes and filling process parameter s may have a critical effect on dosage uniformity and aerosolization performances of powders. In this work we aimed at analysing, on the material side, the contribution of different types of lactose , and, on process side, the effect of instrumental settings on dose uniformity and aerosolization performances of powder mixtures dosed in hard capsules through a bench-capsule filler, Minima®.
Experimental methods
The first part of this study was devoted to the evaluation of the effects of encapsulation parameters on final capsule weight Capsules were filled by means of a Minima® table-top volumetric capsule filler (IMA S.p.A., - IMA Active Division, Italy), equipped with a dosator having a diameter of 2.5 mm. The effects of encapsulation parameters on capsule filling w ere evaluated by means of a full factorial design of experiment 23 by considering as factors 1) bed powder height, 2) compression, expressed as chamber height from bottom of the sampling cup, and 3) dosage, expressed as mm with respect to internal length of dosing chamber. Two levels for each factor were explored and coded as reported in Table 1.
Drug Delivery to the Lungs , Volume 32, 2021 - Annalisa Bianchera et al.
Input parameter -1 +1 Bed powder height (mm) 15 30 Compression (mm) 0.4 4 Dosage (mm) 6 10 163
Table 1: Coding of levels for variables selected for the 23 DoE
Drug Delivery to the Lungs , Volume 32, 2021 - Influence of material and capsule filling process with Minima® on aerosolization performances by DPIs
Experiments were performed in random order, including replicates and centre points for model validation. These tests were performed with Pharmatose® 125M (DFE Pharma GmbH, Germany). For each setting, six Coni-Snap® hard gelatin capsules size 3 (Capsugel®, Lonza) were filled with the lactose powder. Average weight of the capsules and relative standard deviation (RSD%) were selected as critical quality attributes (CQAs) to be considered as outputs of the design. Data analysis and model computation were performed with the software Chemometric Agile Tool (CAT).
Then, four types of -lactose monohydrate were selected as coarse carriers, namely a fractionate (90125 µm) lactose (Chiesi Farmaceutici), Lactohale® 206, Respitose® ML001 (both from DFE Pharma GmbH, Germany) and Lacto-Sphere® MM50 (Micro-Sphere SA, Switzerland). All types of lactose were sieved through a 38 m sieve for one hour, two times consecutively. Only the fraction retained above this size was used for following experiment s: particle size distribution analysis was performed by laser diffraction (Spraytec, Malvern, UK), to check the efficacy of sieving process as well as to estimate the residual percentage of powder with a diameter below 3 m. These four lactose types were used as coarse fraction for the preparation of binary mixtures in association with micronized lactose (LactoSphere® MM3, Micro-Sphere SA, Switzerland, Dv50 = 3 m), which was selected to mimic the behaviour of a micronized API [3]. Lacto-Sphere® MM3 was added at a final percentage of 2%, 5% or 10% w/w, respectively. All mixtures were prepared by putting the fine lactose between two layers of coarse lactose in a “sandwich” mode, then samples were blended in a Turbula mixer for 40 minutes.
The effect on aerosolization performances was assessed by Fast Screening Impactor (FSI) selecting as outputs emitted fraction and fine particle fraction , while the emitted dose was also determined with a dose unit sampling apparatus (DUSA) Aerosolization was performed using a medium resistance inhaler, RS01® (Plastiape S.p.a., Italy, R= 0,033 kPa 1/2min L-1) for 4 seconds at a flow of 60 L/min (Copley scientific,UK, pressure drop of 4 kPa, air volume of 4 L). The emitted dose was determined as a difference between the weight of device + capsule before and after actuation, while fine particle dose was determined by weighing the amount of powder collected on the filter. Emitted fraction % and fine particle fraction % were calculated from emitted dose and fine particle dose, respectively, as a percentage with respect to loaded dose and emitted dose Data were compared by two-tailed unpaired t-test performed with Microsoft Excel.
Results
The weight of capsules obtained from each setting was measured and the average of six replicates used to calculate a linear regression mode l, as reported in equation 1, where X1 = bed powder height, X2 = compression X3 = dosage. The model was validated at central point.
Coefficients associated to linear terms were highly statistically significant, confirming, as could be expected, that all factors have a critical role on the final weight (Figure 1)
As it can be deduced also by coefficient digits, compression is by far the most relevant factor affecting final weight, as also confirmed by significance of interaction terms involving this parameter. This is also evidenced by response surfaces related to intera ction between compression and bed powder height (Figure 2a) or between compression and dosage (Fig ure 2b).
Average weight= 41.61 + 1.94 X1 + 24.79 X2 + 0.99 X3 + 1.45 X1X2 + 0.48 X1X3 + 1.32 X2X3 (1)
Figure 1 - Significance of coefficients for the regression model related to average weight of capsules
** *** * ** ** -5 0 5 10 15 20 25 30 b 1 b 2 b 3 b 1 2 b 1 3 b 2 3 164
When considering relative standard deviation, this was always below 5% and none of the parameters affected it significantly. This suggested that the filling with Minima® provided consistent results independently on settings and that the regression model could be used to predict the average weight of capsules. A further step of the work was focused on the evaluation of the role of material properties on aerosolization performances. Four raw materials were selected and sieved. Particle size analysis by laser diffraction confirmed the effectiveness of sieving in eliminating the fine particle fraction. Respitose® ML001 had the lowest Dv50 (51.97 m, span 1.73), while the fractionated lactose (115.55 m, span 1.71), Lactohale® 206 (105.12 m, span 1.12) and Lacto-Sphere® MM50 (95.01 µm, span 1.33) had similar Dv50, close to 100 m. Fractionated lactose had a wider size distribution, as evidenced by the higher span value. Th is analysis also allowed the estimation of the amount of residual fraction having diameters below 3 m: for Respitose® ML001, 7.73%, for fractionated lactose 3.89%, for Lactohale® 206 1.92% and for Lacto-Sphere® MM50 1.37%. These values were added to the nominal amount of fines in the mixtures and used to normalize the fine particle dose, indicated as nFPD(%). Evaluation of aerosolization performance by FSI allowed the comparison of the effects of different coarse raw materials on emitted fraction and fine particle fraction (n=10). No significant differences could be found within different types of lactose as well as within different dosages of fine particles in terms of emitted fraction (Figure 3a) As for nFPD(%), a high variability was observed for all mixtures, independently from the type of lactose or amount of fine fraction (Figure 3b). A common trend was observed for all types of lactose with the value of normalized fine particle dose recovered on the filter dec reasing with the increase of the percentage of fine component.
Fractionated lactose was the worst performing in terms of nFPD (%) On the other hand, Lacto-Sphere® MM50 was the best performing at all concentration levels and was for this reason selected for the following experiments The three mixtures were used to fill two Coni -Snap® hard gelatin capsules size 3 with Minima®: two settings were compared. For setting A , dosage was 20 mm and compression was set at 3 mm; for setting B, dosage was 5 mm and no compression was applied. For each setting, 15 capsules were filled, with a target weight of 15 mg. Taking into consideration the emitted fraction, no significant differences could be detected between filling setting A and B for mixtures containing 2% or 5% of fine fraction, while a significantly lower amount of powder was emitted for the mixture with 10% fines filled with method B (p= 0.001) (Figure 4a)
Drug Delivery to the Lungs , Volume 32, 2021 - Annalisa Bianchera et al.
Figure 2 – Response surfaces related to effect of interaction between compression and bed height (a) or dosage (b) on average weight
Figure 3 – Emitted fraction (a) and normalized FPD (%) (b) obtained by FSI analysis of capsules prepared with Minima® starting from four different lactose carriers and at three dosage levels, 2, 5 or 10% w/w
0 50 100 150 Chiesi LH206 MM50 ML001 Emitted fraction (%) 2 5 10 a 0 100 200 Chiesi LH206 MM50 ML001 nFPD (%) 2 5 10 b a b 165
As for FPF% (Figure 4b), no significant differences could be observed among all types of mixtures, independently from the filling method, which could be ascribable to a high variability in results. Nevertheless, filling method A seems to provide more consistent results within different types of mixtures, both in terms of FPF% and variability
A further parameter that was investigated with Minima® was the cup height that was varied by inserting thicknesses of 0.4 mm, 0.5 mm, 0.7 mm, 1 mm or 2 mm below the cap. Dosage was set at 20 mm and compression at 3 mm, as in method A described above. Five capsules were filled with the binary mixture of Lacto-Sphere® MM50 with 10 % of Lacto-Sphere® MM3 at all thicknesses and the relevant aerosolization performance was tested An increasing trend in emitted fraction was observed with increasing thicknesses (Figure 5a), while no specific pattern could be observed with respect to fine particle fraction (Figure 5b).
Discussion and conclusions
The obtained results suggest the reliability of the used table-top device for capsule filling in terms of accuracy and repeatability, even at very low dosing, comparable to those reported in literature for other type of equipment [4]. Compression was identified as the main parameter affecting both final weight and emitted fraction after capsule discharging with RS01. On the other hand, the type of raw material affects the fine particle fraction, with Lacto-Sphere® MM50 showing better performances with the 2% of micronized powders, that is particularly interesting as surrogate low-dose API formulation
References
[1] Faulhammer E, Llusa M, Radeke C, Scheibelhofer O, Lawrence S, Biserni S, Calzolari V, Khinast J G: The effects of material attributes on capsule fill weight and weight variability in dosator nozzle machines, Int J Pharm 2014; 471: pp.332–338.
[2] Della Bella A, Salomi E, Buttini F, Bettini R: The role of the solid state and physical properties of the carrier in adhesive mixtures for lung delivery , Expert Opin Drug Deliv 2018; 15: pp665–674.
[3] Benassi A, Perazzi I, Bosi R., Cottini C, Bettini R: Quantifying the loading capacity of a carrier -based DPI formulation and its dependence on the blending process, Powder technology 2019; 356: pp607617
[4] Faulhamer E, Fink M, Llusa M, Lawrence SM, Biserni S, Calzolari V, Khinast JG: Low -dose capsule filling of inhalation products: Critical material attributes and process parameters, International Journal of Pharmaceutics 2014; 473: pp 617-626
Drug Delivery to the Lungs , Volume
2021
aerosolization performances by DPIs
32,
-
Influence of material and capsule filling process with Minima® on
Figure 4 – Emitted fraction (a) and fine particle fraction (%) (b) obtained by FSI analysis of capsules prepared with Minima® with filling method A or B
Figure 5 - Emitted fraction (a) and fine particle fraction (%) (b) obtained by FSI analysis of capsules prepared with Minima® with different cup height
0 20 40 60 80 100 120 A B Emitted Fraction (%) 2 5 10 a 0 10 20 30 A B Fine particle fraction (%) 2 5 10 b 80 90 100 110 Emtted fraction (%) Thickness (mm) 0 0.4 0.5 0.7 1 2 a 0 5 10 15 Fine particle fraction (%) Thickness (mm) 0 0.4 0.5 0.7 1 2 b 166
Co-amorphization: A formulation strategy for amorphous high dose dry powder to treat lung infections
Bishal Raj Adhikari1, Keith C. Gordon2 & Shyamal C. Das1
1School of Pharmacy, University of Otago, Dunedin 9054, New Zealand
2Department of Chemistry, University of Otago, Dunedin 9016, New Zealand
Summary
High dose antibiotic dry powder has become a treatment approach for effectively treating lung infection in various pathophysiological lung conditions such as cystic fibrosis and non-cystic fibrosis bronchiectasis. This has kindled further interest in reformulating other antibiotics as dry powder to potentially optimize therapeutic outcomes. Among different techniques used for the preparation of such high dose dry powder, spray drying is a promising technique, particularly due to its particle engineering capability However, in many cases, the technique produces particles in an amorphous state which tend to have poor aerosolization and chemical stability. Here, co -amorphization with amino acid was explored as a potential strategy to overcome limitation s associated with spray drying. Ceftazidime, a potent antibiotic against Pseudomonas aeruginosa , was used as a model drug and valine was used as a model amino acid to prepare a co-amorphous system. The formulations were characterized using various known techniques of spectroscopy, microscopy , and thermal analysis. X-ray diffraction and infrared spectroscopy suggested that the ceftazidime -valine (CeV) formulation was amorphous and coamorphization was evident through calorimetry. SEM images suggested increased asperities in CeV formulation. Valine was found to effectively improve the fine particle fraction of spray-dried ceftazidime by 24%. In addition, it improved the chemical stability of the drug by 24%. This study concludes that amino acids can be used to achieve dual edge in terms of aerosolization and chemical stability.
Key Message
To treat lung infections, highly aerosolizable high dose amorphous antibiotic dry powder with improved chemical stability can be prepared by co-amorphization with valine using co-spray drying technique
Introduction
Formulation of high dose dry powder targeting lung infection is gaining momentum [1, 2]. While various techniques such as direct crystallization, milling, etc. have been employed to generate aerosolizable particle, spray drying has emerged as a promising formulation technique pertaining to its reproducibility and particle engineering capability [3-5]. However, many drugs upon spray drying produce amorphous particles which commonly show poor aerosolization and aerosolization stability. In addition, t he chemical stability of the drug molecules can manifest as another problem in amorphous state.
Co-amorphous system refers to a molecular mix of the constituting ingredients [6] Ceftazidime was chosen as the model drug. The molecule forms poorly aerosolizable amorpho us particles upon spray drying. In addition, it exhibits chemical stability issues in amorphous state. The aim of this work was to explore the use of potentially safe endogenous amino acids to engineer the particles via coamorphization. Amino acids being endogenous molecules have the advantage of being non -toxic compared to other excipients and could add to the limited number of approved -excipients which can be used to formulate highly aerosolizable particles for inhalation therapy. Leucine has been widely used to improve aerosolization; however, the use of other amino acids is limited. Valine is another amino acid which is non-polar, hydrophobic, and has a molar volume similar to Leucine. Hence, valine was used as a model amino acid as a part of extensive study exploring use of amino acids in improving aerosolization and chemical stabilization of small molecules in amorphous state.
Materials and method
Materials
Ceftazidime and L-valine were purchased from Xian Leader Biochemical Engineering Co. ltd (Shanxi, China) and Sigma Aldrich (MI, USA).
Preparation of the spray -dried particles
The dry powders for the drug were prepared using Buchi B -290 mini spray dryer (Buchi Labortechnik AG, Flawil, Switzerland). A feed concentration 0.2% w/w (relative to the drug) in water was used and
Drug Delivery to the Lungs, Volume 32 , 2021 - Bishal Raj Adhikari et al.
167
Drug Delivery to the Lungs , Volume 32, 2021 - Co-amorphization: A formulation strategy for amorphous high dose dry powder to treat lung infections
spray dried with valine in 1:1 molar ratio to prepare ceftazidime-valine formulation (Cev) . In addition, a formulation containing only ceftazidime (Ce) was prepared for comparison A feed flow rate of 2 mL/min was used, and air was used as spraying gas (670L/h). The inlet temperature was set at 60 °C. Secondary drying was performed using a freeze dryer for 48 hours.
Particle characterization
X-ray diffraction (XRD), Infrared (IR) s pectroscopy, thermogravimetric analysis (TGA), differential scanning calorimetry (DSC), particle sizer, and scanning electron microscopy (SEM) were performed for complete characterization in terms of amorphicity, molecular interactions, water content, glas s transition temperature (Tg), particle size distribution, and morphology.
Aerosol performance
Aerosol performance was assessed using a next generation impactor (NGI) (Copley scientific Ltd., Nottingham, UK) and aerolizer (Novartis Pharmaceutical Limited, UK). The samples collected in various parts of the NGI were quantified using high performance liquid chromatography (HPLC). The fine particle dose (FPD) representing particles with aerodynamic diameter ≤ 5 microns was calculated by interpolation from cumulative mass vs D50 graph. The fine particle fraction (FPF) was calculated relative to recovered dose. Recovered dose (RD) was the amount of drug which could be quantified from the capsule, aerolizer, mouth piece, induction port, and different stages (S1 -7) of the NGI. Emitted dose (ED) was the amount of drug which left the aerolizer and was deposited in various parts of NGI (mouth piece, induction port, and the different stages). RD was expressed in percentage relative to the amount of drug loaded in the capsule and ED was calculative relative to RD
Chemical Stability
Chemical stability of ceftazidime formulations w as assessed by measuring drug content on day 0 and at the end of 10 weeks at 25 °C/ <15% relative humidity (RH).
Statistical analysis
One-way analysis of variance (post hoc test - Tuckey’s honest significant difference) was applied to assess significance using Rstudio [7]
Results and discussion
Spray-dried formulations containing only ceftazidime (Ce) and ceftazidime -valine (CeV) were prepared Ceftazidime was amorphous on spray drying alone, whereas valine was crystalline. Upon co-spray drying ceftazidime with valine, both ingredients were found in amorphous state. The water content of Ce formulation was ~7%. CeV showed slightly les s water content (~5%), likely due to the hydrophobic nature of the amino acid. Both Ce and CeV showed a Tg of ~50 °C, suggesting non-ideal mixing. Nevertheless, the single Tg of the CeV suggested co-amorphization. In addition, valine did not crystallize upon heating suggesting the system was stable under temperature variation. Both formulations showed a similar D50 value of ~2.5 microns. On SEM, both particles were spherical; however, valine showed higher surface asperities as shown in Figure 1 The IR spectra for both the formulations were populated with characteristic peaks of ceftazidime as expected; ceftazidime being the dominant ingredient
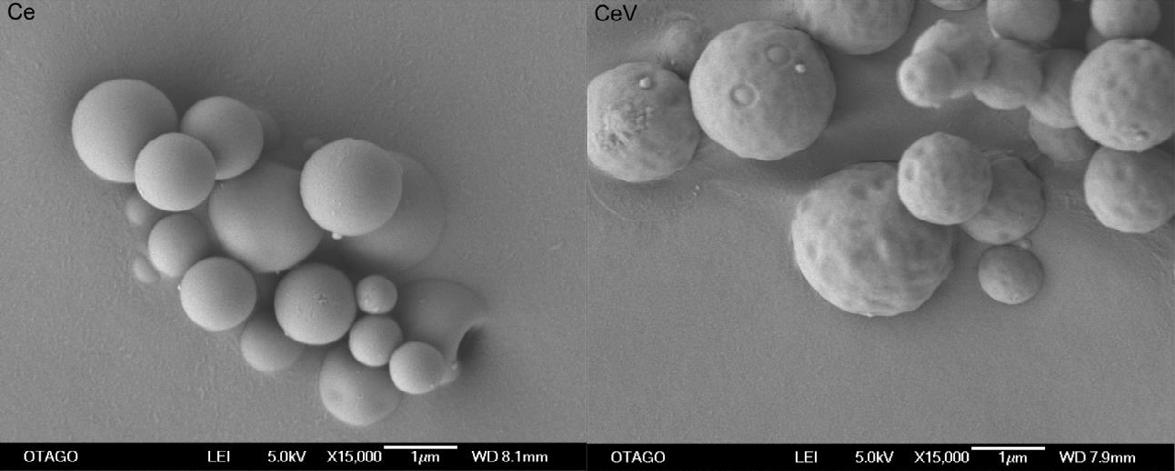
168
Figure 1. Representative SEM images of the spray-dried particles (Ce= Ceftazidime only, CeV= Ceftazidime-valine formulation)
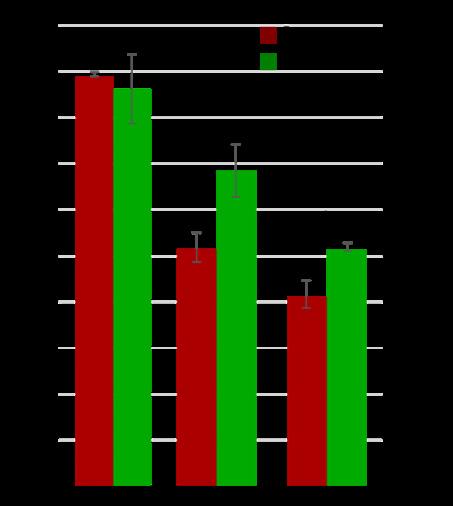
Influence of inclusion of valine on aerosolization was determined with NGI (Figure 2). The recovered dose for both the formulations was ~90%. Emitted dose increased from ~50 to 68% with inclusion of valine and FPF increased from 41 to 51% (p < 0.05However, the improvement in FPF was not observed for another drug, kanamycin [8]. The difference in the influence of valine on improvement of aerosolization between kanamycin and ceftazidi me could be ascribed to the surface asperity present only in the ceftazidime-valine particles.
The drug assay on Day 0 was ~92% for both the formulations , and no other peaks apart from the ingredient peaks were present in the chromatogram of the formulations. On the 10 th week, the drug content of Ce formulation dropped to 43%; however, the drug content of the CeV was 51%. Although chemical degradation occurred both in the presence and absence of valine in the formulations, the decrease was less pronounced with presence of valine. In fact, the chemical degradation was 24% lower (p < 0.05) in the presence of valine in the formulation. The mechanism behind such protective behaviour is currently under investigation. In addition, protective role of other amino acids is unknown; hence, the use of other amino acids is also under investigation to better understand the mechanism and factors affecting protective efficacy of different amino acids.
Conclusion
Ceftazidime-valine co-amorphous co-spray dried particles were prepared. The amino acid was effective in improving emitted dose, fine particle fraction as well as chemical stability of ceftazidime in amorphous state suggesting the potential use of amino acid in achieving dual advantages for pulmonary delivery of amorphous high dose dry powder.
References
1. Geller, D.E., J. Weers, and S. Heuerding, Development of an inhaled dry -powder formulation of tobramycin using PulmoSphere™ technology. Journal of aerosol medicine and pulmonary drug delivery, 2011. 24(4): p. 175-182.
2. Conole, D. and G.M. Keating, Colistimethate Sodium Dry Powder for Inhalation: A Review of Its Use in the Treatment of Chronic Pseudomonas aeruginosa Infection in Patients with Cystic Fibrosis. Drugs, 2014. 74(3): p. 377-387.
3. Khadka, P., et al., A study on polymorphic forms of rifampicin for inhaled high dose delivery in tuberculosis treatment. Int J Pharm, 2020. 587: p. 119602.
4. Lau, M., P.M. Young, and D. Traini, A review of co-milling techniques for the production of high dose dry powder inhaler formulation. Drug Development and Industrial Pharmacy, 2017. 43(8): p. 1229-1238.
5. Vehring, R., Pharmaceutical particle engineering via spray drying. Pharm Res, 2008. 25(5): p. 999-1022.
6. Newman, A., S.M. Reutzel-Edens, and G. Zografi, Coamorphous Active Pharmaceutical Ingredient-Small Molecule Mixtures: Considerations in the Choice of Coformers for Enhancing Dissolution and Oral Bioavailability. J Pharm Sci, 2018. 107(1): p. 5-17.
7. Team, R., RStudio: Integrated Development for R . 2019, RStudio, Inc., Boston, MA.
8. Adhikari, B.R., et al., Co-amorphization of kanamycin with amino acids improves aerosolization. Pharmaceutics, 2020. 12(8): p. 715.
Drug Delivery to the Lungs, Volume 32 , 2021 - Bishal Raj Adhikari et al.
Figure 2 Recovered dose (RD), emitted dose (ED), and fine particle fraction (FPF) of the spray-dried particles (Ce= Ceftazidime only, CeV= Ceftazidime-valine formulation) *The value difference is statistically significant (p < 0.05)
169
170
Budesonide Solution MDIs: Plasma Treated Canister Performance and other Canister Types
David A. Lewis1, Rob. D. Johnson1, Daniel I. Lewis1, Jacqueline Green2
1Oz-UK Limited, Chippenham, Wiltshire, UK 2Presspart Mfg Ltd, Blackburn, UK
Summary
Drug delivery performance and chemical stability has been evaluated for an ethanol-based budesonide solution HFA 134a MDI formulation packaged within five alternative canister types. The chemical stability of the budesonide was observed to be directly dependent upon canister choice.
Following 3-months valve-up storage at 40°C/75%RH, surface treated canisters (plasma, anodised and FEP) were observed to have a budesonide residual of 97.3 ± 0.5%, 97.5 ± 1.3% and 97.6 ± 0.6% respectively. However, under the same conditions the drug residual for the same formulation packaged in non-surface treated stainless steel and aluminium canisters was much lower; 65.5 ± 0.3% and 88.6 ± 0.6% respectively.
With regards to drug delivery performance, when packaged in Plasma treated canisters, no significant difference (p>0.05) was observed in budesonide drug delivery metrics (delivered dose, fine particle dose and MMAD) before and after 3-months valve-up storage at 40°C/75%RH.
The data presented in th is study highlights the importance of selecting a suitable canister type during formulation and product development. With regards to the budesonide formulation evaluated in this study, surface treated canisters (plasma, anodised and FEP) outperformed plain stainless steel and plain aluminium canisters.
Key Message
A solution Metered Dose Inhaler (MDI) budesonide formulation has been evaluated in five alternative canister types The chemical stability of the budesonide is observed to be directly dependent upon canister choice
Introduction
Budesonide is a glucocorticoid used in the management and treatment of the inflammatory diseases, including asthma and chronic obstructive pulmonary disease (COPD) [1] In a recent study, early administration of inhaled budesonide was reported to reduce the likelihood of needing urgent medical care and reduced time to recovery after early COVID -19 [2, 3]
The importance of selecting a suitable canister during formulation development has previously been highlighted [4, 5, 6]. Chemical degradation of budesonide within ethanol base HFA 134a solution formulations has previously been reported when packaged in non-surface treated canisters [7]. In this abstract, a budesonide solution formulation is packaged in five alternative metered dose inhaler canister types: Fluorocarbon Polymerised (FCP) plasma treated, anodised, Fluorinated Ethylene Propylene (FEP) coated, Stainless Steel, and aluminium. In-vitro drug delivery and chemical stability data are presented from three timepoints; initial; 1-month at 40°C/75%RH; and 3-months at 40°C/75%RH. The data presented demonstrates that the chemical stability of the budesonide formulation is dependent upon canister choice.
Experimental Methods
Metered Dose Inhalers (MDIs) containing Budesonide 50μg/50μl in HFA 134a propellant and 13%w/w ethanol were manufactured by weight using five alternative 19ml Presspart canisters ; plasma (C0128F03), Anodised (C0128P), fluorinated ethylene propylene, FEP (C0128P), Stainless Steel (C1202), aluminium (C0128P) All MDIs were fitted with Aptar DF 30+ 50µl metering valves. Drug delivery characterisation was performed using Presspart Actuators (0.30mm exit orifice diameter).
For each MDI canister type, the chemical stability of Budesonide was evaluated (in triplicate) after; 1month storage (upright and inverted) at 40°C 75%RH; and 3-months storage (upright and inverted) at 40°C 75%RH. Drug mass was recovered from each MDI by evaporation of propellant and solvent;
Drug Delivery to the Lungs , Volume 32, 2021 - David A Lewis et al
171
Drug Delivery to the Lungs , Volume 32, 2021 - Budesonide Solution MDIs: Plasma Treated Canister Performance and other Canister Types
quantitative rinsing into volumetric flasks; and analysis of test-sample content by HPLC. Results are presented as a percentage of the initial drug residual can -content (n=3) immediately following manufacture (t=0); which was 100.8 ± 0.9% of budesonide mass (11.7-12.1mg) added to each MDI during manufacture.
Drug delivery characterisation was performed by next generation impactor (NGI) fitted with USP induction port at a sampling flow rate of 30l/min in accordance with the USP <601>. Results presented are an average of three measurements each taken from three separate MDIs (Plasma treated canisters); measurements were obtained following manufacture (t=0) and after 3-months storage (valve up) at 40°C 75%RH.
Budesonide content in all test samples was quantified using a validated HPLC stability indicating assay.
Results and Discussion
Chemical Stability: Residual Can Content
The chemical stability of Budesonide packaged within five alternative canisters is presented in Table 1 and Figure 1 following 1-month (40°C/75%RH) and 3-months (40°C/75%RH) storage (valve-up and valve-down). Low budesonide can content residual was observed for non-surface treated canisters due to drug degradation [7].
Valve-Up Storage
At 1-month the residual masses observed for valve -up MDIs packaged with surface treated canisters (plasma, anodised and FEP) were 100.2 ± 0.2%, 99.4 ± 0.4% and 100.2 ± 0.5% respectively (i.e., no significant difference p>0.05) After 3-months storage at 40°C/75%RH the respective values decreased slightly to 97.3 ± 0.5%, 97.5 ± 1.3% and 97.6 ± 0.6% (see Table 1)
For the non-surface treated canister types investigated; Budesonide residual fell (degraded [7]) significantly (p<0.05) to 65.5 ± 0.3% and 88.6 ± 0.6% after 3-months storage within stainless steel and plain aluminium canisters respectively.
Valve-down Storage
In all cases, Budesonide residual was observed to be lower for MDIs stored valve down. At the 3-month time point 1 - 2% lower values were observed for surface treated canisters For untreated stainless steel and aluminium canisters, values were respectively 4 - 10% lower when stored valve down
Detailed discussion regarding the valve selected for this study is out of the scope for this abstract
The data presented here highlights the importance of selecting a suitable canister type during formulation and product development. With regards to the budesonide formulation evaluated in this study, surface treated canisters outperformed plain stainless steel and plain aluminium canisters.
Table 1 – Percentage Budesonide residual can content (relative to initial time point, t = 0) following storage at 40°C and 75%RH for 1 month and 3-months (mean ± standard deviation, n = 3)
t=1 month @ 40°C/75%RH t=3 months @ 40°C/75%RH Storage Condition Valve up Valve Down Valve up Valve Down Plasma Treated Canister 100.2 ± 0.2 99.4 ± 0.3 97.3 ± 0.5 95.3 ± 0.3 Anodised Canister 99.4 ± 0.4 98.7 ± 0.1 97.5 ± 1.3 95.4 ± 0.5 FEP Coated Canister 100.2 ± 0.5 99.6 ± 0.2 97.6 ± 0.6 96.6 ± 0.5 Stainless Steel Canister 84.0 ± 1.4 82.0 ± 0.4 65.5 ± 0.3 61.5 ± 1.6 Plain Aluminium Canister 99.6 ± 0.8 95.7 ± 0.7 88.6 ± 0.6 78.6 ± 1.2 172
Upright @ 1 Month
Inverted @ 1 Month
Upright @ 3 Months
Inverted @ 3 Months
Drug Delivery Performance
The Budesonide delivery performance was evaluated for the formulation packaged in plasma treated canisters immediately after manufacture and again following 3-months storage (valve-up) at 40°C/75%RH. Figure 2 presents the cumulative budesonide mass undersize as a function of upper aerodynamic diameter No significant difference (p>0.05) was observed in the Budesonide drug delivery metrics; delivered dose; fine particle dose (<5µm); and Mass Median
when comparing t=0 and t=3-months data (see Table 2)
Drug Delivery to the Lungs , Volume 32, 2021 - David A Lewis et al
Figure 1 - Percentage Budesonide residual can content (relative to initial time point, t = 0) following storage at 40°C and 75%RH for 1 month and 3-months (mean ± standard deviation, n = 3).
Aerodynamic Diameter (MMAD)
0 10 20 30 40 50 60 70 80 90 100 110 FCP Plasma Anodised FEP4 Coated Stainless Steel Aluminium Budesonide Can Content Residual (% of t0) Canister Type
Figure 2 – Cumulative Budesonide Mass Undersize as a function of Upper Aerodynamic Diameter obtained at the Initial time point for Plasma Treated Canister. Data obtained immediately after manufacture (t = 0) and again following 3months storage (valve-up) at 40°C/75%RH (mean ± standard deviation, n = 3)
173
Conclusion
Chemical stability has been evaluated for an ethanol bases budesonide solution HFA 134a MDI formulation packaged within five alternative canister types The chemical stability of the budesonide was observed to be directly dependent upon caniste r choice.
Following 3-months valve-up storage at 40°C/75%RH, surface treated canisters (plasma, anodised and FEP) were observed to have a budesonide residual of 97.3 ± 0.5%, 97.5 ± 1.3% and 97.6 ± 0.6% respectively Under the same conditions the drug residual for the same formulation packaged in nonsurface treated stainless steel and aluminium canisters were 65.5 ± 0.3% and 88.6 ± 0.6% respectively (i.e., significantly lower, p<0.05)
With regards to drug delivery performance, when packaged in Plasma treated canisters , no significant difference (p>0.05) was observed in budesonide drug delivery metrics (delivered dose, fine particle dose and MMAD) before and after 3-months valve-up storage at 40°C/75%RH
The data presented in this study highlights the importance of selecting a suitable canister type during formulation and product development. With regards to the budesonide formulation evaluated in this study, surface treated canisters outperformed plain stainless ste el and plain aluminium canisters.
References
[1] Weiner P, Weiner M, Azgad Y, Zamir D: Inhaled Budesonide Therapy for Patients with Stable COPD, Chest 1995, 108(6), 1568 1571.
[2] Ramakrishnan S, Nicolau DV, Langford B, Mahdi M, Jeffers H, Mwasuku C, Krassowska K, Fox R, Binnian I, Glover V, Bright S, Butler C, Cane JL, Halner A, Matthews PC, Donnelly LE, Simpson JL, Baker JR, Fadai NT, Peterson S, Bengtsson T, Barnes PJ, Russell REK, Bafadhel M: Inhaled budesonide in the treatment of early COVID-19 (STOIC): a phase 2, openlabel, randomised controlled trial, The Lancet, 2021; 9 (7) 763-772.
[3] Aghjayan R: Inhaled Budesonide May Improve Outcomes in Early COVID -19 Treatment, Lung Infection 2021 May, https://www.pulmonologyadvisor.com/home/topics/lung-infection/inhaled-budesonide-may-improve-outcomes-in-early-covid19-treatment/ accessed July 2021.
[4] Lewis DA, Johnson DA, Lewis DI, ….: Fluticasone Propionate Suspension MDIs: Plasma Treated Canister Performance and other Canister Types, Drug Delivery to the Lungs, 2021 (32).
[5] Baron C, Grosjean B, Heyworth D, Robins E, Sule A, Turner R, Williams G: Evaluation of Powder Adhesion and Stability of pMDIs with Different Canister Types Including Plasma Treated Canisters , Respiratory Drug Delivery 2014. Volume 2, 2014: 349-354.
[6] Stevenson P: Controlling Surface Performance Characteristics of Medical Devices: A Critical Review of the Latest Industrial Techniques, Respiratory Drug Delivery 2016. Volume 1, 2016: 147-156.
[7] Lewis D, Ganderton D, Meakin B, Ventura P, Brambilla G, Garzia R: Pressurised metered dose inhalers (MDI), U.S. Patent 7,223,381 B2, May 29,2007
Drug Delivery to the Lungs , Volume 32, 2021 - Budesonide Solution MDIs: Plasma Treated Canister Performance and other Canister Types
3-month
Initial 3-months @ 40°C/75%RH Metered Dose (µg) 49.0 ± 1.3 52.1 ± 0.6 Delivered Dose (µg) 43.6 ± 2.2 46.1 ± 0.6 FPD < 5µm (µg) 19.9 ± 0.5 19.5 ± 0.5 FPF < 5µm (%) 45.7 ± 1.4 42.3 ± 1.6 MMAD (µm) 1.0 ± 0.1 0.9 ± 0.1
Table 2 – Drug delivery metrics obtained at the initial time point and
(40°C/75%RH) time point for Plasma Presspart canister (mean ± standard deviation, n = 3).
174
Fluticasone Propionate Suspension MDIs: Plasma Treated Canister Performance and other Canister Types
David A. Lewis1, Rob. D. Johnson1, Daniel I. Lewis1, Jacqueline Green2
1Oz-UK Limited, Chippenham, Wiltshire, UK 2Presspart Mfg Ltd, Blackburn, UK
Summary
Selection of a suitable canister during Pressurised Metered Dose Inhaler (MDI) product development is of primary importance. Canister material and surface treatment has a direct influence upon drug chemical stability and formulation physical stability. Adhesion of drug (s) to a canister’s surface during a product’s shelf-life or canister’s use-life will affect drug delivery performance metrics including content uniformity of the delivered and therapeutic dose.
This study evaluates the drug delivery performance and chemical stability of a Fluticasone Propionate suspension within HFA 134a in various canister types: Fluorocarbon Polymerised (FCP) Plasma treated, Anodised, Fluorinated Ethylene Propylene (FEP) coated, Stainless Steel, and Aluminium. The drug delivery performance was observed before and after 3-months storage of the MDIs at 40°C and 75%RH
At the 3-month time point, no significant difference was observed between the performance of plasma treated canisters and FEP coated canisters ( p>0.05); both of which out-performed non-surface treated canisters. When compared to Flixotide (FPD = 44.1 ± 4.7µg) data collected during this study , no significant difference (p>0.05) was observed after 3-months valve-up storage at 40°C and 75%RH in the FPD ≤5µm for plasma treated canisters (FPD = 40.4 ± 0.8µg) and FEP coated canisters (42.2 ± 1.6). However, significant difference (p<0.05) was observed for the uncoated plain aluminium canister following storage (FPD = 33.5 ± 1.1µg).
Key Message
A Fluticasone Propionate suspension within HFA 134a was evaluated in various canister types for drug delivery performance and residual drug total can content No significant difference was observed in the performance of plasma treated canisters and FEP coated canisters ( p>0.05); both of which outperformed non-coated canisters.
Introduction
Adhesion of suspended micronized drug particulates to the pMDI canister walls may result in deviation from the label claim [1, 2] The importance of controlling surface-API integration via robust engineering processes of medical devices has previously been highlighted; emphasizing that plasma-based technologies can outperform more conventional coatings methodologies [3]
In this study, micronized Fluticasone Propionate was suspended in HFA134a and packaged within five alternative canister types: Fluorocarbon Polymerised (FCP) plasma treat ed, anodised, Fluorinated Ethylene Propylene (FEP) coated, Stainless Steel, and aluminium. Drug delivery performance and chemical stability of Fluticasone Propionate is evaluated before and after 3-months storage at 40°C and 75%RH.
Experimental Methods
Metered Dose inhalers (MDIs) were manufactured using five alternative 19ml Presspart canisters ; plasma (C0128-F03), Anodised (C0128P), fluorinated ethylene propylene, FEP (C0128P), Stainless Steel (C1202), aluminium (C0128P) All MDIs were fitted with Aptar DF316 61µl metering valves.
Fluticasone Propionate was micronised, in-house, using a small-scale air-jet mill (LaboMil-1, FPS, Italy) For each formulation, between 17.83 - 18.35mg of micronized Fluticasone Propionate and 10.75 –11.23g of HFA 134a was added by weight to each can prior to dispersion by ultrasonication Drug delivery characterisation was performed by next generation impactor (NGI) fitted with USP induction port at a sampling flow rate of 30l/min in accordance with the USP <601>. Drug delivery characterisation was performed using Presspart Actuators (0.30 mm exit orifice diameter). Results presented are an average of four measurements taken from two separate MDIs from each of three alternative canister
Drug Delivery to the Lungs , Volume 32, 2021 - David A Lewis et al.
175
Drug Delivery to the Lungs , Volume 32, 2021 - Fluticasone Propionate Suspension MDIs : Plasma Treated Canister Performance and other Canister Types
types (Plasma coated canisters, FEP Coated Canisters, and Plain Aluminium canisters). Measurements were obtained following manufacture (t=0) and after 3 -months storage (upright) at 40°C 75%RH.
Drug delivery was also characterised (n = 4) for Flixotide 125 (Batch GU3U); as supplied by a local pharmacist.
All MDIs were actuated in accordance with the Flixotide Patient instruction leaflet and shot weights were recorded for all doses by weight difference.
Chemical stability of Fluticasone Propionate was evaluated (in duplicate) after; 1-month storage (upright and inverted) at 40°C 75%RH (t=1-month); and 3-months storage (upright and inverted) at 40°C 75%RH (t=3-month) Drug mass was recovered from each MDI by evaporation of propellant and solvent; quantitative rinsing into volumetric flasks; and anal ysis of test-sample content by HPLC. Results are presented as a percentage of the initial drug residual can-content (n=12) immediately following manufacture (t=0); which was 99.3 ± 1.7% of the target value for all canister types.
Drug content in all test samples was quantified using a validated HPLC stability indicating assay.
Results and Discussion
Drug Delivery Performance
Shot weights were consistent for all doses fired during the study (77.9 ± 0.9mg) At the initial time point, no significant difference (p > 0.05) was found in the drug delivery metrics presented in Table 1 for canister types investigated (Plasma coated, FEP Coated, Plain Aluminium) Particle size distributions were observed to be consistent (p > 0.05) for all canister types (see Figure 1b); grouped MMAD = 3.4 ± 0.2µm
t lasma reated anister
t oated anister
t lain luminium anister
t lasma reated anister
t oated anister
t lain luminium anister
At the initial time point, the observed metered doses were within 103 ± 4% (Plasma Treated), 97 ± 3% (FEP Coated) and 93 ± 4% (Plain Aluminium) of target (125µg). The plain aluminium canister having an average metered dose 7% below the 125µg target dose (see Figure 2); indicating drug loss of 1.3 ± 0.7mg; potentially resulting from wall deposition within the uncoated plain aluminium canister [1, 2, 3]
Following 3-months storage at 40°C/75%RH (valve-up) the surface treated canisters were observed to maintain a metered dose close to the 125µg target; 101 ± 2% (Plasma), 106 ± 4% (FEP). However, the
Figure 1 - Data obtained at the Initial time point for three Presspart canister types (mean ± standard deviation, n = 4) a) Fluticasone Propionate deposition on Next Generation Impactor (NGI) Stages, b) Cumulative percentage drug mass undersize5 5 5 umulati e rug ass ndersi e (
pper erod namic iameter (µm
5 rug eposition per ctuation ( µg e t eneration mpactor tage
176
Drug Delivery to the Lungs , Volume 32, 2021 - David A Lewis et al.
observed metered dose from the MDIs packaged with uncoated Aluminium canisters dropped to 86 ± 9%; a further indication of drug loss (2.5 ± 1.6mg) to the wall of the plain uncoated Aluminium canister.
Fine particle dose and fine particle fraction was observed to be lower for all MDIs following 3-months storage at 40°C/75%RH MMAD is also seen to increase (see Table 1) This change in the physical nature of the suspension has been reported to be the result of moisture ingress during the 3-month 40°C/75%RH storage period and can be limited by selection of sealing gasket materials and controlled manufacturing conditions [4, 5, 6].
When compared to Flixotide (FPD = 44.1 ± 4.7µg), no significant difference (p>0.05) was observed in the fine particle dose (≤5 µm) for plasma treated canisters (FPD = 40.4 ± 0.8µm) and FEP coated canisters (FPD = 42.2 ± 1.6µm) following 3-month storage (40°C/75%RH, valve-up). However, significant difference (p<0.05) was observed for the uncoated plain aluminium canister following storage (FPD = 33.5 ± 1.1µg, see Figure 2).
a nitial ata (t
lasma reated anister oated anister
lain luminium anister
5 (t onths
lasma reated anister oated anister
lain luminium anister
Plasma Treated Canister FEP Coated Canister Plain Aluminium Canister Initial 3-months @ 40°C/75%RH Initial 3-months @ 40°C/75%RH Initial 3-months @ 40°C/75%RH Metered Dose (µg) 128.4 ± 4.8 125.8 ± 2.9 120.9 ± 4.2 133.0 ± 4.4 116.9 ± 5.2 107.8 ± 11.9 Delivered Dose (µg) 116.4 ± 5.4 114.6 ± 2.5 106.2 ± 4.8 120.2 ± 2.7 102.5 ± 4.4 98.5 ± 10.3 FPD < 5µm (µg) 53.0 ± 3.6 40.4 ± 0.8 46.6 ± 2.8 42.2 ± 1.6 42.7 ± 1.4 33.1 ± 4.0 FPF < 5µm (%) 45.5 ± 1.2 35.2 ± 0.5 43.9 ± 2.0 35.1 ± 1.4 41.7 ± 1.4 33.5 ± 1.1 MMAD (µm) 3.3 ± 0.1 3.6 ± 0.1 3.4 ± 0.1 3.6 ± 0.1 3.4 ± 0.1 3.8 ± 0.1 Shot Weight (mg) 77.1 ± 0.4 78.5 ± 0.6 77.3 ± 0.7 78.2 ± 1.0 78.2 ± 0.8 78.1 ± 0.8
Table 1 – Drug delivery metrics obtained at the initial time point and 3-month (40°C/75%RH- valve up) time point for three Presspart canister types (mean ± standard deviation, n = 4).
5 5 5 5 5 5 etered eli ered 5µm
Figure 2 - Metered, Delivered and Fine Particle Dose ≤ 5µm (mean ± standard deviation, n = 4) for three Presspart canister types at a) Initial time point and b) following 3-months storage at 40°C and 75%RH.
luticasone ropionate per dose ( µg
5 5 5 5 5 etered eli ered 5µm
luticasone ropionate per dose ( µg
177
Drug Delivery to the Lungs , Volume 32, 2021 - Fluticasone Propionate Suspension MDIs : Plasma Treated Canister Performance and other Canister Types
Chemical Stability: Residual Can Content
The chemical stability of Fluticasone Propionate packaged within five alternative canisters is presented in Table 2 following 1-month (40°C/75%RH) and 3-months (40°C/75%RH) storage (valve-up and valvedown). At 1-month and 3-month time points the residual masses observed for valve-up MDIs were 100 ± 1% (pooled results relative to t=0) indicating canister choice has little effect upon the chemical stability of the Fluticasone Propionate suspension. Data was consistent for canisters stored valve-down except for the Stainless Steel and Plain Aluminium canisters (91.7 and 92.9% residual respectively).
Conclusion
Drug delivery performance and chemical stability has been evaluated for micronized Fluticasone Propionate suspended within HFA 134a and packaged within five alternative canister types
At the 3-month time point, no significant difference was observed between the performance of Plasma treated canisters and FEP coated canisters (p>0.05); both of which out-performed non-coated canisters.
References
[1] Traini D, Rogueda PG, Price R, Young PM: Assessing the Degree of Drug Adhesion to Different pMDI Canister Walls by Surface Energy and AFM Measurements, Respiratory Drug Delivery IX. Volume 3, 2004: 741-744.
[2] Baron C, Grosjean B, Heyworth D, Robins E, Sule A, Turner R, Williams G: Evaluation of Powder Adhesion and Stability of pMDIs with Different Canister Types Including Plasma Treated Canisters , Respiratory Drug Delivery 2014. Volume 2, 2014: 349-354.
[3] Stevenson P: Controlling Surface Performance Characteristics of Medical Devices: A Critical Review of the Latest Industrial Techniques, Respiratory Drug Delivery 2016. Volume 1, 2016: 147-156.
[4] Myrdal P, Sheth P, Stein S W: Advances in Metered Dose Inhaler Technology: Formulation Development , AAPS PharmSciTech, 2014 Apr;15(2):434-55.
[5] Murata S, Ito H, Izumi T, Chikushi A: Effect of the moisture content in aerosol on the spray performance of Stmerin® D HFA preparations, Chem Pharm Bull. 2006;54(9):1276–80.
[6] Murata S, Izumi T, Ito H: Effect of the moisture content in aerosol on the spray performance of Stmerin® D hydrofluoroalkane preparations (2), Chem Pharm Bull. 2012;60(5):593–7.
Table 2 – Percentage Fluticasone Propinonate residual can content (relative to initial time point, t = 0) following storage at 40°C and 75%RH for 1 month and 3-months.T=1 month
40°C/75%RH t=3 months
40°C/75%RH Storage Condition Valve up Valve Down Valve up Valve Down Plasma Treated Canister 100.0 99.6 100.6 98.1 Anodised Canister 100.8 100.1 98.7 97.3 FEP Coated Canister 100.5 100.6 100.2 98.7 Stainless Steel Canister 100.7 97.3 98.2 91.7 Plain Aluminium Canister 101.3 100.5 100.2 92.9 178
@
@
A Design of Experiments approach to optimising spray drying yield and production efficiency of a model inhaled powder for global health applications
Andrew J.L. McArthur1, Victoria L. Oliver2, Pete Lambert1, Eddie French1, Jacob Harker1 & Michelle P. McIntosh11Drug Delivery, Disposition and Dynamics, Monash Institute of Pharmacy and Pharmaceutical Science, Monash University, Melbourne, VIC 3052, Australia
2Melbourne University School of Population and Global Health, Melbourne University, Melbourne, VIC 3052, Australia.
Summary
Pharmaceutical products developed for low -income markets may face greater challenges in covering manufacturing costs while meeting affordable costs of goods in these settings. Inhaled products for these markets must address the cost of manufacture and how this impacts the affordability of the product to the end-user in order to improve chances of long -term sustainable healthcare outcomes. In this example of an inhaled powder product designed for use in lo w-income markets, addressing the cost of manufacture require optimisation of the raw yield and speed of production spray drying process by increasing process parameters such as the concentration of feed solution and feed solution pumping speed. However, increasing powder production in this way may influence the carefully engineered powder particle characteristics which in turn will affect dose delivery. To address this issue , the complex nature of the relationships between spray drying processing parameters and physical powder attributes critical to product performance were characterised using a Design of Experiments (DoE) approach. Response Surface Methodology (RSM) was then employed to construct a predictive model and carefully optimise the processing parameters for maximal powder yield and spray drying efficiency while maintaining tight limits on particle size, moisture content, and glass transition temperature .
Key message
A DoE (24-CCD) approach was used to increase spray drying yield and powder production efficiency while maintaining critical quality attributes of trehalose powder particle for deep lung penetration, in order to better address inhaled product affordability challenges experienced by low -income countries.
Introduction
Maternal mortality is one of the most inequitable statistics in global health due to an estimated 300,000 woman dying of complications relating to childbirth and pregnancy, with up to 99% of these deaths occurring in low and lower-middle income countries (LMICs) [1] Postpartum haemorrhage (PPH) is one of the most common causes of maternal death and disproportionally affects mothers in low-income countries due, in part to inadequate access to medicines. Oxyt ocin injection (IV/IM) is an effective therapy for prevention and treatment of PPH and is included in the World Health Organisations list of essential medicines as the gold standard of care. While oxytocin injection is the standard of care for PPH, barriers to access exist in LMICs around its heat-sensitivity and the need to be refrigerated during storage. Consequently, the quality of oxytocin ampoules at the point of use in sub-Saharan Africa varies considerably [2] The inhaled oxytocin project seeks to develop a heat -stable, spray dried oxytocin product for pulmonary delivery, a reformulation that has the potential to improve PPH outcomes by offering a more sustainable alternative to traditional IV and IM methods. However, an ampoule of injectable oxytocin in LMICs is priced at approximately $0.33 USD [3] and therefore, the long-term viability of innovations like inhaled oxytocin are acutely challenged by the willingness and ability of product financiers to supply and manufacture spray dried powders at a comparable cost to the end -user. For an inhaled oxytocin product, it is imperative that manufacturing is as cost -effective as possible in order to align with sustainability goals and provide the most affordable final product to users in lowresource settings.
Spray drying has become an increasingly popular manufacturin g method of inhalable pharmaceutical powders, particularly those containing proteins and peptides, due to the heat stability offered when spray drying parameters are tightly controlled [4, 5] There are many products, both marketed and in development [6] that utilise spray drying technology however, to the author’s knowledge there is no commercially available product for pulmonary delivery and systemic uptake, that is completely spray dried. Spray drying trehalose and oxytocin has had proven potential in pre-clinical and early clinical studies [7, 8] however, a commercial scale manufacturing process is required that addresses the affordability challenges of a product for low-resource settings. However, spray drying a potent hormone like oxytocin requires subst antial containment from an R&D scale to commercial manufacture. In order to address this challenge, oxytocin was removed and replaced with trehalose during development in accordance with internal studies that indicate similar physical characteristics of th e placebo particle and
Drug Delivery to the Lungs, Volume 32 , 2021 – Andrew J L McArthur et al.
179
Drug Delivery to the Lungs , Volume 32, 2021 - A Design of Experiments approach to optimising spray drying yield and production efficiency of a model inhaled powder for global health applications
the active particle. Further, reports discussing the benefits of optimising spray drying yield have emerged due to the variable nature of yields observed when using standard bench -top systems and, the expenses of low yield processes even at an R&D scale [9] Spraying drying yield is often related to powder adhesion to the inner surfaces of the cyclone and poor collection efficiencies of lab scale systems, which in turn can influenced primarily by the inlet air temperature and liquid feed rate into the spray d ryer [10] In order to improve yield and powder production efficiency while maintaining critical quality attributes of particles for inhalation, the present study uses a pilot scale spray dryer and a DoE appr oach to investigate the influence liquid feed rate, inlet -air temperature, atomising gas feed rate and feed solution concentration on production efficiency metrics (yield and spray drying throughput) of trehalose powders
Materials
Milli-Q® water (Merck-Millipore, Darmstadt, Germany), D-(+)-Trehalose dihydrate (Sigma-Aldrich, Castle Hill, Australia), L-leucine (Sigma-Aldrich, Castle Hill, Australia).
Methods
Spray drying
All batches (n=30) were spray dried using a ProCept 4M8-TriX spray dryer (ProCept, Zelzate, Belgium) with a 0.4 mm bi-fluid atomising nozzle using air as the drying and atomising gas (feed rate, 500 L/min). Process parameters ranges were as follows; atomis ing gas feed rate from 11 to 19 L/hour, inlet air temperature from 140 to 200° C, feed solution flow rate from 1 to 7 g/min and, feed solution solid concentration from 3 to 11% w/w. Powder collected from the spray dryer was immediately sealed and weighed on an analytical balance
Particle size distribution
Determined by laser diffraction by Malvern Mastersizer 2000 (Malvern Instruments, Worcestershire, UK ) with a Scirocco 2000 dry dispersion unit using 2 bar of air pressure for optimal powder dispersion and powder deagglomeration. Powder samples were analysed in triplicate (n=3).
Moisture content
Determined by coulometric Karl-Fischer titration using an 874 USB Oven Sample Processer (Metrohm AG, Herisau, Switzerland). Samples were weighed under low humidity (< 30% RH), analysed in triplicate (n=3) and heated to 150° C by the oven unit with a 50 L/min dry nitrogen as the carrier ga s. Data was analysed using Tiamo 2.5 software (Merck -Millipore, Darmstadt, Germany).
Glass transition temperature
Measurements made with a Perkin-Elmer DSC 8500 (Perkin-Elmer, MA, USA) differential scanning calorimeter. Powder samples were weighed into 50 µL aluminium DSC pans and crimped under low humidity (< 30% RH). Thermal data was collected in heati ng mode, with a dry nitrogen gas at a flow rate of 20 L/min to purge cell, temperature gradient 10° C/min ramp from –10 to 170° C.
Design of experiments (24-CCD)
All factorial design analysis and response surface plotting was conducted using Design Expert ® software V.12 (Stat-Ease Inc., MN, USA). A randomised, non-blocked, 24 (2 level, 4 factor) factorial central composite design (CCD) (n=24) was chosen to investigate the 4 chosen spray drying process parameters and allow fitting of second order response su rface models to the data obtained. Centre points (n=6) were chosen in order to calculate the experimental error and improve precision when fitting models. The 24 CCD was augmented with 8 axial points (α = -2) to make the design compatible with more complicated second order RSM designs A desirability function was used to find the optimal process parameter levels and incorporated limits for the d(10), d(50), d(90), span, moisture content, glass transition temperature, yield and production efficiency. Statistical analysis of variance (ANOVA) used to determine the significance (p-value) of the main factors as well as their relevant interactions. Significant parameters were included in the final model.
Results & Discussion
Design of experiments (DoE) is a well-established methodology for identifying and optimising process parameters while maintaining certain product specifications. Many studies have successfully optimised spray drying processes for pharmaceutical powder production, whether the focus be on particl e size, morphology, biological activity or crystallinity of excipients [4, 9-11]. More recently, DoE approaches have successfully been applied to the production of inhalable po wders [12-15] Figure 1 visualises the change in each response when increasing or decreasing coded processing parameter levels (-1 to 1), within the mapped experimental space When increasing the liquid feed rate and feed solution concentration an increase in yield ( A), production efficiency ( B), particle size (C) and moisture content (D) was observed, with only the glass transition temperature ( E) decreasing. Spray drying literature primarily points to reductions in yield as resulting from loss of powder fines through impaired cyclone
180
collection efficiency or powder deposition and build -up on the inside of the spray dryer. It has been previously established that increasing the liquid feed rate increases the volume of the solution being dispersed by the nozzle per unit time and thus increases the droplet size, and eventual particle size [11, 16] Similarly, higher concentrations of solids in the feed solution will generally produce larger particles that have a greater likelihood of being retained in the collection vessel [12]. This study agrees with previously reported findings that feed solution or ‘solids’ concentration had a significant effect on yield [15, 16]. Conversely, increasing the atomising gas feed rate decreased these same responses. By reducing the droplet size, the drying rate of the droplet is changed, impacting the particle size and the moisture content [12]
The models in Figure 1 were predominately non-linear with the exception of glass transition temperature and moisture content. This agrees with current literature showing gas feed rate to have non -linear relationships with particle size, yield and moisture content for similar formulations [4, 13].
All four of the chosen spray drying processing parameters had sig nificant effects on yield and production efficiency, with concentration and liquid flow rate providing the largest increases in yield of all the interactions. From these response-process parameter relationships a desirability ( Figure 2) model was
Drug Delivery to the Lungs, Volume 32 , 2021 – Andrew J L McArthur et al.
Figure 1: Surface plots of; yield (A), production efficiency (B), particle size (d50) (C), glass transition temperature (D) and moisture content (E) as a function of the two processing parameters that induce the largest change in each respective
Figure 2: Surface plot of desirability model (0-1) as a function of liquid flow rate and concentration levels (-1 to +1), temperature (+1) and gas feed rate (0) were held at constant Highest desirability and region of best yield (circled).
181
Drug Delivery to the Lungs , Volume 32, 2021 - A Design of Experiments approach to optimising spray drying yield and production efficiency of a model inhaled powder for global health applications generated to provide maximal yield and production efficiency while maintaining powder particle characteristics. Processing parameters that provided the optimal desirability ( Figure 2, red region) produced powders that were consistent across all measured responses , were within the 95% confidence interval for each response and were within the particle requirements for deep lung penetration (Table 1). The raw yield and production efficiency were improved by 12.4 % and 8.6 g/hr respectively, when compared to the reference spray drying conditions. The reference product maintained a higher glass transition temperature (87.7° C) than the reference product (81.1° C).
*Reference product values from previous optimisation studies. †Expected limits defined by the 95% confidence interval for each response. ‡ Mean (n=3)
Conclusions
The reality of spray dried powder production is that material, labour and manufacturing costs, all contribute to the final product price and affordability to the end users While spray drying is already an efficient and economical production method , minimising the time spent using large -scale spray dryers will be a key determin ant of meeting product affordability , in line with sustainability goals for an LMIC orientated product. There are many DoE studies on powder production for global health applications however, it is uncommon for reports to incorporate the benefits of speed of manufacture into predictive models This study expanded on previous work [14] by using RSM and a full 2 4 factorial CCD in order to investigate the influence of spray drying process parameters on the yield and efficiency of the spray drying process and to provide an optimal set of parameters for maximising yield and minimising time spent during manufacture, while maintaining critical powder particle quality attributes The resulting model was predictive and provided empirical improvements to powder yield and production efficiency while maintaining critical quality attributes of a powder particle for deep lung penetration. These results are encouraging for the potential future applications of spray drying as the commercial production method of cost-constrained pharmaceutical products for global health applications.
References
[1] Say L, Chou D, Gemmill A, Tunçalp Ö, Moller A-B, Daniels J. Global causes of maternal death: a WHO systematic analysis. Lancet. 2014;2(6):p323-33.
[2] Torloni M, Gomes Freitas C, Kartoglu U, Metin Gülmezoglu A, Widmer M. Quality of oxytocin available in low ‐ and middle ‐income countries: a systematic review of the literature . BJOG. 2016;123(13):p2076-86.
[3] UNFPA. UNFPA Product Catalogue: Oxytocin:10 IU. 2021 [Available from:unfpaprocurement.org/products=oxytocin]
[4] Kanojia G, Willems G-J, Frijlink HW, Kersten GFA, Soema PC, Amorij J -P. A Design of Experiment approach to predict product and process parameters for a spray dried influenza vaccine . International J Pharm. 2016;511(2):p1098-111
[5] Fabio K, Curley K, Guarneri J, Adamo B, Laurenzi B, Grant M, et al. Heat-Stable Dry Powder Oxytocin Formulations for Delivery by Oral Inhalation. AAPS PharmSciTech. 2015;16(6):p1299-1306
[6] Khadka P, Sinha S, Tucker IG, Dummer J, Hill PC, Katare R. Pharmacokinetics of rifampicin after repeated intratracheal administration of amorphous and crystalline powder formulations to Sprague Dawley rats . Eur J Pharm Biopharm. 2021;162:p1-11.
[7] Fernando D, Siederer S, Singh S, Schneider I, Gupta A, Powell M. Safety, Tolerability and Pharmacokinetics of Single Doses of Oxytocin Administered via an Inhaled Route in Healthy Females: Randomized, Single -blind, Phase 1 Study EBioMedicine. 2017;22(C):p249-55.
[8] Prankerd R, Ibrahim J, Bischof R, Nassta G, Olerile L, Russell A. Pulmonary Delivery of an Ultra-Fine Oxytocin Dry Powder Formulation: Potential for Treatment of Postpartum Haemorrhage in Developing Countries . PLoS One.2013;8(12)
[9] Ormes JD, Zhang D, Chen AM, Hou S, Krueger D, Nelson T. Design of experiments utilization to map the processing capabilities of a micro-spray dryer: particle design and throughput optimization in support of drug discovery . Pharm Dev Tech. 2013;18(1):p121-9.
[10] LeClair D, Cranston E, Xing Z, Thompson M. Optimization of Spray Drying Conditions for Yield, Particle Size and Biological Activity of Thermally Stable Viral Vectors . AAPS. 2016;33(11):p2763-76.
[11] Maury M, Murphy K, Kumar S, Shi L, Lee G. Effects of process variables on the powder yie ld of spray-dried trehalose on a laboratory spray-dryer. Eur J Pharm and Biopharm. 2005;59(3):p565-73.
[12] Ståhl K, Claesson M, Lilliehorn P, Lindén H, Bäckström K. The effect of process variables on the degradation and physical properties of spray dried insulin intended for inhalation. Int J Pharm. 2002;233(1):p227-37.
[13] Focaroli S, Mah PT, Hastedt JE, Gitlin I, Oscarson S, Fahy JV. A Design of Experiment (DoE) approach to optimise spray drying process conditions for the production of trehalose/leucine formulations with application in pulmonary delivery . Int J pharms. 2019;562:p228-40.
[14] Shukla RK, Croad OW, Morton DAV, French E, Lambert P, Prankerd RJ. Spray-dried carrier-free dry powder for inhalation: A quality by design approach to investigate th e effects of process variable on product characteristics . PSWC 2014
[15] Maltesen MJ, Bjerregaard S, Hovgaard L, Havelund S, van de Weert M. Quality by design – Spray drying of insulin intended for inhalation. Eur J Pharm Biopharma. 2008;70(3):p828-38.
[16] Amaro MI, Tajber L, Corrigan OI, Healy AM. Optimisation of spray drying process conditions for sugar nanoporous microparticles (NPMPs) intended for inhalation. Int J Pharm. 2011;421(1):p99-109.
Process parameter Yield (%) Production efficiency (g/hr) Moisture content (%) Glass transition temperature (º C) Particle size (d50) (µm) Reference* 73.0 6.0 2.40 87.7 2.3 Model limits† 83.4 - 86.4 14.5 - 14.9 1.6 - 2.7 79.4 - 94.6 2.3 - 2.8 Validation run‡ 85.4 14.6 2.00 81.1 2.3
Table 1: Summary of the spray dried model validation samples
182
Drug Delivery to the Lungs, Volume 32, 2021 – Carlotta Giulieri et al.
Formulation, Characterization and Optimization of Dry Powder for Inhalation using combined micronized Levo-Dropropizine and Curcumin
Carlotta Giulieri1, Gianluca Trentin2, Stefano Cagliero2 & Aurelie Schoubben1
1University of Perugia, via del Liceo 1, Perugia (PG), 06123, Italy
2Aptuit an Evotec company, via Alessandro Fleming 4, Verona (VR), 37135, Italy
Summary
Aim of the current work was to optimize process and composition of previously studied Dry Powder for Inhalation (DPI) using anti-tussive Levo-Dropropizine as Active Pharmaceutical Ingredient (API). The previous work based on Design of Experiments (DoE), was performed to select a carrier -based formulation of Levo-Dropropizine, studying different grade of Lactose, different concentration of Magnesium Stearate, Drug Load (DL) and blending procedure. How ever, micronized Levo-Dropropizine with selected formulation didn’t give satisfactory inhalation performance. During the present work comicronization with Magnesium Stearate and replacement of fine carrier with micronized Curcumin demonstrate to improve API inhalation performance. Surprisingly, less agglomeration between particles by co-micronization technique, shape similarity of micronized Curcumin with fine Lactose and usage of it as carrier into the formulation, improve aerosolization of Levo -dropropizine. Several formulations were produced, studying different combination and composition to better understand the impact of each component Micronized and co-micronized APIs were characterized by High Performance Liquid Chromatography (HPLC), Differential Scanning Calorimetry ( DSC), X-Ray Diffraction ( XRD), Scanning Electron Microscopy (SEM) and Laser Light Scattering (LLS). Blends and capsules were manufactured and characterized by Blend Homogeneity (BH), FT4 Rheometer, Next Generation Impactor (NGI) and Dosage Unit Sampling Apparatus (DUSA) Promising results were obtained with reduced agglomeration behaviour followed by increase of ED, FPF and FPD with reduced retentio n of material inside capsules, device and mouthpiece.
Key Message
Co-micronization process of Levo-Dropropizine and Magnesium Stearate reduced the micronized API agglomeration Furthermore, thanks to shape similarity between micronized Curcumin and fine Lactose Monohydrate, Curcumin was used as carrier in DPI formulation of Levo-Dropropizine The combination of these two approaches, permitted a deeper increase of inhalable particles of Levo-Dropropizine
Introduction
With an increase in general understanding of physiology and illness of the lung, pulmonary dru g delivery is becoming an alternative to treat local and systemic diseases. A predominant symptom in Idiopathic Pulmonary Fibrosis (IPF) is a non-productive cough that adversely affects quality of life [1]. Several treatments for cough exist on the market but, these have poor tolerability [2]. This issue for most antitussives on the market is related to central nervous system side effects. Additionally, these molecules are approved for use as syrup, oral drop and tablet forms. Thus, there is an urgent need of an alternative inhalable therapy. Levo-Dropropizine, a peripherally acting antitussive drug, has been selected for the present work thanks to good tolerability and safety profile compared to other antitussive agents that act centrally to suppress cough [3]. Clinical evidence indicates efficacy of Levo -Dropropizine to be like of centrally acting agents [4] and is also used for paediatric cough treatment [5]. In addition, Curcumin has been described as having antioxidant, anti-inflammatory, and anti-carcinogenic properties and has already been used to treat cancer, arthritis, digestive and liver abnormalitie s and respiratory infections [7,8]. Aim of the present work is to evaluate the performance of Levo -Dropropizine as a dry powder for inhalation (DPI) in combination with Curcumin. Curcumin was used as fine carrier into the Lactose carrier-based formulation and different co-micronization of APIs were performed to better understand the feasibility and improvement of inhalation performance of Levo -Dropropizine. The initial composition was selected using a Design of Experiments approach by Definitive Screening design, already performed.
183
Drug Delivery to the Lungs , Volume 32, 2021 - Formulation, Characterization and Optimization of Dry Powder for Inhalation using combined micronized Levo-Dropropizine and Curcumin
Materials and Methods
Materials
Levo-Dropropizine and Curcumin were purchased respectively by ClaroChem (Dublin, Ireland) and CoreyChem (China). Lactose Monohydrate LH230 and SV003 were purchased by DFE pharma (Goch, Germany), Magnesium Stearate from Peter Greven (Bad Muenstereifel, Germany) and HPMC DPI capsules from Capsugel (Lonza, Switzerland)
Methods
Levo-Dropropizine and Curcumin, alone and in combination with Magnesium Stearate , were micronized using a Labo Jet-mill and analyzed by Laser Light Scattering, XRPD and DSC Blends with micronized APIs were prepared by Procept High Shear Mixer equipped with 0.25 L bowl (50 g batch size). 250, 500 and 710 µm screens were used to sieve APIs, materials and mixtures. DPI Capsules were filled manually with 20 mg/cps corresponding to 3.0 mg dose each APIs. Manufactured blends were characterized using a FT4 powder rheometer, HPLC for blend homogeneity with evaluation of RSD %, L LS for PSD, NGI for aerosol particle size distribution (APSD) and DUSA dose delivery. One dose for each batch was tested using a Plastiape RS01 MOD7 HR device at 60 L/min using the NGI and DUSA; the powder collected was quantified by HPLC analysis. For the FT4 powder rheometer, the following measurements were conducted: Basic Flow Index (BFI), Flow Rate Index (FRI), Aeration test - Aeration Energy (AE) and Aeration ratio at minimum fluidization velocity (ARm), and Shear Cell test studying the Flow Function (FF). All the analysis were performed in triplicates.
Results and discussion
Levo-Dropropizine and Curcumin, both micronized and co -micronized with Magnesium Stearate were prepared and fully characterized by HPLC, DSC and XRPD to understand the feasibility and the impact of high energy process as micronization. No differences were observed in terms of chemical and physical properties of both APIs. SEM pictures and PSD on micronized APIs were also performed, to compare the particles dimension and shape between the two and between different Lactose Monohydrate grade, normally used into DPI carrier-based formulation (as shown in Figure 1 and Table 2). Levo-Dropropizine micronized tends to agglomerate as shown in SEM picture (A, Figure 1) while Curcumin and fine Lactose Monohydrate present both rectangular shapes (B, C and D, Figure 1) Furthermore, co-micronization process allows to reduce the Levo-Dropropizine PSD below 5 µm.
184
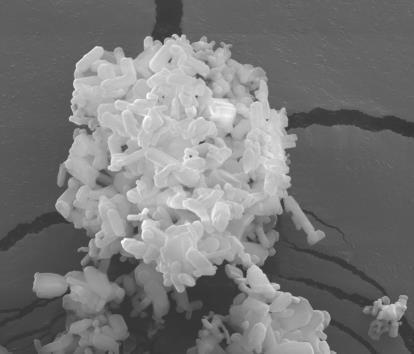
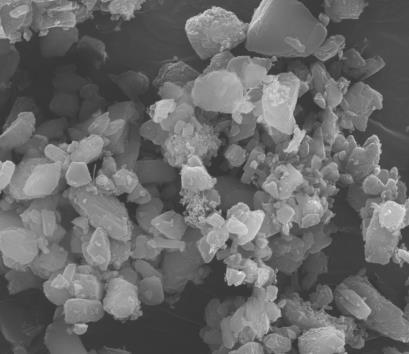
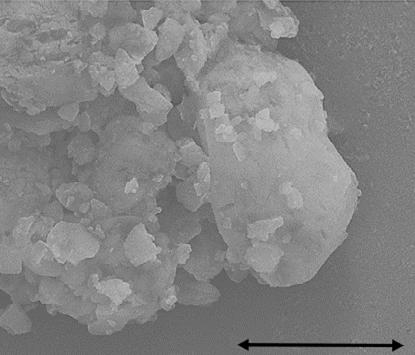
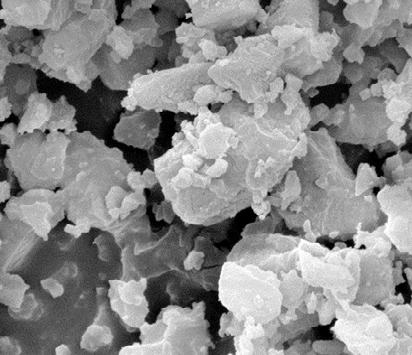
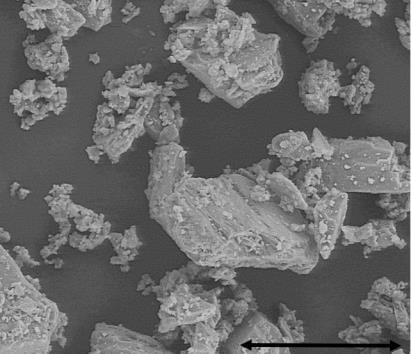
Four blends and their corresponding capsules were manufactured and fully characterized. In order to better understand the impact of each components, different compositions were studied: one with comicronized Levo-Dropropizine and Magnesium Stearate with Lactose LH230 as carrier (as per DoE formulation), one with both micronized APIs using Curcumin as carrier, one with co-micronized LevoDropropizine and Magnesium Stearate and micronized Curcumin as carrier and one with co -micronized APIs with Magnesium Stearate Compositions of each blend are shown in Table 2 The composition selected by previous DoE was added as reference.
Drug Delivery to the Lungs, Volume 32, 2021 – Carlotta Giulieri et al.
Figure 1 Micronized Levo-Dropropizine A, SEM magnification 4000x, micronized Curcumin B, SEM magnification 13000x and Lactose Monohydrate LH300 C, SEM magnification 14000x, Lactose Monohydrate LH230 D, SEM magnification 10000x, Lactose Monohydrate SV003 E, SEM magnification 2000x as reference
Material Levo-Dropropizine micronized Curcumin micronized Levo-Dropropizine and Mg St comicronized Levo-Dropropizine, Curcumin and Mg St co-micronized D10 (µm)* 1.2 ± 0.05 0.4 ± 0.02 0.5 ± 0.07 0.4 ± 0.05 D50 (µm)* 3.7 ± 0.20 1.9 ± 0.10 2.1 ± 0.07 1.7 ± 0.02 D90 (µm)* 11.4 ± 0.40 4.5 ± 0.20 6.4 ± 0.40 4.1 ± 0.10
Table 1 PSD obtained after micronization and co-micronization of Levo-Dropropizine and Curcumin
*Average ± Standard Deviation
Material Initial composition by DoE (% w/w) Composition 1 (%w/w) Composition 2 (%w/w) Composition 3 (%w/w) Composition 4 (%w/w) Levo-Dropropizine 15.00 15.00* 15.00 15.00* 15.00* Curcumin 0.00 0.00 15.00 15.00 15.00* Lactose Monohydrate, SV003 68.00 68.00 68.00 68.00 68.00 Lactose Monohydrate, LH230 15.00 15.00 0.00 0.00 0.00 Magnesium Stearate 2.00 2.00* 2.00 2.00* 2.00*
185
Table 2 Formulation compositions with micronized and co-micronized APIs.
*Co-micronization of the material.
Drug Delivery to the Lungs , Volume 32, 2021 - Formulation, Characterization and Optimization of Dry Powder for Inhalation using combined micronized Levo-Dropropizine and Curcumin
All blends, characterized by FT4 rheometer, exhibit always a Stability Index (SI) slightly higher then 1, indicative of powder affected by being made to flow, probably due to de-aeration and electrostatic charge of the material analysed. This tendency is confirmed also by a moderate cohesion observed by the Specific Energy (SE) results that falls into the range between 5 and 10 mJ/g. The Flow rate index (FRI) is also in agreement, since it falls above 3 meaning an average flow rate sensitivity and cohesiveness
All the data are confirmed by Flow Function (FF) values by Shear Cell. Higher cohesion was detected for trial 4 showing higher SE and FF values, probably due to smallest PSD, resulting in high electrostatic tendency Trail 4 also, exhibits less fluidized behaviour confirming higher cohesiveness as confirmed by the Aerated Energy (AE) and Aeration Ratio (AR).
Capsules’ performance results are shown in
Table 3 with APSD comparison in Figure 2. Comparing data, co-micronization of Levo-Dropropizine with Magnesium Stearate and usage of micronized Curcumin as alternative of fine carrier (composition 3), showed the best inhalation performance of Levo-Dropropizine, doubling FPD and FPF data compared to DoE formulation. Co-micronization helps to reduce the tendency of the API to agglomerate but also, the micronized Curcumin improve the aerosolization of the Levo -Dropropizine decreasing the retention of material inside capsules, device and mouthpiece. Moreover, the micronized curcumin exhi bits promising inhalation behaviour itself.
Table 3 Inhalation performance of Levo-Dropropizine: results comparison between compositions 1 to 4 and initial composition by DoE
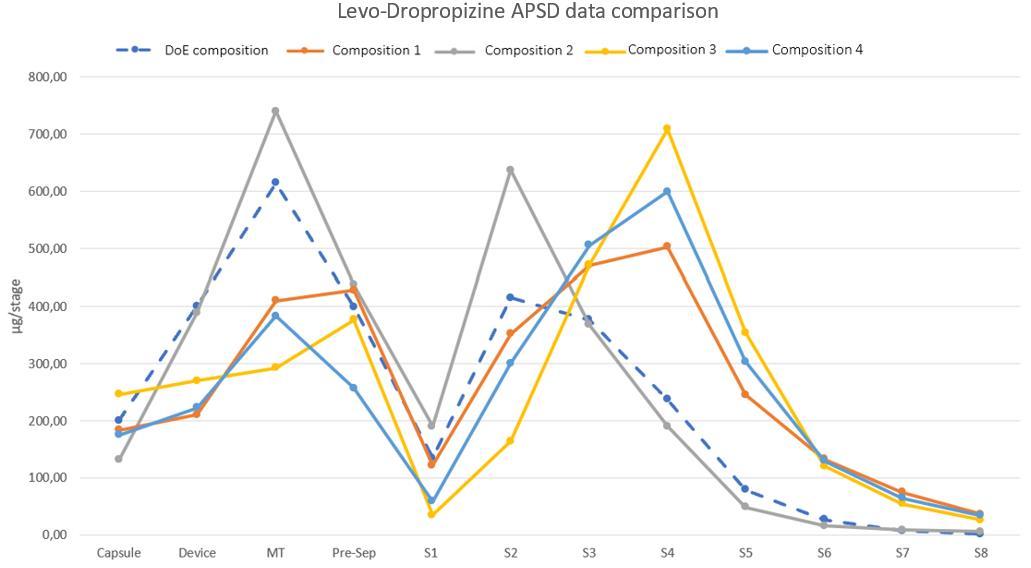
Initial composition by DoE Composition 1 Composition 2 Composition 3 Composition 4 AVG %RSD AVG %RSD AVG %RSD AVG %RSD AVG %RSD Delivered Dose (mg) 2.30 2 65 2 78 2 41 2.64 5 90 2.61 4 11 2.64 7 71 FPD (µg) 839 6 3 82 1562 8 3 82 794 34 7 34 1790 21 2 73 1734 53 9 22 FPF (%) 36 57 3 09 56 3 3 06 30 02 2 35 68 72 2 11 65 66 1 62 MMAD 4 00 0 72 2 70 0 70 4 77 1 59 2 25 0 65 2 50 1 00 GSD 1 80 0 90 2 00 0 49 1 58 0 97 1 71 0 58 1 87 1 14 ED (% of Label Claim) 78 80 1 12 86 47 4 02 75 35 5 43 100 07 2 97 86 87 3 58
186
Figure 2 Levo-Dropropizine APSD: results comparison between compositions 1 to 4 and initial composition by DoE
Conclusion
The current work permitted a deeper understanding on the inhalation performance of Levo-Dropropizine administered as DPI, impacted by a strong agglomeration of the particles after micronization. The use of co-micronization technique with Magnesium Stearate and combination with micronized Curcumin as fine carrier, improve the aerosolization of Levo-Dropropizine in DPI formulation (composition 3), and decrease the retention of material inside capsules, device and Mouthpiece. Moreover, the micronized Curcumin itself exhibits promising inhalation behaviour . Furthermore, one of the advantages of LevoDropropizine combined with Curcumin could be to use it as treatment of different pathologies, such as Idiopathic Pulmonary Fibrosis (IPF) with both systemic and local effects exploiting the pulmonary delivery reducing side effects.
References
[1] D. Rozenberg, N. Sitzer, S. Porter, A. Weiss, R. Colman, D.W. Reid, S. Shapera, J. Fisher, K. Wentlandt: Idiopathic Pulmonary Fibrosis: a review of disease, pharmacological and non -pharmacological strategies with a focus on symptoms, function and health -related quality of life. Journal of pain and Symptom Management JPC 2019; 10346.
[2] C. L. Vigeland, A. H. Hughes, M. R. Horton. Etiology and treatment of cough in idiopathic pulmonary fibrosis Respiratory Medicine 2017; 123: pp 98-104.
[3] S. Birring, F.de Blasio, P.V. Dicpnigaitis, G. Fontana, L. Lanata, C. Page, F. Saibene, A. Zanasi: Antitussive therapy: a role for Levo-Dropropizine. Pulmonary Pharmacology and Therapeutics 2019 ; 56: pp 79-85.
[4] C. Bruschi, P. Crotti, E. Dacosto, F. Fanfulla, L. Daffonchio, R. Novellini: Levo-Dropropizine does not affect P0.1 breathing pattern in healthy volunteers and patients with chronic respiratory impairment . Pulmonary Pharmacology and Therapeutics 2003; 16: pp 231-236.
[5] F. De Blasio, V. Dicpnigaitis, G. de Danieli, L. La nata, A. Zanasi: Efficacy of Levo-Dropropizine in pediatric cough. Pulmonary Pharmacology and Therapeutics 2012 ; 25: pp 337-342.
[6] J. Shur, H. Harris, M. D. Jones, J. S. Kaerger, R. Price: The Role of Fines in the Modification of the Fluidization and Dispersion Mechanism within Dry Powder Inhaler Formulations . Pharmaceutical Research 2008; Vol. 25, n. 7: pp 1931-1940.
[7] S. Avasarale, F. Zhang, G. Liu, R. Wang, S.D. London, L. London : Curcumin modulates the inflammatory response and inhibits subsequent Acute Respiratory Distress Syndrome , 2013. PLoS ONE 8 (2): e57285, DOI: 10.1371/journal.pone.0057285 (online only).
[8] S.J. Moghaddam, P. Barta, S.G. Mirabolfathinejad, Z. Ammar-Aouchiche, N. Torres Garza, T.T. Vo, R A. Newman, B B. Aggarwal, C. M. Evans, M.J.Tuvim, R Lotan and B.F. Dickey: Curcumin inhibits COPD-like airway inflammation and lung cancer progression in mice . Carcinogenesis 2009; vol. 30, no.11: pp 1949-1956.
Drug Delivery to the Lungs, Volume 32, 2021 – Carlotta Giulieri et al.
187
188
Fundamental properties of propellant aerosols can guide transition to low global warming potential pMDIs: size, velocity and surface charge
Irene Rossi1 & William J. Ganley1, Philip Chi Lip Kwok2, Ivan Zadrazil3, Graham Hassall3, Olivier Michelet4, Segolene Sarrailh4, Guillaume Brouet4, Robert Price1 & Jagdeep Shur1
1Nanopharm Ltd, An Aptar Pharma Company, Cavendish House Hazell Drive, Newport NP10 8FY
2Sydney Pharmacy School, Faculty of Medicine and Health, University of Sydney, Pharmacy and Bank Building A15, NSW 2006, Australia
3Dantec Dynamics, Garonor Way, Royal Portbury, Bristol, BS20 7XE
4Aptar Pharma, Route des Falaises, 27100, Le Vaudreuil, France
Summary
Lower global warming potential (GWP) propellants (hydrofluoroalkane, HFA, 152a and hydrofluoroolefin, HFO, 1234ze) are readily available replacements to those currently employed in lifesaving medications (HFA 134a and 227a). This study aimed to investigate fundamental physical properties of aerosols emitted from pMDIs using currently employed propellants and low GWP alternatives. The net surface charges for all propellants were positive, however HFO 1234ze generated near-neutral charges of both polarities , with HFO being the least bipolar propellant. However, water content was higher for this propellant as result of storage conditions and contribution of sub -assembly components (valve, canister, and actuator) . Net charge may determine relevant differences in aerosol deposition and, therefore, should drive formulation development approaches The droplet diameter and velocity for the different propellants fell into multiple groups (for example: the two low GWP propellant droplets were larger at short distances from the actuator). This information will guide the use of excipients to achieve desirable performance of products reformulated using these propellants. Finally, the results evidenced as well the influence of valve and actuator’s material components on the netcharges developed. Therefore, device sub-assembly components play an important role during pMDI re-formulation and development.
Key Message
The fundamental properties of currently used and new low GWP propellants have been characterised. Differences in aerosol droplet surface charge were observed for HFO 1234ze. Moreover, low GWP propellants droplets were larger at short distances from the actuator. These may determine relevant differences in aerosol deposition, which can be balanced by formulation composition.
Introduction
In 1987 the Montreal Protocol defined a pathway to eliminate the compounds proven to be harmful for the ozone, such as chlorofluorocarbon (CFC) employed as propellants in pressurised metered dose inhalers (pMDIs)[1] Since the adoption of the Kyoto Protocol in 1997[2] and the Europe F-Gas regulation in 2015[3] further amendments have been proposed which aims to reduce by over 80% by 204 7 the use of F-gases, known to contribute to global warming. These amendments have been foreseen to have again a great impact on the pharmaceutical industry and , particularly, on products for inhalation which contribute 2.4% of the total F-gases emissions[1]. It is therefore clear there is a real need here and now for alternatives to the current reliever pMDIs that are both affordable and exhibit a lower global warning potential (GWP)[4]. Research is on-going on the re-formulation and development of drugs for asthma and chronic obstructive pulmonary disease [5]
Differences in the physicochemical properties of high and low GWP propellants (such as vapour pressure and density) result in differences in aerosol behaviour (such as evaporation rate and surface charge) which will impact lung deposition for re-formulated products. Very little is currently known about the physicochemical fundamental properties of these low GWP propellants and their impact on pMDI aerosolisation and plume characteristics[6]
The aim of this study was to investigate fundamental physical properties of pMDI propellants currently employed in products on the market or explored as low GWP alternatives. Information on the differences in surface charge of aerosols has been collected. Such a dataset will help to guide formulation decisions.
Drug Delivery to the Lungs , Volume 32, 2021 – Irene Rossi & William J. Ganley et al.
189
Experimental Methods
Placebo uncoated canisters (H&T Presspart, U nited Kingdom) comprising an amount equal to 250 doses of four different propellants (pharmaceutical grade HFA 227a, supplied by Dehon, France; pharmaceutical grade HFA 134a and HFA 152a supplied by Koura Global, U nited Kingdom and industrial grade HFO 1234ze supplied by Honeywell, United Kingdom) were manually filled (P2016, DHI, United Kingdom) and crimped with a standard Aptar Pharma (France) valve (DF316, 50 µL). A standard generic actuator (OD 0.48/JL 1.5 mm) was employed to fire the placebo canisters ( H&T Presspart, United Kingdom)
One dimensional Phase Doppler Anemometry (PDA) was conducted by focussing the measurement volume into a sealed windowed enclosure with a dosage unit sampling apparatus (DUSA, Copley Scientific, UK) coupled to vacuum pump to one end and the devices attached to custom made mouthpiece adaptors at the other. A constant flow rate of 30 L/min was applied through the enclosure. The device was fired into the enclosure and the velocity and droplet diameter distributions over the entire plume were recorded. Measurements were performed at a number of positions within the spray plume.
The charges generated from placebo pMDIs were measured under ambient conditions (22.2 °C, 37.7% relative humidity) using a Bipolar Charge Analyser ( BOLAR; Dekati, Kangasala, Finland). One pMDI of each propellant was coupled to individual actuators for the tes ts and shaken for at least 5 s econds before each actuation Eight shots without priming were sampled by the BOLAR at 30 L/min. The aerodynamic cutoff diameters of the size fractions at this sampling flow rate were 0.722, 2.510, 4.787, 8.103, and 13.336 µm. The weight of each shot was determined by weighing the canister s before and after each actuation. No mass assay was conducted as the aerosols contained only propellants.
Water content in the pMDI was quantified by Karl Fisher titration (Mettler Toledo, USA). Five shots were analysed for each propellant.
Results and Discussion
The shot weight was highly consistent for all propellants , even though there was no priming (Table 1). They were also the expected shot weights for a metering volume of 50 µL when calculated with the corresponding liquid propellant density. Bipolar charges were measured on all propellants, with most charges present in the low est size fraction (0.722 µm) because the propellants were volatile and yielded small droplets (Figure 1) The pMDIs generated more positive charges than negative ones, thus the net charges were all positive. The apparent charging propensity differed between the propellants, with HFA 152a > HFA 134a > HFA 227a > HFO 1234ze in decreasing order (Figure 1). In particular, HFO 1234ze generated near-neutral charges of both polarities
An earlier study by Kwok et al showed that HFA 134a and HFA 227a produced net n egative charges when actuated from pMDIs [7], whereas they were net positive in this study. That could be due to the difference in the materials and/or geometry of the pMDI components (e.g. metering chamber, valve stem, and actuator) as well as on the water content, high water content has been prove d to invert the polarity[7]. The bipolar charging has been shown to be caused by disruption and separation of the double layer of positive and negative charges in the liquid propellant surface during aerosolisation [7]
Generally, the more polar the liquid molecules, the more easily it can become charged [7]. The charge levels measured by the BOLAR largely followed the ranking of their dipole moments and dielectric constants, which indicate the molecular polarity, except for HFO 1234ze (Table 2). HFO 1234ze c harged
Drug Delivery to the Lungs, Volume 32, 2021 - Fundamental properties of propellant aerosols can guide transition to low global warming potential pMDIs : size, velocity and surface charge
Propellant Density (g/mL) Amount filled (g) Shot weight (mg) HFA 134a 1.23 15.3 63.06 ± 0.61 HFA 227a 1.41 17.6 71.91 ± 0.47 HFA 152a 0.91 11.4 46.57 ± 0.45 HFO 1234ze 1.29 14.9 59.32 ± 1.94
Table 1. Propellants investigated: density, amount filled in the placebo pMDIs manufactured and their shot weights (n = 8, mean value ± standard deviation)
190
the lowest, even though its dipole moment was higher than that of HFA 227a. However, its behaviour can be explained by the solubility of water in the propellant, as it is the lowest for HFO 1234ze (Table 2), indicating this propellant as the least b ipolar. It is known that water in the propellant can affect its charging by increasing the electrical conductivity [7]. Therefore, water content in the propellants was measured (Table 2). Charging propensity and water content were correlated for HFA 152a an d HFA 134a, which reported the highest values. It is important to note that sub-assembly components (valve, canister and actuator) and storage conditions (in this case two months at uncontrolled ambient conditions) influence moisture content. This could ex plain the higher water content observed in HFO 1234ze compared to HFA 227a.
The droplet diameters and velocities of emitted droplets of each of different propellant are shown in Figure 2. The solid lines refer to the means of multiple repeat measurements where the mean droplet diameter and velocity is extracted from each measureme nt. The droplet diameters at short distances (which are relevant to impaction in the oropharynx) fall into two groups with HFO1234ze and HFA152a falling from 1.6 µm at 20 mm from the actuator mouthpiece to around 1.0 µm at 80 mm. Droplet diameters for HFA134a and HFA 227a fall from around 1.3 µm to 1.0 µm or a little under at 80 mm. The
Drug Delivery to the Lungs , Volume 32, 2021 – Irene Rossi & William J. Ganley et al.
Figure 1. Bipolar charge profiles of propellant aerosols (n=8, mean value and bars represent standard deviation)
Propellant Dipole moment Dielectric constant of liquid Solubility of water in propellant (ppm) Water content of placebo pMDIs (ppm) HFA 134a 2.058 9.8 (20°C) 2200 1689.9 (10.2%) HFA 227a 0.93 4.1 (20°C) 610 167.6 (43.9%) HFA 152a 3.69 12.52 (25°C) 2200 4052.6 (14.5%) HFO 1234ze 1.44 NA 225 903.4 (25.8%)
Table 2. Properties of propellants studied and water content of placebo pMDIs ( n=3, mean value and residual standard deviation in parenthesis).
191
Drug Delivery to the Lungs, Volume 32, 2021 - Fundamental properties of propellant aerosols can guide transition to low global warming potential pMDIs : size, velocity and surface charge
droplet velocities separate into three groups at 20 mm with HFA227a showing the fastest droplets, HFA134a and HFO1234ze being similar and slightly lower and HFA152a giving t he slowest droplet velocity. The differences in diameter become less at greater distances , but HFA227a shows a significantly greater droplet velocity at all distances measured.
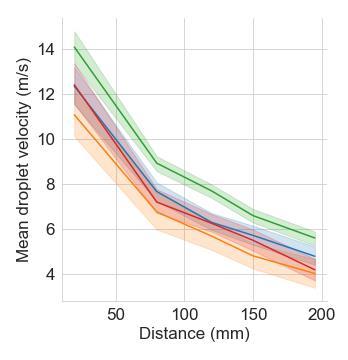
Conclusions
This work focused on the study of fundamental properties of propellants, present and greener ones. Even though net charges were all positive, differences have been observed with HFO 1234ze generat ing near-neutral charges of both polarities , in line with the water solubility value in HFO Droplet diameter and velocity measurements showed differentiation across propellants , which point towards the use of excipients such as ethanol, for example, to modulate the evaporation rate of the droplets This behaviour may determine relevant differences in aerosol deposition and, therefore, specific excipients should be considered during formulation development. Ultimately, the propellant droplet size distribution by number or by mass is required to properly evaluate charging propensity by calc ulating the number of charges per droplet or charge-to-mass ratio, respectively. However, the charge data obtained already showed interesting electrostatic behaviours of the low GWP propellants. Finally, the results evidenced as well the influence of valve, canisters and actuator ’s material components. Therefore, device subassembly components play an important role during pMDI re -formulation and development.
References
[1] Baron C: Moving toward a more sustainable future with pMDIs , Drug Dev and Del 2021, Respiratory Drug Development Edition, Summer 2021: pp 3-4 (eBook).
[1] Kyoto Protocol to the United Nations framework convention on climate change, Dec 10, 1997. 37 I.L.M. 22, 1998, 2303 U.N.T.S. 148, U.N. Doc. FCCC/CP/1997/7/Add.1.
[3] Official Journal of the European Union, L 150, 2014, Regulations (EU) No 517/2014 of the European Parliament and of the Council of 16 April 2014 on fluorinated greenhouse gasses and repealing Regulation (EC) No 842/2006.
[4] Pritchard J N, The Climate is changing for metered-dose inhalers and action is needed, Drug Des, Dev and Ther 2020, 14: pp 3043-3055
[5] Ganley J W et al, Predicting the regional deposition and systemic exposure of albuterol sulfate formulated with low global warming potential propellants. (Abstract). Presented at: Respiratory Drug Delivery 2021, May 4-7, 2021; Edited by Dalby RN, Byron P R, Hindle M, Peart J, Traini D, Young P M, Farr S J, Suman J D, Watts A. DHI Publishing; River Grove, IL: 2021: pp 215-128.
[6] Stein W S et al, Experimental and theoretical investigations of pMDI atomization and plume characteristics using alternative propellants Presented at: Respiratory Drug Delivery 2021, May 4-7, 2021; Edited by Dalby RN, Byron P R, Hindle M, Peart J, Traini D, Young P M, Farr S J, Suman J D, Watts A. DHI Publishing; River Grove, IL: 2021: pp 15-26.
[7] Kwok P C L et al, Effect of moisture on the electrostatic charge properties of metered dose inhaler aerosols , J Aerosol Sci 2008, 39: pp 211-226.
Figure 2 Mean diameter (left) and velocity (right) of emitted HFA134a (blue ), HFA227a (green), HFA152a (orange) and HFO1234ze (red) at 20, 80, 150 and 195 mm from the actuator mouthpiece with a 30 L/min co-flow. Lines are means and ribbons are ranges of repeat measurements.192
Investigation on the impact of resonant acoustic mixing parameters and carrier type on the deposition patterns of Budesonide/Formoterol Fumarate DPI combination product
S Radivojev1,2, M Beretta1,3, V Reinisch1, V Rehbein1, J T Pinto1, E Frönlich1,2, & A Paudel1,31Research Center Pharmaceutical Engineering GmbH, Inffeldgasse 13, Graz, 8010, Austria
2Center for Medical Research, Medical University of Graz, Stiftingtalstraße 24, Graz, 8010, Austria
3Institute of Process and Particle Engineering, Graz University of Technology, Inffeldgasse 13, Graz, 8010, Austria
Summary
Dry powder inhalers (DPIs) are commonly used systems for the delivery of inhaled therapeutic s. Most of the available DPI systems consist of larger carrier excipient particles (in the size range of 100-150 µm) mixed with the micronized drug (typically 1-5 µm), resulting in a complex interplay between (i) selecting proper blending parameters (ii) identifying the optimal carrier particle properties, as well as (iii) selecting the most appropriate device for delivery. Therefore, the aim of this study was to evaluate the blending parameters necessary to produce homogeneous blends of a Budesonide (BUD)/Formoterol Fumarate (FF) DPI. For this, a resonant acoustic mixer was used and short blending times (30 and 90 s) combined with different acceleration levels (30, 45 and 60 g) were applied Two different carriers were used (α-lactose monohydrate (αLH) and mannitol (MAN)) , while the aerosolization performance was investigated using two types of inhaler s, namely Cyclohaler® (CH) and Novolizer® (NOV). Finally, the predicted deposition patterns were evaluated. We found that for αLH blends, homogeneity was achieved with lower blending times compared to MAN containing ones. Nevertheless, the selection of MAN as a carrier in a combination with NOV resulted in the improvement of the aerodynamic performance of the BUD/FF combination therapy In-silico modelling of the deposition profiles showed that different formulation strategies, resulted in comparable fractions of the delivered to the peripheral (P) and central (C) region of the lung yet different in the extra-thoracic region (ET) This could be relevant when designing formulations intended for a localized therapeutic effect.
Key Message
Investigation of the process parameters and carrier type s showed that MAN combined with reservoir type of device could deliver higher amounts of drugs to the lungs. The developed deposition model showed the relevance of investigating further subtle differences present in aerodynamic performance data when developing a DPI formulation.
Introduction
DPIs are products commonly used to deliver inhaled therapeutics. Various formulation approaches have been reported to be able to yield DPIs, and roughly can be described as either carrier-free or carrierbased ones; with the first one consisting of soft agglomerates of a ctive pharmaceutical ingredient (API) while the second represents a physical mixture between API(s) and carrier. The majority of available products in the market are carrier-based DPIs, resulting in improved fine particle fraction (FPF) , i.e. the fraction of an aerosolized API having particle size below 5 µm, thus reaching the deep lung [1]. Having in mind the size of API, one must be aware of the complexity involved in its delivery Hence, the selection of an appropriate carrier type, loading of API(s), blending conditions and selection of the device are crucial in achieving the desired therapeutic effect. Additionally, various in-silico methods can help in elucidating how different formulation strategies can impact the deposition patterns and/or pharmacokinetic behavior (PK) of inhaled drugs [2] Therefore, the aim of this work was to use a combined in-vitro-in-silico approach and study how (i) different carriers (i.e. αLH and MAN), and (ii) blending conditions will impact blend uniformity and its aerosol ization performance coupled with (iii) the device selection Furthermore, the deposition patterns of selected blends were evaluated
Materials and methods
BUD and FF were kindly provided by Chemo (Laboratorios Liconsa S.A., Spain) and Chiesi Farmaceutici S.p.A. (Italy), respectively. DPI formulations were prepared using αLH, InhaLac® 230 (Meggle, Germany) and MAN Parteck® M DPI (Merck, Germany) as a carrier. For analytical analysis, all the chemicals were of the analytical grade.
Drug Delivery to the Lungs , Volume 32, 2021 – S Radivojev et al.
193
Drug Delivery to the Lungs, Volume 32, 2021 - Investigation on the impact of resonant acoustic mixing parameters and carrier type on the deposition patterns of Budesonide/Formoterol Fumarate DPI combination product
Blends preparation and characterization
The impact of five different blending conditions on the drug content uniformity of αLH- and MAN-based mixtures was investigated using a laboratory scale resonant acoustic mixer (LabRAM I ResonantAcoustic® Mixer, ResodynTM Acoustic Mixers, USA), in a 236 mL vessel. Blending was done either for 30 s, at three acceleration levels (30, 45 and 60 g) or for 90 s at 30 an d 60 g, resulting in total of 10 double combination DPI blends. The API loading was 1 wt% for BUD and 0.02 wt% for FF. The blend uniformity was evaluated using high performance liquid chromatography (HPLC), by analyzing the content of ten samples, taken at different positions within the powder bed. The uniformity was acceptable when the relative standard deviation (RSD) was ≤ 10% [3] .
Aerodynamic performance of blends
Three blends with acceptable uniformity were further selected to characterize the impact of the inhaler and carrier on the aerosolization behavior The assessment was performed using the Next Generation Impactor (NGI; Copley Scientific, UK) comparing capsule-based (Cyclohaler®, CH) and reservoir-based (Novolizer®, NOV) inhaler. All experiments were carried out in triplicates and at a flow of 60 L/min. For the Cyclohaler®, the formulations were loaded into 20 hydroxypropyl methylcellulo se (HPMC) capsules size 3, whereas in the case of Novolizer ®, 40 actuations were found to suffice.
In-silico prediction of ICS/LABA deposition patterns
The impact of different formulation strategies on the deposition patterns of BUD and FF was investigated with Multiple-Path Particle Dosimetry Model (MPPD; Applied Research Associates, Inc, USA) , using the mass median aerodynamic diameter (MMAD) and geometric standard deviation (GSD) from the three selected blends. The parameters used are described in Tables 1 and 2 for BUD and FF, respectively In case of BUD, the tidal volume (TV) was 3200 mL, with an inhalation time (IT) of 3.20 s, a pause (p) of 9.60 s and an exhalation (EXH) of 9.30 s. For FF, the values were 3400 mL, 3.40 s, 9.40 s and 9.60 s for TV, IT, p and EXH, respectively [4]
Results and Discussion
The challenges that occur during blending and can affect drug homogeneity are well described in the literature, with the complexity increasing in case of double or triple API combination products. In this
Parameter Value Inhaler CH NOV Aerodynamic performance MMAD [µm ± SD] GSD ± SD MMAD [µm ± SD] GSD ± SD αLH-blend 1.72 ± 0.10 3.28 ± 0.02 2.20 ± 0.09 2.43 ± 0.27 MAN-blend 1 1.27 ± 0.77 2.99 ± 1.06 1.36 ± 0.12 2.86 ± 0.16 MAN-blend 2 0.76 ± 0.10 4.44 ± 0.42 1.38 ± 0.05 2.77 ± 0.05
Table 1 Parameters used as an input for BUD in-silico predictions (Lung Geometry: stochastic lung, 60th percentile of airways)
Parameter Value Inhaler CH NOV Aerodynamic performance MMAD [µm ± SD] GSD ± SD MMAD [µm ± SD] GSD ± SD αLH-blend 2.10 ± 0.07 2.54 ± 0.01 2.50 ± 0.10 2.09 ± 0.21 MAN-blend 1 1.83 ± 0.48 2.38 ± 0.61 1.91 ± 0.15 2.39 ± 0.09 MAN-blend 2 1.46 ± 0.20 2.84 ± 0.16 1.82 ± 0.07 2.89 ± 0.06
Table 2 Parameters used as an input for FF in-silico predictions (Lung Geometry: stochastic lung, 60th percentile of airways)
194
work, we wanted to evaluate a double combination product of BUD and FF using a carrier-based formulation, as a potential alternative to Symbicort®. For the MAN based blends, drug homogeneity was achieved after 90 s of mixing, at both acceleration rates i.e. 30 and 60 g (Figure 1). In turn, in the blends containing αLH, 30 s combined with 60g of acceleration resulted in a homogeneous blend. Different blending trends of BUD and FF were observed when comparing αLH and MAN as carriers. In the presence of αLH, FF was homogeneously distributed with higher blending times and accelerations, compared to BUD where de-mixing was noted. In blends containing MAN, the homogeneous distribution of FF depended upon the mixing time rather than acceleration levels, compared to BUD. The observed phenomena can be attributed to the higher surface area of MAN particles i.e. for the same quantity of the API longer time was needed to achieve an even distribution of smaller API particles over the bigger carrier ones [5]. Moreover, the mixing behavior and efficiency might be impacted by difference in loading of the two API i.e. 1 wt% BUD and 0.02 wt% FF
For the delivery of carrier-based formulations, two main types of DPI devices are commonly used; singledose such as CH (capsule-based) ones and multi-dose such as NOV (reservoir -based). Three blends with satisfactory homogeneity (i.e., one αLH mixture obtained after blending at 60 g for 30 s and two MAN mixtures prepared at 30 and 60 g for 90 s) were further evaluated in terms of their aerodynamic performance. Interestingly, for all blends a higher FPF was seen when the reservoir -based inhaler was used, i.e. the FPF values were approx. 30% for the αLH-based blend and approx. 40% for the MAN ones. Similar results have previously been reported, and attributed to the morphology difference between the two carriers [5] Additionally, it could be a result of the NOV predominant dispersion mechanisms i.e. centrifugal forces present makes this type of inhaler more efficient in dispersing the APIs from larger carriers. On the contrary, f or the capsule-based inhaler, the FPF was around 23-24% for both the αLH- and MAN-based blends. The similarity observed can be attributed to the lower dependence of CH on the carrier properties i.e. the dispersion is based on the turbulent kinetic energy of the airflow [5]
When discussing the deposition patterns of inhaler aerosols, usually rough estimations based on the particle size are accepted. For instance, particles bellow 1 µm are considered exhaled, between 1 and 5 µm are deposited and bigger than 5 µm are swallowed. Yet, when subtle differences between formulations are found, slight differences in the deposition patterns, might be critical when designing formulations that aim to specifically target different regions of the lung . Therefore, the use of different in-silico methodologies can be helpful to gain insight into the potential in-vivo deposition patterns and to de-risk the product dev elopment process In this work, we employed a simple 1D whole lung model, MPPD. Analysis of the MMAD showed that, compared to αLH blends (Tables 1 and 2), MAN mixtures deliver smaller particles of both APIs to the lung s, independently of the used inhaler. The resulting deposition fractions are showed in the Figure 2 Although, the fraction delivered to the peripheral region of the lungs was comparable between the blends and carrier, notable difference s can be seen for the ET region (i.e. fraction that is assumed to be swallowed ), and consequently, on the total fraction delivered to the lungs (data not shown). Interestingly, the MMAD of the BUD particles delivered with the
Drug Delivery to the Lungs , Volume 32, 2021 – S Radivojev et al.
Figure 1: Effect of blending process parameters on the blend uniformity (RSD) of the prepared adhesive mixtures: (a) FF and (b) BUD in αLH-based mixtures; (c) FF and (d) BUD in MAN-based mixtures
195
CH inhaler (MAN-blend 2) was 0.76 µm followed by high GSD (4.44), indicating the presence of a highly heterodisperse aerosol [1]
As mentioned previously, particles having 0.76 µm are usually assumed to be exhaled. Therefore, simulation of deposition patterns was not possible, as the MPPD software was displaying an error. Different 1D models have been developed so far and are used for different p urposes (e.g. environmental aerosols). Despite the existence of more realistic ones, that are based on the actual measurements of the airways and also can account for hygroscopicity and volatility of inhaled aerosols [2], they still fail to account for the anatomical variability within the deep lung that stands from different age, sex or disease status. Even though our simulations showed fractions that were similar in terms of delivered percentage to the lungs, the total amount would vary considering the distinct amounts expected to be swallowed, thus potentially impacting the desired therapeutic effect and the adverse effect profile due to drug deposition through the GI tract. Although the use of simple 1D model can be us eful a priori as a first indication of the DPI in-vivo behavior, the use of more realistic 3D models such as computational fluid dynamic (CFD) simulations could provide a better understanding of the process
Conclusion and outlook
This study outlines the relevance of a proper selection of the different blending conditions, carrier type and inhaler device when designing carrier-based formulations of ICS/LABA combinations. Furthermore, we showed that the combination of MAN with a reservoir type of inhaler could potentially be used as an alternative towards delivering higher FPF s of BUD and FF to the lungs. In-silico modelling of the deposition revealed that the total amount of APIs distributed within the lung generations can vary depending on the selected formulation. Further work is necessary to investigate would this, in turn, potentially impact the PK behavior of the APIs in-vivo
References
[1] D. Traini, Inhalation Drug Delivery , 2013.
[2] P. G. Koullapis, F. S. Stylianou, J. Sznitman, B. Olsson, and S. C. Kassinos, “Towards whole -lung simulations of aerosol deposition: A model of the deep lung,” J. Aerosol Sci., vol. 144, p. 105541, 2020.
[3] European Medicines Agency, “Guideline on the Pharmaceutical Quality of Inhalation and Nasal Products Draft,” pp. 1 –15, 2012.
[4] Á. Farkas et al., “Numerical simulation of emitted particle characteristics and airway deposition distribution of Symbicort® Turbuhaler® dry powder fixed combination aerosol drug,” Eur. J. Pharm. Sci., vol. 93, pp. 371–379, 2016.
[5] N. Hertel, G. Birk, and R. Scherließ, “Particle engineered mannitol for carrier-based inhalation – A serious alternative?,” Int. J. Pharm., vol. 577, p. 118901, 2020.
Drug Delivery to the Lungs, Volume 32, 2021 - Investigation on the impact of resonant acoustic mixing parameters and carrier type on the deposition patterns of Budesonide/Formoterol Fumarate DPI combination product
Figure 2: Predicted deposited fractions following inhalation of BUD from (a) CH and (b) NOV as well as of FF from (c) CH and (d) NOV. The arrow marks missing prediction due to particle size; ET: extra-thoracic, C: central and P: peripheral compartment
196
A high force pMDI for delivery into the olfactory region of the nasal cavity
Andy Cooper1, Barzin Gavtash1
1 Kindeva Drug Delivery, Charnwood Campus, 10 Bakewell Road, Loughborough, Leicestershire LE11 5RB
Summary
A high force nasal pMDI has been designed which enables greater penetration and deposition of the spray within the nasal cavity. This may be useful for targeting nose-to-brain delivery via the olfactory region.
In-vitro data suggests a step change in spray penetration versus current commercial nasal pMDI products, which are less feasible for deep nasal cavity delivery . The high force and expected lower plume temperature, of the new device, may though present additional discomfort for the patient. Further work is also required to establish the performance of the high force nasal pMDI with a range of formulations and nasal cavity geometries.
Key Message
A nasal pMDI has been designed to generate higher force than current commercial nasal pMDI products This enables greater penetration of the spray within the nasal cavity , which may be useful for targeting nose-to-brain delivery via the olfactory region
Introduction
It is considered that nose-to-brain drug delivery requires formulation to be delivered to the olfactory region of the nasal cavity [1] Multiple devices are capable of delivering drug formulations deep into this region, such as those from Optinose ®, Impel NeuroPharma® and Kurve Technology® [2, 3, 4]. They demonstrate more penetrative delivery than a traditional nasal spray, which are considered less feasible for olfactory delivery. Commercial nasal pMDI products – with short nosepieces and relatively narrow nozzles - are also less feasible for nose-to-brain drug delivery [5, 6].
We have developed a high force nasal pMDI which includes an elongated nosepiece and a larger , longer spray nozzle. In-vitro assessments with this device demonstrate spray penetration and deposition beyond the nasal vestibule, into the olfactory region – see Figure 1. This long nozzle configuration has previously shown to yield a combination of narrow spray angle, large droplet size and high spray velocity due to the ballistic trajectory of the droplets [7] These characteristics may be useful for targeting noseto-brain delivery via the olfactory region .
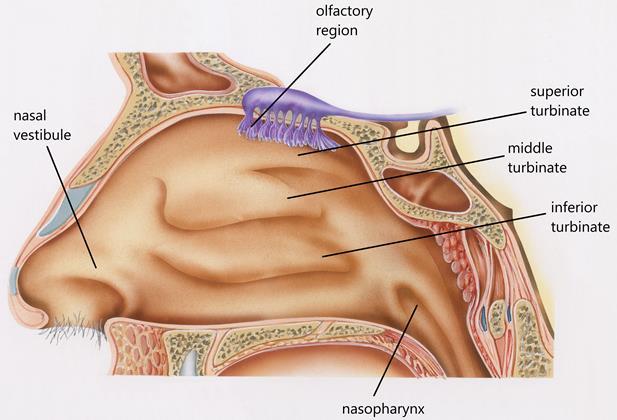
Drug Delivery to the
,
al.
Lungs
Volume 32, 2021 - Andy Cooper et
197
Figure 1. Schematic of the nasal cavity
Experimental methods
A high force nose-to-brain pMDI device has been designed and manufactured, as shown in Figure 2 In comparison to a standard nasal pMDI device, this incorporates an elongated nosepiece containing a larger nozzle Testing was then conducted with this device, and a commercial nasal pMDI device –ZetonnaTM [8]
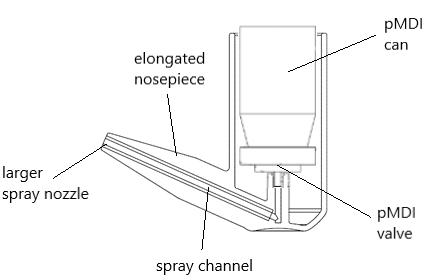
Spray Force
Spray force was measured using the Spray Force Tester (SFT 1000, ex -Copley). A placebo aerosol unit (HFA 134a) was placed in each device and actuated at a 5 cm distance from the load cell which records the maximum force during the spray event.
Imaging – Anatomical cast
Devices coupled to aerosol units containing brilliant blue dye (4mg/mL in HFA134a, 227 and 152a) were actuated into a transparent model of the human nasal cavity [ 9]. This standardised geometry was created from 30 sets of computed tomography (CT) scans of nasal airways from healthy subjects. The cast was 3D printed by using Formlabs (Form 2) SLA 3D printer using a clear resin to ensure transparency of the final part.
Images of the dye deposition within the cavity are captured as images, and the percentage of olfactory deposition is determined using digital image analysis computer routines - The blue colour pixels in each image within the cast boundary are identified, then the olfactory deposition calculated based on the amount of the olfactory region area covered by brilliant blue dye, weighted by the blue colour intensity, and finally reported as a percentage of the total area covered by brilliant blue within the whole cavity. The olfactory boundary is as shown in Figure 3.
Chemical assay – Anatomical cast
Devices, coupled with aerosol units containing suspended Fluticasone Propionate (FP – 2mg/mL in HFA134a), are actuated into an opaque, segmented model of the same standardised human nasal cavity geometry [9] The main body of the cast was 3D printed in a rigid Nylon material and the n asal vestibule portion manufactured in a flexible polyurethane material – to mimic the flexibility of a person’s nose Each of the components was arbitrarily assigned a nasal cavity region based on the regions of the geometry that it includes.
The cast is coated with a simulated mucus material (15:51:34 w/w/w Brij 35: Ethanol: Glycerol) – The coating was applied to each of the components initially u sing a disposable plastic pipette, then spread along the entire surface with a swab before allowing to dry. Once the cast is assembled, t he airflow was set to 5 litres per minute For each component, FP is recovered using an appropriate solvent and the sample analysed by HPLC-UV versus standard solutions of known concentration.
Drug
to the
,
-
Delivery
Lungs
Volume 32, 2021
A high force pMDI for delivery into the olfactory region of the nasal cavity
Figure 2 Design for high force nose-to-brain pMDI device
198
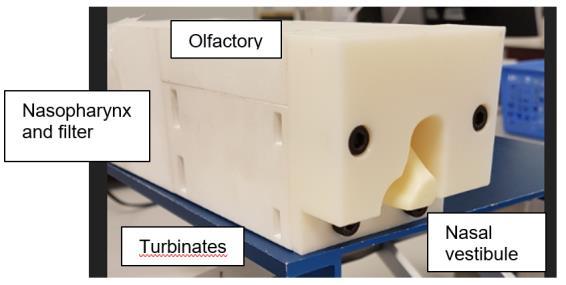
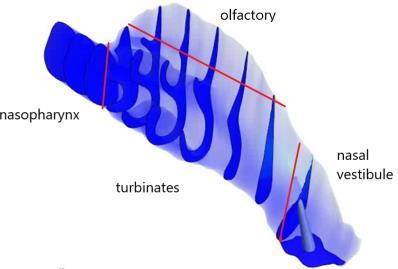
Results and discussion
In-vitro data has clearly demonstrated – both visually and quantitatively – that reducing the flow path restriction (e.g. increasing the device nozzle size) leads to an increase in spray force and higher olfactory deposition – see Figures 4 and 5 Such high forces are not observed for current commercial nasal pMDI products [10, 11] - the measured force for ZetonnaTM was only ~54mN. The high forces and expected lower plume temperatures, from the new device, may though present additional discomfort for the patient.
Quantitative FP assay data from a nasal cast confirms the visual image analysis data. As shown below, over 25% of ex-device deposition was in the assig ned olfactory component. Although FP assay recovery was not performed on the nasal vestibule component, mass balance values within 85-115% indicate the deposited drug was fully accounted for Low pulmonary breakthrough is also indicated (i.e. <1% exdevice deposited on filter)
Drug Delivery to the Lungs , Volume 32, 2021 - Andy Cooper et al.
Figure 3. Nasal cavity cast for assay - annotated photograph (left), annotated schematic (right)
Figure 4 Graph of olfactory deposition (image analysis) for various pMDI types. Each MDI type is also annotated with its corresponding plume force and a photograph showing the regional deposition
Figure 5. Graph of olfactory deposition (image analysis) for various pMDI types - HFA 227 (left), 152a (right)
199
Drug Delivery to the Lungs , Volume 32, 2021 - A high force pMDI for delivery into the olfactory region of the nasal cavity
Conclusion
A high force nasal pMDI has been designed which enables greater penetration and deposition of the spray within the nasal cavity. This may be useful for targeting nose-to-brain delivery via the olfactory region
In-vitro data suggests a step change in spray penetration performance versus current commercial nasal pMDI products, which are less feasible for deep nasal cavity delivery The high forces and expected lower plume temperatures, of the new device, may though present additional discomfort for the patient. Further work is also required to establish the performance of the high force nasal pMDI with a range of formulations and nasal cavity geometries
References
[1] Formulation and device design to increase nose to brain drug delivery, Journal of Drug Delivery Science and Technology, volume 35, 2016, 213-222
[2] Nasal Deposition and Clearance in Man: Comparison of a Bidirectional Powder Device and a Traditional Liquid Spray Pump, Per Gisle Djupesland, Arne Skretting, JOURNAL OF AEROSOL MEDICINE AND PULMONARY DRUG DELIVERY, Volume 25, Number 5, 2012, Pp. 280–289
[3] http://www.kurvetech.com/pdf/ViaNaseDataSheet.pdf (Accessed Sept 2021)
[4] http://impelnp.com/wp-content/uploads/2018/07/PosterSFN2013_Nov -12-2013.pdf (Accessed Sept 2021)
[5] Nasal Deposition of HFA-Beclomethasone, Aqueous Fluticasone Propionate and Aqueous Mometasone Furoate in Allergic Rhinitis Patients, Chet L. Leach, PhD, Philip J. Kuehl, PhD, Ramesh Chand, MS, and Jacob D. McDonald, PhD, JOURNAL OF AEROSOL MEDICINE AND PULMONARY DRUG DELIVERY, Volume 28, Number 5, 2015, Pp. 334–340
[6] Improving nasal drug delivery with HFA nasal aerosols. Derbyshire H, Patel N, Wheeler A Drug Delivery to the Lungs, The Aerosol Society, Edinburgh, UK. 2013: 213-6
[7] A Long Nozzle for Intra-Nasal Drug Delivery by pMDI: Prediction of Spray Velocity and Droplet Size Barzin Gavtash, Henk Versteeg, Ben Myatt, Andy Cooper, Edward Long and Christopher Blatchford, Respiratory Drug Delivery 2021
[8] https://fda.report/DailyMed/f0316d1b-9ba8-4ef3-9802-4cfed5d91d55 (Accessed Sep 2021)
[9] Creation of a standardized geometry of the human nasal cavity., Y Liu, M R Johnson, E A Matida, S Kherani, J Marsan, J Appl Physiol (1985). 2009 Mar;106(3):784-95
[10] A new method to evaluate plume characteristics of hydrofluoroalkane and chlorofluoroc arbon metered dose inhalers, Gabrio, B. J., Stein, S. W., Velasquez, D. J., Int.J.Pharm., 186 (1) (1999) 3 – 12.
[11] Evaluation of impaction force of nasal sprays and metered‐dose inhalers using the Texture Analyser, Guo et al, Journal of Pharmaceutical Sciences, Volume 98, Issue 8, August 2009, Pages 2799-2806
Ex-device (%), n=3 Region Average Standard deviation Turbinates 70.7 3.8 Olfactory 27.7 3.8 Nasopharynx 1.1 0.1 Filter 0.5 0.1
Table 1. Nasal cast regional deposition assay data for Fluticasone Propionate with the high force device
200
The application of morphological filters in automated imaging for nasal formulations: a design of experiment approach
Paulo Serra1, Jared Hall1, Irene Rossi1, Jagdeep Shur1 & Robert Price11Nanopharm Ltd, An Aptar Pharma Company, Cavendish House Hazell Drive, Newport NP10 8FY , United Kingdom
Summary
Particle size distribution (PSD) is possibly one of the most important critical material attributes (CMAs) in bioequivalence studies for nasal spray The use of automated imagi ng, combined with Raman spectroscopy (MDRS), allows to measure the PSD of each component present in the formulation individually. The aim of this study was to highlight the importance of morphological filters application for MDRS method development and how they can be efficiently selected though a screening Design of Experiment (DoE). Twenty two different filters combinations have been used to analyse Flonase ® formulation (fluticasone propionate, FP and microcrystalline cellulose - MCC) Only one single combination (number 10) showed a good power of particle selection, proven also by Raman identification: only 6 particles of microcrystalline cellul ose been picked as potential FP particles between the one screened by the filters applied. Results obtained showed that and approach by a screening DoE can lead to a quickly defined working set of filters for the measurement of just API particles in nasal spray. A further DoE for optimization of these parameter s will increase the method efficiency of particle detection Moreover, the same approach will be applied to nasal formulations comprising suspended proteins and peptides in order to show the importance of filters and automated imaging combined with Raman for PSD and morphological analysis of such complex products.
Key Message
Application of morphological filters in automated imaging allows to more efficient and time -cost effective development of a suitable method for characterization of complex nasal spray suspensions in bioequivalence study. P articularly, a screening DoE was useful to select the most relevant filters for identification and PSD determination of API in Flonase® formulation.
Introduction
Nowadays, the development of a generic product is always more often performed by implementing a quality by design approach, taking into account amount 3 key points: test formulation is qualitatively the same as reference- listed drug (RLD) (Q1); test formulation is quantitatively the same as RLD (Q2); test product and RLD must have similarity in th e same physicochemical properties (the same microstructure, Q3) [1]
For two products bioequivalence studies, investigation of the critical material attributes (CMAs) is essential in order to prove similarity for the critical quality attributes (CQAs) betw een RLD and test product [2]. Between the essential CMAs for inhalation products, particle size distribution (PSD) is possibly one of the most important. PSD is traditionally determined by laser scattering techniques, but can also be determined by automated imaging by the M4 -ID (Malvern Panalytical, Malvern, UK) . The use of automated imaging, combined with Raman spectroscopy, allows to measure the PSD of each component present in the formulation individually Furthermore, distinct features, in terms of morphology, of excipients present in the formulation can be used to visuall y distinguish them from the active pharmaceutical ingredients (APIs). One application of this is for example for nasal sprays. Excipients such as microcrystalline cellulose present very distinct morphological features (such as elongation and light intensit y) in comparison to the API.
Drug
,
–
Delivery to the Lungs
Volume 32, 2021
Paulo Serra et al.
201
Morphological filters allow to visually differentiate multiple components (as per Figure 1) in a mixture or to remove undesirable/not relevant particles from the results. The application of these filters is essential to accurately and efficiently measure and analyse API particles, filtering the excipients, enhancing the efficacy of the measurement and providing insight into the microstructures characteristics existing in the nasal formulation. All these advantages allow a more efficient and time-cost effective development of a suitable method for Morphology-Directed Raman Spectroscopy (MDRS) during bioequivalence Q3 studies.
The aim of this study was to highlight the importance of morphological filters appl ication for MDRS method development. Particularly, a screening DoE approach can be explored to efficiently establish the most characteristic filters for a specific RLD formulation, allowing to identify API particles from excipients in complex nasal formulations.
Experimental Methods
A commercially available RLD product ( Flonase, GSK, UK, containing Fluticasone propionate, microcrystalline cellulose) was prepared and analysed using a M4-ID from Malvern Panalytical (Malvern, UK). A sample was prepared by spraying the nasal formulation over a Quartz plate. The sample was then analysed (in triplicate to evaluate RSD without the impact of multiple samples variability on the results) by M4ID using the 50x magnification lens, using 1.0 mm of scanning area and 70% light intensity. The available morphological filters were accessed, and their combination evaluated through a screening design of experiments (DoE): Elongation – Critical filter as microcrystalline cellulose tends to be more elongated than the API (Figure 1); Circularity – quantifies how close a shape is to a perfect circle. It works as the opposite of the elongation filter, so results fo r those two filters may overlap; Solidity – the particle area divided by the area enclosed by the convex hul l; Convexity – measures the roughness of a particle surface; Aspect ratio - It works as the opposite of the elongation filter, so results fo r those two filters may overlap; Intensity mean value – determines the mean of the particle transparency; Intensity SD – determines the standard deviation of the particle transparency. Some examples are depicted in Table 1.
Elongation
Circularity
Solidity
Convexity
Aspect Ratio
Intensity mean value
Intensity SD
Drug Delivery to the Lungs , Volume 32, 2021 - The application of morphological fi lters in automated imaging for nasal formulations: a design of e xperiment approach
Figure 1. Examples of morphological differences between an API particle (left) and microcrystalline cellulose (right). The values presented stand for the CE Diameter (µm) and the images were collected with a 50x magnification lens.
Table 1. Visual examples of the filters explained.
Value Low High
202
Drug Delivery to the Lungs , Volume 32, 2021 – Paulo Serra et al.
The filters and respective limits (0 to 1 unless it is light intensity related parameters, in this case from 0 to 250) were assessed. The upper limit for each filter was defined up to a limit of 0.9 instead of 1, in order to avoid total removal of particles and up to 160 for light intensity filters, also in this case higher values will results in total removal of particles. Once those limits were defined, a DoE matrix was constructed using JMP® (SAS Institute, USA; Table 2). This was performed including all the filters to avoid human bias in filter selection, allowing an unexperienced user to easily define the best set of filters.
All the morphological filters available were included in order to remove the microcrystalline cellulose and focus on the set of filters that allowed to measure the PSD of the API (Fluticasone propionate, FP) particles. Finally, the filters combination showing the best results (highest amount of FP particles detected, lowest variance for PSD) was then used in combination with the Raman spectroscopy in order to evaluate the efficiency of the measurement collected.
Results and Discussion
All of the presented (Table 2) set of filters combinations were tested to assess filter compatibility and their influence in terms on API particles selection and identification analysed. A total of 69056 particles were detected when not using any filters d uring the baseline measurement. The impact of the filters over the 69056 initial particles detected was assessed and the number of particles that matched the proposed criteria for each experiment is presented in Table 3.
Combination number Block Intensity SD Solidity Elongation Intensity mean Circularity Convexity Aspect ratio 1 1 1 0.9 0.5 160 0.1 0.1 0.9 2 2 160 0.1 0.9 160 0.1 0.5 0.9 3 1 160 0.9 0.1 160 0.1 0.9 0.5 4 2 80.5 0.5 0.5 80.05 0.5 0.5 0.5 5 2 160 0.1 0.1 80.05 0.9 0.9 0.9 6 2 1 0.9 0.1 0.1 0.9 0.5 0.1 7 1 80.5 0.5 0.5 80.05 0.5 0.5 0.5 8 1 1 0.1 0.1 160 0.9 0.1 0.9 9 2 160 0.9 0.9 0.1 0.9 0.1 0.9 10 2 1 0.9 0.9 80.05 0.1 0.1 0.1 11 2 1 0.5 0.9 160 0.9 0.9 0.1 12 2 160 0.5 0.1 0.1 0.1 0.1 0.9 13 1 1 0.1 0.9 0.1 0.9 0.1 0.5 14 1 1 0.9 0.1 0.1 0.5 0.9 0.9 15 1 160 0.1 0.9 160 0.5 0.1 0.1 16 2 1 0.1 0.1 160 0.1 0.9 0.1 17 2 1 0.1 0.9 0.1 0.1 0.9 0.9 18 1 80.5 0.1 0.1 0.1 0.1 0.1 0.1 19 1 80.5 0.9 0.9 160 0.9 0.9 0.9 20 1 160 0.1 0.5 0.1 0.9 0.9 0.1 21 2 160 0.9 0.1 160 0.9 0.1 0.1 22 1 160 0.9 0.9 0.1 0.1 0.9 0.1
Table 2. DoE matrix for filter combinations.
203
Most of the combinations sets did not detect any particle or a very small number of particles presenting the parameters selected for each experiment. This was due to values selected very close to the limits (e.g. 0.9 elongation will remove most of the microcrystalline cellulose, but, consequently, also some API agglomerates). Moreover, some of the filters may interact one with each other (e.g. Elongation, x, and Circularity, 1 – x, work in an opposite way and if combined together, they will remove all the particles regardless if API or excipient). This was performed in order to select the best of filters without any analyst bias and to confirm each filter performance. The set of filters defined by experiment number 10 showed the highest number of particles detected during the measurement (about 8000 particles which coul d reasonably matched the criteria of only API particles selected out of the 69000 total particles, API and excipient obtained with no filters applied). For this reason this set was identified as the best one and further analysed using the Raman spectroscopy (5 seconds of exposure time) to confirm the identity of the particles detected and assess the efficiency of the measurement based only on filters selection.
The set of filter selected for experiment number 10 showed a good power of particle selection for such filters screening analysis, with only 6 particles of microcrystalline cellul ose been picked as potential FP particles (Table 4). This reveals that the filters prevent the analysis of no -API particles with a high success rate (only 6 cellulose particles out of 849 in successfully analysed and 843 API ones).
Drug Delivery to the Lungs , Volume 32, 2021 - The application of morphological fi lters in automated imaging for nasal formulations: a design of e xperiment approach
3.
DoE
measure FP
a Flonase® sample
Combination number Number of particles detected for each measurement 1 239; 263; 242 2 0; 0; 0 3 0; 0; 0 4 0; 0; 0 5 0; 0; 0 6 21; 9; 25 7 0; 0; 0 8 30; 3; 21 9 0; 0; 0 10 8068; 7841; 8475 11 45; 51; 32 12 0; 0; 0 13 36; 40; 37 14 131; 144; 109 15 0; 0; 0 16 135; 147; 150 17 158; 114; 175 18 0; 0; 0 19 0; 0; 0 20 0; 0; 0 21 0; 0; 0 22 0; 0; 0
Table
Results obtained for filter combinations of the
matrix to
in
(n=3).
Combination number 10 Number of particles analysed Particles identified CE mean diameter (µm) FP 4958 843 3.08 Microcrystalline Cellulose 6 2.23
Table 3. Results of the Raman analysis using the set of filters combined in experiment number 10 of the DoE (n=1).
204
Moreover, the screening DoE approach permitted to quickly and successfully select and analyse the circular diameter (CE) of only the API particles through the selection of the right filters type and suitable values, avoiding erroneous conclusions, as can b e observed in Figure 3 where the CE size distribution of only FP particles identified in experiment number 10 showed a higher value s than the sample with no filter applied. Finally, experiment number 10 reported an efficiency of 17% (843 FP particles out o f 4958 total analysed by Raman). This value is quite good considering general limitations in efficiency: equipment limitations and Signal to Noise ratio which may lead to unclassified particles. Therefore, the set of filters and their combinations identifi ed in experiment number 10 can be used as baseline for a further optimization DoE.
Conclusion
This study was focused on the analysis by DoE of different filters combinations, which can allow to direct selection of API particles for PSD analysis by automate d imaging by the M4-ID. Results obtained showed that and approach by a screening DoE can lead to a quickly defined working set of filters for the measurement of just API particles in nasal spray complex formulations. Morphological filters proved to be a fundamental tool to distinguish different components in a formulation mixture and measure their individual morphological properties and PSD. However, particles, which may fall outside the filters range , are not measured and this may affect the results . For this reason, filters may need to be adjusted for each formulation. Through the approach described, we have been able to select the best filters combination, which allowed to mainly identify only API particles, as subsequently proved by Raman spectroscopy. A further DoE for optimization of these parameter s will determine and increase the method efficiency. Moreover, the same approach will be applied to nasal formulations comprising suspended proteins and peptides, in order to show the importance of filters an d automated imaging combined with Raman for PSD and morphological analysis of novel and bioequivalent products.
References
[1] Chang R-K, Raw A, Lionberger R, Yu L, Generic Development of Topical Dermatologic Products: Formulation Development, Process Development, and Testing of Topical Dermatologic Products , AAPS J, 15 (1), pp. 41-52, 2013.
[2] Juran, Juran on quality by design : the new steps for planning quality into goods and services , Free Press : Maxwell Macmillan Canada : Maxwell Macmillan International, New York; Toronto; New York, 1992
Drug Delivery to the Lungs , Volume 32, 2021 – Paulo Serra et al.
Figure 3. CE diameter by the cumulative particle number (%) of a measurement using a filter to remove microcrystalline cellulose (experiment number 10) and a measurement without any filters applied (n=1).
205
206
Device and Formulation Factors affecting the Aerosol Performance of Pressurised Metered Dose Inhalers
B. J. A. Thorne1, S. B. Kirton1, M. Knowles2 K. C. Lee3, D. Murnane1, A. I. Sapsford2, A. D. Wright21University of Hertfordshire, College Lane, Hatfield, AL10 9AB, U.K.
2Bespak Europe Ltd., Bergen Way, King’s Lynn, Norfolk, PE30 2JJ, U.K.
3University of East London, Docklands Campus, University Way, London, E16 2RD, U.K.
Summary
An experimental study was conducted to determine the key device and formulation properties and their interactions affecting the spray performance of pressurised metered dose inhalers (pMDIs). A two -level, 23Taguchi Orthogonal Array was constructed as part of a design of experiments approach to maximise the variation in the response variables whilst minimising the required number of experiments. Spray orifice diameter, actuator sump volume, orifice length, metering chamber volume, propellant and ethanol fraction were varied in the current study, with volume-equivalent droplet diameter, spray area, plume angle and ovality as the response variables. Droplet mass median aerodynamic diameter, spray orifice diameter and ethanol fraction exhibited the most signific ant influence. Propellant type, sump volume and metering chamber volume had the largest impact on spray area measured at a distance of 30 mm from the tip of the actuator mouthpiece. The plume angle and ovality were not well described by the input variables in the current study, remaining an interesting area for future investigation
Key Message
Droplet diameter and spray area are key performance metrics to be met when designing pMDI products and were well predicted by the device and formulation properties varied in the present study
Introduction
Pressurised metered dose inhaler (pMDI) device manufacturers are required to fulfil several key metrics representing device performance for new products . These typically include the spray pattern1 as measured with laser sheet Mie light scattering imaging and the particle aerodynamic particle size distribution performance 2 , measured with an inertial impactor. The impactor stage performance serves as a reference for the residual, dry particle size distribution post -evaporation of the droplets produced during the aerosolisation process.
Properties of both the device itself and the pharmaceutical formulation, including the propellant used, are known to influence these performance metrics. In the present study, six variables were identified as being potentially significant to device performance - actuator spray orifice diameter and length, actuator sump volume, metering chamber volume, ethanol fraction and propellant type The latter is particularly relevant as the industry looks towards moving to low global warming potential (GWP) propellants.
Much effort has been put into studying the effects of device and formulation interactions on the aerosol performance of pMDIs, where such analyses were made by fixing all other variables in the system while changing a single one, e.g. the metering chamber volume 3 or the actuator spray orifice length and diameter4 The present study presents a novel multivariate analysis of six variables, where a Taguchi Orthogonal Array, Design of Experiments was constructed to allow the influences of the individual variables, and their influence on each other, to be studied.
Aims and Objectives
The present work aim ed to quantitatively identify the relationship between the critical dimensional attributes of pMDIs along with pharmaceutical formulation properties on aerosol performance. This information will be useful to inform the development of new pMDI products, particularly where low GWP propellants are to be employed. Such data will also assist in reducing the time to market for such products as well as lessening their environmental impact.
Drug Delivery to the Lungs, Volume 32 , 2021 - B. J. A. Thorne et al.
207
Experimental method
In a traditional experimental study, each variable of interest would be varied independently whilst fixing the others. A design of experiments (DoE) approach was employed to minimise the required number of experiments in the present study A Taguchi Orthogonal Array technique was used to construct the DoE array, as this technique maximises the response sensitivity while minimising the required number of predictor variable combinations.
A two-level study was used here, where each variable was assigned an upper and lower value, where the values used were informed by prior knowledge at Bespak As six predictor variables were to be investigated, an “L8” (27) array was constructed as this arrangement was able to account for up to 7 predictor variables at two levels. Thus, 8 separate device and formulati on configurations were generated in the array. However, the propellant was included as a separate variable in the present study to provide extra data points for the subsequent multivariate analysis, such that the L8 array was constructed for each propellant. This required a total of 16 device and formulation configurations.
The required pMDI valves for the study were fabricated in -house at Bespak, whereas the actuator samples were manufactured by Optimold Ltd. (120 Golborne Business Park, Golborne, Warrin gton) These valves were manually crimped onto 19 ml capacity aluminium canisters, manufactured by Bespak (t/a Integrated Aluminium Components, Edward Street, Nelson, Blackburn), then filled with 15 g of the required formulation, either at 15 % w/w ethanol or without ethanol, at Bespak. The filled packs were inserted into the corresponding actuators at Recipharm Laboratories Inc. (511 Davis Drive, Morrisville, U.S.A.).
Droplet size distributions (DSDs) were measured using a Helos Sympatec® device, where the DSD was reported at 5 ms intervals and represented the average DSD across each 5 ms interval. Spray area, plume angle and ovality were measured using a ProVeris SprayVIEW analyser. Spray area was measured at two distances from the actuator mouthpiece; 30 mm and 60 mm, recorded every 2 ms. The images were then automatically overlayed by the ProVeris software and the spray “edge” detected, from which the relevant radii were measured and the spray cross -sectional area measured. Three measurements were taken of each metric for each device used in the study.
Plume geometry, spray area and ovality measurements were recorded as cumulative totals across each entire spray event and thus did not require further processing before multivariate analysis. Each predictor variable was normalised by the upper level in eac h case if the predictor variable had a value greater than unity. Predictor variables with numerical values not exceeding unity were not normalised. The resulting data were subjected to partial least squares regression (PLSR) analysis where linear curve fits were performed, quantifying the relationships between the predictors and descriptors. In addition to highlighting the relationships between these, this also allowed the linear regression coefficients to be used to predict the performance of novel device and formulation configurations
Results
Figure 1 shows the correlation loadings plot obtained from the PLSR analysis for spray area (SA) , measured at 30 mm from the actuator mouthpiece . Predictor variables presenting between the ellipses describe the most variation in the system and thus have the s trongest influence on the descriptor variable. Figure 1 indicates that metering chamber volume (MCV) and stroke length (“Stroke”) were significant and both positively correlated with spray area. Spray orifice diam eter (SOD), ethanol fraction (Eth) and orifice length (LL) were less significant for explaining variance in the system. The propellant (“Prop”) and actuator sump volume (“Sump”) were negatively correlated with spray area across Factor 1 but positively correlated with it across Factor 2. In the present model, Factor 1 describe d 71% of the variance in the model, whereas Factor 2 accounted for only a further 3%. Here, propellant type was numerically expressed in a binary system, where a value of unity indicate s that propellant HFO 1234ze was present and a value of zero that R134a was present. Fig ure 1 therefore indicates that formulations based on HFO 1234ze were linked to smaller spray areas than those based on R134a. Larger sump volumes were thus linked to smaller spray areas.
Drug Delivery to the Lungs , Volume 32, 2021 – Device and Formulation Factors affecting the Aerosol Performance of Pressurised Metered Dose Inhalers
208
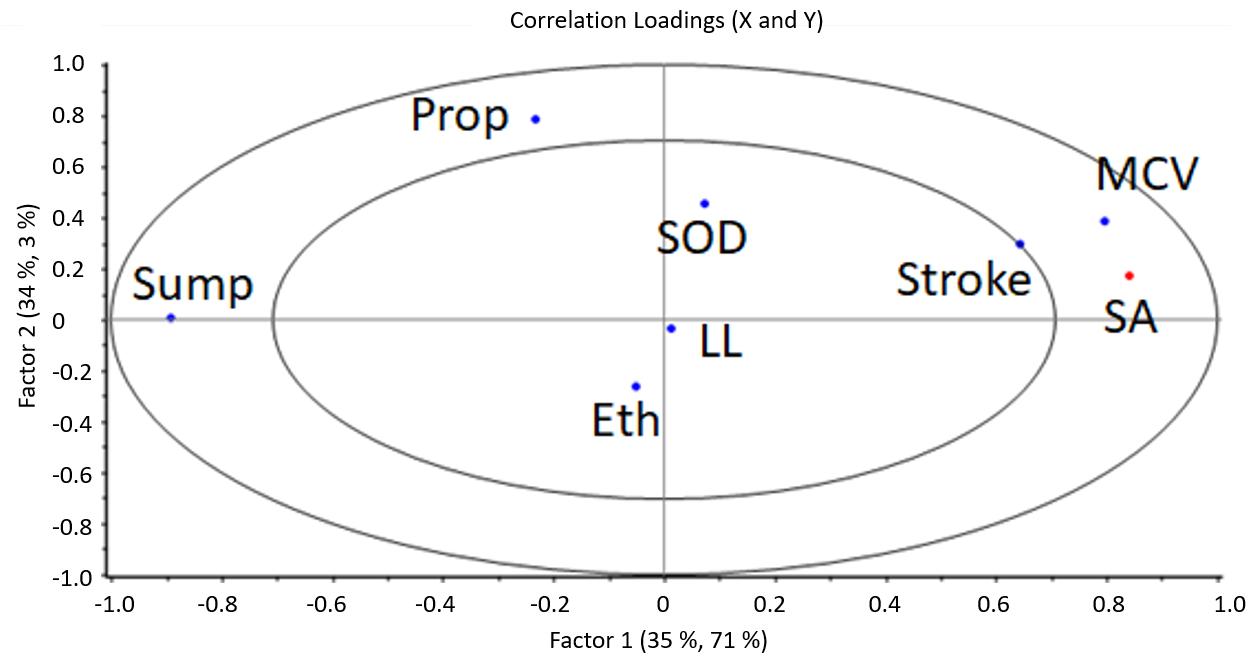
a distance of 60 mm
the full spray duration for each experiment. Spray orifice diameter was clearly positively correlated with VMD acros s both factors; larger spray orifices were therefore linked with larger VMDs, as expected. Propellant type ha d a reasonable influence where it is negatively correlated across both factors – propellant HFO 1234ze was thus linked with larger VMDs. Ethanol fraction was negatively linked with VMD across Factor 1 but positively so across Factor 2. The effect of ethanol fraction may thus be influenced by other variables in the study, where it could exhibit either a positive or negative influence on VMD.
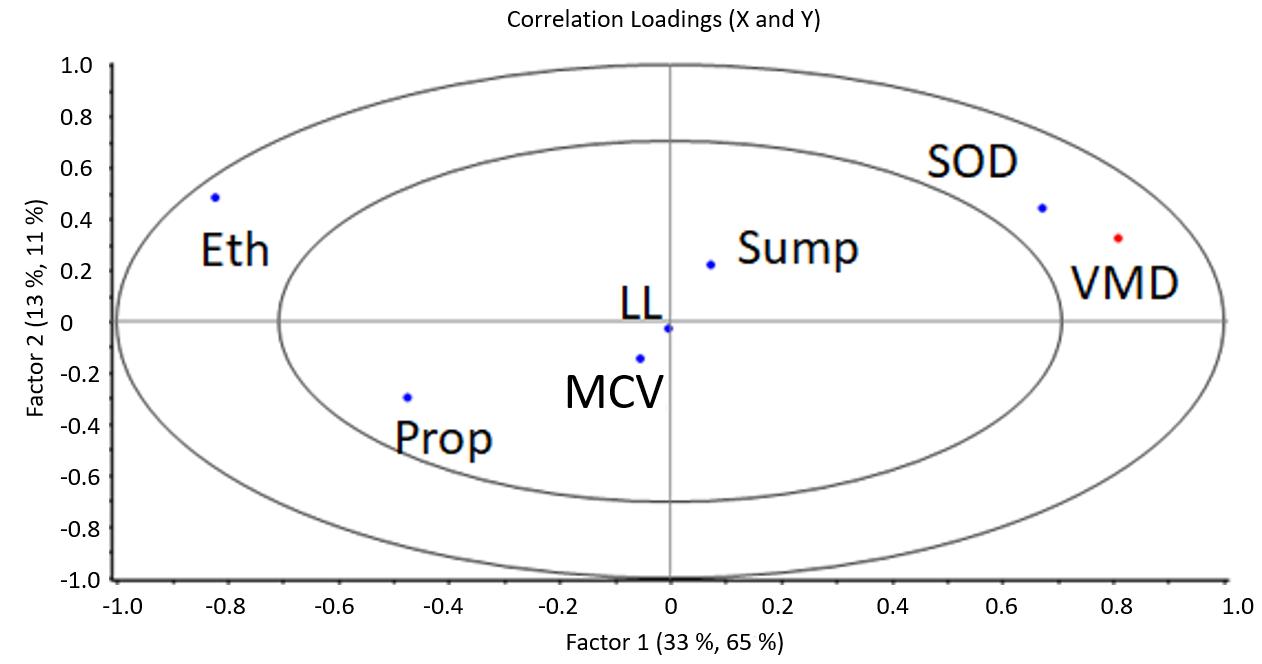
The total explained variance in the system was just 54% for plume angle, and this response variable did not appear between the ellipses in the correlation loadings plot. This outcome indicates that there was little correlation between the input variables and the plume angle.
Drug Delivery to the Lungs, Volume 32 , 2021 - B. J. A. Thorne et al.
Figure 1 correlation loadings plot for spray area, as measured at 30 mm from the actuator mouthpiece
Figure 2 presents the correlation loadings plot for volume mean diameter (VMD) of aerosol droplets at
from the actuator mouthpiece , as averaged across
Figure 2 correlation loadings plot for volume mean diameter (VMD)
209
Discussion
The plume angle results indicate that this variable was not well described by the variables selected as inputs. It is possible that there was insufficient variation in this response for the PLSR analysis to link this particular variable to the predictor variables. Alternatively, it could be the case that other variables not captured here, such as manufacturing tolerances, mo re significantly influenced the plume angle. It has been found that the cone angle alters during the sump filling/emptying processes 5 , though this behaviour was not observed in the present work.
Spray area was found to be positively correlated with both stroke length during actuation and the metering chamber volume. The stroke length influences the rate and degree of opening of the valve orifice, which could affect the pressure within the device – indeed, propellant type was found to influence the spray area, where HFO 1234ze exhibit ed a lower vapour pressure than R134a. Larger sump volumes were linked with smaller spray areas, where lar ger sumps might have influenced the pressure in the device. Spray orifice diameter and orifice (land) length were not found to have a significant influence.
The VMD of the aerosol droplets was positively correlated with spray orifice diameter across both factors, where larger orifices led to a shift in droplet size distribution to wards larger sizes. This outcome could be related to the pressure upstream of the spray orifice, where higher pressure s are linked with smaller droplet sizes6. HFO 1234ze was also linked to larger droplet sizes, where this propellant has a lower vapour pressure than R134a (4.9 bar cf. 5.7 bar at 25 oC). The effects of ethanol fraction are less clear, where this can lead t o smaller droplet sizes in some cases and larger in others; again, ethanol lowered the vapour pressure of mixtures with R134a 7
Conclusions
An experimental analysis of the effects of pMDI device critical dimensions and placebo formulation properties on aerosol performance has been presented. Spray area was found to be most strongly influenced by actuation stroke depth, propellant type, sump volume and metering chamber volume. The variables used in the current study were not found to accurately predict the spray angle. Droplet size distribution was most strongly influenced by spray orifice diameter, ethanol fraction and propellant type. The resulting regression coefficients from the PLSR may be used to predict the spray area and aerosol droplet size performance, which is beneficial for reduced development times of new pMDI products.
References
1 Liao, L., Chauhan, H., Newcomb, A., L’Ecuyer, T., Liu -Cordero, S. and Leveille, C. (2017): “ Spray pattern: A rapid and sensitive early development tool for respiratory drug products Utilizing spray performance measurements to accelerate OINDP development ”, Inhalation Magazine,. October 2017
2 Adams, W., Christopher, D., Lee, D., Morgan, B., Pan, Z., Singh, G., Tsong, Y. and Lyapustina, S. (2007): “Evaluation of Cascade Impactor Profiles of Pharmaceutical Aerosols, Part 1: Background for a Statistical Method”, AAPS PharmSciTech, 8 (1), Article 4
3 Berry, J., Heimbecher, S., Hart, J. and Sequeira, J. (2003): “Influence of the Metering Chamber Volume and Actuator Design on the Aerodynamic Particle Size of a Metered Dose Inhaler”, Drug Development and Industrial Pharmacy, 29:8, 865-876
4 Smyth, H., Brace, G., Barbour, T., Gallion, J., Grove, J. and Hickey, J. (2006): “Spray Pattern Analysis for Metered Dose Inhalers: Effect of Actuator Design” Pharmaceutical Research, Vol. 23, No. 7
5 Versteeg, H., Hargrace, G., Myatt, B., Lewis, D., Church, T. and Brambilla, G. (2017): “ Using Phase Doppler Anemometry and High Speed Imaging to Analyze MDI Spray Plume Dynamics ”, Respiratory Drug Delivery Europe 2017
6 Clarke, A. 1991 “Metered atomisation for respirato ry drug delivery”, PhD Thesis, Loughborough University
7 Gavtash, B., Myatt, B., O’Shea, H., Mason, F., Lewis, D., Church, T., Versteeg, H., Hargrave, G. and Brambilla, G. (2015): “Saturated vapour pressure (SVP) measurement of ethanol/HFA binary mixtures ” , Drug Delivery to the Lungs, 26
Drug Delivery to the Lungs , Volume 32, 2021 – Device and Formulation Factors affecting the Aerosol Performance of Pressurised Metered Dose Inhalers
210
Drug Delivery to the Lungs , Volume 32, 2021 - Antonia Zapata del Baño et al.
Development of a nasal s pray containing a novel human recombinant antibody for SARS-CoV-2 therapy
Antonia Zapata del Baño1, Cyrine Mestiri1, Hank Oviatt2, Bill Zimlich2, Eric Mathur2, Karen Terry3, Robert Price1, Jagdeep Shur1, Irene Rossi1
1Nanopharm Ltd, An Aptar Pharma Company, Cavendish House Hazell Drive, Newport NP10 8FY , United Kingdom
2Diomics Corporation, 41083 Sandalwood, Murrieta, CA 92562, United States
3Aptar Pharma, 250 North Route 303, Congers, NY 10920, United States
Summary
A novel human recombinant antibody for prophylactic treatment against SARS-CoV-2 was formulated in a nasal solution comprising chitosan as mucoadhesive polymer. Two level s of protein concentration have been assessed and formulations loaded into Aptar VP3 nasal pump. The formulations produced showed values of pH (6.2-6.3) and osmolality (414 and 421 mosm/kg) suitable to prevent precipitation of the antibody in the final solution and for nasal administration. Assay of the protein after formulation manufacturing showed a lower dimeric fraction than the reference standard and hydrodynamic diameter of the final formulations was also comparable to the unprocessed antibody solution (10 nm). Zetapotential values were higher than 25 mV, indicating colloidal stability against aggregation due to charge stabilization for the formulations obtained. Spray performance did not evidence any difference between protein levels in the final formulations when combined with VP3 nasal pump. Particularly, droplet size distribution (mean volume diameter of 55.13 µm for the low dose formulation and 57.21 µm for the high dose), spray pattern and plume geometry resulted to be applicable for nasal delivery. Finally, for both solutions sprayed antibody content was within 75-125% of the target delivered dose with a very low variability on ten consecutive shots (5%). Future studies will assess the formulations stability under refrigerated and ambient storage conditions of the combination product and of the antibody comprised in the formulation, whereas in vivo studies will define pharmacokinetics and pharmacodynamics profile of these final formulations.
Key Message
The possibility to deliver to the nose a novel human antibody for prophylactic treatment against SARSCoV-2 employing Aptar VP3 pump was assessed. Spray performance of the formulations manufactured was characterized and no protein agglomeration was observed in the formulations and after spraying, indicating favourable results in applying this system for delivery of antibodies to the nose
Introduction
Diomics Corporation isolated and identified a recombinant immunoglobulin G clone (IgG) potent enough to neutralize SARS-CoV-2 virus particles with 98% effectiveness[1]. The administration of a long-lasting antibody nasal product as prophylactic treatment may, therefore, positively impact the SARS-CoV-2 infection patterns and its severity[1] In order to achieve a long lasting protection through the administration of a nasal product, a mucoadhesive polymer should be employed during formulation development.
Generally, mucoadhesive polymers are able to form hydrogen bonds, possess charged groups , have a high molecular weight, chain flexibility and present surface energy properties that favour spreading into mucus layers[2].
Chitosan is a linear polysaccharide, positively charged at physiological pH. Its structure allows in determining different interaction with mucin present in the nose, such as hydrogen bond and electrostatic interactions. Chitosan-mucin interaction has been proven in-vitro and in-vivo and its mucoadhesive properties has been exploited in order to construct the right platform to achieve the long -lasting effect[3,4]. Although some concerns can be raised in terms of toxicity, several studies reported that the exposure of animal nasal mucosa to chitosan did not determine any significant change in the mucosa cell morphology compared to the control[5,6]
The aim of this study was to investigate the possibility to develop a formulation suitable to deliver a recombinant antibody (Ab) in the nasal cavity for prophylactic treatment of SARS-CoV-2 employing
211
Aptar VP3 nasal pump This approach is very interesting in the treatment of viral infections and innovative compared to classical intravenous administration of antibodies ; presenting, however, challenges particularly related to protein aggregation due to shear stress
Experimental Methods
In order to screen formulation feasibility for different delivered doses of the Ab two formulations were manufactured at a high and low protein concentration. The Ab solution supplied by Diomics Corporation (USA) was concentrated from 8 mg/mL up to 40 mg/mL employing Amicon® Ultra 15 mL 30 kDa MWCO tubes (Merck Sigma-Aldrich, USA) by centrifugation of the tubes at 4000 rpm for a total of 25 minutes and Ab concentration quantified by size exclusion chromatography (SEC) coupled with Diode Array Detector (DAD). The final formulations were manufactured by mixing together the Ab at two different final levels (20 and 2 mg/mL) in 100 mM of 4-(2-hydroxyethyl)-1-piperazineethanesulfonic acid (HE PES, Merck Sigma-Aldrich, USA), 100 mM of sodium chloride (Merck Sigma-Aldrich, USA), 50 mM of sodium acetate (Merck SigmaAldrich, USA) in Milli-Q water purified by reverse osmosis (Merck Millipore, USA) at pH 6.0, a preservative, benzalkonium chloride (Novo Nordisk Pharmatech A/S, DK), chitosan as mucoadhesive polymer and a surfactant, polysorbate 80, to prevent Ab aggregation (Merk SigmaAldrich, US).
Hydrodynamic diameter and Zeta potential of the Ab in the final formulations was determined with Malvern Zetasizer Nano (Malvern Panalytical, UK). pH (SevenCompact™ pH meter, Mettler Toledo, UK) and osmolality (Löser Messtachnik, DE) were measured as well in order to assess they were suitable for nasal delivery and to prevent protein precipitation .
The formulations prepared were then loaded into the Aptar VP3 system (Aptar Pharma, USA), a commonly used multi-dose spray pump. Formulation-device combination characterized in terms of droplet size distribution (DSD) by Spraytec (Malvern Panalytical, UK), spray pattern (SP) and plume geometry (PG, Oxford Laser, UK) and spray content uniformity (SCU) for ten consecutive shots employing SEC assay method to measure protein quantification and aggregation
Results and Discussion
Monomeric and dimeric peaks of the Ab solution were identified after the supplied Ab solution was concentrated to 40 mg/mL. The area percentage of the dimeric peak was lower than the reference (0.65% vs 1.32%), indicating that the process performed did not determine any aggregation of the protein (Figure 1). After formulations manufacturing, Ab concentration quantified was closer to the target and the area percentage of the dimeric peak was similar to the value collected after the concentration step: 0.80% for the low dose formulation and 0.87% for the high dose one
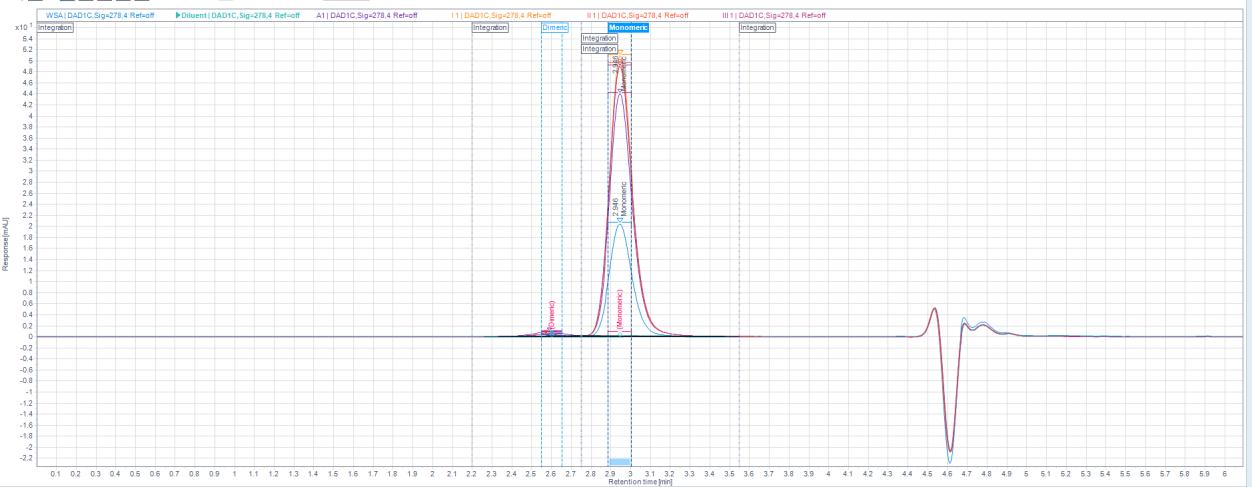
Drug Delivery to the Lungs , Volume 32, 2021 - Development of a nasal s pray containing a novel human recombinant antibody for SARS-CoV-2 therapy
212
Figure 1. SEC spectrum of concentrated Ab solutions.
Hydrodynamic diameter of the protein in the two formulations was about 10 nm, comparable with the diameter of the unprocessed antibody solution. Zeta-potential was also measured for the two formulations comprising different concentrations of Ab (26.98 and 25.20 mV) . Both of them reported a value higher than 25 mV, indicating a moderately stability against aggrega tion due to charge stabilization[7]
pH for both formulations was slightly acidic (pH 6.2-6.3), usually recommended for nasal formulations. This was similar to the pH of the original buffer used as vehicle for the final formulation (pH 6.0), therefore it was expected to preserve the protein stability in the formulation pH value obtained was also in a range suitable for nasal delivery. Moreover, the values of pH collected were within the upper limit (2.4-6.3) of pH, which have been observed to promote the interaction between chitosan and mucin[8]
Osmolality measurements obtained for both formulations were inside the range of optimal values for nasal delivery (290-500 mosm/kg[9]): 414 mosm/kg for the low dose formulation and 421 mosm/kg for the high dose one
After loading the two formulations in Aptar VP3 pump, spray emitted was characterized for DSD, SP and PG (Table 1). DSD was comparable between the two formulations and mean volume diameter (Dv,50) was higher than 50 µm (55.13 µm for the low dose formulation and 57.21 µm for the high dose one), indicating a more likely deposition in the anterior region of the nose[10]
Like for DSD, also for SP and PG no difference s were observed between the two Ab concentrations employed in the final formulation. However, a different plume was noticed when comparing SP and PG of a blank solution (just excipients) and the two final formulations, possibly due to the different composition and higher viscosity (Figure 2).
Average droplets diameter of final formulations was lower than the one coll ected for blank solution (Dmin about 4 cm and Dmax about 5 cm). This may indicate a full cone plume for formulations comprising the antibody instead of a flatter spray when the IgG was not present in the blank solution On the other side, Plume Geometry (PG) was comparable with blank solution in terms of plume length (13 cm), but plume angle was slightly lower for both of the formulations compared to the blank solution (5 2°), indicating probably again a full cone plume.
Finally, SCU was 122.22% of the expected dose base on protein concentration for one shot of the low dose and 124.59% of the target dose for the high dose formulation, with a relative standard deviation of 5% for both of them. No protein agglomeration was observed for the d ose emitted, which should have maintained its structure and activity when administered in the nose. This will be further assessed.
Drug Delivery to the Lungs , Volume 32, 2021 - Antonia Zapata del Baño et al.
Formulation DSD SP Dv,10 (µm) Dv,50 (µm) Dv,90 (µm) Span Dmin (cm) Dmax (cm) Ovality ratio Area (cm2) low dose 23.8 (14.4) 55.1 (9.7) 131.1 (8.2) 2.0 (12.6) 2.6 (4.9) 3.7 (8.3) 0.7 (8.7) 7.5 (10.4) high dose 24.7 (10.5) 57.2 (11.6) 141.3 (20.2) 2.0 (19.6) 2.4 (5.2) 3.2 (3.7) 0.8 (2.9) 6.2 (8.6)
Table 1. Average values and residual standard deviation (%, in parentheses) of spray performance (n=3). Droplet size distribution (DSD) and spray pattern (SP, n=3)
213
Drug Delivery to the Lungs , Volume 32, 2021 - Development of a nasal s pray containing a novel human recombinant antibody for SARS-CoV-2 therapy
Conclusion
This study focused on the development of a nasal formulation comprising a novel antibody for SARSCoV-2 prophylactic treatment. The possibility to deliver to the nose the antibody employing an Aptar VP3 pump was assessed. Two formulations were manufactured at two levels of protein concentration (20 and 2 mg/mL). These proved to be suitable for nasal delivery in terms of pH, droplet size and osmolality. Moreover, no protein agglomeration was observed in the two formulations prepared and after spraying with Aptar VP3 pump, indicating favourable results in applying this system for delivery of antibodies to the nose The next step of the development will be the assessment of the stability under refrigerated and ambient storage conditions of the combination product and of the antibody comprised in the formulation. Moreover, in vivo animal studies will allow to determine pharmacokinetics and pharmacodynamics of these two formulations
References
[1] Diomics Corporation, Monoclonal Antibodies (IgG) for Intranasal Prophylaxis of COVID -19.
[2] Ritthdej, Nasal delivery of peptides and proteins with chitosan and related mucoadhesive polymers , Peptide and Protein Delivery, 2011, Chapter 3: pp 47-68, 2011.
[3] Haugstad et al., Direct Determination of Chitosan–Mucin Interactions Using a Single-Molecule Strategy: Comparison to Alginate–Mucin Interactions , Polymers, 2015, 7: pp 161-185.
[4] Lee et al., Thiolated Chitosan Nanoparticles Enhance Anti -inflammatory Effects of Intranasally Delivered Theophylline, Bio_Med Central, 2006, 7: 112-122.
[5] Kean et al., Biodegradation, Biodistribution and Toxicity of Chitosan , Ad Drug Del Rev, 2010, 67: pp 3-11.
[6] Illum, Chitosan and its use as a pharmaceutical excipient, Pharm Research, 1998, 15(9): pp 1326-1331.
[7] Lowry et al., Guidance to Improve the Scientific Value of Zeta-Potential Measurements in NanoEHS, Environmental Science: Nano, 2015, 1, 1.
[8] Collado Gonzalez at al., Interaction Between Chitosan and Mucin: Fundamentals and Applications , Biomimetics, 2019, 4(32)
[9] Bitter at al., Nasal Drug Delivery in Human, Curr Probl Dermatol. 2011, 40: pp 20–35.
[10] Calmet et al., Nasal sprayed particle deposition in a human nasal cavity under different inhalation conditions , PloS ONE, 2019, 14(9).
Figure 1 Plume geometry for blank, low dose and high dose formulations214
How does the Tongue Influence Transport of Inhaled Particles from a Pressurized Metered Dose Inhaler (pMDI) and Valved Holding Chamber (VHC)
Mark W. Nagel1, Jason A. Suggett1 & Jolyon Mitchell2
1Trudell Medical International, 725 Baransway Drive, London, Ontario, N65 5G4, Canada
2Jolyon Mitchell Inhaler Consulting Services Inc., 1154 St. Anthony Rd., London, Ontario, N6H 2R1, Canada
Summary
An in vitro study was undertaken to assess what changes occurred to the aerosol deposition patterns from a pMDI (fluticasone propionate (FP); 125 μg/actuation) delivered alone or via an AeroChamber* Plus Flow-Vu* VHC/mouthpiece, when the tongue was intentionally omitted from a model anatomic adult orophary nx A modified fast screening abbreviated Andersen impactor (T-FSA) operated at 28.3 L/min ± 5% sampled the aerosol emitted at the exit of the oropharynx of the model-on-test, to capture the size profile of medication likely to have deposited past the carina and therefore potentially available for lung delivery The pMDI alone simulated ‘perfect’ coordination with no delay while a 2-s delay was simulated following pMDI actuation when the VHC mouthpiece was attached to the model. Five replicate measurements were made with the models with and without the tongue present in the oropharyngeal cavity with 5 doses delivered per measurement FP was recovered from the pMDI actuator, VHC interior, model airway, as well as the T-FSA and assayed by a validated HPLC-spectrophotometric procedure. The pMDI alone deposited 81.6 ± 10.9 and 64.0 ± 5.1 in the oropharyngeal airway with and without tongue respectively, causing the mass delivered to Stage 5 (1.1 - 4.7 μm) to increase from 11.7 ± 1.5 to 35.5 ± 1.0 µg Delivery via the VHC demonstrated a smaller difference between the mass of FP recovered from Stage 5 (29.6 ± 6.1 – tongue present vs. 36.5 ± 2.2 µg – tongue absent), indicating less impact on likely lung dose.
Key Message
Tongue position can affect lung delivery of aerosolized medications. We compared aerosol deposition within an adult oropharyngeal model compared to a modified version where the tongue structure was removed. We showed tongue presence can impact aerosol deposition, although the magnitude of the effect is reduced when a VHC is present.
Introduction
The clinical benefit from an inhaled drug is derived either from the total amount of drug deposited in the lungs or the quantity deposited in some specific lung region [1] Inhaled medication deposited in the orophary nx is generally considered to be wasted, because it does not usually contribute si gnificantly to the therapeutic response, although it may be partly responsible for side-effects [2] Inertial impaction in the oropharyngeal region accounts for much of the emitted dose from pressurized metered dose inhaler (pMDI) -delivered aerosols [3], and oropharyngeal “filtering”, as defined by Rudolf et al [4] has a considerable effect on the aerosol able to reach the lungs [5] This process can determine both the magnitude of lung deposition as well as its variability, with inhalers that deliver the lowest percentage of the dose to the lung having the highest variability in lung dose [2]. The effect of tongue position has been recognized for some time [6]. Recently, there has been an increasing interest in the effect of oropharyngeal filtering of drug deposition and inhaler variability [7] The topic is of particular interest when a valved holding chamber (VHC) is present since the velocity of the emitted aerosol particles is significantly reduced by the presence of the add-on device [8] We therefore hypothesized that by removing the tongue from our Aerosol Delivery to Anatomic Model (ADAM) [9] adult oropharyngeal model, the mass of active pharmaceutical ingredient (API) delivered from a pMDI alone or pMDI +VHC combination would change significantly. The purpose of the study was to test that hypothesis as it could have impact to understanding both real world clinical implications as well as future model development.
Materials and Methods
Two adult oropharyngeal models were created with help from Materialise NV (Leuven, Belgium). Figure 1a highlights the position of the tongue in the adult airway and Figures 1b and 1c show how this is reflected in the models with and without tongue respectively.
A pMDI delivering FP (125 μg/actuation) was actuated via an AeroChamber* Plus Flow -Vu* VHC/mouthpiece (Trudell Medical International, London, Canada) into the model on test. A 2-s delay was simulated following pMDI actuation before the VHC mouthpiece was attached to the model to mimic the likely clinical scenario when the patient delays inhalation following inhaler actuation [10] The pMDI was assessed similarly without the VHC, modelling ‘perfect’ coordination with no delay in that case. A modified fast screening abbreviated Andersen impactor (T-FSA [11]) operated at 28.3 L/min ± 5% sampled the aerosol emitted at the exit of the oropharynx of the model-ontest, to capture the size profile of medication likely to have deposited at the carina and therefore potentially available for lung delivery The interior surfaces of the model oropharyngeal airway and the collection plates of the T -FSA were coated with Brij-35 polyoxyethylene lauryl ether surfactant to mimic airway mucus and mitigate particle bounce
Drug Delivery to the
,
2021 -
et al.
Lungs
Volume 32,
Mark W Nagel
215
Drug Delivery to the Lungs , Volume 32, 2021 - How does the Tongue Influence Transport of Inhaled Particles from a Pressurized Metered Dose Inhaler (pMDI) and Valved Holding Chamber (VHC ) and re-entrainment respectively. Five actuations of the pMDI were delivered at 30 s intervals. Five replicate measurements were made with the models with and without the tongue present in the oropharyngeal cavity. FP was recovered from the pMDI actuator mouthpiece, VHC interior, model airway , as well as the two stages and backup filter of the T-FSA and assayed by a validated HPLC-spectrophotometric procedure
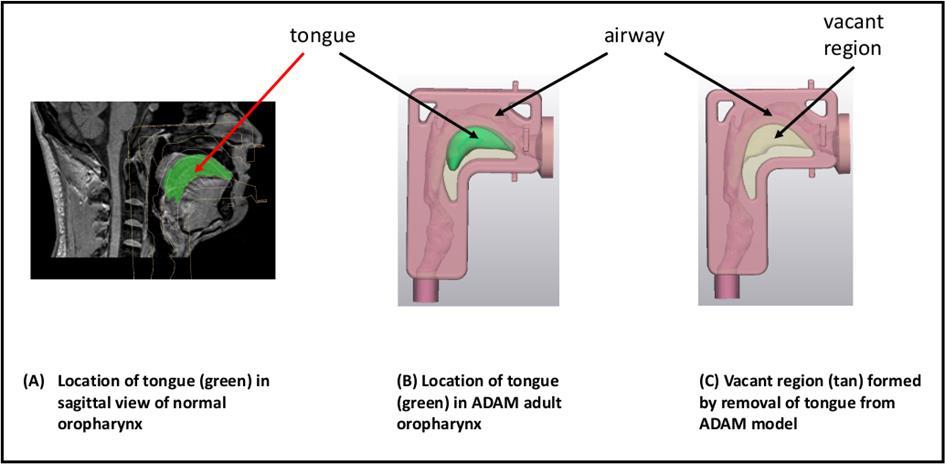
Results
Table 1 contains the data relating to FP recovery on a mass/actuation basis from the pMDI, VHC interior, the oropharyngeal passageway, and the two sizing stages together with the back -up filter of the T-FSA apparatus.
the Oral Cavity
Discussion
In a review of the evidence concerned with the size and behaviour of the human upper airway during aerosol inhalation from different inhaler classes including pMDIs, Nikander et al. noted that the variable position of the
Figure 1: MRI-Imaged Adult Anatomic Oropharyngeal Airway with ADAM Adult Oropharyngeal Airway Models with and without Tongue PresentLocation Mass FP Recovered/Actuation (μg) pMDI Alone pMDI + VHC Tongue Present Tongue Absent Tongue Present Tongue Absent Inhaler Mouthpiece 13.9 ± 0.9 11.9 ± 0.8 21.7 ± 1.7 19.3 ± 1.4 VHC Interior n/a n/a 49.8 ± 7.5 41.3 ± 6.1 Oropharyngeal Airway 81.6 ± 10.9 64.0 ± 5.1 3.4 ± 1.0 1.2 ± 0.2 Stage 2 (particles between 4.7 and 9.0 μm aerodynamic diameter 0.6 ± 0.1 3.2 ± 0.3 1.7 ± 0.5 3.0 ± 0.6 Stage 5 (particles between 1.1 and 4.7 μm aerodynamic diameter 11.7 ± 1.5 35.5 ± 1.0 29.6 ± 6.1 36.5 ± 2.2 Back-up Filter (particles < 1.1 μm aerodynamic diameter) 0.4 ± 0.2 1.2 ± 0.1 0.9 ± 0.5 1.3 ± 0.3
Table 1: Deposition Profiles (mean ± S.D.) of FP (125 μg/actuation ex actuator orifice) Delivered into the ADAM Adult Oropharyngeal Model After 2-s Delay with and without Tongue Present in
216
tongue during inhalation could promote upper airway deposition and restrict lung deposition 12 In the present study, the ‘tongue removed’ model represents an extreme condition intended to evaluate the sensitivity of the aerosolized medication transport via the enlarged oropharyngeal cavi ty space. The outcome from this study indicates that lowering the tongue during inhalation may, as expected, reduces the mass of inhaled particles deposited in the oropharynx. In a clinical situation representing this extreme condition, medication may therefore be transported more efficiently to the lungs When the tongue was (more realistically) present in the model and the medication was ‘inhaled’ via the pMDI alone, the mean mass of FP deposited in the oropharyngeal airway increased by 28% from 64.0 to 81.6 μg/actuation At the same time, the bulk of mass in fine particles capable of reaching the lungs that was delivered to Stage 5 of the T-FSA apparatus (particles between 1.1- 4.7 μm aerodynamic diameter) was consequently reduced by 67% from 35.5 to 11.7 μg/actuation Both findings indicate that a patient might expect to obtain a significantly smaller amount of deposition in the lungs from this route of medication delivery This outcome is consistent with the finding of Delvadia et al. [13] using geometrically realistic adult mouth–throat and upper tracheobronchial models, that the tongue increases aerosol deposition from inhalers if the mouthpiece orientation with respect to the mouth directs the aerosol towards the tongue.
Importantly, when the VHC was present, the absolute mass of FP deposited in the oropharynx was found to be much smaller and increased from only 1.2 to 3.4 μg/actuation. At the same time, the mass recovered from Stage 5 of the T-FSA decreased from 36.5 to 29.6 μg/actuation Hence, the impact of tongue position in the model was reduced with a VHC interposed between inhaler and oropharynx . These findings are consistent with the explanation that retention of the ballistic mass fraction of the incoming aerosol from the pMDI is an intended function of a VHC [8]. This process avoids a significant portion of the emitted mass of medication from the inhaler from reaching the airway, rendering the role of the tongue as a deposition site less important.
There are several limitations to this study. These include its small sample size, the assumptions of steady flow during the inhalation manoeuvre, the use of rigid walls for both models and confining the evaluation to the two conditions of the presence (in one position) or absence of a tongue.
The human oropharyngeal airway is a dynamic structure [14] with dimensions that can enlarge or shrink during the inhalation manoeuvre in a manner that may be dependent on the type of inhaler used [15] Future studies could therefore consider varying tongue position to better assess the sensitivity of medication delivery beyond the oropharynx, and in addition to pMDIs , investigate how oropharyngeal deposition from other orally inhaled drug products, in particular those delivered by dry powder inhalers of varying flow resistances, might be susceptible to tongue location
Conclusions
Caregivers and healthcare professional should consider tongue position instruction and in particular advising the patient to lower the tongue [16] when teaching inhaler technique to ensure more repeatable dosing. Further, the value in using a VHC to mitigate oropharyngeal deposition from a pMDI should be implemented in the first place, if not already part of the drug delivery system More consistent lung delivery of inhaled medication is desirable, as it should lead to better disease control [17] as well as a reduction in overall treatment costs [18]
Acknowledgements
Special thanks to Maya Choukair, Medical Application Engineer with Materialise NV for her help in developing the modified models and providing the figures.
References
1 Labiris NR, Dolovich MB. Pulmonary drug delivery. Part 1: physiological factors affecting therapeutic effectiveness of aerosolised medications, Br. J. Clin. Pharmacol. 56 (2003) pp 588–599.
2 Borgstrӧm L, Olsson B, Thorsson L. Degree of throat deposition can explain the variability in lung deposition of inhaled drug , J Aerosol Med. 2006; 19(4): pp 473-483.
3 Dolovich M, Rhem R. Impact of oropharyngeal deposition on inhaled dose , J Aerosol Med. 1998; 11(S1): pp 112-115.
4 Rudolf G, Kӧbrich R, Stahlhofen W. 1990. Modelling algebraic formulation of regional aerosol deposition in man J. Aerosol Sci. 1990; 21(suppl): pp 403-406.
5 Clark AR, Newman SP, Dasovich N, Mouth and oropharyngeal deposition of pharmaceutical aerosols , J Aerosol Med. 1998; 11(S1): pp116–121.
6 Martonen TB, Smyth HD, Isaacs KK, Burton RT, Issues in drug delivery: concepts and practice, Respir. Care 2005; 50(9): pp 1228–1252.
Drug Delivery to the Lungs , Volume 32, 2021 - Mark W Nagel et al.
217
Drug Delivery to the Lungs , Volume 32, 2021 - How does the Tongue Influence Transport of Inhaled Particles from a Pressurized Metered Dose Inhaler (pMDI) and Valved Holding Chamber (VHC )
7 Horiguchi T, Kondo R, Determination of the preferred tongue position for optimal inhaler use , J Allergy Clin Immunol Pract. 2018; 6(3): pp 1039-1041
8 Dolovich M. Lung dose, distribution, and clinical response to therapeutic aerosols , Aerosol Sci Technol. 1993; 18(3) pp 230240.
9 Nagel MW, Suggett JA, Coppolo DP, Mitchell JP: Development and evaluation of a family of human face and upper airway models for the laboratory testing of orally inhaled products, AAPS PharmSciTech 2017; 18(8): pp 3182-3197.
10 Mitchell J, Dolovich MB: Clinically relevant test methods to establish in vitro equivalence for spacers and valved holding chambers used with pressurized metered dose inhalers (pMDIs), J Aerosol Med Pulmon Deliv 2012; 25(4): pp 217-242.
11 Mitchell JP, Nagel MW, Avvakoumova V, MacKay H, Ali R: The abbreviated impactor measurement (AIM) concept: Part 1: Influence of particle bounce and re-entrainment – evaluation with a “dry” pressurized metered dose inhaler (pMDI) -based Formulation, AAPS PharmSciTech 2009; 10(1): pp 243–251.
12 Nikander K, von Hollen D, Larhrib EH. The size and behavior of the human upper airway during inhalation of aerosols , Exp Opin Drg Deliv 2017; 14(5): pp 621-630.
13 Delvadia RR, Longest PW, Hindle M, Byron PR. In vitro tests for aerosol deposition – III: effect of inhaler insertion angle on aerosol deposition, J Aerosol Med Pulmon Deliv. 2013; 26(3): pp 145-156.
14 Schwab RJ, Geller WB, Pack AI, Hoffman EA. Dynamic imaging of the upper airway during respiration in no rmal subjects, J Appl Physiol. 1993; 74(4): pp 1504-1514.
15 Ehtezazi T, Horsfield MA, Barry P, O’Callaghan C. Dynamic change of the upper airway during inhalation via aerosol delivery Devices, J Aerosol Med. 2004; 17(4): pp. 325-334.
16 Horiguchi, T, Kondo R. Determination of the preferred tongue position for optimal inhaler use, J Allergy Clin Immunol Pract. 2018; 6(3): pp 1039-1041
17 McIvor RA, Devlin HM, Kaplan A. Optimizing the Delivery of Inhaled Medication for Respiratory Patients: The Role of Valved Holding Chambers, Can Respir J. 2018; Article 5076259.
18 Lavorini F, Fontana GA, Usmani OS. New inhaler devices - The good, the bad and the ugly, Respiration. 2014; 88: pp 3-15.
218
Leveraging DPI formulation screening: particle-particle interaction
Raquel Borda d’ Água1 & João Pereira2
1Hovione, Estrada do Paço do Lumiar, Campus do Lumiar, Edifício R, 1649-038, Lisboa, Portugal
Summary
Dry powder inhalers (DPIs) have attracted enormous attention worldwide due to its local targeting, rapid drug effect and reduced systemic toxicity However, DPI formulations consist of highly cohesive powders that tend to agglomerate. Therefore, fine and coarse carriers are often used to reduce the cohesion and promote the flowability and aerosolization. Understanding the role of cohesive -adhesive forces in different formulations and establishing a predictive approach for aerodynamic particle size distribution (aPSD) is thus, highly beneficial, since the traditional Next Generation Impactor (NGI) is a complex and time-consuming technique. The purpose of this study is to explore the relationship between powder dispersibility with the aerodynamic performance of different DPI formulations. For this, formulations with different ratios of drug substance/fine lactose/coarse lactose were tested using a laser diffraction technique (Sympatec HELOS/RODOS) and NGI. Sympatec was used to characterise powder dispersibility and inherent cohesion and adhesion forces at different pressures The aerodynamic profile was characterized using an NGI at a pressure drop of 4kPa with a commercial inhaler. A correlation was evaluated between the powder dispersibility obtained using Sympatec and the aerodynamic properties from the NGI analysis.
Key Message
A simple and innovative solution was developed for faster DPI formulation screening
Introduction
Dry Powder Inhalers (DPIs) are final dosage forms used to deliver drugs to the lungs. DPIs had attracted enormous attention worldwide due to its local targeting, rapid drug action, suitability for delivering and satisfactory patient compliance1. In order to achieve a pharmacological effect after administration via the inhalation route, particles have to deposit within the respiratory tract. Physicochemical properties of dry powders, such as particle size and shape, surface morphology and electrical charge, hygroscopicity, and moisture content have direct impact on aerosolization performance and bioavailability. It is generally accepted that drug deposition within the respiratory tract is dependent on the delivery of particles with an aerodynamic size diameter between of 0.5 – 5µm 2. Due to their large specific surface area, inhalable drug particles are very cohesive, presenting poor flowability and are a challenge during process development. To improve their flowability, active pharmace utical ingredient (API) are often blended with larger particles of excipient 3. During aerosolization, particles must be removed from the carrier particles and agglomerates must be disrupted in the airflow 4. The determination of the aPSD of an aerosol is a key parameter to estimate its deposition behaviour in the lungs. Aerodynamic particle size distribution of drug aerosols is routinely measured using cascade impactors such as Andersen Cascade Impactor (ACI), Fast Screening Impactor (FSI) and NGI. Impacti on methods can be considered a simplified model of the respiratory system that segregates the particles according to their aerodynamic diameter and are excellent techniques for quality control testing of inhalation products. However, the analytical procedu res involved are time-consuming and labour-frequently jeopardizing the screening process of new formulations during the early stages of product development 5. In the present work a dry dispersion laser diffraction technique was used to characterise inheren t powder dispersibility of three DPI formulations with different content of API, fine lactose and coarse lactose. A methodology was established for the evaluation of aerodynamic behaviour of different DPI formulations. A correlation between aerodynamic performance and the deagglomeration mechanism is expected to achieve speeding up the screening process of inhalation formulations.
Experimental methods
Three DPI formulations A (50 µg API/capsule), B (500 µg API/capsule) and C (750 µg API/capsule) were tested for the evaluation of aerodynamic behavior to characterize inherent powder dispersibility and deagglomeration using a laser diffraction technique. For this study, a carrier -based DPI formulation was selected using Respitose SV003 and Lactohale LH230 (DFE Pharma) as coarse and fine lactoses, respectively, with different ratios. A 5 kg blend was produced in a Diosna high-shear mixer under the best process conditions identified previously. A blend uniformity analysis (BUA) was performed by Ultra Performance Liquid Chromatography (UPLC), demonstrating blend uniformity [6]. HPMC size #3 clear
Drug Delivery to the Lungs , Volume 32, 2021 – Raquel
Borda d’ Água et al.
219
capsules (Capsugel®) were a utomatically filled at relative humidity controlled conditions (35% - 55%) using a MG2 FlexaLab dosator-based unit. Capsules were filled targeting 20 mg per capsule, applying an acceptance limit of ± 0.5 mg of the average fill weight. The Sympatec HELOS/RO DOS module with Aspiros feeder was used. The content of fine particles such as API in the blended sample can be assessed from the bimodal particle size distribution, since API and coarse carrier widely differ in particle size. The R4 lens was chosen since allows to capture both coarse lactose and the fine particles of micronized API in the same measurement. The speed of the feeder was set at 50 mm/s. The pressure drop was set between 0.1 and 4.0 Bar in order to characterize inherent powder dispersibility un der study. An insignificant overlap particle size distributions was observed and for that reason results evaluation were performed in volume. The aerodynamic particle size distribution was measured by NGI equipped with USP induction port, pre-separator and a set of collection cups. Aerodynamic properties such as emitted dose (ED), fine particle fraction (FPF), fine particle dose (FPD), mass median aerodynamic diameter (MMAD) and geometric standard deviation (GSD) were calculated using an appropriate data analysis software. The morphological analysis was carried out using a Phenom Pro X desktop SEM (Scanning Electron Microscopy), which operates at 15 kV and at a working distance of 4 –13 mm. Samples were analysed with a magnification of 2500x and different fie lds were acquired.
Results
Microscopy was used to examine DPIs morphology and state of agglomeration. Figure 1 showed that coarse lactose was covered by API and fine lactose.
In Table 1, the aerodynamic performance of the three formulations was determined by three consecutive measurements, using a commercial capsule-based inhaler, at a pressure drop of 4.0 kPa and an airflow of 100 L/min. The impact of fine and coarse lactose carrier’s amount was studied. FPF values increased with the addition of fine lactose.
Table 1 – ED, FPD, FPFED, MMAD and GSD for three different formulations A (50 µg API/capsule), B (500 µg API/capsule) and C (750 µg API/capsule) under flow rate of 100 L/min. Fine and coarse lactose present in all formulations. Data is presented as mean ± SD, n = 3. *LOQ: Limit of quantification.
A laser diffraction technique was used to understand the deagglomeration and aerosolization behaviour of the different formulations. Particle size distributions of the DPIs at different pressures are shown in Figure 2. A shift towards smaller particle sizes is observed in the PSD for all the powders as pressure increases. The plateau profiles of the particle size pressure curves differed, indicating formulation specific deagglomeration behaviour. Formulation C reaches the plateau at 0.5 bar, while formulation A only achieved the same condition at 1.5 bar.
Drug
to the Lungs ,
-
Delivery
Volume 32, 2021
Leveraging DPI formulation screening: particle -particle interaction
Figure 1 – SEM images of Formulation A: 50 µg API/capsule, B: 500 µg API/capsule and C: 750 µg API/capsule. Coarse Lactose present in all formulations.
Instrument NGI Flow rate (L/min) 100 Formulation A B C Nominal dose (µg/capsule) 50 500 750 ED (µg/capsule) 35.8 ± 1.0 363.1 ± 9.1 541.5 ± 13.6 FPD (µg/capsule) 5.6 ± 0.2 90.76 ± 19.4 149.7 ± 6.4 FPFED (%) 15.6 ± 0.3 24.95 ± 4.9 27.6 ± 0.7 MMAD (µm) 2.6 ± 0.2 2.2 ± 0.2 2.2 ± 0.0 GSD 2.4 ± 0.2 2.4 ± 0.2 2.5 ± 0.1
220
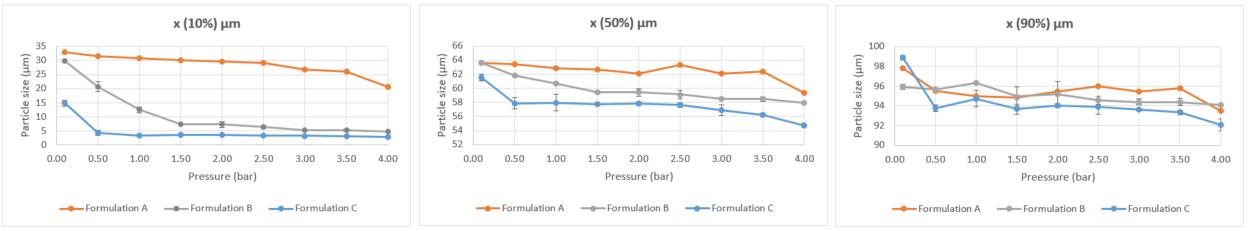
Discussion and conclusion
The extent to which an aerosolized dry powder is delivered to the lungs is directly influenced by its physicochemical properties. Particle shape and size are the physical properties with major influence on aerosolization and release from the inhaler device. The morphology of the particles and state and aggregation for Formulations A, B and C were shown in Figure 2. SEM imaging revealed that each formulation was composed of micronized sized particles Coarse lactose exhibited a rocklike shape morphology while API and fine lactose particles showed an irregular form, being attached and localized on the surface of the coarse lactose for all formulations. Nevertheless, a different distribution of particles on the top of the coarse carrier was observed between Formulations A and the other two (B/C). A higher amount of particles can be observed on top of coarse lactose for Formulation B and C. The gradual increase of API and fine lactose led to more agglomerates of API-Fine lactose being heterogeneously distributed on the coarse lactose surface, presenting larger agglomerates on top of the carrier compared to when fine lactose was almost absent in the formulation. Most of the API and fine lactose particles adhered as agglomerates or single particles on the boundaries of the carrier. NGI was applied to determine the aerosolization performance of different DPIs. The aerodynamic response is illustrated in Table 1. It was noted that for higher drug content and higher fine lactose formulations , FPF values increased, implying that increasing the drug content and the amount of fine lactose is an effective way to enhance lung delivery by helping drug detachment from carrier surfaces. These results are consistent with other reports, who also observ ed a drug deposition shift when more fines added to the DPI formulations 6. As said, in order to understand the deagglomeration and aerosolization mechanism, these same formulations were studied using laser diffraction technique. X(10%) µm, X(50%) µm and X(90%) µm were plotted as a function of the pressure used (Figure 2). All the powders exhibited a reduction in X(10%), X(50%) and X(90%) until a plateau was reached. The shape of the particle size pressure profile showed a rapid drop in the X(10%) µm for Fo rmulations B and C under the application of a dispersing pressure of 0.5 bar. A rapid attainment of the plateau particle size was reached which indicates an efficient deagglomeration when compared with Formulation A (the drop in the X(10%) µm and X(50%) µm was more progressive for this formulation suggesting a more gradual deagglomeration process). The same tendency was also observed in X(50%) µm (the decrease observed from 2.5 to 4.0 bar could be due to potential milling of particles). No significant diffe rences were observed in X(90%) µm between formulations, since this parameter is highly influenced by coarse lactose and for that reason was not used for aerodynamic performance evaluation. These results seem to show that formulations with faster deagglomeration behavior (deagglomeration that occurs at low pressures (B and C)) also have higher FPF values. This supports the theory that deagglomeration assessed by laser diffraction using sympatec could be correlated with the aerodynamic performance. Such assum ption might be not clear to formulation A due to its high amount of coarse lactose, which may have a greater influence in the X(10%) µm and X(50%) values. By comparing the aPSD results obtained through NGI and the ones obtained by laser diffraction methodology, it is observed that the formulation with the higher amount of API and fine lactose has faster deagglomeration. Moreover, it is also the formulation with the highest FPFED (%) value (27.6 ± 0.7), which allows to conclude that the method may have the p otential to estimate the aerodynamic performance during DPIs screening process in earlier development stages. Formulation development process requires a knowledge of the powder dispersibility and deagglomeration behavior in order to select the required for mulation components and the appropriate manufacturing approach. Here, a rapid and systematic laser diffraction methodology enables the prediction of aerodynamic behavior accelerating the screening process of inhalation formulation. Further studies are ongoing, with different formulations and APIs in order to statistically infer the forecasting ability of Sympatec in supporting pre-formulation development. Above a proof-of-concept is presented demonstrating a trend between laser diffraction results with aero dynamic performance for a micronized
Drug Delivery to the Lungs , Volume 32, 2021 – Raquel Borda d’ Água et al.
Figure 2 – The particle size pressure profiles of the inhaled powders Formulation A (50 µg API/capsule), Formulation B (500 µg API/capsule) and Formulation C (750 µg API/capsule) measured by Sympatec HELOS/RODOS dry dispersion laser diffraction (mean ± SD, n = 3 for Formulation B and C). Fine and coarse lactose present in all formulations.
221
Drug Delivery to the Lungs , Volume 32, 2021 - Leveraging DPI formulation screening: particle -particle interaction
API in 3 different carrier-based formulations. Nonetheless, similar trends and results are expected when evaluating different micronized APIs in combination with larger sized carriers such in their formulation.
References
[1] Pinto J T., Cachola I, F Pinto J., Paudel A: Understanding Carrier Performance in Low -Dose Dry Powder Inhalation: An In Vitro–In Silico Approach, Pharmaceutics 2021; 13: 297.
[4] Parisini I, Collett J. L, Murnane D: Mathematical approach for understanding deagglomeration behaviour of drug powder in formulation with coarse carrier, Asian Journal of Pharmaceutical Sciences 2015; 10: pp 501-512.
[5] Jaffari S, Forbes B, Collins E, Barlow D J., Martin G P., Murnane D: Rapid characterisation of the inherent dispersibility of respirable powders using dry dispersion laser diffraction, International Journal of Pharmaceutics 2013; 447, 1-2: pp 124-131.
[6] Braga M, Pereira J, Ferreira H, Costa E: From laboratory to commercial scale: impact of a dosator-based capsule filling process on a DPI aerodynamic performance. (Abstract). Poster presentation at: Respiratory Drug Delivery , Lisbon, Portugal, May 7-10, 2019
[7] Liu Q, Guan J, Sun Z, Shen X, Li L, Jin L, Mao S: Influence of stabilizer type and concentration on the lung deposition and retention of resveratrol nanosuspension-in-microparticles, International Journal of Pharmaceutics 2019; 569, 118562
222
Plume Front Velocity and Force to Actuation Characterisation of Pressurised Metered Dose Inhalers and Soft Mist Inhalers
Joshua Houlden1, Miles Jeanneret1 Davide Cunha1 & Mervin Ramjeeawon1
1Intertek Melbourn, Saxon Way, Melbourn, Herts, SG8 6DN, UK
Summary
There has been increased focus on the generic pharmaceutical industry when embarking on in -vitro only bio-equivalence testing of inhaled products , using a weight of evidence based approach to submission. In the draft product specific guidance document for beclomethasone dipropionate issued in May 2019, the FDA proposed additional supportive in -vitro studies. These included the characterisation of Plume Front Velocity (PFV) profiles of the test and reference product to support the weight of evidence approach to negate the need for resource consuming comparative clinical endpoint bioequivalence studies [1].
Plume Velocity analysis is a technique that permits the movement of the plume generated from the inhalers to be visually captured over time from which data can be extracted and extrapolated to determine the velocity of the plume emitted.
Two different commercially available metered dose inhalers (pMDI) and one commercially available soft mist inhaler (SMI) were selected to demonstrate this novel approach to device characterisation. The differences in the plume velocity between the two different device types (pMDI/SMI) was investigated and the comparison of plume velocities between a generic pMDI device and its reference listed drug (RLD). The force to actuate, and plume duration times, for both pMDIs were also investigated.
Key Message
Development of Plume Front Velocity and Force to Actuate methodologies for the characterisation of pMDI and SMI devices using the Proveris SprayVIEW were shown to be highly effective for the evaluation of emitted aerosol devices and in-vitro bioequivalence studies between generic and reference listed drug products.
Introduction
In various guidance documents [1,2,3], the FDA has proposed the use of emitted aerosol Plume Front Velocity (PFV) profiles as an additional characterisation study for in-vitro bioequivalence studies , and it has been demonstrated that plume velocity is a significant element in bioequivalence comparison s [4]
Traditional clinical endpoint studies have been a limiting factor in the small number of approved complex generic inhaled drug products coming to the market, as they are generally time consuming and expensive
Plume velocity is defined as the rate in which the leading edge of the plume, fired from a device, moves from the actuator with time The overall aerodynamic performance is directly related to the velocity of the emitted aerosol, as well as being influenced by droplet or particle size, and shape. Plume velocity is therefore a key parameter for the characterisation of drug -device combinations and their efficacy in deposition of the drug in the lungs. PFV is also an important element when training patients on the optimal use of a product, as factors such as actuation/inhalation coordination and inhalation intensity , impact the effectiveness of the product [5,6]
Force to actuate (FtA), another key parameter for the characterisation of a drug product, is defined as the amount of resistive force exhibited when the plume is emitted from the device. The FtA is a key parameter in an effective dose counting mechanism; however other parameters need to be considered, including distance travelled and displacement which are not covered in this publication Inefficient dose counting mechanisms can lead to undercounting, whereby there would be fewer doses in the inhaler than stated on the counter, potentially leading to the patient being at risk of taking a lower than label claim dose at the apparent end of life for the device
In this study, the Proveris SprayVIEW will be utilised to characterise both PFV and FtA. The instrument can accurately determine the velocity and duration of a plume by producing time-synchronised images calibrated to the relative distance from the device mouthpiece. The automated actuator has the capability to determine force to actuate by measuring the amount of force required throughout the duration the actuation.
Drug Delivery to the Lungs , Volume 32, 2021 – Joshua Houlden et al.
223
Equipment and Materials
In this study three different products were investigated: two commercially available pMDIs and a soft mist inhaler. The two pMDI devices were a reference listed drug (RLD) and generic product, containing the same APIs, dosage, and propellant. Analysis was performed on three devices of a single batch per device type. Each device was actuated to obtain 3 replicates for the plume velocity measurement and 1 replicate for the actuation force measurement.
Plume Velocity [7]
For the pMDI devices, the SFMDx actuator was used. The same actuation parameters were used for both device types, and method settings were optimised for each device . A shake time of 5s was employed prior to immediate actuation, and a 1 min wait time implemented between sprays, to allow for temperature equilibration. For the SMI devices, the OSx actuator was used, and method settings and actuation parameters were developed with a 1 min wait time between actuations
Image sequences for the plumes were generated with the Proveris SprayVIEW Measurement System, which utilizes a high-speed camera and a planar sheet of laser light to acquire images of the plume in order of relative intensity. The instrument generates time synchronised images of the plume calibrated to distance. Images of the plume are processed with a colour gradient to show varying regions of spray density The positioning of the camera allows for a plume of up to approximately 100mm to be captured
The images of the plume during the actuation were generated in 2ms intervals. Images of the plume actuation were acquired from T=0ms (frame prior to the plume emerging from the device mouthpiece) to the time in which the tip of the plume reaches the edge of the image window. Plume distance was calculated by measuring the relative distance of the leading edge of the plume from the tip of the mouthpiece. A minimum intensity threshold of 10 was applied to determine the edge of the plume. The plume’s leading edge was tracked until it had passed 100 mm i.e. had passed outside the field of view.
The relative plume distances and times were recorded for each frame, which were plotted onto a distance vs time graph. A linear regression was plotted, and the slope of the linear trendline was reported as the plume velocity (assumed to be linear). The R2 value was used as an indicator of the fit of the data.

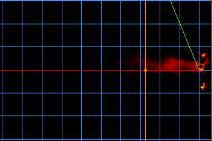
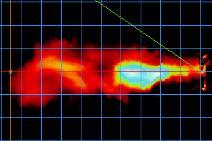
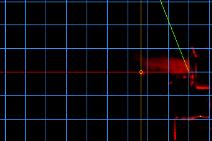
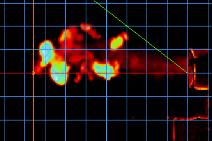
Drug Delivery to the Lungs , Volume 32, 2021 -Plume Front Velocity and Force to Actuation Characterisation of Pressurised Metered Dose Inhalers and Soft Mist Inhalers
Device type Manufacturer Formulation API Type Propellant pMDI 1 Seretide 250 Evohaler® Suspension Combo API HFA 134a pMDI
Combisal® 25µg/250µg Suspension Combo API HFA 134a SMI SPIRIVA® RESPIMAT®,
mcg Solution Mono API N/A
2
2.5
Table 1. Product information for the two pMDI devices and the one SMI device
pMDI Image Acquisition and Linear Regression Time: 0 ms Distance: 0.0 mm Time: 2 ms Distance: 27.41 mm Time: 6 ms Distance: 80.08 mm Time: 8 ms Distance: 95.79 mm SMI Image Acquisition and Linear Regression Time: 0 ms Distance: 0.0 mm Time: 12 ms Distance: 23.46 mm Time: 30 ms Distance: 49.36 mm Time: 50 ms Distance: 75.87 mm
pMDI and SMI Plume Velocity profile Image Acquisition and Linear Regression y = 12.213x + 3.634 R² = 0.9837 0.00 20.00 40.00 60.00 80.00 100.00 0 2 4 6 8 10 Plume Distance (mm) Time (ms) y = 1.5387x + 1.9754 R² = 0.9886 0.00 20.00 40.00 60.00 80.00 100.00 0 10 20 30 40 50 60 70 80 Plume Distance (mm) Time (ms) Non-linear (far-field) Region Linear (near-field Region 224
Figure 1.
Actuation Duration
The duration of the actuation was calculated from the time at which the first emission of the plume is seen, to the time in which the device’s spray is no longer being emitted. The start and end point of the actuation is determined via visual assessment of the real time images. The start point is when the plume front is first visible past the mouthpiece of the d evice. The end point is the final frame where a complete plume has exited past the mouthpiece.
Force to Actuate [8]
Actuation force was measured using the SFMDX automated actuator (for pMDI) and NSx automated actuator (for SMI) to actuate the devices within the Proveris SprayVIEW Measurement System. The instrument can accurately measure the force required to actuate the device throughout the entire sequence and plots the recorded forces in relation to time.
Force to Actuate was determined from the average time of the start of the emission of the three plume velocity replicates per device. This was subsequently used to determine the force of the actuation.
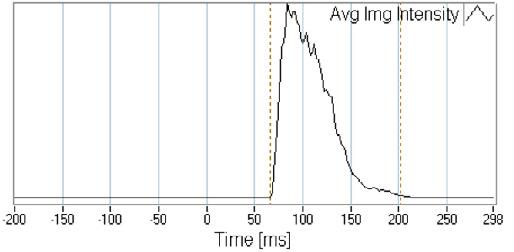
Results and Discussion
A graphical representation of plume distance verses time was generated for the 9 sprays per device type (Figure 4) The pMDI devices provided a maximum of five data points before the plume front had passed out of the field of view. A linear regression was applied , assuming a constant velocity across all data points of the pMDIs. Both pMDI device types follow similar regression trend s indicating that they have a similar plume velocity The SMI has the slowest velocity of the three dev ice types, as would be expected from its nature of operation. At a distance of 70 – 80mm from the mouthpiece, the rate in which the edge of the plume travels over time decreases, and the plume velocity becomes non - linear. The velocity profile can be segmented into two distinct regions: the linear near-field region; and the nonlinear far-field region. For the determination of plume velocity for the SMI devices, linear regression was applied only to the linear region of the profile , and the velocity was calculated from this region. There may also be two regions present for the pMDI devices due to deceleration, but this cannot be detected due to the limited distance from the orifice that can be measured, and the limited number of data points that can be collected until the plume front has exited the field of view. The initial velocity of the SMI is lower, and thus its inertial deceleration in static air is reached at a shorter distance from the orifice (within 100 mm), resulting in recirculation and a non-linear far-field region being observed. For patient use the deceleration and diffusing effects of the static air are not the most critical factors, unlike the initial velocity and spray duration, where differences are more vital for patient inhalation synchronisation.
Drug Delivery to the Lungs , Volume 32, 2021 – Joshua Houlden et al.
Figure 2 Actuation duration profile (left) and Figure 3 Force to actuate profile (right)
0.00 10.00 20.00 30.00 40.00 50.00 60.00 70.00 80.00 90.00 100.00 0 10 20 30 40 50 60 70 80 Plume Distance (mm) Time (ms) pMDI 2 pMDI 1 SMI 1 225
Figure 4. Distance vs Time overlay for pMDI 1, pMDI 2, and SMI 1
For pMDI devices, the synchronisation between inhaler actuation and inhalation is extremely important and relies on sufficient training/patient compliance in order to maximise the efficacy of the treatment. This is due to the high rate of displacement of the aerosol after actuation. In contrast, for SMI devices, the lower plume velocity and longer duration means that there is less of a requirement for synchronisation, so that less training is required to use the device. Additionally, those who would be at risk of decreased clinical efficacy when using a conventional inhaler (due to age or inhalation ability) would receive a greater benefit from using a SMI.
Figure 5 summarises the average plume velocity for each dev ice type, and figure 6 shows the force to actuate for each device type. Table 2 presents a summary of the devices for plume velocity, force to actuate, and duration (pMDI only). For pMDI 1 and pMDI 2, the average plume velocity (10.97 m/s and 12.50 m/s), and the force to actuate (4.16 kg & 3.91 kg) were found to be similar, however the individual sprays for both device types are quite variable with some inter-device and intra-device variation.
The SMI devices are slower than the pMDIs and require a considerably reduced force to actuate. There is also less variability between replicates compared to the pMDI devices.
Conclusion
The plume velocity profile and the force required for actuation of emitted aerosol drug products are both crucial elements for consideration when developing a generic, and for bioequivalence testing. Recent guidance documents from the FDA have highlighted plume velocity and force to actuation as effective in-vitro characterisation techniques. In this study, two pMDI devices of the same drug type (generic and RLD) and one SMI device were analysed to attain the velocity profiles and actuation force by expanding on the use of the Proveris SprayVIEW and its current capabilities.
Results show that PFV and FtA analysis are effective characterisation techniques for in-vitro bioequivalence testing of a generic and innovator pMDI devices. The data show s that the two devices are comparable and would provide evidence to suggest equivalence for post actuator velocity performance and actuation force. The results also show that t he mechanism for aerosolisation has a major effect on the plume velocity and force to actuate. The HFA propellant driven pMDI devices have a considerably higher velocity and actuation force compared to the mechanically driven SMI devices.
[1] FDA Beclomethasone dipropionate Inhalation Aerosol Metered NDA 207921 PSG Page RC May 2019
[2] FDA Ipratropium Bromide Inhalation Aerosol Metered NDA 021747 PSG Page RC August 2021
[3] FDA Ciclesonide Inhalation Aerosol Metered NDA 021658 PSG Page RC March 2021
[4] Liao L, Ramos K, Farina D: A novel characterization of emtted aerosol velocity profiles from metered dose and soft mist inhalers. (Abstract). Presented at: DDL conference, 2019.
[5] Melani A S, Bonavia M, Cilenti V, Aliani M, Neri M: Inhaler mishandling remains common in real life and is associated with reduced disease control. Respir Med 2011;105:930–938
[6] Lavorini F, Usmani O S: Correct inhalation technique is critical in achieving good asthma control Prim Care Respir J. 2013;22:385–386
[7] Proveris Scientific Technical Note TN 0105 Plume Front Velocity November 2019
[8] Proveris Scientific Technical Note TN 0104 Force to Actuate April 2021
Drug Delivery to the Lungs , Volume 32, 2021 -Plume Front Velocity and Force to Actuation Characterisation of Pressurised Metered Dose Inhalers and Soft Mist Inhalers
Figure 5 Plume velocity results and Force actuation results for pMDI 1, pMDI 2, and SMI 1 Table 2. Plume velocity, plume duration and actuation force summary table
Device Mean Plume Velocity (m/s) Mean R² Mean Plume Duration (ms) Mean Actuation Force (kg) pMDI 1 10.97 0.96 170.22 4.16 pMDI 2 12.50 0.94 134.44 3.91 SMI 1 1.63 0.98 - 0.53 226
Influence of Geography on the Carbon Footprint Impact of Breezhaler® Dry Powder Inhaler
Aumônier S1, Mezzi K2 Whiting A1 & Fulford B2
1 ERM, Eaton House, Wallbrook Court, North Hinksey Lane, Oxford, OX2 0QS, UK
2 Novartis Pharma AG, Novartis Campus, Basel, Switzerland
Summary
Inhalers have a significant contribution to the carbon footprint (CFP) of healthcare. Novartis is committed to reduce the environmental impact of its product and in line with this commitment, the Breezhaler ® device is available as a hydrofluoroalkane/chlor ofluorocarbon–free dry powder inhaler for delivery of asthma medications.
This paper presents the findings of the cradle -to-grave CFP studies of two Breezhaler ® inhaled combinations (indacaterol acetate/mometasone furoate [IND/MF] and IND/glycopyrronium br omide/MF [IND/GLY/MF]) from Italy and Spain; additionally, a conservative estimate, which can be used as a reliable proxy for CFP of Breezhaler® in other countries, is also reported. The Breezhaler ® combinations assessed were IND/MF (30-day pack, without digital companion), IND/GLY/MF (30 -day packs, with and without digital companion) and IND/GLY/MF (90-day pack, without digital companion).
The Breezhaler® combination of IND/GLY/MF (without digital companion) has the lowest CFP among all the combinations evaluated. Similar CFP estimates were reported for all the Breezhaler ® portfolio products in the most conservative estimate and the countries evaluated.
Active pharmaceutical ingredients, inhaler production energy and packaging are the main contributors to the CFP; for IND/GLY/MF, 30-day pack with digital companion, the raw materials of the digital companion have the highest contribution. Excipients, distribution, and end -of-life stages all make minimal contributions to the CFP of Breezhaler ® products.
Overall, the low CFP of the Breezhaler ® portfolio (which has fixed dose combinations of IND/MF and IND/GLY/MF) is not influenced by geography and the findings from Italy, Spain and the conservative estimates are all consistent with the published literature from other countries
Key Message
The Breezhaler® portfolio (which has fixed dose combinations of IND/MF and IND/GLY/MF) has a low carbon footprint (CFP) across the world. Even at the most conservative estimate, the CFP of Breezhaler ® is low and consistent with footprints of countries evaluated in this study (Italy and Spain) and in previous studies (France, Germany, Japan, and UK).
Introduction
The “cradle-to-grave” analysis technique assesses the environmental impact associated with all stages (raw material extraction to processing, manufacturing, distribution, use, and disposal) of a product’s life [1]. This assessment has the objective of understanding the influence of geography on the CFP of the Breezhaler® products with respect to the underlying goals of identifying hotspots in the product life cycle and potential opportunities to reduce its products impacts.
Two combinations (indacaterol acetate/mometasone furoate [IND/MF] and IND/glycopyrronium bromide/MF [IND/GLY/MF]) were assessed in three product formats: 30 -day pack without digital companion, 30-day pack with digital companion and 90 -day pack without digital companion. The digital companion refers to a sensor attached to the Breezhaler® device and the accompanying mobile application which provides inhalation confirmation, medication reminders and access to objective data on clinical condition and sensor-related information to better support therapeutic decisions .
Main Body of Text
Methods
Data were modelled using Ecoinvent 3.6 database on the SimaPro LCA software version 9.1.0.82, and the impact of each product has been calculated using the Intergovernmental Panel on Climate Change impact assessment method with a timefr ame of 100 years (IPCC 2013 GWP 100a). The CFP studies
Drug Delivery to the Lungs , Volume 32, 2021 - Aumônier S et al.
227
Drug Delivery to the Lungs , Volume 32, 2021 - Influence of Geography on the Carbon Footprint Impact of Breezhaler® Dry Powder Inhaler
comply with the methodological requirements set out in the Greenhouse Gas Protocol Product Life Cycle Accounting and Reporting Standard, (GHG protocol).
The functional unit (FU) is defined as: “An inha ler device used for 30-days to treat a patient differentiated according to the characteristics of Italy or Spain or in the most conservative scenario.” As the 90 -day pack is analysed for 30-days of use (i.e., employing the same FU as the 30 -day packs), the FU for the 90-day pack includes one-third of the inhaler and one-third of the 90-day capsule pack. When a digital companion is used, the FU contains one-twelfth of a digital companion and its respective packaging.
The most conservative scenario represents the longest possible distribution distance and assumes that all wastes are incinerated without energy recovery. This is expected to have the highest carbon footprint (CFP) at all life stages because combustion releases greenhouse gas emissions without counterbalancing the benefits of avoiding other sources of energy The most conservative estimate can be used as a reliable proxy for CFP of Breezhaler ® products in countries where cradle-to-grave studies have not been conducted.
Included in this analysis were API synthesis, capsule/inhaler/digital companion production, packaging and distribution, energy used at the pharmacy during storage, the use of the inhaler by patients and the disposal of the Breezhaler ® device, digital companion, and packaging. The manufacture, maintenance and disposal of machinery required during the manufacturing process, as well as the manufacture and upkeep of buildings, are all excluded from the scope of the study.
Results
The results of the CFP assessment (per day, per month, and per year) for each of the evaluated Breezhaler® products, done via the cradle-to-grave analysis, are shown in Table 1. The difference between the most conservative estimate and the findings from countries is less than 10%, indicating that the CFP of the Breezhaler® devices in all parts of the world will be consistent with the CFPs from Italy and Spain. Impacts for one month have been calculated on a 30 -day basis, with one year taken to be 365 days. The breakdown of the CFP by life cycle stage in geographi es is shown in Figure 1
A cradle-to-gate CFP was also conducted which refers to the footprint of each inhaler device from resource extraction to the factory gate, omitting the distribution, use and end -of-life of the product. IND/GLY/MF (90-day) has the lowest cradle-to-gate CFP of 0.194 kg CO 2eq per month, while the 30day IND/GLY/MF device with digital companion has the highest at 0.490 kg CO 2eq per month.
Additionally, a gate-to-gate CFP analysis, including the emissions directly from Novartis controlled sites and those associated with energy used at Novartis controlled sites , was done. IND/GLY/MF (90-day) has the lowest gate-to-gate CFP of 0.041 kg CO 2 eq per month, while the IND/MF device with digital companion showed the highest at 0.115 kg CO 2 eq per month.
When looking at end-of-life routes, waste incineration without energy recovery has the highest CFP, as the carbon content of the device and packaging are released. While the most conservative estimate assumes 100% incineration without energy reco very, for Italy and Spain the findings were 10% and 12%, respectively. For Italy and Spain, 70% end-of-life routes were incineration with energy recovery
Discussion
This study focusses on evaluating the CFP of Breezhaler ® products in Italy and Spain, and more importantly providing a conservative estimate which can be used to understand the environmental impact of the Breezhaler® device in countries where such studies have not been conducted. It is an extension of a previously conducted analysis in four countries (France, Germany, Japan, and the UK) [2] The analysis done in France, Germany, Japan, and the UK found that the largest contributions to the CFP came from active pharmaceutical ingredients, inhaler raw materials and packaging (plus, sensor raw materials wherever they were used) On the other hand, excipients, distribution, and end of life stages all made minimal contributions to the CFP for all the Breezhaler® products evaluated [3]. This data will allow comparisons with published evidence from other inhalation devices, to effectively make informed decisions on inhalation therapy
Conclusion
228
Drug Delivery to the Lungs , Volume 32, 2021 - Aumônier S et al.
The low CFP of the Breezhaler® device did not vary significantly among the considered countries (Italy and Spain), those evaluated previously and the conservative estimate. The Breezhaler® device has a consistent environmental impact in all geographies.

Life cycle stage Geography IND/MF (30-day) without digital companion IND/GLY/MF (30-day) with digital companion IND/GLY/MF (30-day) without digital companion IND/GLY/MF (90-day) without digital companion API Italy 21% 12% 16% 30% Spain 21% 12% 16% 30% Most conservative estimate 19% 11% 15% 29% Excipients Italy 1% 1% 1% 3% Spain 1% 1% 1% 3% Most conservative estimate 1% 1% 1% 3% Inhaler raw materials Italy 24% 19% 25% 16% Spain 24% 19% 25% 16% Most conservative estimate 22% 18% 23% 15% Inhaler production energy Italy 26% 21% 28% 18% Spain 26% 21% 28% 18% Most conservative estimate 24% 20% 26% 17% Digital companion raw materials Italy n.a 22% n.a n.a Spain n.a 22% n.a n.a Most conservative estimate n.a 20% n.a n.a Digital companion production energy Italy n.a 1% n.a n.a Spain n.a 1% n.a n.a Most conservative estimate n.a 1% n.a n.a Packaging Italy 22% 18% 23% 27% Spain 22% 18% 23% 27% Most conservative estimate 20% 17% 22% 26% Distribution Italy 2% 1% 2% 2% Spain 1% 1% 1% 1% Most conservative estimate 3% 3% 3% 3% Use Italy 0% 0% 0% 0% Spain 0% 0% 0% 0% Most conservative estimate 0% 0% 0% 0% End-of-life Italy 5% 4% 5% 4% Spain 5% 4% 5% 4% Most conservative estimate 9% 8% 10% 8% API, active pharmaceutical ingredient; GLY, glycopyrronium bromide; IND, indacaterol
MF, mometasone furoate 229
Figure 1 - Figure and tabular legend depicting the percentage breakdown of the carbon footprint by life cycle stage for each product and geography in kg CO2 eq per FU – (a) Italy, (b) Spain, (c) Most conservative estimate
acetate;
Drug Delivery to the Lungs , Volume 32, 2021 - Influence of Geography on the Carbon Footprint Impact of Breezhaler® Dry Powder Inhaler
Table
Product Geography
without digital
FU, functional unit; GLY, glycopyrronium bromide; IND, indacaterol acetate; MF, mometasone furoate.
References
[1] International Organization for Standardization: Environmental Management Life Cycle Assessment Principles and Framework, 2nd ed . Switzerland, 2006.
[2] Fulford B, Mezz K, Whiting A, Aumônier S: Life Cycle Assessment of the Breezhaler ® Breath-Actuated Dry Powder Inhaler, Sustainability 2021; 13, 6657. https://doi.org/10.3390/su13126657
[3] Aumônier S, Whiting A, Norris S, Collins M, Coleman T, Fulford B, Breitmayer E: Carbon footprint assessment of Breezhaler® dry powder inhaler . (Abstract). Presented at: Drug Delivery to the Lungs conference , December 8-10, 2020; Drug Delivery to the Lungs. 31; https://ddl-conference.com/ddl2020-christmas-lectures/conferencepapers/carbon-footprint-assessment-of-breezhaler-dry-powder-inhaler/ (online only).
Total per life cycle (kg CO2 eq) Total per day and dose (kg CO2 eq) Total per month and FU (kg CO2 eq) Total per year (kg CO2 eq) IND/MF, 30day Italy 0.421 0.014 0.421 5.054 Spain 0.416 0.014 0.416 4.996 Most conservative estimate 0.449 0.015 0.449 5.383 IND/GLY/MF, 30-day with digital companion Italy 0.519 0.017 0.519 6.232 Spain 0.515 0.017 0.515 6.174 Most conservative estimate 0.548 0.018 0.548 6.582 IND/GLY/MF, 30-day
companion Italy 0.397 0.013 0.397 4.762 Spain 0.392 0.013 0.392 4.705 Most conservative estimate 0.424 0.014 0.424 5.092 IND/GLY/MF (90-day) Italy 0.205 0.007 0.205 2.464 Spain 0.203 0.007 0.203 2.441 Most conservative estimate 0.218 0.007 0.218 2.615
Table 1. Carbon footprint comparison between Breezhaler®products (cradle-to-grave analysis)
230
The Quantitative Assessment of Vape Devices as Novel Pulmonary Drug Delivery Systems Using Fluorine-18 Radiolabelled Drug Molecules
George Herbert1,2, Glenn Woolley1,2,3, Dave Roberts1,2, Juozas Domarkas1,2, John Wright1,2, Graham Wright3 & Stephen J. Archibald1,2
1Department of Biomedical Sciences, The University of Hull, Cottingham Road, Hull, HU6 7RX, UK
2The Positron Emission Tomography Research Centre , The University of Hull, Cottingham Road, Hull, HU6 7RX, UK
3Hull University Teaching Hospitals NHS Trust, Castle Hill Hospital, Castle Road, Cottingham, HU16 5JQ, UK
Summary
Positron emission tomography (PET) is a highly sensitive and quantitative modality that can be employed for the efficient and informed development of novel pulmonary drug delivery devices. Vape devices present an alternate drug delivery system whereby the performance and formulation can be personalised for the end-user to improve experience and compliance A novel molecule was designed, synthesised and radiolabelled to allow efficient radiolabelling of vape liquid. This probe was used to understand the influence of device settings on output. It was concluded that a high a temperature setpoint (315˚C), low coil resistance (< 0.3 Ω) and short vape duration (≤ 4s) greatly increased output whilst flow rate (2.3 – 35 L/min) and glycerol content (0 – 100%) had little influence. Optimal settings were used to demonstrate marked increase in output efficiency of vape devices (10.91%/s) compared to jet nebulisers (0.18%/s). Using these settings, two known radiolabelled drug candidates ([18F]Fluticasone propionate and [18F]Fleroxacin) were assessed for their respective output and stability. [18F]Fluticasone propionate demonstrated good output ( 4.08%/s) and stability at the highest temperature setting; these promising results warrant further investigation. [ 18F]Fleroxacin was unstable at higher temperature and required vaping at 100˚C to maintain drug integrity ; output was compromised and it was concluded that this drug class was unsuitable for vape delivery. A mass median aerodynamic diameter of 1 µm and comparative activity distribution of vaped radiotracers confirmed uniform dispersion within the vape liquid and the capability for deep lung delivery using vape devices.
Key Message
The sensitive and quantitative properties of fluorine-18 radiolabelling were used to validate vape devices as novel drug delivery systems. The parameters for optimal output were determined and used to demonstrate significantly improved performance compared to a jet nebuliser Favourable output and stability were observed for a clinically relevant radiolabelled corticosteroid .
Introduction
The pulmonary route allows for high doses of drug to be achieved in the lung for both local and systemic treatment of disease. The success of pulmonary drug delivery is dependent on the device aerosolization efficiency and ability to deposit sufficient drug concentrations within the lung. Conventional pulmonary delivery relies on one of four devices; pressurised metered dose inhalers, dry powder inhalers, nebulisers or soft mist inhalers. Despite their many clinical successes, these devices possess various drawbacks including the use of ozone depleting gases, high patient effort needed to efficiently aerosolise the drug, long user interaction times and varied deposition profiles. 1 These issues should be addressed to ensure the most sustainable, efficient and effective pulmonary drug delivery is available to patients.
Vape devices present a novel alternative pulmonary drug delivery system which can offer high drug output from short operation periods and minimal patient effort. Furthermore, these devices can be personalised for the end-user resulting in an improved compliance. This can be achieved by the addition of flavourings to the formulation in order to mask the bitter taste of drugs or by reducing the output for patients experiencing hypersensitivity in the upper airways. The success of these devices in the delivery of nicotine for smoking cessation highlights their popularity yet they remain underexplored in terms of the effect of device settings on output, aerosol properties and drug compatibility and safety
To increase the efficiency of device development and speed up the bench to bedside translation of new technology which could offer significant patient benefits, non -invasive imaging can be employed Positron emission tomography (PET) is a highly sensitive and quanti tative medical imaging modality
Drug Delivery to the Lungs , Volume 32, 2021 – George Herbert et al.
231
which has been previously successfully used to validate novel drug delivery systems.2 Drug candidates can be transformed into radiotracers by substituting specific atoms with their radioactive isotope. This ensures the physiochemical properties of the drug are not altered and the study results are clinically relevant. Of the radioisotopes available, fluorine -18 benefits from high positron yields and low positron energies, promoting sensitive measurements. Studies using radiolabelled drug candidates will yield realtime quantitative results tha t can be employed in preclinical proof-of-concept in vitro studies and more complex in vivo studies focussing on pulmonary penetration, deposition and clearance. In all, these studies can be used to optimise performance by making informed changes to the device or formulation for maximum drug output, stability and safety
The project aimed to characterise device output and use this to investigate the potential for the pulmonary delivery of drugs using vape devices. To demonstrate clinical relevance, known radiolabelled drug candidates (fleroxacin and fluticasone propionate) were assessed for th eir vape output and stability.3,4 The results from vaping these radiolabelled drug molecules can be used to predict the suitability of other drug candidates from their representative classes (fluoroquinolone antibiotics and corticosteroids) for pulmonary delivery using these devices.
Experimental Materials & Methods
Vape operation was controlled using a custom -made rig which included; a variable temperature control vape device, rebuildable atomisers, coils (26, 28 or 32 AWG), a Raspberry Pi 4, a mass flow regulator and a vacuum pump. Vape liquid was created in-house using varying proportions of vegetable glycero l and propylene glycol. Vape aerosol was measured using a Dekati ELPI +, Dekati eDilutor Pro, air compressor and dehumidifier which were all sup plied by Scielutions Limited.
The radiochemistry precursor and non-radioactive fluorinated reference compound of [18F]V1 were prepared in-house in a two-step synthetic procedure from triethylene glycol, sodium hydride, methyl iodide, toluene sulfonyl chloride and tertiary butyl ammonium fluoride. Intermediates, radiochemistry precursors and reference compounds were confirmed using 1H, 13C and 19F NMR, HPLC and MS. Radiolabelling of [18F]V1 was achieved using a standard [18F]KF/K222 complex in acetonitrile at 95˚C for 15 minutes. The desired product was isolated by distillation and confirmed by HPLC. Radiochemistry precursors for [18F]fleroxacin and [18F]fluticasone propionate were prepared in house following established protocols and radiolabelling of these compounds was carried out as described previously. 3,4 Non-radioactive fluorinated reference for fluticasone propionate and fleroxacin , obtained from Carbosynth and TCI respectively, were used to confirm identity of the radiolabell ed product by HPLC.
Formulated radiotracers were aliquoted and concentrated. Homemade vape liquid was added and the mixture was shaken for 120s followed by a 300s rest period. Radiolabelled vape liquid was pipetted onto cotton wicks within the coils and these were attached to the vape device. Vaping was performed remotely using a command script to run the Raspberry Pi and activate device. Activity concentration of the vape device was measured before and after vaping to determine output. Tracer stability was determined by HPLC analysis of vaped tracer extracted from in -line filters.
Results & Discussion
Variable temperature control vape devices were used in conjunction with rebuildable atomisers in order to control temperate setpoint and coil resistance. A custom rig was developed to allow for control over device operation flow rate and ensure radiation protection of the end user. The vape activation was controlled by a RaspberryPi unit that allowed tight control over device operation times (± 0.1 second).
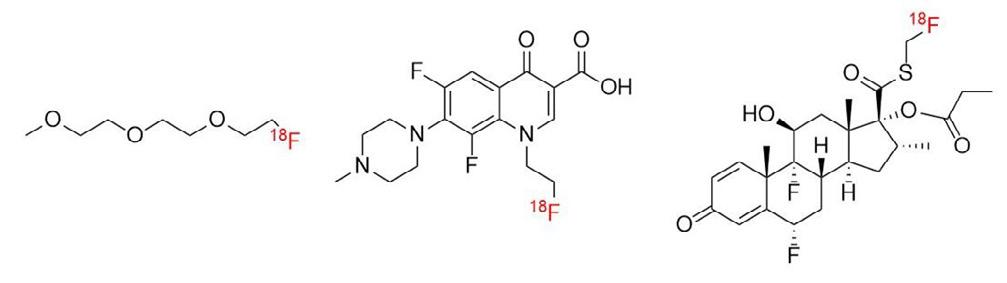
Drug Delivery to the Lungs , Volume 32, 2021 – The Quantitative Assessment of Vape Devices as Novel Pulmonary Drug Delivery Systems Using Fluorine -18 Radiolabelled Drug Molecules
[18F]V1 [18F]FLX [18
F]FP
232
Figure 1: The chemical structures of [18F]V1 (left), [18F]fleroxacin ([18F]FLX) (middle) and [18F]fluticasone propionate ([18F]FP) (right).
A custom probe, [18F]V1 (figure 1), was designed and synthesised with the efficient radiolabelling of vape liquid in mind. [18F]V1 was radiolabelled using a [18F]KF/K222 complex then the volatile nature of [18F]V1 was exploited and the tracer was purified by distillation. [ 18F]V1 was isolated in variable but good yield and high radiochemical purity (decay corrected RCY 43.8 ± 16.6%, n = 17, RCP > 98%, synthesis time = 102 ± 12 minutes).
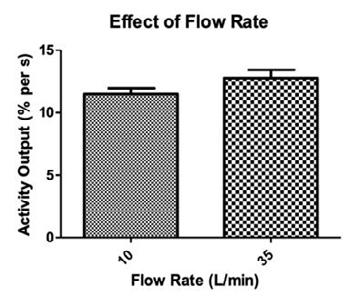
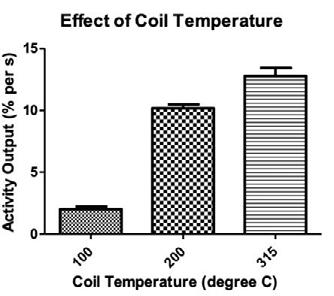
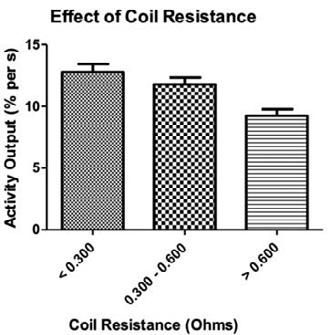

10 L/min
= 4) and 35 L/min (n = 13). ( B) Percentage of glycerol was investigated by altering the volume of glycerol in propylene glycol (20 mL stock). Fixed variables; 35 L/min, 315˚C, 4.0 s, <0.300 Ω. 0% (n = 3), 25% (n = 3), 50% (n = 5), 75% (n = 13) and 100% (n = 3). (C) Coil temperature was investigated by selecting the target plateau temperature on the device. Fixed variables; 35 L/min, 75% VG, 4.0 s, <0.300 Ω. 100˚C (n = 3), 200˚C (n = 3) and 315˚C (n = 13). (D) Time of vape duration was investigated by programming a raspberry pi script to activate the device for a fixed period. Fixed variables; 35 L/min, 75% VG, 315˚C, <0.300 Ω. 2.0 s (n = 3), 4.0 s (n=13) and 8.0 s (n = 3). (E) Coil resistance was investigated by changing the thickness of coil wire (26, 28 or 32 AWG, 8 turns, 2mm diameter). Fixed variables; 35 L/min, 75% VG, 315˚C, 4.0 s. < 0.300 Ω (n = 13), 0.300-0.600 Ω (n = 3) and > 0.600 Ω (n = 4).
[18F]V1 was used to radiolabel vape liquid and subsequently investigate the effect of device and user variables on output. In order to ascertain the optimal parameters for drug output a study was performed to understand the effect of each variable. The graphs shown in figure 2 illustrate the results of this screening study. For maximal output it was concluded that high coil temperatures, low resistance coils, and short-period vapes were favourable. Flow rate had little effect as did VG percentage. Higher percentages of PG are associated with ‘throat hits’ so to ensure better patient compliance 75% was employed. These optimal settings were then used to assess drug output.
Drug Delivery to the Lungs , Volume 32, 2021 – George Herbert et al.
A B C D E
Effect of % Glycerol 0 25 50 75 100 0 5 10 15 Amount of Glycerol in Propylene Glycol (%) A c t i v i t y O u t p u t ( % p e r s ) Tracer Output at 315˚C V1 FP FLX 0 5 10 15 [18F] Tracer A c t v i t y O u t p u t ( % p e r s )
Figure 2: Effect of variables on device output measured as percentage of activity output per second. ( A) Flow rate of air pulled through the device was investigated by using a mass flow controller to regulate vacuum flow rate. Fixed variables; 75% VG, 315˚C, 4.0 s, <0.300 Ω.
(n
[18F]FLX Output at Different Coil Temperatures 315 100 0 5 10 15 Coil Temperature (˚C) A c t i v i t y O u t p u t ( % p e r s ) A C B 233
Figure 3: Comparison of device and vaped drug output at 315˚C. A) A Pari LC Sprint jet nebuliser was filled with a purified water solution containing 18F-V1 (2-8 mL) and operated at 240 s, 35 L/min (n = 5). Vape was set-up with optimal parameters; 35 L/min, 75% VG, 315˚C, 4.0 s, <0.300 Ω (n = 13). B) Vape was set-up with optimal parameters; 35 L/min, 75% VG, 315˚C, 4.0 s, <0.300 Ω. V1 (n = 13). FP (n = 2). FLX (n = 5). C) Vape was set-up with lower temperature (100˚C) and other optimal parameters; 35 L/min, 75% VG, 4.0 s, <0.300 Ω. 315˚C (n = 5). 100˚C (n = 2).
Drug Molecules
To provide comparison, a Pari LC Sprint jet nebuliser was characterised for output using an aqueous solution of [18F]V1. Vape devices offer a much improved output per second compared to a jet nebuliser (10.91 vs. 0.18% per second) (figure 3, A) [18F]Fluticasone propionate showed good output (4.08% per second) and remained stable after vaping at the highest temperature setting (315˚C) (figure 3, B). After vaping at the same temperature, [18F]fleroxacin exhibited 60% decomposition and required vaping at 100˚C to maintain stability. At these lower temperatures, the output was greatly compromised (0.2% per second) (figure 3, C).
Vaped Aerosol Particle Distribution
Normalised
Activity Distribution of Vaped Radiotracers
[18F]FLX
[18F]FP
[18F]V1
Diameter (µm)
Figure 4: Comparison between the particle distribution of non-radiolabelled vape and the activity distribution of vaped radiotracers. A) Vape was set-up with optimal parameters and distribution was measured using the Dekati ELPI+, Dekati eDilutor Pro and Dekati software; 2.3 L/min, 75% VG, 315˚C, 4.0 s, <0.300 Ω. (n = 3). B) Vape was set-up with optimal parameters and distribution was measured using the Dekati ELPI+ and a radiation contamination monitor; 2.3 L/min, 75% VG, 315˚C, 4.0 s, <0.300 Ω. [18F]FLX (n = 1). [18F]FP (n=1). [18F]V1 (n = 3).
Non-radiolabelled vape was assessed using a Dekati ELPI + equipped with a Dekati eDilutor to determine the MMAD of the vape device using the optimal settings as determined previously. The observed MMAD was ~1 µm (figure 4, A) which favours deep lung distribution and supports the use of vape devices for pulmonary drug delivery. To confirm uniform distribution of drug molecules within the aerosol, the vape liquid radiolabelled with [18F]FLX, [18F]FP or [18F]V1 and was passed through the Dekati ELPI+. The device was dismantled and activity at each stage of the impactor was measured using a radiation contamination monitor. The results were decay corrected and normalised to provide comparison to unlabelled vape; the observed overlapping distribution profile confirms uniform drug distribution (figure 4, B).
Conclusion
A novel molecular probe was successfully synthesized and radiolabelled, allowing for the quantification of vape device output. Fluticasone propionate demonstrated good output and favourable stability at the highest temperature set-point which warrants further investigation . The observed instability of fleroxacin above 100 C and reduced output at low temperatures , indicates vape delivery is n on-ideal for the fluoroquinolone class of drug. A mass median aerodynamic diameter of 1 µm and comparative activity distribution of vaped radiotracers confirmed uniform dispersion within the vape liquid and the capability for deep lung drug delivery using vape devices. The promising results to date warrant the extension of this study to understand how clinically relevant concentrations of fluticasone propionate may influence output. Further, we hope these formulations can be assessed in vivo once the device and formulation has been optimised to ensure the three R’s of animal-based research are adhered to.
Acknowledgements The authors would like to thank the University of Hull for a scholarship to GH, Drug Delivery to the Lungs Society for funding from the Career Development Grant, the Daisy Appeal and Dr Assem Allam and family for their generous contribution to the University of Hull PET Research Centre.
References
[1] S. Newman, Drug delivery to the lungs: challenges and opportunities, Ther. Deliv., 2017; 8(8): pp647–661
[2] Cossio U., Gomez-Vallejo V., Flores M., Ganan -Calvo B., Jurado G., Llop J., Preclinical evaluation of aerosol administration systems using Positron Emiss ion Tomography, Eur. J. Pharm. Biopharm., 2018; 130: pp59 -65.
[3] Neal T., Apana S., Berridge M., Improved synthesis of [18F]fluoromethyl tosylate , a convenient reagant for radiofluoromethylations, J. Label. Compd. Radiopharm., 2005; 48: pp557 -68.
2021
Drug Delivery to the Lungs , Volume 32,
– The Quantitative Assessment of Vape Devices as Novel Pulmonary Drug Delivery Systems Using Fluorine -18 Radiolabelled
0.001 0.01 0.1 1 10 0 10 20 30 Diameter (µm) N o r m a l i s e d A c t i v i t y D i s t r i b u t i o n ( % )
(%)
Particle Distribution
A B 234
Drug Delivery to the Lungs , Volume 32, 2021 – George Herbert et al.
[4] Livni E., Babich J., Alpert N., Liu Y., Thom E., Cleeland R., Prosser B., Correia J., Strauss H., Rubin R. , Synthesis and biodistribution of 18F-labelled Fleroxacin, Nucl. Med. Biol., 1993; 20(1): pp81 -7.
235
236
Enabling Pulmonary Drug Delivery with Nanoporous Particles
Irès van der Zwaan1 Pegah Nabavi2 Adam Feiler2,3
1Department of Pharmaceutical Biosciences and Swedeliver, Uppsala University, Husargatan 3, Uppsala, 75237, Sweden
2Nanologica, Forskargatan 20G, SE-151 36 Södertälje, Sweden
3KTH, Royal Institute Technology, Department of Chemistry, Drottning Kristinas väg, 51SE-100 44 Stockholm
Summary
A novel pulmonary drug delivery system has been developed comprising of nanoporous, micron-sized, amorphous silica particles to encapsulate drug substances The particle size of these nanoporous particles (NPPs) can be tightly controlled, as can the diameter of the pores. The particles enhance the solubility of poorly soluble compounds and may also offer the potential to control the release rate of drug to the lungs. The objective of this study was to investigate the effect of particle size and pore size on drug release profiles of loaded NPPs which were aerosolized from a dry powder inhaler.
To study the effect of particle size, NPPs ranging from 2.5 µm to 5.0 µm, with identical pore sizes, were loaded with budesonide To explore the effect of pore size, NPPs of the same size (2.2 µm), but different pore diameters (2 nm and 7 nm) were loaded with a highly insoluble novel drug candidate (CMPD-X)
A modified Andersen cascade impactor (mACI) was used to characterise the deposited particle fraction Budesonide dissolution from the particles was studied in simulated lung fluid (SLF; Gamble’s solution) The dissolution rate of budesonide was greater after being loaded in NPPs compared to budesonide particles taken from a Pulmicort® Turbuhaler® Reducing particle size of NPPs from 5.0 µm to 2.5 µm increased the rate of dissolution of budesonide Looking at the effect of pore size on release rate of CMPD-X, the data showed that reducing the pore diameter from 7 nm to 2 nm decreased the release rate of the drug. It is notable that regardless of the pore size, encapsulating CMPD -X into NPPs significantly increased the amount of drug released into solution. Together these results strongly indicate that the ability to control both particle size and the pore diameter of the NPPs could offer a significant formulation advantage for some drugs in development.
Key Message
Both the particle size and the pore diameter of nanoporous amorphous silica particles can be controlled and utilised to influence the rate at which encapsulated drugs are released into solution. This may offer a significant formulation advantage for some drugs intended for pulmonary delivery
Introduction
Dry powder inhalers (DPIs) are used to deliver drugs to the lungs to treat diseases like chronic obstructive pulmonary disease (COPD) and asthma. DPIs can also be used to deliver drugs to the systemic circulation via the lungs, taking advantage of the large absorption area, high vascularization and avoidance of first pass metabolism.[1] Current formulation strategies, such as micronisation and spray drying, can generate particles in the respirable size range and provide some control of the particle size and morphology, but may be limited in providing opportunities to influence the drug dissolution profile. Additional excipients can be used to modify the rate at which particles dissolve in vivo, but relatively few excipients are approved for pulmonary administration and work has focused on using excipients that improve the stability of the drug and/or particles.
Nanoporous particles (NPPs) made from amorphous silica are being developed as a means of encapsulating drugs for pulmonary delivery. The size of the particles can be carefully controlled, as can the pore size of the particles. Feasibility experiments with a range of different drugs have shown that it is possible to incorporate (load) drug into the particles up to ~50% w/w. Given the ability to control both the size and the pore size of the particles, NPPs can be used to enhance the solubility of poorly soluble compounds and may offer the potential to control the release rate of drug to the lungs.
The aim of the present study was twofold: firstly, to investigate the effect of different particle sizes (with fixed pore size) on the dissolution profile of an encapsulated model drug, budesonide, and secondly, to investigate the effect of different pore size (with fixed particle size) on the dissolution profile of a highly insoluble novel drug candidate, CMPD-X.
Drug Delivery to the Lungs, Volume 32, 2021 – Irès van der Zwaan et al.
237
Method
Nanoporous particles (Spiro™, Nanologica AB, Sweden) with particle sizes 2.5, 3.5 and 5 µm, and with a pore size of 9 nm (denoted here as Particle A, B and C, respectively; see Table 1) were loaded with Budesonide, a water soluble drug. In addition, 2.2 µm particles were also synthesised with two smaller pore sizes of 7 and 2 nm (denoted here as Particle D and E, respectively) and loaded with CMPD-X, a poorly soluble drug. The particles are pure amorphous silica (SiO2) and are naturally hydrophilic. Particles A – C had a pore volume of 0.8 – 1.0 cm3/g. Particles D and E had a pore volume of 0.54 and 0.79 cm3/g, respectively. The drugs were loaded into NPPs using a proprietary method involving solubilisation of the drug in suitable solvent and incubating with the NPPs. The loading amount was around 20% wt/wt (determined by thermogravimetric analysis and HPLC).
Table 1: NPPs manufactured and loaded with different drugs studied.
A modified Andersen Cascade Impactor (mACI) was used to disperse the particles from a commercially available inhaler The particles were hand filled into the inhaler The modification of the impactor simply used 5 hollow stages after Stage 1 to achieve sedimentation of the particles on the filter stage.[2] A flow rate of 60 L/min, suction time of 0.3 sec and a sedimentation time of 20 min was used. S canning electron microscopy (SEM) imaging was performed to visualize the particles before and after deposition
The dissolution profiles of the drugs loaded in the different NPPs were compared to the dissolution of the free drugs The budesonide loaded particles were dispersed using the mACI The filters with the collected particles were placed in Transwell inserts. The dissolution experiments were conducted using simulated lung fluid (Gamble’s solution; pH 7.4[3]) over 180 min 200 µl samples were collected at set time points and replaced with fresh simulated lung fluid (SLF). After the final time point, methanol was added in order to determine the total available drug concentration (i.e. complete dissolution). All samples were analysed using ultra performance liquid chromatography (UPLC) coupled with UV/visible spectrophotometry (UPLC-UV) All experiments were performed in triplicate. To determine the relationship between the dissolution rate and the particle size, the d issolution profiles of the budesonide loaded particles were analysed using the Weibull distribution to determine the dissolution parameter T63, representing the time until 63% of the total amount of drug has been dissolved, which is comparable to the mean dissolution time [4,5] For the CMPD-X loaded particles, the dissolution profiles were measured over a time period of 180 min using a United States Pharmacopeia (USP) paddle apparatus 2 dissolution testing system. The dissolution media was PBS with 0.2 % Sodium Dodecyl Sulfate (SDS, surfactant). The paddle speed and bath temperature were 75 rpm and 37°C, respectively.
Results
SEM images were taken to visualize the particles before and after aerosolization (Fig. 1) NPPs are mechanically robust and remained unchanged in particle size after impactor dispersion. In contrast, the budesonide taken from the Pulmicort® Turbuhaler® formulation showed large sub-micron aggregates, which are fractionated into smaller aggregates after impactor treatment.
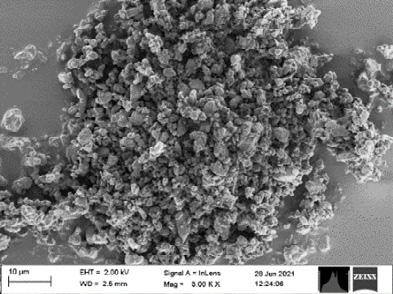
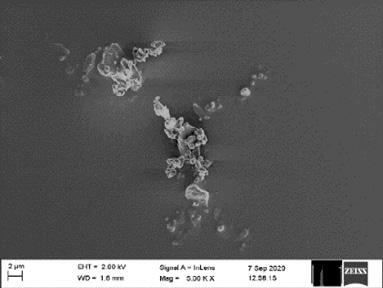
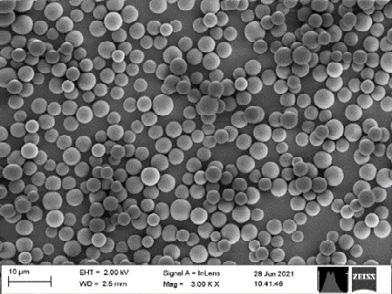
Drug Delivery to the Lungs, Volume 32, 2021 - Enabling Pulmonary Drug Delivery with Nanoporous Particles
Drug Substance Particle Size (µm) Pore Size (nm) Stage 1 Particle A Budesonide 2.5 9 Particle B 3.5 Particle C 5.0 Stage 2 Particle D CMPD-X 2.2 7 Particle E 2
238
Figure 1. SEM images of budesonide taken from Pulmicort® Turbuhaler® (a) before and (b) after aerosolization (c) NPP B (3.5 µm) loaded with budesonide
(c) (a) (b)
The dissolution profiles of budesonide loaded NPPs and free budesonide were measured in SLF, shown in Figure 2, using particles captured on the filter after aerosolization Encapsulation of budesonide in NPPs enhanced the dissolution kinetics compared to free budesonide taken from a Pulmicort® Turbuhaler®, whilst the dissolved amount after 180 minutes, was similar for each formulation reflecting the solubility of budesonide The solubility and release profile can be adjusted by using the NPPs, however the final solubility can remain similar over time. Improving the total dissolved fraction can be done using a different type of dissolution medium or decreasing the drug concentration. There was a systematic correlation between the NPPs size and the dissolution kinetic profile: the smaller the NPPs, the faster the dissolution profile of budesonide. The influence of NPP size and the dissolution rate can be clearly observed in Figure 3 which plots the T63, the time taken to dissolve 63% of the drug
Drug Delivery to the Lungs, Volume 32, 2021 – Irès van der Zwaan
al.
et
Figure 2 Dissolution profile of budesonide released from NPP A, B, C and free budesonide taken from a Pulmicort® Turbuhaler® after aerosolisazation, in simulated lung fluid
Figure 3. T63 values comparing the dissolution rate of encapsulated budesonide loaded into NPPs of different sizes
0 50 100 150 200 0.0 0.2 0 4 0.6 0.8 1 0 Time (min) F r a c t i o n d i s s o l v e d Particle
Particle
Particle
Bud (Turbuhaler) 2.0 2.5 3.0 3.5 4.0 4.5 5.0 5.5 0 50 100 150 200 250 300 Particle size (μm) T 6 3 ( m i n ) 239
Figure 4 shows the release profiles of CMPD-X loaded NPPs in PBS with 0.2% SDS compared with the free CMPD-X The solubility of CMPD-X is very low in PBS with 0.2% SDS and was significantly enhanced by encapsulation into NPPs. The release profile of CMPD-X from NPPs with a 7 nm pore size
A
B
C
(Particle D) shows a burst release, reaching almost 95% release in the first 20 min The NPPs with the 2 nm pores (Particle E) showed a significantly slower release profile compared to the 7 nm pore, but nonetheless facilitated a total dissolution release that was more than twice that measured for the free CMPD-X, reaching a dissolved amount of 75% after 180 min.
Discussion and Conclusion
The results demonstrated that the dissolution rate of budesonide was affected by the particle size of the NPPs used to encapsulate the drug, whereby reducing the particle size increased the rate of dissolution. This observation was made using a constant pore size of 9 nm. In addition the effect of pore size on release rate with a highly insoluble drug (CMPD-X) was investigated. The data showed that by reducing the pore diameter from 7 nm to 2 nm the release rate of the drug decreased However, it is notable that regardless of the pore size, encapsulating CMPD-X into NPPs significantly increased the amount of drug released into solution.
These results strongly indicate that the ability to control both particle size and the pore diameter of the NPPs could offer a significant formulation advantage for some drugs in development. Work is ongoing to demonstrate the safety of inhaled amorphous silica prior to taking selected encapsulated compounds into clinical development.
Acknowledgements
This study is part of the science program of the Swedish Drug Delivery Center (SweDeliver) and financial support from Vinnova (Dnr 2017-02690) is gratefully acknowledged. The authors would like to acknowledge Lucia Lazorova for her help with obtaining the SEM images.
References
1 Forbes, B., Asgharian, B., Dailey, L. A., Ferguson, D., Gerde, P., Gumbleton, M., Gustavsson, L., Hardy, C., Hassall, D., Jones, R., Lock, R., Maas, J., McGovern, T., Pitcairn, G. R., Somers, G. & Wolff, R. K. Challenges in inhaled product development and opportunities for open innovation. Adv. Drug Deliv. Rev. 63, 69–87 (2011).
2 Franek, F., Nilsson, L., Thörn, H., Fransson, R. & Tehler, U. Ranking in vitro dissolution of orally inhaled drug substance powders in a time-efficient manner. Drug Deliv. to Lungs (2018).
3 Marques, M. R. C., Loebenberg, R. & Almukainzi, M. Simulated biologic fluids with possible application in dissolution testing. Dissolution Technol. 15–28 (2011). doi:10.1002/jps.23029
4 Dokoumetzidis, A., Papadopoulou, V. & Macheras, P. Analysis of Dissolution data using modified versions of Noyes-Whitney equation and the Weibull function. Pharm. Res. 23, 256–261 (2006).
5 Langenbucher, F. Letters to the Editor: Linearization of dissolution rate curves by the Weibull distribution. J. Pharm. Pharmacol. 24, 979–981 (1972).
Drug Delivery to the Lungs, Volume 32, 2021 - Enabling Pulmonary Drug Delivery with Nanoporous Particles
Figure 4. Dissolution profile of free CMPD-X and loaded CMPD-X in NPP D (pore 7nm) and Particle E (pore 2nm), in PBs with 0.2% SDS.
0 50 100 150 200 0 50 100 Time (min) F r a c t i o n r e l e a s e d ( % ) Particle D Particle E CMPD-X 240
In vitro and in vivo evaluations of the tolerance of a new and innovative anti -tuberculosis drug combination by inhalation
Faustine Ravon1,2, Elena Menchi1, Myriam Remmelink3, Selma Chraibi1, Véronique Fontaine2 & Nathalie Wauthoz1
1Unit of Pharmaceutics and Biopharmaceutics, Faculty of Pharmacy, Université Libre de Bruxelles , Boulevard du Triomphe, Brussels, 1050, Belgium
2Unit of Microbiology, Bioorganic and Macromolecular Chemistry, Faculty of Pharmacy , Université Libre de Bruxelles, Boulevard du Triomphe, Brussels, 1050, Belgium
3Department of Pathology, Hôpital Erasme, Université Libre de Bruxelles, Route de Lennik 808, Brussels, 1070, Belgium
Summary
A drug combination, vancomycin (VAN) plus tetrahyd rolipstatin (THL), has demonstrated an effective synergistic action in vitro against Mycobacterium tuberculosis (Mtb), inhibiting the growth of the bacilli as well as its resistant forms. Given the poor oral bioavailability of VAN and THL, and the tropism of tuberculosis for lungs, this combination is more suitable for administration by inhalation. To evaluate the local tolerability of this combination, bronchial cells, alveolar cells, and monocytes were exposed to different concentrations around the combination ’s minimal inhibitory concentration (MIC) of the drugs (i.e., 10 g/mL for VAN and 1 g/mL for THL). The VAN-treated group never reached the half MIC (IC50), even at a concentration 80 times higher than the combination MIC. However, for THL-treated and VAN/THL-treated groups, the IC50 measured 30 to 50 times the combination MIC, due to the action of THL. It was demonstrated, using a lactate dehydrogenase assay, that this effect was related to a cytostatic and not a cytotoxic action. Subsequently, an in vivo experiment was performed at a concentration of 50 times the combination MIC, administered 3 times a week for 3 weeks on different groups of healthy mice, using an endotracheal device. Pro-inflammatory biomarkers (i.e., IL-1β, IL-6, and TNF-α) in bronchoalveolar lavage fluid remained insignificant vs. the negative control group, and lung histopathology did not show significant tissue damage. The VAN/THL combination at doses up to 50 times the combination MIC seems very well tolerated in vitro and in vivo; a promising result which encourages us to continue the development of an inhalation form of this combination to fight Mtb.
Key Message
The present work shows local tolerance of a potential anti-tuberculosis drug combination in vitro and in vivo To date, this represents the first tetrahydrolipstatin study with administration by inhalation that provides the absence of cytotoxic activity and leads to multiple possibilities of use
Introduction
Tuberculosis (TB) is a mycobacterial infection caused by the pathogen Mycobacterium tuberculosis (Mtb), and represents one of the top 10 causes of death in the world [1]. Current treatments use at least four antimicrobials for a long-term treatment (1-6 months), leading to potential poor t herapy adherence, also to antibiotic resistance and the emergence of multidrug-resistant TB and extensively drug-resistant TB [2] The need to develop a new treatment strategy to eradicate this bacterial disease could be addressed by combining different drugs to enhance treatment efficacy
The activity of vancomycin (VAN) and tetrahydrolipstatin (THL) alone and the VAN/THL combination have already been tested in vitro on Mycobacterium tuberculosis (Mtb) [3]. It was shown that the VAN alone has an inhibitory activity against 99 % of Mtb at a concentration of 250 g/mL. THL alone is active at 25 g/mL. Combined, the minimal inhibitory concentration (MIC) of the VAN was 10 g/mL and 1 g/mL for THL. This synergistic action of the combination was proved at a 10:1 ratio. This ratio was used in the following assays to test the lung tolerance of the drugs in vitro and in vivo. VAN, a large and rigid molecule, is a tricyclic glycopeptide antibiotic widely used to treat infection caused by gram -positive bacteria, inhibiting cell wall peptidoglycan synthesis. The absorption of this drug per os from the systemic compartment to the lungs is quite low [4]. THL is a derivative of lipstatin and acts as inhibitor of gastric and pancreatic lipases. It has been shown that its absorption from the intestine to the systemic compartment is extremely low [5] This poor permeability of VAN and THL to the lungs or to the systemic compartment does not allow this combination to be considered for the oral route.
Drug Delivery to the Lungs , Volume 32, 2021 – Faustine Ravon et al.
241
Drug Delivery to the Lungs , Volume 32, 2021 - In vitro and in vivo evaluations of the tolerance of a new and innovative anti-tuberculosis drug combination by inhalation
Inhalation of this combination could be a good alternative as Mtb is mainly located in the lungs. Local administration decreases systemic side effects and increases the drug concentration at the site of action. To date, inhaled VAN has proven its safety [6] but no safety data has been published on inhaled THL. The lungs tolerance evaluation must be processed for THL and for its combination with VAN.
The aim of this work was to demonstrate the good lung tolerance of the potential anti-tuberculosis combination VAN/THL at high concentrations under in vitro and in vivo conditions.
Experimental methods
3-(4,5-dimethylthiazol-2-yl)-2,5-diphenyltetrazolium bromide ( MTT) colorimetric assay
The cell proliferation of lung carcinoma (alveolar) A549 cells, adenocarcinoma (bronchial) Calu-3 cells and monocyte THP-1 cells, after exposure to THL, VAN, or VAN/THL, was determined using a n MTT colorimetric assay. Cells were seeded in a 96-well plate and treated with drug(s) at various concentrations (i.e., THL alone 0.125-78 µg/mL, VAN alone 0.4-625 µg/mL, or VAN/THL 2-1250 µg/mL for VAN and 0.2-125 µg/mL for THL) in 200 µL per well The plate was then incubated at 37 °C for 72 h. After the incubation time, 20 µL of MTT 0.5 mg/mL were added to each well. Plates were incubated for 4 h at 37 °C. Formazan crystals were washed and solubilized with dimethyl sulfoxide prior to analysis on a spectrophotometer (Synergy HT, Bio -Tek and KC4 software version 3.4, Bio-Tek) at 570 nm (reference wavelength 610 nm). The inhibitory concentration (IC 50) was then calculated, representing the concentration which inhibited 50% of the cell proliferation vs. the negative control group.
Lactate dehydrogenase (LDH) assay
Calu-3 cells were seeded on a 96-well plate and incubated for 24 h. After incubation, the medium was replaced by 200 µL of Hank’s balanced salt solution Following this, 20 µL of Triton X-100 were added to maximum release wells, and 20 µL of assay buffer were added to spontaneous release wells. The background was determined using wells containing only the medium. The remaining wells with cells were treated at different concentrations of VAN (100-2000 µg/mL), THL (10-200 µg/mL) or VAN/THL (100-1000 µg/mL for VAN and 10-100 µg/mL for THL) . The plate was incubated at 37 °C for 24 h. The LDH cytotoxicity assay was then used following the kit standard procedure (LDH Cytotoxicity Assay kit, Cayman Chemicals, USA) The plate was centrifuged and 100 µL of cell supernatant were transferred to a new 96-well plate. Each well received 100 µL of reaction solution and the plate was then incubated at 37 °C, with gentle shaking on an orbital shaker for 30 min in the dark (KS 4000 I control, Ika). The absorbance was measured at 490 nm (A490) and the percentage of cytotoxicity was then calculated using the formula:
% cytotoxicity =
In vivo lung tolerance evaluation
�������������������� ����490) (�������������������������������������������� ���������������������������� ����490) (���������������������������� ���������������������������� ����490) (�������������������������������������������� ���������������������������� ����490) ] ∗ 100
Eight to 10-week-old BALB/cAnNRj mice (approximately 19.5-24.5 g) purchased from Janvier Labs (Le Genest-Saint-Isle, France) were used in this study in accordance with EU Dire ctive 2010/63/EU for animal experiments, under ethical protocol 727N Three groups of 16 mice (8 males and 8 females) were administered either THL alone, VAN alone or VAN/THL 3 times a week for 3 consecutive weeks in the following quantities: 1 mg/kg for the THL-treated group; 10 mg/kg for the VAN-treated group; 1 mg/kg for THL and 10 mg/kg for VAN for the VAN/THL-treated group. These groups were compared to the negative control group (n = 16, 8 males and 8 females), which received only the liquid vehicle used to solubilize drugs (25% propylene glycol + 75% phosphate buffer 0.02 M, pH 5.0) The positive control group (n = 8, 4 males and 4 females) was exposed to a solution of 1 g lipopolysaccharide (LPS) from E. coli. Isoflurane anaesthesia (2-4%) in oxygen (2%) was administered to allow a direct endotracheal administration of 50 µL of the solution using a model IA-1C Microsprayer connected to an FMJ-250high-pressure syringe (Formerly: Penn-Century, Wyndmoor, PA, USA). Mice from all groups were euthanized using pentobarbital (10 mg/kg in intra -peritoneal) 24 h, or 18 h for the LPS positive control group, after the last administration. The trachea was cannulated, and the lungs were flushed with phosphate buffered saline solution to collect the bronchial -alveolar liquid fluid (BALF) . Investigations of inflammation in BALF were conducted to evaluate the local tolerance. Quantification of selected proinflammatory biomarkers (IL-1, IL-6, and TNF-) was done by the ELISA method as described by the manufacturer (DuoSet, RnD Systems, Abingon, UK). Lungs were also collected, embedded in paraffin wax, and stained with haematoxylin and eosinophil. The investigation of lung damage was conducted
[(������������������������������������������������
242
by an independent pathologist analysing the frequency of each observation (intra-alveolar haemorrhage, pneumocyte hyperplasia, tissue inflammation, and bronchiolar epithelial vacuolation) and was calculated as the number of animals for whom the observation occurred.
Results and discussion
The aim of the in vitro part was to assess the impact of THL, VAN and the VAN/THL combination on lung cell viability and cytotoxicity for the range of drug concentrations at which the molecules inhibited the proliferation of Mtb to 99%.
Cells were exposed to different concentrations of drugs (i.e., VAN from -25 to 62 5 times the combination MIC, THL from -8 to 78 times the MIC, or VAN/THL from -5 to 125 times the combination MIC) Cell proliferation was not affected by the presence of VAN, even at the highest dose tested (see Figure 1.A) VAN never reached the IC50 at the tested concentrations, showing a good tolerance, with low toxicity for alveolar and bronchial cells and monocytes. However, THL (Figure 1.B) and VAN/THL (Figure 1.C) presented a dose-dependent effect For THL-treated cells, the IC50 mean values ± SD for each strain was calculated: A549 cells : IC50 = 48 ± 16 µg/mL; Calu-3 cells: IC50 = 30 ± 13 µg/mL; THP-1 cells: IC50 = 54 ± 8 µg/mL. For VAN/THL-treated cells, the values for each strain were: A549 cells: IC50 = 45 ± 8 µg/mL; Calu-3 cells: IC50 = 34 ± 2 µg/mL; THP-1 cells: IC50 = 48 ± 6 µg/mL. The IC50 was therefore reached for THL and VAN/THL at concentrations 30-55 times the combination THL MIC
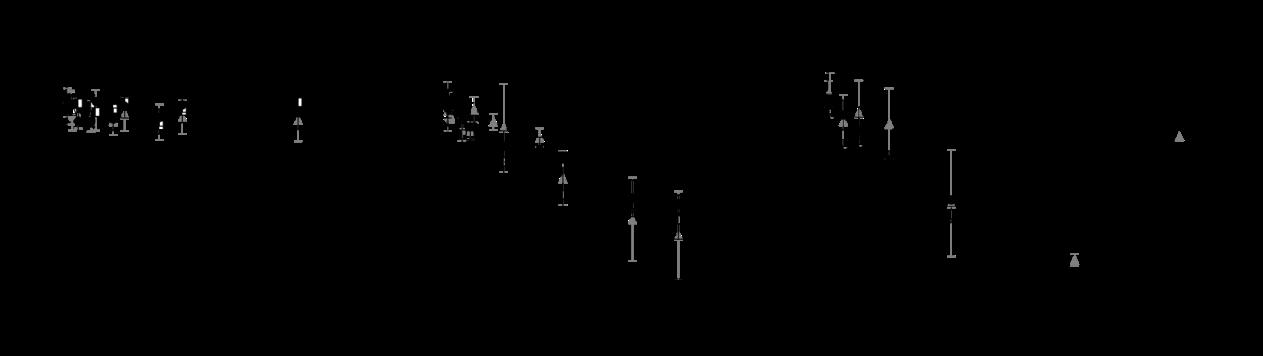
to the negative control group) depending on the concentration of VAN (A), THL (B), or the
of VAN and THL (C) in µg/mL. All results are expressed as means of three wells per condition ±
3).
After 24 h of Calu-3 cell exposure to different treatments (i.e., THL, VAN or VAN/THL) at different concentrations (i.e., 10-200 times the combination MIC for THL and VAN alone and 10-100 times the combination MIC for VAN/THL), cell cytotoxicity was determined by quantifying the LDH release. The cytotoxicity rate of the treated cells was around the baseline of the negative control (spontaneous LDH release) after 24 hours. No cytotoxicity was found in the VAN-treated cells (from -5 ± 6% at 10 times the combination MIC to -5 ± 2% at 200 times the combination MIC). As THL did not present any cytotoxicity in the LDH assay (from -9 ± 0% at 10 times the combination MIC to -1 ± 6% at 200 times the combination MIC), it was concluded that the effect observed in the MTT assay was caused by a cytostatic effect rather than a cytotoxic effect The combination also did not cause a cytotoxic effect at the tested concentrations (from -8 ± 1% at 10 times the combination MIC to -7 ± 2% at 100 times the combination MIC)
An in vivo experiment was performed to evaluate the local tolerance of the maximum dose tolerated in vitro (i.e., 50 times the combination MIC) in subacute exposure to each drug and their combination.
During the study, no significant weight loss was observed in the treated groups vs. the negative control group and no mouse reached the limit points defined by t he scoring (i.e., normal respiratory function and behaviour) Quantification of the pro-inflammatory biomarkers (i.e., IL-1β, IL-6 and TNF-α) was evaluated in BALF (see Figure 2). As expected, the LPS positive control group showed a significant increase in IL-1β, IL-6 and TNF-α Within the treated groups (i.e., THL, VAN and VAN/THL), no significant increase was observed vs. the negative control group for all biomarkers IL-1β, IL-6 and TNFα
Drug Delivery to the Lungs , Volume 32, 2021 – Faustine Ravon et al.
Figure 1 - Dose-response curve of cell proliferation (in % in comparison
combination
standard deviation (n =
243

BALF
h
LPS
All results are expressed as means ± SD (n = 8 -14). A statistical analysis was performed between the treated groups and the negative control group using one-way ANOVA and Bonferroni’s post-hoc test for both sexes (*** for p < 0.001, ** for p < 0.01, and * for p < 0.05).
Moreover, no major lung damage was observed by pathologic examination for the treated groups (i.e., THL, VAN, and VAN/THL) vs. the negative control group However, intra-alveolar haemorrhage was reported for all groups. As it also occurred in the negative control group, this damage could have been caused by the blood collection technique, and therefore not related to real tissue damage, as already reported [7]. Other phenomena were observed only in the LPS positive control group, such as pneumocyte hyperplasia displayed for 50% of mice, tissue inflammation for 12.5% of mice, an d bronchiolar epithelial vacuolation for 37.5% of mice. VAN, THL and the VAN/THL combination did not induce any inflammation and were well-tolerated in the mouse model.
Conclusion
The potential cytostatic action of THL on cells at high doses in vitro was established. This study demonstrated for the first time that THL, associated with VAN at a 10:1 ratio, was not toxic in pulmonary cells in vitro or in vivo in mice during a subacute exposition. As this combination was well-tolerated, further works will be considered for inhalation drug delivery Future studies will assess the efficacy of formulated combinations on a murine TB model.
References
[1] World Health Organization: Tuberculosis, https://www.who.int/health-topics/tuberculosis#tab=tab_1 (accessed 23 June 2021)
[2] Tan Z M, Lai G P, Pandey M, Srichana T, Pichika M R, Gorain B, Bhattamishra S K, Choudhury H: Novel approaches for the treatment of pulmonary tuberculosis , Pharmaceutics 2020; 12(12): pp1–54.
[3] Rens C, Laval F, Daffé M, Denis O, Frita R, Baulard A, Wattiez R, Lefèvre P, Fontaine V: Effects of lipid-lowering drugs on vancomycin susceptibility of mycobacteria , Antimicrob Agents Chemother 2016; 60(10): pp6193–6199.
[4] Cruciani M, Gatti G, Lazzarini L, Furlan G, Broccali G, Malena M, Franchini C, Concia E: Penetration of vancomycin into human lung tissue, Journal of Antimicrobial Chemotherapy 1996; 38: pp865-869.
[5] Zhi J, Melia A T, Funk C, Viger-Chougnet A, Hopfgartner G, Lausecker B, Wang K, Fulton J S, Gabriel L, Mulligan T E: Metabolic profiles of minimally absorbed orlistat in obese/overweight volunteers , J Clin Pharmacol 1996; 36(11): pp1006–1011.
[6] Waterer G, Lord J, Hofmann T, Jouhik ainen T: Phase I, dose-escalating study of the safety and pharmacokinetics of inhaled dry-powder vancomycin (AeroV anc) in volunteers and patients with cystic fibrosis: A New Approach to Therapy for Methicillin-Resistant Staphylococcus aureus, Antimicrob Agents Chemother 2020; 64(3): e01776-19
[7] Chraibi S, Rosière R, De Prez E, Gérard P, Antoine M H, Langer I, Nortier J, Remmelink M, Amighi K, Wauthoz N: Preclinical tolerance evaluation of the addition of a cisplatin -based dry powder for inhalation to the conventional carboplatin-paclitaxel doublet for treatment of non-small cell lung cancer, Biomed Pharmacother 2021; 139: 111716.
Drug Delivery to the Lungs , Volume 32, 2021 - In vitro and in vivo evaluations of the tolerance of a new and innovative anti-tuberculosis drug combination by inhalation
Figure 2 - Mouse pro-inflammatory biomarkers IL-1β (A), IL-6 (B), and TNF-α (C) concentrations (pg/mL) in the
24 h post-administration for the negative control, THL-treated, VAN-treated, or VAN/THL-treated groups and 18
postadministration for the
positive control group.
244
Transport of Local Anaesthetic Lidocaine across a Pharyngeal Air-Liquid Interface Cell Model
Zara Sheikh1, Antonella Granata1, Dina Silva1, Paul Young1,3, Hui Xin Ong1,2, Daniela Traini1,21Woolcock Institute of Medical Research, 431 Glebe Point Road, Glebe NSW 2037, Australia
2Department of Biomedical Sciences, Faculty of Medicine, Health and Human Sciences, Macquarie University, NSW 2109, Australia 3Macquarie Business School, Macquarie University, NSW 2109, Australia
Summary
An in vitro air-liquid interface model (ALI) of human respiratory epithelial cell lines is an invaluable tool that phenotypically mimics the in vivo airway epithelium and is extensively used to study drug transport and predict therapeutic efficacy. Although several studies have utilized the human pharyngeal cell line Detroit 562 under ALI conditions, no studies have yet been performed to optimise the ALI culture conditions and determine whether the ALI model could be used to study drug transport. Therefore, this study aims to determine the appropriate in vitro ALI culture method required to establish the epithelial barrier properties of the Detroit 562 cell line and investigate drug transport of a local anaesthetic throat spray, Lidocaine In summary, the present study indicated the suitability of the Detroit 562 cell line at a seeding density of 1.8 × 10⁵ cells/cm2 as a representative in vitro ALI cellular model to study drug transport on day 18 of the ALI culture period. Further investigations are required to characterize this cellular model by immunostaining with markers of tight junction proteins and determine differentiating features such as mucus production and response to an inflammatory stimulus.
Key Message
An in vitro air-liquid interface (ALI) model of the pharyngeal cell line Detroit 562 attains epithelial barrier integrity after 18 days in ALI culture, at an optimum seeding density of 1.8 × 10⁵ cells/cm2. This model could be used to study drug transport mechanisms and predict the therapeutic efficacy of oropharyngeal deposition of drugs and toxins
Introduction
The airway epithelium lining the respiratory tract is a continuous cellular layer of different cell types, starting from the nasopharynx to the alveoli that form a protective barrier b etween the inhaled air and the underlying mucosal tissue. Drugs and toxins have to cross this barrier to reach their target site and elicit a therapeutic or noxious effect [1] In vitro air-liquid interface (ALI) of human respiratory epithelial cell lines are an invaluable tool that phenotypically mimics the in vivo airway epithelium and is extensively used to study drug transport and evaluate the fate of inhaled drugs and toxins They also can predict immune responses and therapeutic efficacy owing to their ease of culture, genetic homogeneity, and greater reproducibility [2, 3]. These in vitro ALI models are established when cells are seeded on the apical side of a semi -permeable support membrane, allowing nutrients from the basal media to pass through the membrane enabling cell growth and differentiation on the apical, air-exposed surface [4].
The ability of the cells to form polarised layers of confluent cells and consequently the ‘tightness’ of the epithelium is one of the key parameters that determine the suitability of an in vitro cell model to be used for drug transport and other biopharmac eutical studies [5] Polarized epithelial cells are connected via junctional complexes comprising of tight junctions and adheren junctions that permits the movement of ions and small molecules known as paracellular transport [1]. Several studies have utilized the human pharyngeal cell line Detroit 562 under ALI and in liquid covered cultures to investigate immune responses to bacterial colonisation and innate signalling and regulatory pathways [6-8]. However, to date, no studies have been performed to systematically characterise and optimise the ALI culture condition (seeding density and culture time) of the Detroit 562 cell line and further determine whether these ALI models could be used to study drug transport. Lidocaine, a local anaesthetic that is used prior to any surgical intervention, is commercially available as a throat spray. As the Detroit 562 cell line represents the pharynx, these cells could be utilized to investigate the deposition of lidocaine in the oropharyngeal region to understand its therapeutic activity Therefore, the study aims to determine the appropriate culture method required to develop tight junctions and establish the epithelial barrier properties of the in vitro ALI model of the Detroit 562 cell line to investigate drug transport of the local anaesthetic lidocaine
Drug Delivery to the Lungs, Volume 32 , 2021 – Zara Sheikh et al.
245
Experimental Methods
Materials
Lidocaine base, sodium fluorescein (flu-Na), Hanks’ Balanced Salt Solution (HBSS) were purchased from Sigma Aldrich (Sydney, Australia). Detroit 562 (Immortalised Epithelial Human Pharyngeal cellscarcinoma derived) were purchased from the American Type Culture Collection ( Manassas, VA, USA). All cell culture reagents including Dulbecco’s modified eagle’s medium (DMEM), Minimum Essential Medium Eagle (MEM), phosphate-buffered saline (PBS), foetal bovine serum (FBS), trypsin -EDTA solution (2.5g /L trypsin, 0.5g/l EDTA), L-glutamine solution, non-essential amino acids were obtained from Invitrogen (Sydney, NSW, Australia). Transwell cell culture inserts (0.33 cm2, polyester terephthalate membrane, 0.4 µm pore size was purchased from Corning Costar (New York, NY, USA)
Air-Liquid Interface (ALI) culture of Detroit 562 cells
To establish an in vitro ALI model of Detroit 562 cells, transwell cell culture inserts were used as previously described [6] To determine the appropriate seeding density for Det roit 562 cell line, three different seeding densities were chosen: 30,000 cells/well (c/w) (0.9 × 10⁵ cells/cm2), 60,000 c/w (1.8 × 10⁵ cells/cm2) and 80,000 c/w (2.4 × 10⁵ cells/cm2) in between passages 51-57. Briefly, Detroit 562 cells were seeded within the apical chamber in MEM media supplemented with 10% v/v FBS and the same media was added to the basolateral chamber. The cells were incubated at 37 °C with 5% CO2 for 24 hours (h) until confluency was achieved. To initiate ALI conditions, media in the apical chamber was removed after 24 hours indicating Day 0 and the cells were maintained under ALI conditions for 21 days. Differentiation media in the basolateral chamber was replaced every 2 days. All experiments were performed on Day 7, 14, 18 and 21 post ALI induction.
Transepithelial Electrical Resistance and Sodium Fluorescein Permeability Assay
Tight junction functionality and paracellular permeability of Detroit 562 ALI cultures were determined using transepithelial electrical resistance (TEER ) measurements and the sodium fluorescein (flu-Na) permeability assay as described previously [4, 9]. For TEER measurements, pre-warmed media was added to the apical chamber and allowed to equilibrate for 30 mins at 37 °C under 5% CO2. TEER was measured using EVOM2® epithelial voltohmmeter ( Sarasota, FL, USA) attached to STX-2 chopstick electrodes for the ALI cultures, corrected by subtracting the blank inserts, and multiplied by the area of the Transwell inserts (0.33 cm2) and six measurements were taken per transwell Sodium fluorescein (2.5 mg/mL) was added to the apical chamber and pre -warmed HBSS was added to the basolateral chamber. To measure the rate of sodium fluorescein transport (flux) from the apical chamber to the basolateral chamber, ALI cultures were incubated for 4 h at 37 °C with 5% CO2, with basolateral samples collected every 30 min for the first 2 h and then every hour for the final 2 h. For analysis, the collected basolateral samples were diluted (1:20 v/v) and fluorescence was measured using the SpectraMax M2 plate reader (excitation: 485 nm; emission: 538 nm). The permeation coefficient (Papp) was calculated according to Eq. (1).
���������������� = �������� �������� ����0 ���� - Eq (1)
Where, dQ/dT represents the flux of sodium fluorescein (µg/s) acr oss the membrane, C0 is the initial donor concentration (µg/mL ), and A is the surface area (cm2).
Transport of Lidocaine across Detroit 562 ALI culture
Lidocaine transport across the Detroit 562 ALI cultures was conducted on Day 18 post ALI formation Lidocaine was dissolved in ethanol to produce the stock solution and then further diluted in HBSS to make 20 µg/mL Lidocaine (0.1% v/v ethanol in final Lidocaine solution) to be used for the transport study. Lidocaine solution was added to the apical chamber and HBSS was added to the basolateral chamber. Samples (100 µL) were taken from the basolateral chamber every 30 min for the first 2 h and then every hour for the final 2 h, with samples being replaced by fresh, warm HBSS. After the 4 h assay, the apical chamber was washed twice with HBSS to collect any residual drug using a pipette (denoted as On) and the cell layer was then scraped from the insert membrane and lysed using CelLytic ™ buffer (Invitrogen) to quantify the amount of drug inside the cells (denoted as Cellular) TEER measurements were performed before and after the transport study to check whether drug deposition altered the epithelial barrier integrity of Detroit 562 ALI culture models. All the samples were subsequently analysed
Drug Delivery to the Lungs, Volume 32, 2021 - Transport of Local Anaesthetic Lidocaine across a Pharyngeal AirLiquid Interface Cell Model
246
using a High-Performance Liquid Chromatography (HPLC) system equipped with SPD -20A UV–Vis detector, an LC-20AT liquid chromatograph, a SIL-20A HT autosampler (Shimadzu) and a Phenomenex Kinetex C-18 column (250 × 4.6 mm, 5 µm), (Torrance, California, USA), according to a validated method [10] The mobile phase was a mixture of acetonitrile: phosphate buffer (26:74 (v/v) with pH 5.5 adjusted using sodium hydroxide (Sigma Aldrich). Samples were analysed at 230 nm at a flow rate of 1.0 mL/minute and an injection volume of 10 µL. Linearity was obtained between 0.2 and 100 µg/mL (R 2 = 0.99) with a retention time of 8 min.
Statistical analysis
All results are expressed as mean ± standard error of the mean (SEM) of at least three biological replicates. Statistical software, GraphPad Prism (version 8.2.1) was used to test for significance using One-Way or Two-Way ANOVA for each experiment. Significance was determined as p < 0.05.
Results
Paracellular permeability decrease s at Day 18 of the ALI culture period
To predict the time for functional tight junctions to form at the ALI for Detroit 562 cell line and determine the optimum seeding density, TEER measurements and permeability of the known paracellular marker flu-Na were tested at days 7, 14, 18 and 21 of the ALI culture period. TEER values significantly increased from Day 7 to 18 with no significant changes in TEER values between Day 18 and 21 for all the 3 densities, thus indicating progressive tight junction formation till Day 18 of ALI culture period (Figure 1A). Correspondingly, a significant decrease in apparent permeability (Papp) of flu-Na was observed at Day 18 compared to Day 7 and 14 for 60,000 c/w and 80,000 c/w ALI models , but not for 30,000 c/w (Figure 1B), suggesting that the cell layers have developed functional tight junctions in ALI culture at Day 18 for those two seeding densities Therefore, the two densities 60,000 c/w and 80,000 c/w are termed as Low and High density, respectively, for the subsequent experiments.
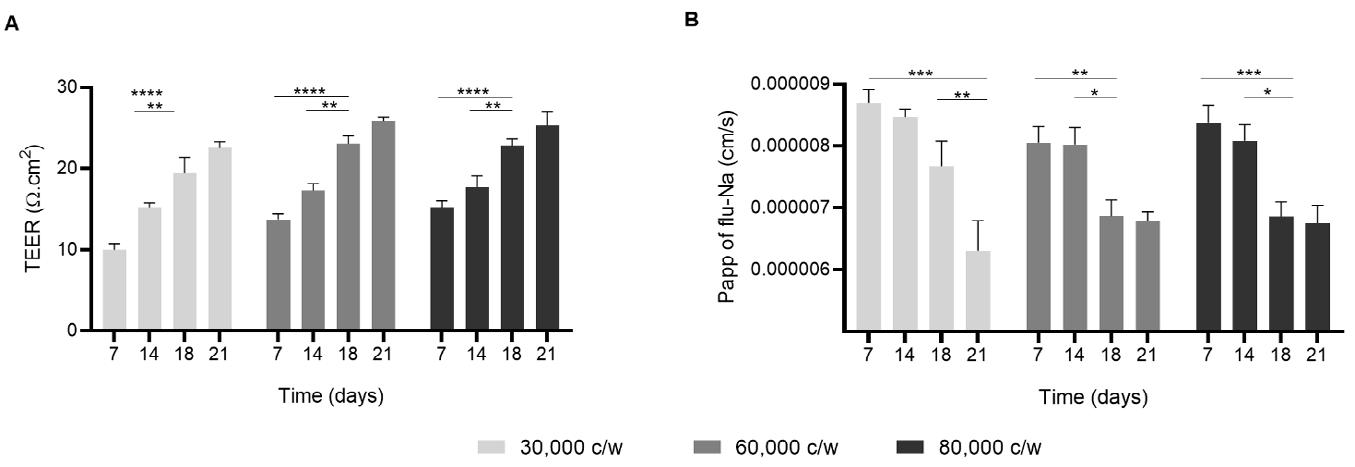
ANOVA
3,
Tukey's post-test).
al.
Drug Delivery to the Lungs, Volume 32 , 2021 – Zara Sheikh et
247
Figure 1. Air-liquid interface (ALI) culture model of Detroit 562 cell line over a culture period of 21 days. A. Transepithelial electrical resistance measurements (TEER) and B. Apparent permeability (Papp) of sodium fluorescein (flu-Na) across Detroit 562 ALI cultures at Day 7, 14 , 18 and 21 of ALI culture period (n =
mean ± SEM) * p < 0.05, ** p < 0.01, *** p < 0.001 **** p < 0.0001 (using two-way
with
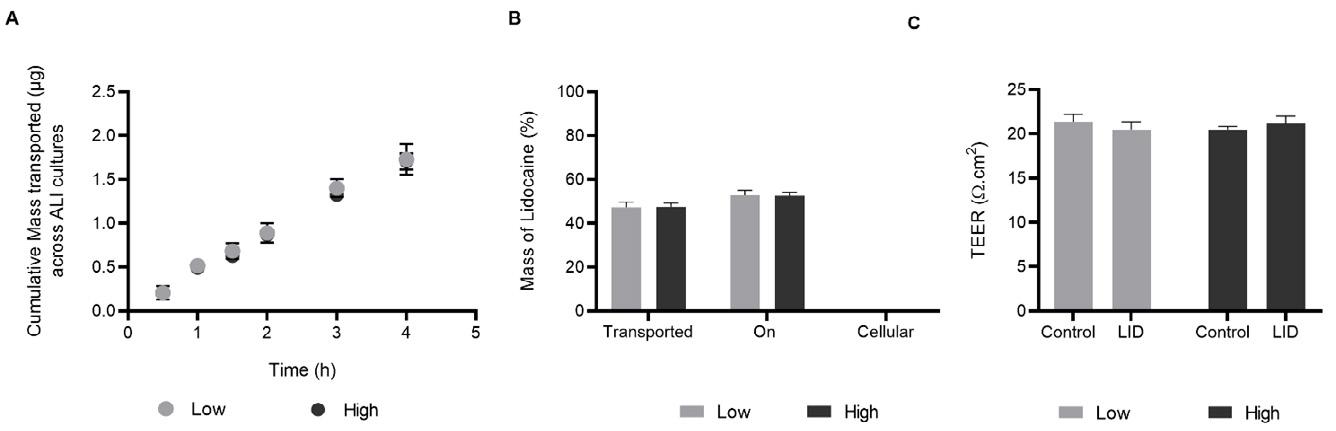
on Day 18 of ALI culture period A Cumulative
(grey circles) and High density (black circles) cells of Detroit 562 ALI models B Percentage of the total mass of lidocaine transported across the ALI cultures (shown as Transported), remaining on the apical layers (On) and inside the cells (Cellular) in Low (grey bars) and High density (black bars) cells at the end of the experiment (4 h). C TEER measurements of ALI cultures before drug deposition (control) and after 4 h of Lidocaine transport (shown as LID) (n = 3, mean ± SEM, using two-way ANOVA with Tukey's post-test).
Paracellular route – a possible pathway for transport of Lidocaine across Detroit 562 ALI models
A transport study was conducted to determine if the developed ALI models of Detroit 562 cells could be used to study drug transport, using Lidocaine as a mode l drug on Day 18 post ALI. The cumulative mass of lidocaine transported increased with time for both Low and High density with no significant differences between the two densities (Figure 2A). Of note, no drug was found inside the cells (shown as Cellular, Figure 2B) for both the densities, suggesting paracellular transport of Lidocaine. Similar TEER values were observed before and after the experiment (Figure 2C) showing that drug deposition did not alter the epithelial barrier integrity of the ALI models.
Discussion
Seeding density is a key factor that influences the formation of tight junctions and higher densities may negatively impact the transport of certain drugs [11]. Therefore, 3 seeding densities were chosen for this study to optimise the culture conditions of ALI models for the Detroit 562 cell line prior to investigating these models for transport studies No significant decrease in paracellular permeability (Papp) was observed for 30,000 c/w over the 18 day ALI culture period until Day 21, suggesting that the Detroit 562 cells required a longer time to form tight junctions at this seeding density compared to the other two ALI models with 60,000 c/w and 80,000 c/w. Both the ALI models with 60,000 c/w and 80,000 c/w demonstrated a significant decrease in paracellular permeability on Day 18 of ALI compared to Day 7 and 14 and plateaued after Day 18, indicating the f ormation of tight junctions and epithelial barrier integrity at Day 18 of ALI culture period. As TEER values, paracellular permeability and total mass of lidocaine transported across the ALI cultures were found to be similar between 60,000 c/w and 80,000 c/w ALI models with no significant differences between the 2 seeding densities, therefore it can be deduced that 60,000 c/w is the optimum seeding density for cu lturing Detroit 562 ALI models. At the end of the transport study, no lidocaine was found inside the cells, suggesting that lidocaine may have been transported predominantly through the paracellular route Overall, the results suggest that a culture period of 18 days is required for Detroit 562 ALI models to completely differentiate and attain epithe lial barrier integrity and these in vitro ALI models can be used to study the deposition and transport of aerosol formulations targeted for the oropharyngeal region.
Conclusion
In summary, the present study indicated the suitability of the Detroit 562 cell line at a seeding density of 60,000 cells/ well (1.8 × 10⁵ cells/cm2) as a representative in vitro air-liquid interface cellular model to study drug transport on Day 18 of the ALI culture period . Further investigations are required to characterize these cellular models by immunostaining with markers of tight junction proteins and determine differentiating features such as mucus production and response to inflammatory stimuli.
Drug Delivery to the Lungs, Volume 32, 2021 - Transport of Local Anaesthetic Lidocaine across a Pharyngeal AirLiquid Interface Cell Model
Figure 2. Transport of lidocaine across ALI models of Detroit 562 cells
mass of Lidocaine transported over 4 h period at Low density
248
References
[1] S. Hasan, P. Sebo, R. Osicka: A guide to polarized airway epithelial models for studies of host –pathogen interactions, The FEBS Journal 2018; 285: pp 4343-4358.
[2] B. Forbes, C. Ehrhardt: Human respiratory epithelial cell culture for drug d elivery applications, Eur J Pharm. Biopharm 2005; 60: pp 193-205.
[3] A.A. Pezzulo, T.D. Starner, T.E. Scheetz, G.L. Traver, A.E. Tilley, B. -G. Harvey, R.G. Crystal, J. Paul B. McCray, J. Zabner: The air-liquid interface and use of primary cell cultures are important to recapitulate the transcriptional profile of in vivo airway epithelia , Am J Physiol-Lung C 2011; 300: pp L25-L31.
[4] Z. Sheikh, P. Bradbury, M. Pozzoli, P.M. Young, H.X. Ong, D. Traini: An in vitro model for assessing drug transport in cystic fibrosis treatment: Characterisation o f the CuFi-1 cell line, Eur J Pharm Biopharm 2020; 156: pp 121-130.
[5] M.A. Selo, J.A. Sake, K.-J. Kim, C. Ehrhardt: In vitro and ex vivo models in inhalati on biopharmaceutical research advances, challenges and future perspectives , Adv Drug Deliv Rev 2021; 113862.
[6] C.M. Weight, C. Venturini, S. Pojar, S.P. Jochems, J. Reiné, E. Nikolaou, C. Solórzano, M. Noursadeghi, J.S. Brown, D.M. Ferreira, R.S. Heyderman: Microinvasion by Streptococcus pneumoniae induces epithelial innate immunity during colonisation at the human mucosal surface , Nat. Commun 2019; 10: 3060.
[7] P.A. Ryan, V. Pancholi, V.A. Fischetti: Group A streptococci bind to mucin and human phar yngeal cells through sialic acid-containing receptors , Infect Immun 2001; 69: pp 7402-7412.
[8] L. Tengroth, C.R. Millrud, A.M. Kvarnhammar, S. Kumlien Georén, L. Latif, L.-O. Cardell: Functional effects of Toll-like receptor (TLR)3, 7, 9, RIG-I and MDA-5 stimulation in nasal epithelial cells , PLoS One 2014; 9: e98239e98239.
[9] H.X. Ong, C.L. Jackson, J.L. Cole, P.M. Lackie, D. Traini, P.M. Young, J. Lucas, J. Conway: Primary Air–Liquid Interface Culture of Nasal Epithelium for Nasal Drug Delivery , Mol. Pharm 2016; 13: pp 2242-2252.
[10] P. Bhusal, M. Sharma, J. Harrison, G. Procter, G. Andrews, D.S . Jones, A.G. Hill, D. Svirskis: Development, Validation and Application of a Stability Indicating HPLC Method to Quantify Lidocaine from Polyethylene -co-Vinyl Acetate (EVA) Matrices and Biological Fluids , J Chromatogr Sci 2017; 55: pp 832-838.
[11] G.C. Williams, G.T. Knipp, P.J. Sinko: The effect of cell culture conditions on saquinavir transport through, and interactions with, MDCKII cells overexpress ing hMDR1, J. Pharm. Sci 2003; 92: pp 1957-1967.
Drug Delivery to the Lungs, Volume 32 , 2021 – Zara Sheikh et al.
249
250
Formulation Development of Inhalable Dacomitinib Polymeric Nanoparticles for Non-Small Cell Lung Cancer Treatment
Druvasarika Barji, Suyash M. Patil, Nitesh K. KundaDepartment of Pharmaceutical Sciences, College of Pharmacy and Health Sciences, St. John's University, Jamaica, NY 11439, USA
Summary
Pulmonary delivery of cancer therapeutics has a huge untapped potential for the treatment of lung cancer Inhalable polymeric nanoparticles are an attractive strategy as they provide localized delivery of drug with minimal systemic adverse effects In this study, Dacomitinib (DMB) , a second-generation tyrosine kinase inhibitor (TKI) used in the treatment EGFR (epidermal growth factor receptor) mutant non-small cell lung cancer (NSCLC),was developed as an inhalable polymeric nanoparticle formulation Dacomitinib has been successfully encapsulated into nanoparticles (NPs)s resulting in a size of 202 ± 32.5 nm with a PDI of 0.183 ± 0.061, and zetapotential of −19.39 ± 2.50 mV. The NP s exhibited an entrapment efficiency of 55.06 ± 6.3% and a drug loading of 27 ± 0.01%. With respect to in vitro drug release, the DMB-NPs showed sustained drug release with cumulative release of 39.2 ± 7.5% over 5 days. Moreover, DMB-NPs demonstrated efficient lung deposition with mass median aerodynamic diameter of 3.77 ± 0.17 μm and fine particle fraction of 80.86 ± 1 02%
Key Message
This study reported the formulation development of polymeric dacomitinib nanoparticles for NSCLC treatment with optimum particle characteristics and excellent in vitro aerosol performance
Introduction
Lung cancer is the leading cause of cancer related deaths worldwide. Standard treatment s such as conventional chemotherapy and radiation are seriously limited by their non -specificity and severe adverse effects. Recent studies have focused on molecular profiling to identify molecular pathways for improving target specificity in cancer treatment. Among various mutations, Epidermal Growth Factor Receptor (EGFR) mutation accounts for 85% of all lung cancer driver mutations and between 10 -28% in Non-Small Cell Lung Cancer (NSCLC) sub-type (1). Therefore, EGFR mutation has become a key drug target in NSCLC therapy. Tyrosine kinase inhibitors (TKI) are small molecules that suppress tumor growth by reversible or irreversible binding to EGFR. However, a major challenge with TKI inhibitors is the emergence of drug resistance. Dacomitinib is a second generation, irreversible EGFR -TKI approved for the treatment of NSCLC bearing EGFR “exon 19 deletion” or “exon 21 L858R” substitution mutations
It is given as first line treatment for NSCLC patients res istant to first generation TKIs (2). Currently dacomitinib is marketed as VIZIMPRO ® and administered as an oral tablet , this can result in severe systemic side-effects and low drug levels in the lungs (i.e., the primary tumor site) Therefore, effective drug delivery strategies are required to facilitate improved drug concentration in tumor tissue
Pulmonary delivery of cancer therapeutics provides increased drug levels in the lungs with minimal systemic side effects. It also as allows for lower doses, reduced dosing frequency , and overcomes first pass metabolism. Moreover, dacomitinib is characterized by poor water solubility limiting its bioavailability when administered directly into lungs. Hence, development of inhalable polymeric nanoparticle system can be a promising option. Encapsulation of drug into nanoparticles offers distinct advantages such as improved solubility, high drug loading, biocompatibility, and sustained release. The nanoparticles have high stability upon nebulization and facilitate increased penetration into tumor tissue. In this study, we have developed dacomitinib loaded poly -(lactic-co-glycolic-acid) nanoparticles (PLGA NPs) that deliver dacomitinib directly into lungs for NSCLC treatment. Further, we hypothesize that this NP delivery of dacomitinib will improve therapeutic efficacy and lower the systemic side effects.
Experimental methods
Method of preparation of DMB Loaded PLGA Nanoparticles: Dacomitinib NPs (DMB NPs) were prepared by a single emulsion solvent evaporation technique . Briefly, 50 mg of PLGA (Resomer RG 502H acid terminated, Sigma Aldrich, St Louis, MO, USA) and 2.5 mg of DMB (LC Labs, Woburn, MA) were dissolved in 2 mL dichloromethane to prepare the primary organic phase. Th e organic phase was
Drug Delivery to the Lungs , Volume 32, 2021 - Druvasarika Barji et.al
251
Drug Delivery to the Lun gs,Formulation Development of Inhalable Dacomitinib Polymeric Nanoparticles for NonSmall Cell Lung Cancer Treatment
then added to 10 mL of 1% w/v polyvinyl alcohol (PVA, Fisher Scientific) solution under probe sonication for 2 min at 40% amplitude to form a uniform primary emulsion. The obtained nanoparticle suspension is subjected to stirring at 500 rpm for 3 hours to remove the solvent and harden the NPs Further, the colloidal nanosuspension was centrifuged at 4 ˚C with 21191 g force for 30 minutes to get the final nanoparticulate pellet The pellet was washed twice with deionized water to remove unentrapped drug from the surface of NP Finally, the nanoparticulate pellet was redispersed in 2 m L of deionized water
Characterization of DMB PLGA Nanoparticles: The particle size, poly dispersity index (PDI), and zeta potential were determined via dynamic light scattering using Malvern Zetasizer Nano ZS (Malvern Panalytical, Royston, UK). The concentration of dacomitin ib in NPs was determined using a highperformance liquid chromatography (HPLC, Waters, Milfard, MA USA) equipped with a C18 column (3 µm, 4.6*100 mm) and UV detector. For DMB determination, the HPLC mobile phase was 0.1% v/v orthophosphoric acid /ACN (60:40) with a detection wavelength of 254 nm. The flow rate was 0.5 mL/min. Using this HPLC method, the entrapment efficiency and % drug loading of DMB in PLGA NP was calculated. Approximately 20 µL of NP formulation was subjected to lysis by the addition of 1 mL of a/cetonitrile and 980 µL of deionized water followed by centrifugation at 20,627 g force for 30 min at 4 ˚C. The supernatant was collected and analyzed using HPLC. The entrapment efficiency and % drug loading was calculated using following equations:
Entrapment Efficiency (% w/w) =
Amount of drug in DMBNP
total amount of DMB added × 100
Amount of drug in DMBNP
% Drug Loading =
total amount of DMB and polymer added × 100
In Vitro Release Studies: In vitro drug release of the DMB from nanoparticles was performed using dialysis method in phosphate-buffered solution (PBS, pH 7.4) containing 1% w/vpolysorbate 80 Briefly, 0.4 mL of the nanoparticle suspension was loaded into the dialysis cassette (7000 MWCO, Thermo Scientific, MA, USA) and immersed in 80 mL of PBS maintained at 37 C. At each specific predetermined time points, 2 mL of sample was collected from the release medium and replaced with fresh PBS to maintain sink conditions The amount of drug released was determined by analyzing the collected supernatants by HPLC.
Solid State characterization : The DMB-NPs were freeze-dried (Labconco freeze dryer 4.5, Kansas City, MO, USA) and the drug encapsulation within the NPs was assessed with solid-state characterization studies such as Differential Scanning Calorimetry (DSC) and Powder X -Ray Diffraction analysis (PXRD).
Differential Scanning Calorimetry studies: Differential Scanning Calorimetry studies were performed using DSC Q200 (TA instruments, New Castle, DE USA). Briefly, 4 mg of samples were weighed, sealed in aluminum pans, and analyzed over a temperature range of 10 °C to 210 °C at a heating rate of 10 °C/min against an empty aluminum pan as reference
Powder X-Ray Diffraction Analysis: Powder X-Ray Diffraction analysis was performed using XRD6000 (Shimadzu, Kyoto, Japan). Uniformly dispersed samples were placed on micro sample glass holder and then analyzed at scan range of 10–80° with scanning speed of 2° (2θ)/min).
In vitro Aerosolization Studies: Pulmonary deposition of DMBNP was performed using a Next Generation Impactor (NGI Model 170, MSP Corporation, Shoreview, MN, USA). Briefly, the NGI plates and adaptor were refrigerated at 4 °C for 90 min prior to use , to minimize the evaporation of nebulized sample A 15 L/min air flow rate was maintained during the operation of NGI Two mL of nanoparticle formulation was loaded into the PARI LC PLUS® nebulizer cup and nebulized using Pari FAST-NEB compressor system The instrument is primed for 30 seconds followed by nebulization for 4 min. Samples from each stage (stages 1–8) including throat and mouthpiece were collected using ACN: Water (50:50) mixture. These samples were centrifuged and then analyzed using HPLC. Parameters such as Fine Particle Fraction (FPF%), Mass Median Aerodynamic Diameter (MMAD), and Geometric Standard Deviation (GSD) were calculated.
252
Results and Discussion
The DMB nanoparticles were prepared using a single emulsion solvent evaporation method. The prepared suspension displayed a particle size of 202.0 ± 32.5 nm confirming the formation of nanoparticles. The NPs had a P.D.I of 0.183 ± 0.061, indicating a unimodal distribution. Further, the nanoparticles had a zeta potential of 19.39 ± 2.50 mV The % entrapment efficiency of dacomitinib in NP was 55.06 ± 6.3% w/w and the drug loading was 27 ± 0.01 µg/mg Solid state characterization studies were performed using DSC and PXRD. Initially, DSC studies were performed to confirm drug encapsulation into NP and identify the form (amorphous or crystalline) of drug The thermogram of free drug showed sharp endothermic peaks at 160 °C and 187 °C due to its melting point (Figure 1a) whereas DMB-NP revealed absence of sharp melting point peak suggesting successful encapsulation of drug in NP and likely in an amorphous form. The PXRD spectra of the free drug in Figure 1b exhibited several distinct crystalline peaks of DMB at 10° to 30° in 2θ range. However, the crystalline peaks of DMB were absent in the diffractogram of DMB nanoparticle at 10° to 30° in 2θ range, indicating complete encapsulation of drug into the nanoparticle.
In vitro drug release of the optimized DMBNP formulation was performed in PBS, pH 7.4 at 37 ˚C. The data in Figure 2a showed a rapid drug release of about 10.21± 0.43% in 8 h with a gradual increase in release up to 72 h. This was then followed by slower and sustained release with a cumulative release of 39.2 ± 7.5% after 5 days (4) Sustained release of the drug can be due to effective encapsulation of drug into the polymeric core of nanoparticle.
The therapeutic efficacy of nebulized dosage form depends mainly on MMAD and FPF. Hence, various in vitro aerosolization parameters like FPF (%), MMAD, and GSD (Figure 2b) were calculated to assess the respirable capacity of nanoparticle formulation. A MMAD less than 5 μm is essential for effective
Drug Delivery to the Lungs , Volume 32, 2021 - Druvasarika Barji et.al
Figure 1 Solid state characterization of Dacomitinib (DMB), Blank NP (Blk NP), and Dacomitinib PLGA nanoparticles (DMB-NP): a) DSC thermograms and. b) PXRD patterns.
Figure 2: 2a) In vitro release profile for DMB NP in phosphate buffer saline, pH 7.4 2b) In vitro aerosol deposition profile of DMB-NP represented as percent drug deposited on each stage of the Next Generation Impactor (NGI). Data represented as Mean ± SD, n = 3.
253
Drug Delivery to the Lun gs,Formulation Development of Inhalable Dacomitinib Polymeric Nanoparticles for NonSmall Cell Lung Cancer Treatment
lung deposition of particulate therapeutics (5). After nebulization of DMBNP’s, the MMAD and GSD values were calculated to be 3.77 ± 0.17 μ m, and 2.23 ± 0.10 respectively , indicating suitability for inhalation Further, the NPs displayed a fine particle fraction (FPF) of 80.86 ± 1.02% suggesting that this could result in efficient deposition in the bronchoalveolar region of the lungs . From NGI studies the formulated DMB-NPs for inhalable drug delivery of DMB can be considered as efficient and well proven.
Conclusions
Our studies have shown that dacomitinib has been successfully encapsulated into NPs resulting in a size of 200 nm and charge of −20 mV. The solid -state characterization studie s (DSC and PXRD) revealed effective drug encapsulation in NPs in an amorphous form. In vitro aerosolization studies also demonstrated good inhalable properties with MMAD of 3.77 ± 0.17 μm and FPF of 80.86 ± 1.02%. Moreover, our ongoing and future studies will include performing MTT assay, in vitro uptake, and 3D spheroid (as they better mimic tumor microenvironment) studies to evaluate DMB -NP efficacy in comparison to free drug in suppressing tumor growth.
References
1. Pao, W., Chmielecki, J. Rational, biologically based treatment of EGFR-mutant non-small-cell lung cancer. Nat Rev Cancer 10, 760–774 (2010). https://doi.org/10.1038/nrc2947.
2. FDA approves dacomitinib for metastatic non-small cell lung cancer, www.fda.gov/drugs/drug-approvals-anddatabases/fda-approves-dacomitinib-metastatic-non-small-cell-lung-cancer-0.
3. Zhang L, Chen W, Tu G, et al. Enhanced Chemotherapeutic Efficacy of PLGA -Encapsulated Epigallocatechin Gallate (EGCG) Against Human Lung Cancer. International Journal of Nanomedicine. 2020;15: 4417-4429. DOI: 10.2147/ijn.s243657.
4. Danhier F, Ansorena E, Silva JM, Coco R, Le Breton A, Préat V. PLGA -based nanoparticles: an overview of biomedical applications. J Control Release. 2012 Jul 20;161(2):505-22. doi: 10.1016/j.jconrel.2012.01.043.
5. Kunda NK, Alfagih IM, Miyaji EN, Figueiredo DB, Gonçalves VM, Ferreira DM, Dennison SR, Somavarapu S, Hutcheon GA, Saleem IY, Pulmonary dry powder vaccine of pneumococcal antigen loaded nanoparticles, International Journal of Pharmaceutics, 2015: 903-912, DOI: https://doi.org/10.1016/j.ijpharm.2015.09.034.
254
Nasal-PAMPA: a novel in vitro tool for prediction of intranasal drug permeability
Patrícia Henriques1,2, Joana Bicker1,3 Slavomíra Doktorovová2, Ana Fortuna1,3
1Laboratory of Pharmacology, Faculty of Pharmacy, University of Coimbra, Pólo das Ciências da Saúde, Azinhaga de Santa Comba, 3000-548 Coimbra, Portugal
2R&D, Drug Product Development, Hovione FarmaCiencia SA, Lisbon, Portugal
3CIBIT/ICNAS, Coimbra Institute for Biomedical Imaging and Translational Research, University of Coimbra, Azinhaga de Santa Comba, 3000-548 Coimbra, Portugal
Summary
In nasal drug product development, biorelevant in vitro methodologies are vital in order to select promising compounds or formulations, potentially reducing pre-clinical and clinical trials. Permeability assays are often applied to predict drug absorption and bioavailability. For nasal delivery products, permeation models include ex vivo models using excised nasal mucosa and in vitro cell culture models However, ex vivo models present high variability and cell culture models are very time consuming. The Parallel Artificial Membrane Permeability Assay (PAMPA) has emerged as a high throughput screening tool to evaluate drug permeability, and it has been applied to several barriers such as the intestine, skin or blood-brain-barrier. Herein, a new PAMPA model was developed and optimized to predict nasal permeability, using a biorelevant donor medium containing mucin. The apparent permeability (Papp) of 15 reference compounds was assessed in six different experimental conditions. The model with 0.5% (w/v) mucin in the donor compartment and 2% (w/v) phosphatidylcholine in the lipid membrane correctly distinguished high and low permeable compounds, with no false positives or negatives. In addition, it exhibited the highest correlation with permeation across human nasal epithelial RPMI 2650 cells (R2 = 0.71). Overall, the optimized PAMPA model was reproducible, predictive and inexpensive, showing to be a promising non-cell based and biorelevant in vitro tool that could be applied in an early screening stages of new nasal drug delivery products.
Key Message
A new nasal-PAMPA model with 0.5% (w/v) mucin on donor compartment and 2% (w/v) phosphatidylcholine in lipid membrane can differentiate high and low permeable compounds for nasal delivery and shows to be a promising predictive and high throughput tool for assessment of intranasal drug permeability for application in early phase screening studies.
Introduction
The nasal route is the primary option for the treatment of topical nasal disorders. However, there has been a growing interest in its use for systemic delivery, due to fast absorption with circumvention of hepatic first-pass metabolism[1]. The target area for systemic delivery is the respiratory epithelium, where the nasal drug product can contact with the mucus layer, which is composed mainly of water and mucin. Mucin, a polymeric gel-forming glycoprotein that interacts with drugs and/or excipients, has been shown to be responsible for mucoadhesion mechanisms[2] .
A major challenge in nasal product development is the lack of translation between in vitro and in vivo results. This is particularly critical during drug and formulation screening, where predictive biorelevant in vitro methodologies would be helpful to choose the most promising drug product, and thus reduce pre-clinical and clinical trials. Permeability assays are often applied to predict nasal drug absorption and bioavailability, also providing relevant information on drug transport across an epithelium and the effect of excipients on its permeability[3]. For nasal delivery drug products, permeation models include in vitro cell culture models, and ex vivo models using excised nasal mucosa. Animal excised tissues present high variability due to variations in tissue thickness and metabolic enzyme differences between species and donors, as well as ethical concerns[3]. As an alternative, cell culture models are more standardized and easier for routine use[3] , for example the RPMI 2650 cell line as a predictive in vitro model for intranasal drug permeability[4]. However, the standard cell culture duration of air-liquid RPMI 2650 model is 21 days of culture[5], which may be incompatible with industry timelines on drug and formulation screening. As an alternative, the Parallel Artificial Membrane Permeability Assay (PAMPA) has emerged as a high throughput screening (HTS) tool, that is less expensive and labor intensive than cell-based methodologies.
The goal of this study was to develop a new nasal-PAMPA model for the prediction of drug permeability across the nasal epithelium, as an alternative to cell and tissue models. For this purpose, the apparent permeability (Papp) of 15 chemically and structurally diverse drugs was assessed using distinct experimental conditions, in order to find the most discriminating and predictive model. Due to the
Drug Delivery to the Lungs, Volume 32, 2021 – Patrícia Henriques et al.
255
availability of permeability data in the literature from RPMI 2650 cells, Papp values obtained in PAMPA were compared and correlated with RPMI 2650 permeability. Additionally, given the impact of mucin in drug diffusion and permeation, media containing mucin were also evaluated as potential biomimetic donor solutions.
Materials and methods
Reference compounds encompassing furosemide, metoprolol tartrate, nadolol, propranolol, ropinirole hydrochloride, verapamil hydrochloride, hydrochlorothiazide, paroxetine hydrochloride and rosiglitazone were obtained from Sigma–Aldrich (St. Louis, USA). Atenolol and carbamazepine were acquired from Acros Organics, ThermoFisher Scientific (Waltham, USA). Zonisamide was purchased from Molekula. Escitalopram oxalate, fluoxetine hydrochloride and sertraline hydrochloride were acquired from Jinlan Pharm-Drugs Technology Co., Limited (Hangzhou, China). L-Phosphatidylcholine extracted from soybean (P5638) and mucin from porcine stomach type II (M2378) were acquired from Sigma–Aldrich (St. Louis, USA). Dimethyl sulfoxide (DMSO) was purchased from Fisher Scientific (Leicestershire, UK) and n-dodecane was acquired from Sigma– Aldrich (St. Louis, USA). 96-well microfilter plates and 96well microtiter plates were purchased from Millipore Corporation (Bedford, USA).
PAMPA optimization was based on previously developed methods by our research group for the prediction of human intestinal absorption, plasma protein binding[6] and permeability across the blood–brain barrier[7] Experimental conditions were optimized for the prediction of nasal drug permeability and the results were compared with data reported in literature obtained with RPMI 2650 cell layers.
Six different assays were performed by varying lipid concentration in the artificial membrane (2% or 10% w/v) and mucin concentration in the donor drug solution (0%, 0.5% or 1% w/v). Stock solutions (10 mM) of each reference compound were prepared by dissolving the corresponding amount of drug in DMSO and then diluted with phosphate buffer saline (PBS), mucin 0.5% (w/v) or mucin 1% (w/v) in PBS pH 7.4 to obtain a donor solution at a final concentration of 500 µM (DMSO concentration of 5% v/v). Artificial lipid membrane solutions were prepared daily by dissolving phosphatidylcholine in n-dodecane at two concentrations (2% or 10%, w/v). The 96-well microfilter plates were used as acceptor compartments and the 96-well microtiter plates as donor compartments.
The PAMPA assay was initiated by coating the hydrophobic filter of each acceptor well with 6 µL of phosphatidylcholine in n-dodecane. After applying the lipid, acceptor wells were filled with 150 µL of PBS (pH 7.4) containing the same % of DMSO as the donor solution (5% v/v), to prevent co-solvent influence in only one of the compartments. Donor wells were filled with 300 µL of each donor solution.
The acceptor filter plate was then placed carefully onto the donor plate The assembly was incubated for 16 h under gentle stirring (40 strokes/min) at room temperature. After incubation, the plates were separated and drug concentrations in the acceptor solution were determined by ultraviolet spectrophotometry. For each condition, 3 replicates were performed in three independent assays, and Papp was reported as mean ± standard deviation (SD).
The Papp of each drug was calculated according to Avdeef[8] and applying Eq. 1:
����!"" = # %&%'! ( * $ + +,-" % × log[1 (1 + ����. + ) 0# (*) 0!(&)] (1)
Where, ����! is the volume of donor solution (0.3 cm3), ���� is the membrane area that separates both compartments (0.26 cm2), ���� is the permeation time in s, ����" is the ratio between the volumes of solution in donor and acceptor compartments, ����# (����) and ����! (0) are the drug concentrations (µM) obtained in the acceptor compartment after the experiment and in the donor solution at the beginning of the assay, respectively.
Correlations were established between in vitro Papp values obtained in PAMPA and in vitro permeation values through the air-liquid RPMI 2650 cell culture model reported in literature. The exponential function (���� = ����$ × ���� %& ) was applied for curve fitting.
Results and Discussion
The concentration of phosphatidylcholine in the lipid membrane and concentration of mucin in donor solution were studied, in a total of 6 experimental conditions. Reference compounds were classified as high (Nasal +) or low (Nasal -) permeable drugs, according to their permeability across the RPMI 2650 cell model. This classification was based on work by Sibinovska et al [4], where high permeable drugs in the air-liquid model had Papp values above 12.4 x 10⁻⁶ cm/s and less permeable drugs had Papp values below 8.5 x 10⁻⁶ cm/s. Escitalopram, which has a Papp in the air-liquid RPMI 2650 cell model of 9.1 x 10-
Drug Delivery to the Lungs, Volume 32, 2021 -
permeability
Nasal-PAMPA: a novel in vitro tool for prediction of intranasal drug
256
6 cm/s, was classified as a high permeable drug due to its lipophilicity (log D = 1.27 at pH = 7.4 ) and classification as highly permeable in the BCS classification system[9]
The effect of the studied variables is evidenced in Fig. 1. Accordingly, the arbitrary PAMPA cut-off value of 2.0 x 10⁻⁶ cm/s was established to discriminate Nasal + and Nasal – compounds, as it separated better the compounds predicted as high and low permeable
Two concentrations of phosphatidylcholine (2% or 10% w/v) were investigated. All PAMPA models with 10% (w/v) phosphatidylcholine revealed false negatives and/or false positives. Hence, models with a higher phospholipid percentage may not be suitable for the prediction of nasal permeability. The results corroborate that the composition of the lipid membrane is a determinant factor to consider during PAMPA development[6]
The influence of mucin concentration was also herein investigated. Mucin hinders drug permeation through the nasal epithelium, especially for lipophilic drugs that tend to bind non-specifically to proteins[10] In this study, it is noticeable that mucin negatively affected the permeation of lipophilic drugs. When mucin was included at a concentration of 1% (w/v), all compounds with high Papp values (>3.0 x 10⁻⁶ cm/s) exhibited a reduction of Papp, except zonisamide in the assay with 10% (w/v) phosphatidylcholine, which displayed similar Papp values. This Papp reduction was not advantageous, since it led to the appearance of 2 false negative compounds (escitalopram and propranolol) with 10% (w/v) phosphatidylcholine. On the other hand, lower Papp values allowed the elimination of the false positives with the combination of 1% mucin with 2% (w/v) phosphatidylcholine. Still, with 1% (w/v) mucin and 2% (w/v) phosphatidylcholine, high and low permeable compounds were not sufficiently well discriminated, and some were classified very close to the cut-off value of 2 x 10⁻⁶ cm/s, such as propranolol and nadolol.
Therefore, assays with a mucin concentration of 0.5% (w/v) were subsequently performed. Mucin concentration of 0.5% (w/v) resulted in a balanced effect on Papp values. With 2% (w/v) phosphatidylcholine, no false negatives/positives were found, and high and low permeable compounds were better discriminated. These results show that including mucin on the donor compartment is crucial to obtain optimal PAMPA conditions that allow the prediction of nasal permeation, confirming that this glycoprotein plays an important role on drug permeation.
Fig. 2 describes the correlations found between in vitro Papp values obtained herein with PAMPA and in vitro Papp through the air-liquid RPMI 2650 cell culture model reported in literature[4],[11],[12] Accordingly, it is evidenced that the PAMPA assay with 2% (w/v) phosphatidylcholine and 0.5% (w/v) mucin exhibits the
Drug Delivery to the Lungs, Volume 32, 2021 – Patrícia Henriques et al.
Figure 1 - Apparent permeability (Papp) values of the 15 reference compounds under the experimental conditions tested in PAMPA optimization. Compounds located on grey areas were classified as false negative or false positive according to the model. Results are expressed as mean (SD), n = 3 wells in 3 independent experiments.
257
highest correlation coefficients (R2 = 0.71).
PAMPA is a research tool used to study passive drug diffusion and it is considered a good model of lipophilicity[7] Accordingly, PAMPA Papp values have been successfully correlated with log D in other models[7]. However, herein, no correlations were found with either log P or log D when mucin is present in the system, suggesting that PAMPA models including the mucus glycoprotein are more biomimetic, comprising not only drug lipophilicity but also interaction with mucin properties This model could be potentially used in drug development and research as a tool to evaluate intranasal drug permeability.
(1) Atenolol, (2) Carbamazepine (3) Escitalopram, (4) Fluoxetine, (5) Furosemide, (6) Hydrochlorothiazide, (7) Metoprolol, (8) Nadolol, (9) Paroxetine, (10) Propranolol, (11) Ropinirole, (12)
Conclusion
The inclusion of mucin in the donor compartment of PAMPA successfully improved the predictive capacity of the model, with differentiation between high and low permeable drugs with 0.5% (w/v) mucin. This glycoprotein demonstrated impact on drug permeation and should be considered in nasal permeation models. Moreover, models with 2% phosphatidylcholine (w/v) in the lipid membrane showed an improved correlation with permeation across RPMI 2650 cells.
To the best of our knowledge, this is the first non-cell-based methodology to predict drug permeability through nasal mucosa. The optimized PAMPA model showed to be reproducible, high throughput and inexpensive. The assay only takes one day to complete, enables the assessment of several molecules in simultaneous and uses very low amounts of sample, thus being a useful tool in the screening phase of drug development aiming at systemic delivery through the nasal route.
References
[1] Fortuna, A, Alves, G, Serralheiro, A, Sousa, J and Falcão, A. Intranasal delivery of systemic-acting drugs: Small-molecules and biomacromolecules. Eur. J. Pharm. Biopharm. 2014, 88: 8–27.
[2] Sosnik, A, Das Neves, J and Sarmento, B. Mucoadhesive polymers in the design of nano -drug delivery systems for administration by non-parenteral routes: A review Progress in Polymer Science 2014, vol. 39 2030–2075.
[3] Salade, L, Wauthoz, N, Goole, J and Amighi, K. How to characterize a nasal product. The state of the art of in vitro and ex vivo specific methods. Int. J. Pharm. 2019, 561: 47–65.
[4] Sibinovska, N, Žakelj, S and Kristan, K. Suitability of RPMI 2650 cell models for nasal drug permeability prediction. Eur. J. Pharm. Biopharm. 2019, 145: 85–95.
[5] Mercier, C, Perek, N and Delavenne, X. Is RPMI 2650 a Suitable In Vitro Nasal Model for Drug Transport Studies? European Journal of Drug Metabolism and Pharmacokinetics 2018, vol. 43 13–24.
[6] Fortuna, A, Alves, G, Soares-da-silva, P and Falcão, A. Optimization of a parallel artificial membrane permeability assay for the fast and simultaneous prediction of human intestinal absorption and plasma protein binding of drug candidates: Application to dibenz[b,f]azepine-5-carboxamide derivatives. J. Pharm. Sci. 2012, 101: 530–540.
[7] Bicker, J, Alves, G, Fortuna, A, Soares-Da-Silva, P and Falcão, A. A new PAMPA model using an in-house brain lipid extract for screening the blood-brain barrier permeability of drug candidates. Int. J. Pharm. 2016, 501: 102–111.
[8] Alex Avdeef. Absorption and Drug Development: Solubility, Permeability, and Charge State. (John Wiley & Sons, Inc., 2012).
[9] Ramirez, E, Laosa, O, Guerra, P, Duque, B, Mosquera, B, Borobia, AM, Lei, SH, Carcas, AJ and Frias, J. Acceptability and characteristics of 124 human bioequivalence studies with active substances classified according to the Biopharmaceutic
Drug
to the Lungs, Volume 32,
-
Delivery
2021
Nasal-PAMPA: a novel in vitro tool for prediction of intranasal drug permeability
Figure 2 – Plot of apparent permeability values (Papp) of reference compounds obtained with the six experimental conditions against the corresponding Papp obtained with air-liquid RPMI 2650 cell culture model from literature[4],[11],[12] and the respective exponential regression. Included reference compounds are
Rosiglitazone, (13) Sertraline, (14) Verapamil, (15) Zonisamide.
258
Drug Delivery to the Lungs, Volume 32, 2021 – Patrícia Henriques et al.
Classification System. Br. J. Clin. Pharmacol. 2010, 70: 694–702.
[10] Sigurdsson, HH, Kirch, J and Lehr, CM. Mucus as a barrier to lipophilic drugs International Journal of Pharmaceutics 2013, vol. 453 56–64.
[11] Gonçalves, J, Silva, S, Gouveia, F, Bicker, J, Falcão, A, Alves, G and Fortuna, A. A combo-strategy to improve brain delivery of antiepileptic drugs: Focus on BCRP and intranasal administration. Int. J. Pharm. 2021, 593: 120161.
[12] Silva, S. et al., In preparation (2021)
259
260
Surface Acoustic Wave Nebulisation for Targeted Inhalation Drug Delivery to Central and Peripheral Airways
Christian Witte1, Elijah Nazarzadeh1, John Pritchard1, Julien Reboud2, Jonathan M. Cooper21Acu-Flow Limited, Rankine Building, Oakfield Avenue, Glasgow, G12 8LT, UK
2University of Glasgow, Rankine Building, Oakfield Avenue, Glasgow, G12 8LT, UK
Summary
This work presents surface acoustic waves (SAW) as a technology for controlled aerosolisation of formulations with a wide range of physical properties, including viscous solutions and those with low surface tension that are often challenging to deliver The acoustic waves were coupled into microstructured arrays of cavities with sizes in the range of 100s of micrometers to nebulise liquids. The aerosols generated by the nebuliser engine w ere characterised using an Anderson Cascade Impactor The mass median aerodynamic diameter (MMAD) was consistently <2µm for model drug systems, ranging from 1% sodium chloride to 50% ethanol, whilst it was ca. 1.3µm for antibiotic drug formulations of Tobramycin and Amikacin. These results demonstrate significant reduction in the size of the droplets in the aerosol compared to previous technologies This suggests a route for targeted delivery of inhalable antibiotic drugs to the central and peripheral airways, potentially avoiding side effects associated with intravenous or oral application , as well as reduc ing drug waste and the risk of development of drug resistant bacteria often linked to other modes of delivery
Key Message
Surface Acoustic Waves coupled into an array of microstructure d cavities can aerosolise a wide range of formulations with a high respiratory fraction, enabling targeted delivery of inhalable antibiotic to the peripheral airways.
Introduction
Pulmonary drug delivery remains a challenge for many drug formulations, due to the many mechanical and physicochemical barriers that make up the lung tissue. With its complex network of airways, the lung evolved into an effective aerosol and particle “filter” making access to the conducting airways and alveoli difficult. Deposition of drugs into the main bronchus requires droplets smaller than 5µm whereas deep lung deposition in the alveolar epithelium requires aerosols with particle sizes of less than 3µm [1, 2] Pulmonary bacterial infections in these lung tissues requires targeted antimicrobial delivery. However, more commonly used oral and intravenous delivery are often associated with side effects, especially during long term use [3]. They also require higher amounts of the compounds and increase the risk of the development of antibiotic resistance.
Targeted pulmonary drug delivery has the potential to overcome these challenges, by increasing the antimicrobial compound concentration locally at the site of infection, thus reducing drug amounts used and circulating systemically, limiting side effects. In particular, nebulisers could enable topical drug deposition in the deep lung tissue However, current nebulisers often have limitations around the physical properties of the formulations they are able to deliver efficiently (e.g. low surface tension <40mN/m), due to difficulties in producing large drug laden aerosol populations with the required particle sizes of 3µm or lower. They also tend to retain large amounts of drugs in the device , causing drug waste [4]
In this work we demonstrate that surface acoustic wave (SAW) technology can be engineered to produce a large fraction of aerosol particles of less than 3 µm during the nebulisation of antibiotic drugs and liquids with challenging physical properties Our technology couples the SAW into a microstructure d chip to confine the liquid formulation within cavities, consequently providing the ability to control the capillary waves on the surface of the liquid, generating aerosols with fine droplets
Experimental methods
A 13.6 MHz Interdigitated transducer (IDT), fabricated using a metal lift-off process on 128̊° Y-cut lithium niobate piezoelectric substrate, was used for this study. The microstructure d chip was produced by a
Drug Delivery to the Lungs , Volume 32, 2021 – Christian Witte et al.
261
dry etch process to form an array of cavities of 600 µm diameter. It was placed on top of the IDT and the liquids dispensed to the nebuliser via a syringe pump. Formulations models were prepared using sodium chloride and ethanol (Sigma Aldrich) as well as generic drug formulations of Amikacin (50 mg/ml, Vianex) and Tobramycin (40 mg/ml, Flynn Pharma ltd)
An Anderson Cascade impactor (ACI, Copley) was used for aerosol characterisation. The ACI was cooled at 5°C. The results are provided based on the recovered material from the collection plates of the ACI. In order to measure the concentration of formulation models, all of the stock solution were prepared with 1.1 mg/ml Allura Red solution. ACI plates were rinsed with DI water and the rinsates were analysed with a UV/Vis spectrophotometer at 504 nm to obtain aerosol concentration. The concentration of Tobramycin was measured using sol ution conductivity. A gravimetric analysis of ACI plates before and after nebulisation of Amikacin were performed to obtain aerosol distribution. The ACI plates were stored over-night in a drying cabinet to remove the water content prior to gravimetric ana lysis (both before and after the aerosols deposition)
Results
Figure 1 shows the recovered mass fraction from the different stages of the ACI, indicating a high fraction of droplets between 0.7µm and 2µm, for all of the solutions. The mass median diameter of the produced aerosols together with the residual of the active material on the SAW platform are presented in Table 1. The SAW nebuliser is capable of nebulising these solutions with a flow rate between 70 to 200µl/min.
The nebulised solutions (Figure 1) include sodium chloride and sodium sulfate, as samples with salt, 10% PEG 400, as a more viscous solution, 2.5% sodium dodecyl -sulphate (SDS) with low surface tension and 50% ethanol as a solution with high viscosity and very low surface tension , beyond the limit of current nebulisers (<40mN./m, Table 1) . The Amikacin (50 mg/ml) and Tobramycin (40 mg/ml) solutions were nebulised with flow rates of 100 µl/min. Nebulisation of these antibiotic drug models resulted in aerosols with a MMAD of 1.3 µm and a peak of droplets are observed in range of 1µm (Figure 1).
1% sodium chloride (Yellow), 1% Sodium sulfate
SDS (Black), 50mg/ml Amikacin
Delivery to the Lungs
Delivery
Central
Peripheral
Drug
, Volume 32, 2021 - Surface Acoustic Wave Nebulisation for Targeted Inhalation Drug
to
and
Airways
262
Figure 1 – Collected mass fraction in each ACI stage for
(Grey), 10% PEG400 (Green), 50% ethanol (Blue), 2.5%
(purple horizontal pattern) and 40mg/ml Tobramycin (red cross pattern).
Discussion
Nebulisation of formulations with different properties can be a challenging task, especially for liquids with very low surface tension and/or high viscosity. In this study, we present the data from different liquids models with various properties, includin g 50% ethanol that has a very low surface tension while having a relatively high viscosity (Table 1). We have shown that our SAW technology can produce aerosol with very small droplet sizes and MMAD of 2µm , for example as an approach to reduce the surface tension in the alveolar region, decreasing sputum formation and enhancing drug update .
We demonstrated for the first time the nebulisation of commercially available antibiotic drug solution using surface acoustic waves in combination with a silicon microstructure technology. Our initial results showed that those drug formulations, can be adopted to produce aerosol with MMADs below 3µm and high fine particle fractions below 2µm. While those numbers are encouraging, further studies on lung models, with specific focus on drug distribution in the tissue and whether it is suited for therapeutic purposes will be required to progress the development of the technology towards clinical use. The absorption of the drug (e.g. into macrophages) and the general lif etime of the drug before clearance will also require careful investigation. Moreover, patients with lung disease present changes in their lung structure in the form of narrowed or obstructed airways, which impact airflow and ultimately the drug deposition process, requiring smaller droplet size for efficient drug delivery. Further questions remain regarding treatment time which ideally should be short to avoid disruption of daily life as well as around the activity of the drug administered but novel drug carrier compounds may improve release and activity profiles to reduce treatment intervals and drug dose.
Conclusion
Topical delivery of antibiotics to deep lung tissue via inhalation has the potential to become an important therapeutic tool for the treatment of lung diseases caused by microbials. The challenge is to deliver the drug in a targeted manner with high drug concentration at the site of infection without stressing the patient’s body through side effects as observed by traditional administra tion of repeated high doses antibiotic but also with reduced chances of antibiotic resistance through over - or misuse. New nebuliser technologies based on surface acoustic wave excitation present an opportunity to overcome the lungs innate particle filtering effect by producing fine aerosol particle fractions that are able to penetrate the conducting airways and alveoli more efficiently. Our SAW based technology enable s nebulisation of
Drug Delivery to the Lungs , Volume 32, 2021 – Christian Witte et al.
Solution 1% Sodium Sulfate 1% Sodium Chloride 50%(v/v) Ethanol 10% PEG400 2.5% SDS Amikacin 50mg/ml Tobramycin 40mg/ml MMAD (µm) 1.4 1.4 1.9 2.3 1.3 1.3 1.1 Residual on the platform (%) 9.4 6.1 4.5 11.2 7.7 5.8 16.5 Flow rate (µl/min) 200 200 170 100 200 100 70 Viscosity (cP) 1.0 1.0 2.0 1.56 1.3 N/A N/A Surface tension (mN/m) 72 72 27 55.7 31 N/A N/A
Table 1 –Performance of SAW nebuliser according to the Mass Median Aerodynamic Diameter (MMAD) of aerosol; residual concentration of the active material on the SAW platform; and the nebulisation flow rate for each solution. Also, viscosity, surface tension of each solution is provided, indicating the range of solutions that can be nebulised with the SAW platform.
263
Drug Delivery to the Lungs , Volume 32, 2021 - Surface Acoustic Wave Nebulisation for Targeted Inhalation Drug Delivery to Central and Peripheral Airways
common antibiotics to produce particle sizes with MMADs of less than 3 µm while maintaining a high fine particle fraction. For the same flow-rate, our technology will enable an increase in the inhalable fraction of the aerosol, decreasing the nebulisation time.
Referencesal articles [1]oks [2], Meeting abstracts [3]
[1] Dhanani, J., Fraser, J. F., Chan, H. K., Rello, J., Cohen, J., & Roberts, J. A. (2016). Fundamentals of aerosol therapy in critical care. Critical care (London, England), 2016; 20: 269. https://doi.org/10.1186/s13054-016-1448-5
[2] Newman S P, Pitcairn G R, Hooper G, Knoch M: Efficient drug delivery to the lungs from a continuously open -vent nebulizer and low-pressure compressor system, Eur Respir J 1994; 7: 1177–1181.
[3] Marcos I Restrepo, Holly Keyt, Luis F Reyes Aerosolized Antibiotics Respiratory Care Jun 2015; 60: 762773; DOI: 10.4187/respcare.04208
[4] Arzu Arı. “Jet, Ultrasonic, and Mesh Nebulizers: An Evaluation of Nebulizers for Better Clinical Outcomes”; Eurasian J Pulmon ol 2014; 16: 1-7
[5] Mehta AJ, Guidot DM: Alcohol and the Lung; Alcohol research : current reviews, 2017; 38: 243-254.
264
The evolution of unsteady flow from dry powder inhalers
Vishal Chaugule1, Suzanna Olofsson1, Larissa Gomes dos Reis2, David F Fletcher3, Paul M Young2,4, Daniela Traini2,5 & Julio Soria1
1Laboratory for Turbulence Research in Aerospace and Combustion (LTRAC), Department of Mechanical and Aerospace Engineering, Monash University, Clayton Campus, Melbourne, VIC 3800, Australia
2Respiratory Technology, Woolcock Institute of Medical Research, Sydney, NSW 2037, Australia
3School of Chemical and Biomolecular Engineering, The University of Sydney, Sydney, NSW 2006, Australia
4Department of Marketing, Macquarie Business School, Macquarie University, NSW 2109, Australia
5Department of Biomedical Sciences, Faculty of Medicine, Health and Human Sciences, Macquarie University, NSW 2109, Australia
Summary
The time-dependent behaviour of the aerosolized inhalation flow produced from a dry powder inhaler (DPI) significantly affects the dynamics of aerosol generation. A characterisat ion of such an unsteady DPI flow is therefore important to better understand the device aerosol performance. The unsteady flow emerging from two analogue DPI models, one with and the other without a grid, has been examined. These models are a modified form of an original design with two tangential inlets. Particle image velocimetry was used to measure the spatio-temporal DPI fluid flow velocity field. These measurements were performed using a piston-driven water-based experiment under geometrically and dyna mically similar conditions to the original DPI model operating in air, and were taken in a longitudinal plane outside the DPI mouthpiece. The unsteady inhalation flow through the DPI is simulated by a forward piston-stroke pushing fluid through the DPI model. The ensemble-averaged velocity vector-fields for the two models show the spatio-temporal evolution of the emerging DPI flow. An axially -recirculating and laterally-spreading jet flow arising from the model without the grid is found to develop. These fl ow features occur due to high flow-swirl and lead to drug losses due to particle retention in the device and deposition due to impaction in the mouth -throat region. The jet flow emerging from the model with the grid is found to spread less, but has a large central reverse-flow region that persists for a considerable time of the flow duration
Key Message
The spatio-temporal evolution of the flow-field emerging from two DPI models outline the formation and growth of axially-recirculating and lateral-spreading flow regions. These affect the device aerosol performance, with the reverse flow leading to drug particle retention in the device, and the lateralspreading results in impaction losses in the mouth -throat region.
Introduction
The aerosol performance of a dry powder inhaler (DPI) is closely interlinked and strongly affected by the fluid dynamics characteristics of the inhalation flow generated by the inhaler device. This flow, which is generated when a patient inhales through the device, fl uidizes the drug powder and entrains it into the flow, whereupon particle de-agglomeration occurs due to the action of aerodynamic turbulent shear, and also due to particle collisions with a surface or with other particles. In its essence, the turbulent DP I flow is unsteady as a result of a patient’s inspiratory flow. The time -dependent nature of the flow affects the timing and dynamics of aerosol generation and release from the DPI. Therefore, a characterisation of the aforementioned flow is essential to u nderstand the dynamics and DPI aerosol performance. This spatio-temporal flow characterisation has been experimentally carried out on two analogue DPI models in the present study.
DPI Models
The DPI model used in the study is a slightly modified form of an original model which was examined in our previous study [1]. These models are illustrated in Fig. 1. The original DPI model is a hollow circular pipe with two diametrically opposite tangential inlets placed above a hemispherical drug -dosing cup at the bottom, while the open top forms the device mouthpiece. The modified DPI model is similar to the original model in all aspects except that each of its two tangential inlets has a smooth 90° turning channel attached as shown in Fig. 1. This channel allows for the reorientation of a flow coming in an axial direction, from the bottom side of the DPI model, into a tangential direction before entering the model through the tangential inlets. The blue lines indicate the flow directions into the two DPI models, w hich
Drug Delivery to the Lungs , Volume 32, 2021 - Vishal Chaugule et al.
265
in both cases are tangential. The modified DPI model was created to facilitate a piston -driven timevarying inlet flow into the model. The bottom surface of the model facing the piston is shown in Fig. 1, with the axial entry ports of the 90° turning channel on the surface. The modified DPI model with a grid having square holes at its mouthpiece exit has also been explored in this study, and is shown in Fig. 1.
Experimental Method and Set-up
Water was used as the working fluid instead of air, by having the modified DPI model under geometrically and dynamically similar conditions as that for the original model in air [1]. This was achieved by having the same Reynolds number Re for the flows from the DPI models in air and water. Re = 8400 and is defined here based on the DPI mouthpiece-exit inner diameter D, the average axial-exit flow velocity U, and the properties of the fluid. Both the DPI models, with and withou t a grid, are geometrically scaledup by 3 times that of the original model.
Particle image velocimetry (PIV) was used to measure the spatio -temporal 2-component – 2dimensional (2C – 2D) velocity vector fields of the unsteady flow emerging from the DPI m odels. A schematic of the water-based PIV experimental facility with a piston-driven flow is shown in Fig. 2. The DPI model is connected at the center of one side of a large Perspex tank. Extending outwards from this side is a cylindrical Perspex tube whic h has a piston inside. The piston-rod is driven through this tube using a lead screw connected to a stepper motor that is driven and controlled via a motor driver and an encoder. A forward piston-stroke pushes water through the DPI model thereby generating a time-varying fluid flow exiting the DPI mouthpiece , which simulates an unsteady inhalation flow from the device. The maximum piston velocity was set in order to produce an average axial -exit flow velocity U from the DPI mouthpiece that achieved Re = 8400. The time duration of each forward piston -stroke was T = 7.1 s, which equals the inhalation flow time period through the DPI model. 27 inhalation flow periods were executed for each of the two DPI models. The PIV measurements were taken in a longitudinal plane outside the DPI mouthpiece, where the plane was defined by the laser light -sheet. A high-speed camera was used to record the double-frame PIV images in this plane at an acquisition rate of 100 images per second. The coordinate system adopted in this study is shown in the top right part of Fig. 2, where x and y are the axial and lateral directions, respectively, and u and v are the measured instantaneous velocities in those respective directions
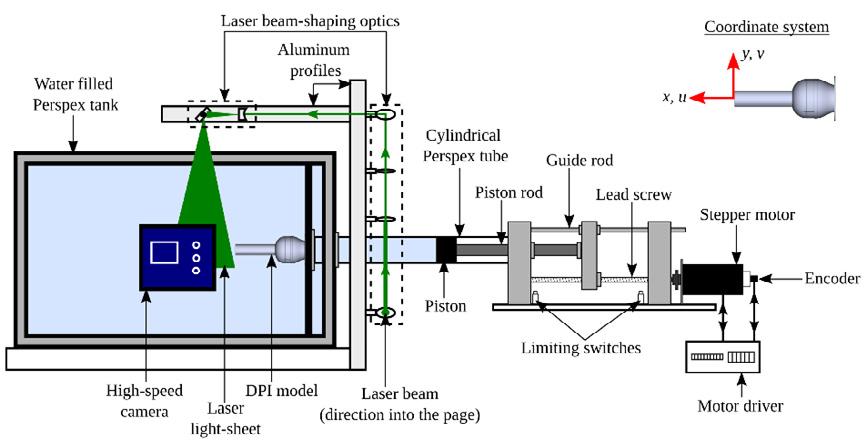
Drug Delivery to the Lungs ,
-
evolution of unsteady flow from dry
inhalers
Volume 32, 2021
The
powder
Figure 1 - DPI models examined in this study
266
Figure 2 - Schematic of the experimental facility
Results
The ensemble-averaged flow-field vectors for the two DPI models are presented below. These velocity vectors represent the averaged flow -field emerging from DPI model mouthpiece over the 27 inhalation flow periods. The axial and lateral coordinates have bee n normalised by D, and the vector colour map is that of the ensemble-averaged axial velocity ũ normalised by U. The non-dimensional time t of each vector flow-field is shown as a fraction of the inhalation flow period T
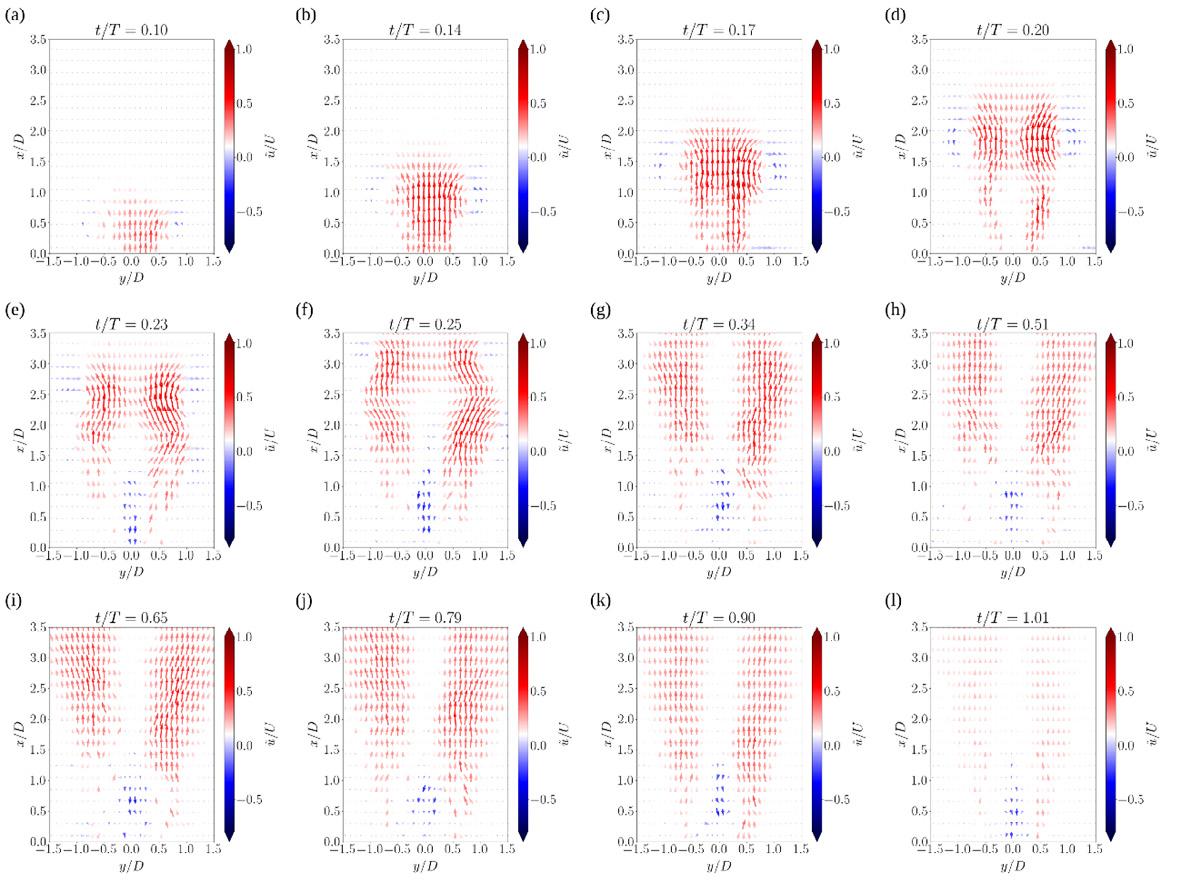
The ensemble-averaged vector fields for the DPI model without the grid are shown in Fig. 3. The flow exits the DPI mouthpiece in the form of a jet with two leading vortices on either side of the flow centerline y/D = 0. These vortices are clearly observed at t/T = 0.14 in Fig. 3(b) and represent a cross -sectional view of a leading three-dimensional vortex ring that ejects from th e DPI mouthpiece. The central jet region -0.5 ≤ y/D ≤ 0.5 has positive axial velocity and the centers of the vortices on either side occur approximately at y/D = ± 0.8. The jet spreads and the vortices grow as the flow evolves with time along the axial direction. However, the axial velocities in the jet central region begin to decrease in magnitude and eventually become negative, as observed at t/T = 0.23 in Fig. 3(e). This reversed axial flow extends from the mouthpiece exit up to x/D = 1.25, with a stagnation region formed downstream of this location. As the flow evolves with time, the jet spreads laterally and the stagnation region grows axially, as shown in Figs. 3(f) to 3(i). The axial velocities decrease as the inhalation flow rate decreases, but the p resence of the axial reverse-flow region at mouthpiece exit persists after the inhalation flow has stopped, as shown in Fig. 3(l).
Figure 4 shows the ensemble-averaged vector fields for the DPI model with the grid. The jet flow with leading vortices on eit her side of the flow centerline exits the mouthpiece earlier and at a greater axial velocity when compared with that from the model without the grid, as observed in Fig. 4(c) compared with Fig. 3(a). The effect of the grid on the flow results in the creation of a large stagnation region that grows to cover most of the central jet region, as is seen from Figs. 4(d) to 4(f). This stagnation region subsequently develops into an axial reverse flow region with negative axial velocities, as shown in Figs. 4(g) and 4(h), and continues for more than three -quarters of the inhalation flow period, at t/T = 0.79 in Fig. 4(i). In the last quarter of the inhalation flow period the axial reverse flow region in the jet centre begins to disappear as it gets replaced by positive axial velocities, Figs. 4(j) to 4(l), although a small reverse flow region remains just outside the mouthpiece grid.
Drug Delivery to the Lungs , Volume 32, 2021 - Vishal Chaugule et al.
Figure 3 - Ensemble-averaged velocity vector-fields for the DPI model without the grid. Vector colours are of the ensemble-averaged axial velocity ũ normalised by U
267
Discussion
The flow leaving the mouthpiece of the DPI model without the grid (Fig. 3) predominantly consists of a stagnated and reverse flow region in the centre surrounded by positive axial velocities, which spread laterally with time. This axially -recirculating and laterally -spreading flow occurs as a result of a highly swirling jet that emerges from the DPI and which undergoes a phenomenon called vortex breakdown [1]. The effect of such a flow on the aerosol perfor mance of this DPI model leads to drug losses in the form of particle retention in the device and particle deposition due to impaction in the mouth -throat region [2]. The role of a grid placed at the mouthpiece exit to alleviate these losses, by reducing t he flow swirl and straightening the emerging flow, comes only into effect at a later stage of the flow evolution (Fig. 4)
Although the flow emerging from the DPI model with the grid has less lateral spreading, there is a large axial reverse flow region pr esent in the flow centre for a considerable amount of time after initiation of the inhalation flow. This delays the timing of aerosol release from the device which can affect its aerosol performance.
Conclusion
The spatial and temporal evolution of the flo w emerging from two DPI models with tangential inlets, where one of the models has a grid placed at its mouthpiece exit, has been presented. The flow characteristics highlight the strongly swirling nature of the emerging DPI flow marked by the presence of axially-recirculating and lateral-spreading regions that develop soon after the inhalation flow initiation. Drug losses due to particle retention and impaction and thereby a reduced aerosol performance of this device model are attributed to this flow behav iour. The effect of the grid in improving the device aerosol performance by reducing flow swirl manifests only when the inhalation flow begins to cease.
References
[1] dos Reis L G, Chaugule V, Fletcher D F, Young P M, Traini D, and Soria J: In-vitro and particle image velocimetry studies of dry powder inhalers, International Journal of Pharmaceutics 2021; 592:119966
[2] Fletcher D F, Chaugule V, dos Reis L G, Young P M, Traini D, and Soria J: On the use of computational fluid dynamics (CFD) modelling to design improved dry powder inhalers, Pharmaceutical Research 2021; 38:277–288.
Drug Delivery to the Lungs , Volume 32, 2021 - The evolution of unsteady flow from dry powder inhalers
Figure 4 - Ensemble-averaged velocity vector-fields for the DPI model with the grid. Vector colours are of the ensembleaveraged axial velocity ũ normalised by U
268
Drug Delivery to the Lungs, Volume 32, Ronan MacLoughlin, Marc Mac Giolla Eain, Andrew O’Sullivan, Leanne Reilly, Keith Hurney, Mary Joyce
Assessment of aerosol drug delivery during the escalation of treatment for a simulated COVID-19 adult patient
Ronan MacLoughlin, Marc Mac Giolla Eain, Andrew O’Sullivan, Leanne Reilly, Keith Hurney, Mary Joyce1 ,
1Aerogen Ltd., Galway Business Park, Dangan, Galway , H91 HE94, Ireland
Summary
The effect of the various COVID-19 clinical interventions on aerosol delivery is not well know n This study investigated the use of a vibrating mesh nebuliser to deliver aerosolised drug s during mouthpiecemediated aerosol drug delivery, high flow nasal therapy and invasive mechanical ventilation employing a low tidal volume ventilation strategy Simulated adult healthy and mild adult COVID-19 breathing patterns were used for spontaneous breathing assessments. A mechanical ventilator delivered standard and low tidal volume ventilation parameters
The results presented represent the percentage drug delivered to a simulated healthy adult and mild adult COVID-19 patient during concurrent aerosol therapy during these interventions. The highest delivered drug dose was measured during mouthpiece -mediated aerosol therapy with a result of 57.93 % ± 1.05 % for mild COVID-19, 56.64 % ± 2.94 % for healthy, as a comparator.
Use of HFNT resulted in the lowest percentage drug delivered (2.33 % ± 0.99 % for 30 LPM; 1.80 % ± 0.61 % for 60 LPM), with no significant difference between the flow rates (p = 0.6220). For mechanical ventilation, there was a significant difference in adopting a LTV ventilation strategy (13.66 % ± 0.75 %) in comparison to a standard ventilation (30.34 % ± 0.27 %) (p < 0.0001).
It can be concluded that the choice of clinical intervention in the oxygenation and ventilatory support of the COVID-19 patient influences aerosol delivery to the lung. This variability may be significant and therefore should be noted in the design of dosing strategies, and de -risking of clinical trial programs.
Key Message
The choice of clinical intervention in the oxygenation and ventilatory support of the COVID -19 patient influences aerosol delivery to the lung. This variability may be significant and therefore should be noted in the design of dosing strategies, and de-risking of clinical trial programs.
Introduction
Since 2019 and the emergence of COVID-19 there have been almost 194 million reported infections and over 4 million recorded deaths worldwide [1]. Due to concerns around healthcare professionals' exposure risks in the early days of the pandemic, invasive mechanical ventilation was adopted as the standard of care for the oxygenation and ventilatory support of those acutely and critically ill COVID -19 patient [2]. However, due to a global shortage of mechanical ventilato rs, and an increasing understanding of the potential risks associated with, and requirements for the clinical management of, COVID-19 patients, other oxygen supplementation and ventilatory support interventions saw increasing adoption. High Flow Nasal therapy, Non-invasive ventilation and BiPAP were deployed, and often, earlier in the clinical course , prior to onset of respiratory distress
With a paucity of known to be effective therapeutics, several investigational and re-purposed drugs were administered to patients via the aerosol route. However, little is known of the effects of the various clinical interventions on aerosol delivery, and consequently the implications for therapeutic efficacy Whilst data exists in the literature that describes each intervention and the potential for aerosol delivery, there is nothing yet that describes the adult COVID-19 patient journey from presentation to the Emergency Department (ED), to progression to Ward and eventually the Intensive Care Unit (ICU). A recent study in a model of Cystic Fibrosis patients would suggest that significant differences in aerosol delivery may be seen across these interventions [3]
The first line aerosol therapy administered to patients presenting to the ED with respiratory distress is often nebulised bronchodilator. These patients will have several parameters monitored, including respiratory rate, and pulmonary arterial oxygenation (Pa02) levels Aerosol is delivered via facemask or mouthpiece, and may or may not have supplemental oxygen administered also. Interestingly, many
269
Drug Delivery to the Lungs , Volume 32, 2021 - Assessment of aerosol drug delivery during the escalation of treatment for a simulated COVID-19 adult patient
pharmaceutical approaches to therapy, and increasingly, prophylaxis are making use of handheld nebulisers in potential COVID-19 patients, with reports of some therapies being administered on admission as an early intervention that may continue should the patient deteriorate, and require escalation of care [4]
Should the patient deteriorate, the priority becomes proper oxygenation. HFNT has become one of the most used interventions in COVID-19 treatment. Gas flow rates of 60 litres per minute are commonly administered to patients to improve Pa02, but due to patient compliance considerations the starting HFNT gas flow rate may be lower, e.g., 30 litres per minute [5] Most HFNT systems will be suited also for use with concurrent aerosol delivery and provide caregivers and pharmaceutical companies the opportunity to administer therapeutics in those patients that may still have a chance of avoiding intubation and mechanical ventilation. The effects of gas flow rates and breathing patterns are well described in the literature, however, thus far, a COVID-19 breathing pattern has not been assessed [6].
For those critically ill patients that experience respiratory failure, or cannot mainta in normal Pa02 levels, sedation and mechanical ventilation may be required. To minimise ventilator induced lung injury in these critically ill COVID-19 patients, lung protective ventilation strategies, e.g., the ARDSNET protocol, were adopted [7] Lower delivered tidal volumes are intended to minimise stretch in the lung, whilst at the same time delivering sufficient oxygen. Critically, the effect of lower tidal volume ventilation strategies on aerosol delivery has not been described thus far in the literature.
Given the potential for significant variability in aerosol delivery across these interventions, and in an effort to better inform both clinicians and pharmaceutical/biologic companies in developing de-risked dosing strategies that account for these differences, t he objective of this study was to assess aerosol drug delivery in a model of COVID-19 during the most commonly prescribed clinical interventions during the escalation of respiratory support, that is to say, a spontaneous breathing patient with a hand held nebuliser, HFNT and mechanical ventilation.
Experimental Methods & Materials
The experimental test set up is presented in Figure 1 A tracer aerosol of 2000 µg of Albuterol Sulphate (GSK, Ireland) was nebulised using a vibrating mesh nebuliser (VMN) (Aerogen Solo, Aerogen Ltd., Ireland)
For a spontaneously breathing patient, Figure 1 (i), a VMN was placed in an aerosol chamber (Aerogen Ultra, Aerogen Ltd., Ireland) and drug was delivered via a mo uthpiece attached to a breathing simulator (BRS2100, Copley Scientific, UK) set to simulate both a healthy adult (BPM: 15, Vt: 500mL, I:E: 1:1) and mild COVID adult patient (BPM: 25, Vt: 600mL, I:E: 1:1). A capture filter (Respirgard, Vyaire, USA) was placed between the mouthpiece and the breathing simulator.
For high flow nasal therapy (HFNT), Figure 1 (ii), a VMN was placed in the nebuliser port of a HFNT system (Airvo 2, Fisher & Paykel, New Zealand) and aerosol was delivered concurrently with high flow at gas flow rates of 30 and 60 Litres per min through a nasal cannula (OPT944, Fisher & Paykel, New Zealand) placed on an adult head model. A breathing simulator set to simulate the healthy adult and mild COVID adult patient. It was attached to the head m odel via a capture filter at the level of the trachea
For mechanical ventilation, Figure 1 (iii), a VMN was placed between the endotracheal tube (ETT) (8.0mm, Flexicare, UK) a heat and moisture exchanger (HME) (Inter -Therm Filter, Intersurgical, UK) within a dual limb circuit (RT200, Fisher & Paykel, New Zealand). Two adult breath patterns were generated by a mechanical ventilator (Servo -I, Maquet, Sweden); Low Tidal Volume Ventilation (LTV) - BPM: 20, Vt: 400mL, I:E: 1:2 and standard adult – BPM: 15, Vt: 500mL, I:E: 1:1. A capture filter was placed between the ETT and the test lung.
270
Drug Delivery to the Lungs, Volume 32, Ronan MacLoughlin, Marc Mac Giolla Eain, Andrew O’Sullivan, Leanne Reilly, Keith Hurney, Mary Joyce
al.,
The mass of drug eluted from the capture filters was determined using UV spectrophotometry at 276nm. Results are expressed as the percentage of the nominal dose placed in the nebuliser’s medication cup. All testing was performed in triplicate. Statistical analysis was completed using GraphPad Prism (version 9.1.2). Unpaired t-test analysis completed to determine statistical significance between types of respiratory support
Results
Results are presented as mean ± SD % drug delivered as illustrated in Figure 2 Statistical differences were considered at p ≤ 0.05.
Figure 1: Experimental set up. (i) Mouthpiece-mediated aerosol delivery in a spontaneous breathing patient. (ii) High Flow Nasal (Cannula) Therapy-mediated aerosol delivery in a spontaneous breathing patient.(iii) Endotracheal tube-mediated aerosol delivery in a spontaneous breathing patient. (YC et 2021)0 2 0 4 0 6 0 8 0 T y p e o f r e s p i r a t o r y s u p p o r t % D r u g D e l i v e r e d S B - H e a l t h y S B - M i l d H F N T - 3 0 L P M - M i l d H F N T - 6 0 L P M - M i l d M V - S T D M V - L T V p = 0 6 6 1 5 p = 0 6 2 2 0 p < 0 0 0 0 1
271
Figure 2. Drug delivery from a VMN during spontaneous breathing (SB) and high flow nasal therapy (HFNT) using healthy and mild COVID-19 breathing patterns and during standard adult and LTV mechanical ventilation.
Discussion
From the results of testing, significant differences in the amount of drug delivered exist between the three clinical interventions assessed. Of note, no significant difference was noted between standard breathing parameters and mild COVID parameters in either spontaneous breathing assessments (handheld nebuliser, and HFNT). Some differences due to the mild COVID-19 breathing patterns may have been expected, as previous work has shown that distressed breathing can in fact increase the inhaled dose [8, 9] This, however, was not the case here. Potentially because the mild -COVID breath used was still similar to the healthy breath with respect to peak inspiratory flows etc. More distressed, severe COVID-19 breath patterns may affect the dose in this manner; however, those patients would likely be intubated, and not in receipt of HFNT.
Significant differences were noted between standard ventilation parameters and lower tidal volume, lung protective, ventilation parameters. Positioning of the nebuliser between the HME and endotracheal tube provides the opportunity for maximal aerosol delivery, whilst maintaining appropriate humidification of the airways. Additionally, the high minute volume for the LTV ( 8 litres versus 7.5 litres) may have helped but the unfavourable inhalation: exhalation ratio of 1:2 was the most likely root cause of the lower dose.
These results highlight the significant variability in potential delivered aerosol doses in the COVID -19 setting, and are important considering the implications that they may have when designing aerosol dosing strategies for COVID-19 therapies.
Conclusion
These findings highlight the importance of appropriate and considered aerosol therapy in the COVID19 patient population
References
[1] Organization WH. Weekly epidemiological update on COVID -19 27 July 2021. 2021.
[2] Fink JB, Ehrmann S, Li J, Dailey P, McKiernan P, Darquenne C, Martin AR, Rothen -Rutishauser B, Kuehl PJ, Häussermann S. Reducing aerosol-related risk of transmission in the era of COVID-19: an interim guidance endorsed by the international society of aerosols in medicine. Journal of aerosol medicine and pulmonary drug delivery. 2020;33(6):300 -4.
[3] Fernández Fernández E, Joyce M, O’Sullivan A, MacLoug hlin R. Evaluation of Aerosol Therapy during the Escalation of Care in a Model of Adult Cystic Fibrosis. Antibiotics. 2021;10(5):472.
[4] Monk PD, Marsden RJ, Tear VJ, Brookes J, Batten TN, Mankowski M, Gabbay FJ, Davies DE, Holgate ST, Ho L-P. Safety and efficacy of inhaled nebulised interferon beta -1a (SNG001) for treatment of SARS-CoV-2 infection: a randomised, double-blind, placebo-controlled, phase 2 trial. The Lancet Respiratory Medicine. 2021;9(2):196-206.
[5] Demoule A, Vieillard Baron A, Darmon M, Beurton A, Géri G, Voiriot G, Dupont T, Zafrani L, Girodias L, Labbé V. High-flow nasal cannula in critically III patients with severe COVID -19. American journal of respiratory and critical care medicine. 2020;202(7):1039 -42.
[6] Li J, Fink JB, MacLoughlin R, Dhand R. A narrative review on trans -nasal pulmonary aerosol delivery. Critical Care. 2020;24(1):1-13.
[7] Network ARDS. Ventilation with lower tidal volumes as compared with traditional tidal volumes for acute lung injury and the acute respiratory dis tress syndrome. New England Journal of Medicine. 2000;342(18):1301-8.
[8] Bennett G, Joyce M, Sweeney L, MacLoughlin R. In vitro study of the effect of breathing pattern on aerosol delivery during high -flow nasal therapy. Pulmonary therapy. 2019;5(1):43-54.
[9] Réminiac F, Vecellio L, Heuzé-Vourc'h N, Petitcollin A, Respaud R, Cabrera M, Pennec DL, Diot P, Ehrmann S. Aerosol therapy in adults receiving high flow nasal cannula oxygen therapy. Journal of aerosol medicine and pulmonary drug delivery. 2016;29(2 ):134-41.
,
Drug Delivery to the Lungs
Volume 32, 2021 - Assessment of aerosol drug delivery during the escalation of treatment for a simulated COVID-19 adult patient
272
Drug Delivery to the Lungs, Volume 32, 2021 – Jorge F Pontes et al.
Development of a prototype of an aerosolization device for dry powders to improve in vitro cell-based assays in the context of lung delivery
Jorge F. Pontes1,2, Hermínio P. Diogo3, Eusébio Conceição4, Flávia Musacchio1, Rui M. Borges dos Santos1,4 & Ana Grenha1,4
1Centre for Marine Sciences, Universidade do Algarve, Campus de Gambelas, Faro, 8005-139, Portugal
2Centre for Biomedical Research, Universidade do Algarve, Campus de Gambelas, Faro, 8005-139, Portugal
3University of Lisbon, Instituto Superior Técnico, Centro de Química Estrutural, Av. Rovisco Pais, 1049-001 Lisbon, Portugal
4Faculdade de Ciências e Tecnologia, Universidade do Algarve, Campus Gambelas, Faro, 8005-139, Portugal
Summary
The lung has been, for the past years, subject of intense research for local and systemic drug delivery approaches. However, robust correlations between in vitro and in vivo results are often impaired, as in vitro experiments frequently have limitations mimicking lung conditions, especially when involving cell -based studies. This work proposes a 3D-printed device for aerosolization of dry powders over cells in culture, thus better resembling the conditions of aerosolization occurring in vivo. The proposed device comprises two parts, the weighing head, and the main body. Dry powders are weighed in the weighing head, which is then sealed to the main body. Next, compressed air is injected into the device, dragging the powder onto a plate, which fits the bottom of the main body. The plate is a suitable surface for cell culture. Dry powders (polysaccharide-based microparticles) were tested using the device, leading to an aerosolization yield up to 51%, which was observed to depend on the tested dry powder The dry powder deposition profile is currently being evaluated using a Quartz-Crystal Microbalance, which replaces the plate at the bottom of the device’s main body. These experiments entail a more precise determination of the mass of aerosolized powders by analysing the differences in the vibration frequencies of a quartz crystal, thus allowing to assess the deposition profile. Although preliminary, the results show that the developed device may comprise an affordable solution for in vitro testing of dry powders when aerosolization over a surface is required
Key Message
The developed prototype of an aerosolization device can homogenously disperse dry powders over cell layers, comprising a cheaper alternative for in vitro cell-based experiments that allows better resembling the conditions of powder aerosolization.
Introduction
The paradigm of drug administration has been changing for the past years, as alternative routes, new technologies, and strategies have been widely studied to improve therapeutic outcomes.1,2 Lung drug delivery has been considered a relevant alternative for the treatment of local diseases and for the systemic delivery of drugs. Nevertheless, the approach requires complying with aerodynamic requisites to reach the appropriate zone of the lung.3 Additionally, different regions of the respiratory tract present different physiological environments: the bronchi have a mucus layer, while the alveoli are completely devoid of liquid, being covered only by a thin layer of lung lining fluid preventing desiccation4. This contrasts with more conventional routes, such as the oral, characterised by abundant volume of liquid surrounding the mucosal tissue, making the evaluation of behaviours of inhalable drug formulations challenging. In vitro tests comprise the first line of assessment to ascertain the potential of drug formulations and are expected to provide robust and indicative information on the formulation performance. Dry powders are currently of the most popular inhalable formulations, but their evaluation in cell-based assays is complex, given the difficulties in mimicking the lung environment. Conventional cell-based experiments involve considerable volume of liquid, in which cells are cultured with liquid on the apical side. Dry powders are often described to be simply dispersed in the liquid, which does not resemble in vivo conditions in the specific case of the lung route. Delivering dry powders as such is, in fact, a difficult task. The market provides some adequate solutions to tackle the in vitro testing of dry powders, all involving quite complex and expensive equipment not easily accessible to most of the inhalation community. That limitation impelled us to design and develop an easy -to-use and economically accessible device that allows the aerosolization of dry powders, providing homogenous dispersion over a plate, intended to have cultured cells at a later stage. The device targets initial stages of formulation development frequently impaired by the inability to afford high-cost equipment. Its use is expected to allow refining and selecting drug formulations for more advanced stages. The proposed device has much lower cost in comparison with other alternatives in the market and it can have broader application related to the evaluation of the impact of pollution or electronic cigarettes in the human respiratory system.
In this work, a device for dry powder aerosolization onto a plate, which is suitable for cell culture, was developed and the protype printed in 3D. Polysaccharide-based unloaded microparticles prepared by spray-drying were used to test the device. The yield of the aerosolization process was calculated and air flow parameters are currently being optimised using a quartz crystal microbalance (QCM),5 which will enable subsequent assessment of the deposition profile of selected dry powders. The proposed work is summarized in Figure 1.
273
Drug Delivery to the Lungs, Volume 32, 2021 – Development of a prototype of an aerosolization device for dry powders to improve in vitro cell-based assays in the context of lung delivery

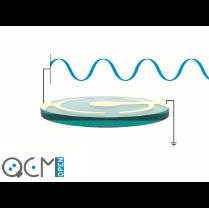
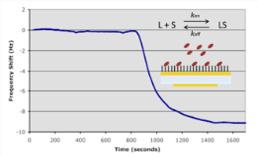
Figure 1 – The concept supporting the design and development of a prototype of an aerosolization device to be used in in vitro cell-based assays. From left to right, dry powders are weighed and loaded into a weighing head (in blue) that is subsequently assembled with the main body of the device. Compressed air is then loaded into the device (orange), dragging the powder (arrows), and dispersing it over cells cultured in a plate. The dry powder deposition profile is further analysed using a quartz crystal microbalance, through differences in the crystal vibration frequency.
Experimental methods
Design and printing process
The device was conceived and designed using a commercial software (AutoCAD, Autodesk, Inc., USA) and exported to a commercial 3D printer (ULTIMAKER 3 Extended), equipped with a standard 0.4 mm diameter double extruder nozzle but used in single mode. The apparatus was comprised of an extrusion system and a heated printing bed, which works synergistically with the extruded polymer (in filament form of 2.85 mm) at high temperatures. Printing was performed at 225 ºC using biodegradable poly-lactic acid. The nozzle height was set at 1.0 mm, with layers of 0.2 mm being applied. The extrusion speed was set at 17 mm/s.
The design and printing of the prototype considered two pieces, one comprising a small weighing head, where the dry powder is to be weighed, and another as the main body, conceived to allow powder dragging and deposition over cell layers.
Aerosolization of powders
Polysaccharide-based (unloaded) microparticles previously developed by the team for lung applications, composed of xanthan gum and dextran sulfate, and produced by spray-drying (Buchi Mini Spray-Dryer, Buchi Labortechnik AG, Switzerland), were selected as model dry powders to test the device. Before the assay, all parts of the device and a plate suitable for cell culture were weighed. Afterwards, 5 - 10 mg of dry powder were weighed in the weighing head, the device assembled, and the powder aerosolized after blowing air into the device (30 quick puffs from an air compressor, Goldair). The outlet pressure of the air compressor varied between 30 and 60 psi. After conclusion of the assay, the parts of the device and the plate were weighed, and images of the plate recorded after powder deposition. The yield of aerosolization was calculated as follows:
Yield of aerosolization (%) = (Amount of powder on the plate / Total amount of powder weighed) * 100
Evaluation of the profile of dry powder deposition by QCM
Maxtek quartz crystals (5MHz, Inficon), coated with optically flat polished gold electrodes on both sides, were cleaned before use with absolute ethanol, ultrapure water and a Piranha solution comprised of 3:1 mixture of sulphuric acid and 30% hydrogen peroxide for 15 min. Cleaned crystals were mounted on a kynar crystal holder (Maxtek CHT-100). The 3D-printed device was placed over it, and the aerosolization assay performed as described above. Changes in the vibration frequency of the quartz crystal were registered with a universal frequency counter (Agilent 53131A) through a phase-locked oscillator (Maxtek PLO-10i). The frequency counter is connected by GPIB to a computer running a data acquisition and control program developed in VEE V9.0 (Agilent) for the real time acquisition of the QCM frequency.
Results and discussion
Following the concept proposed in Figure 1, the device shown in Figure 2 was designed and prepared using the software AutoCAD. The final 3D-printed prototype is shown in Figure 3.
274
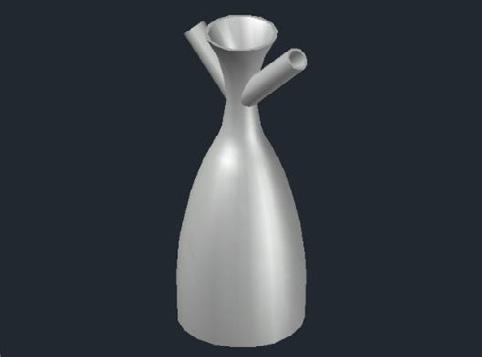

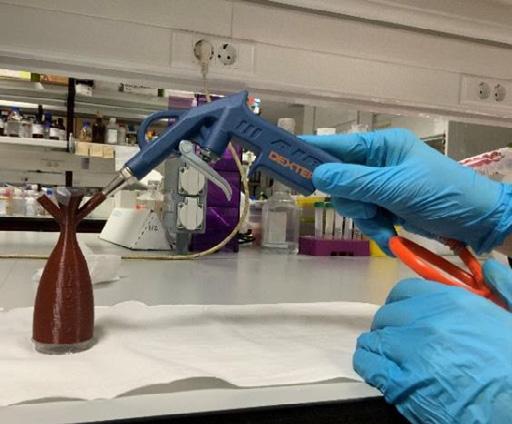
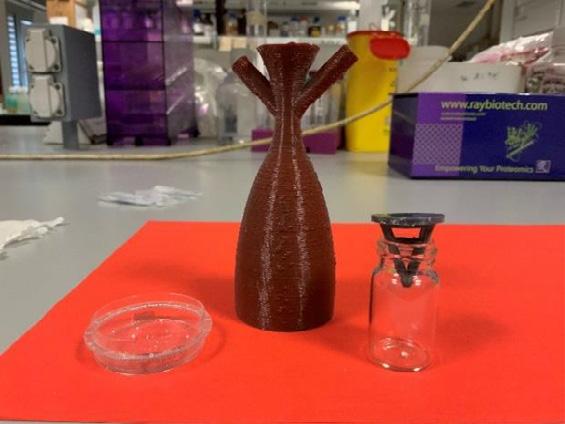
One of the limiting steps of the aerosolization process is the strength of the applied air flow, which should be enough to disperse all the powder but not excessive to induce destabilisation of the cell layer. In the first stages of development, various sources were tested for blowing air: lens cleaner, syringe, bicycle p ump and a gardening sprayer. The latter performed better, but it was concluded that the strength of the air flow was not enough to adequately disperse dry powders onto the plate. Therefore, an air compressor was tested to enhance the amount of dispersed powder. The aerosolization protocol was optimised, establishing a quick blow of air 30 times with an air blow gun (Figure 3A) as the most effective way to ensure that all the powder is dragged to the plate.
The following step involved determining the ideal operating air pressure to be set in the air compressor, aiming at two objectives: 1) maximise the amount of dispersed powder and 2) generate enough flow intensity without forcing powder dispersion to outside of the testing device. Various intensities of air pressure were tested to aerosolize different dry powders, all developed for inhalation purposes, and results are depicted in Figure 4.
Drug Delivery to the Lungs, Volume 32, 2021 – Jorge F Pontes et al.
Figure 2 – AUTOCAD design for the main body (A) and the weighing head (B); the powder is weighed in the latter
Figure 3 – 3D-printed prototype of the device and its use in the aerosolization assays: (A) the device assembled and prepared for an assay and (B) the different parts of the device, after an assay.
0 20 40 60 80 100 30 36 42 48 54 60 Yield of aerosolization (%) Air pressure (psi) XG MP XG-Na MP DS MP A B A B 275
Figure 4 – Aerosolization yields obtained with the device prototype, for microparticles (MP) composed of xanthan gum (XG), xanthan gum/sodium chloride (XG-Na) and dextran sulfate (DS). Results are presented as mean ± SD, n =
10.
Drug Delivery to the Lungs, Volume 32, 2021 – Development of a prototype of an aerosolization device for dry powders to improve in vitro cell-based assays in the context of lung delivery
The obtained results indicate that pressures of 36 and 42 psi are those maximising the yield of aerosolization, that is, the amount of powder leaving the weighing head onto the plate. Observations of tests performed at different air pressure indicated that dry powders comprised of particles with lower tenuity have facilitated dispersion, compared with finer particles. Other polysaccharide-based microparticles are currently being tested, but results obtained so far indicate the need to optimise the device to improve the dispersion of finer particles and adapt the device to all types of dry powders.
Optimizing the air flow that goes into the device is critical for the quality of the aerosolization process and powder deposition. QCM can be very helpful in this regard as, unlike a conventional balance, it allows following the deposition in real-time with great accuracy.5 In this way, the mass deposition per air blow can be followed to further optimize the procedure. To this end, the developed device was assembled on top of a QCM, which is replacing the plate, to determine the deposition profile of aerosolized dry powders at different air flow pressures. The assay is currently being performed.
Conclusion
A functional prototype of an aerosolization device able to disperse dry powders onto a plate was designed and 3D printed successfully, using a biodegradable/biocompatible polymer. The aerosolization required using an air compressor and protocol optimisation established the need to perform 30 quick air blows to maximise powder dispersion. Moreover, testing different air pressures resulted in the indication of optimal air pressures at 36 and 42 psi, which provide higher aerosolization yield. Yields up to 51% were obtained, which were observed to depend on particle tenuity, with lower tenuity facilitating the dispersion process. To further optimise the process, the deposition profile is being studied using QCM, a highly accurate balance enabling more precise and real-time determinations
Acknowledgements
Funding from the Portuguese Foundation for Science and Technology (UIDB/04326/2020), and the PhD scholarship to Jorge F. Pontes (PD/BD/137064/2018) are acknowledged
References
[1] He Y, Liang Y, Han R, Lu W-L, Mak J C W, Zheng Y. Rational particle design to overcome pulmonary barriers for obstructive lung diseases therapy. J Control Release 2019; 314: pp48-61.
[2] Ziaee A, Albadarin A B, Padrela L, Femmer T, O'Reilly E, Walker G. Spray drying of pharmaceuticals and biopharmaceuticals: Critical parameters and experimental process optimization approaches . Eur J Pharm Sci 2019; 127: pp300-18.
[3] Molavi F, Barzegar-Jalali M, Hamishehkar H. Polyester based polymeric nano and microparticles for pharmaceutical purposes: A review on formulation approaches. J Control Release 2020; 320: pp265-282.
[4] Fröhlich E, Mercuri A, Wu S, Salar-Behzadi S. Measurements of deposition, lung surface area and lung fluid for simulation of inhaled compounds. Front Pharmacol 2016; 7: 181.
[5] Ding Y, Weindl P, Lenz A G, Mayer P, Krebs T, Schmid O. Quartz crystal microbalances (QCM) are suitable for real -time dosimetry in nanotoxicological studies using VITROCELL ®Cloud cell exposure systems. Part Fibre Toxicol 2020; 17: 44.
276