5 minute read
International Journal for Research in Applied Science & Engineering Technology (IJRASET)


ISSN: 2321-9653; IC Value: 45.98; SJ Impact Factor: 7.538
Advertisement
Volume 11 Issue III Mar 2023- Available at www.ijraset.com
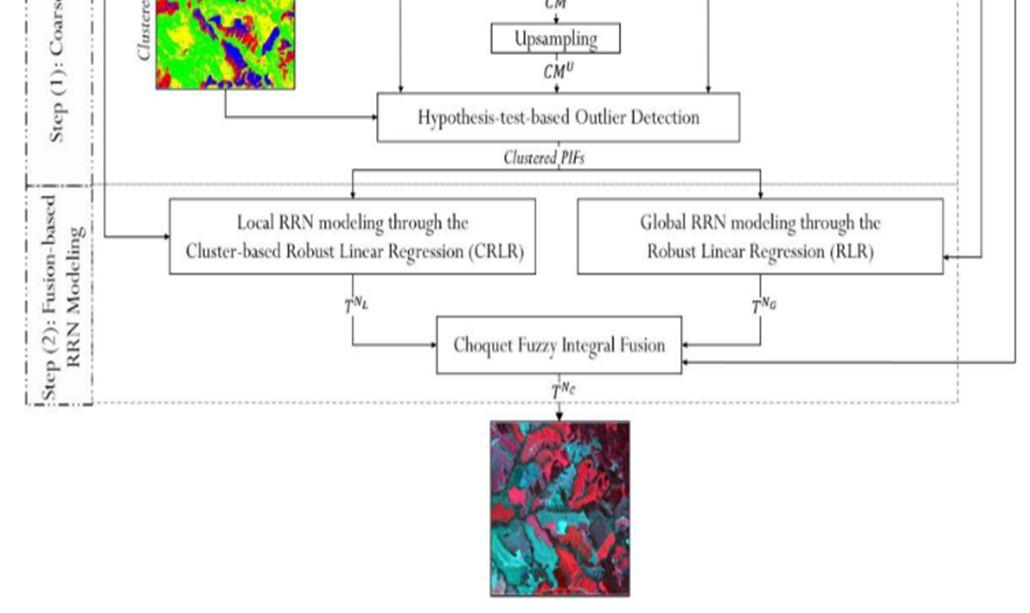
First, collecting in variant pixels from subject and reference images using GMM model. Second, these pixels are used in the RRN model to check its effectiveness in terms of time-saving and accuracy while determining the Radiometric Control Set Samples (RCSS).
7) Anju Asokan, J. Anitha, Monica Ciobanu, Andrei Gabor, Antoanela Naaji, and D. Jude Hemanth, “Image Processing Techniques for Analysis of Satellite Images for Classification of Historical Maps”, June 2020. This author has mentioned historical mapping due to the rapid change and expansion of society. Changes to historical maps include alterations to city/state borders, vegetation zones, bodies of water, etc. The majority of change detection in these locations is performed using satellite pictures. Therefore, substantial understanding of satellite image processing is required for applications involving the classification of historical maps. This paper provides a comprehensive examination of the benefits and drawbacks of numerous satellite image processing techniques. Although multiple computational approaches are available, the performance of the various satellite image processing applications varies by method. Certain comparative evaluations are also conducted to demonstrate the viability of several approaches. This effort will aid in the identification of inventive solutions for the various issues involved with satellite image processing applications.
ISSN: 2321-9653; IC Value: 45.98; SJ Impact Factor: 7.538
Volume 11 Issue III Mar 2023- Available at www.ijraset.com
8) Akib javed, Qimin Cheng, Hao peng, Orhan Altan, Yan Li, Iffat Ara, Enamul Huq, Yeamin Ali, and Nayyer saleem's "Review of spectral indices for urban remote sensing" publication date November 2020. Urban spectral indices have made great achievements in urban land use and land cover studies during the past two decades through mapping, estimation, change detection, time-series analysis, urban dynamics, monitoring, etc. Using spectral indices for remote sensing, information extraction is unsupervised, objective, quick, scalable, and quantitative. This article will aid the reader in understanding the uses of urban spectral indices, the selection of indices based on accessible spectral bands, as well as their benefits and drawbacks.
9) Nikita Khanduri, Suhaib Akhtar, Swati Vashisht, and Shubhi gupta "An Enhancement to Satellite Image Processing Resolution," published: July2020..In this publication, the author discusses image processing. Image processing is the process of performing beneficial operations on a photograph in order to obtain an enhanced image or to extract useful data from it. It is a sort of signal processing in which the input is an image and the output is likely an image or characteristics/highlights associated with that image. The Digital Image Processing of Satellite data primarily consists of image rectification and restoration, enhancements and information extractions, and image modification. It is a preparation of Satellite data for Geometrical and Radiometric Associations. Enhancement of the material in order to successfully illustrate the information resulting in Visual Elucidation. Data Extraction is used to create topical guides based on Digital grouping.
10) Martin Herold, Meg Gardner, Brian Hadley, and Dar Roberts. “The spectral dimension in urban land cover mapping using highresolution optical remote sensing data” Publication date: 2004. This study studies the spectral dimension of urban materials using extensive field spectral measurements, hyperspectral AVIRIS, and simulated IKONOS and LANDSAT TM data at a spatial resolution of 4 metres. The results reveal that the spectral features of urban land cover types are exceedingly complicated and diversified.
A. Convolution Neural Network (CNN)
ISSN: 2321-9653; IC Value: 45.98; SJ Impact Factor: 7.538
Volume 11 Issue III Mar 2023- Available at www.ijraset.com
III. ALGORITMIC SURVEY
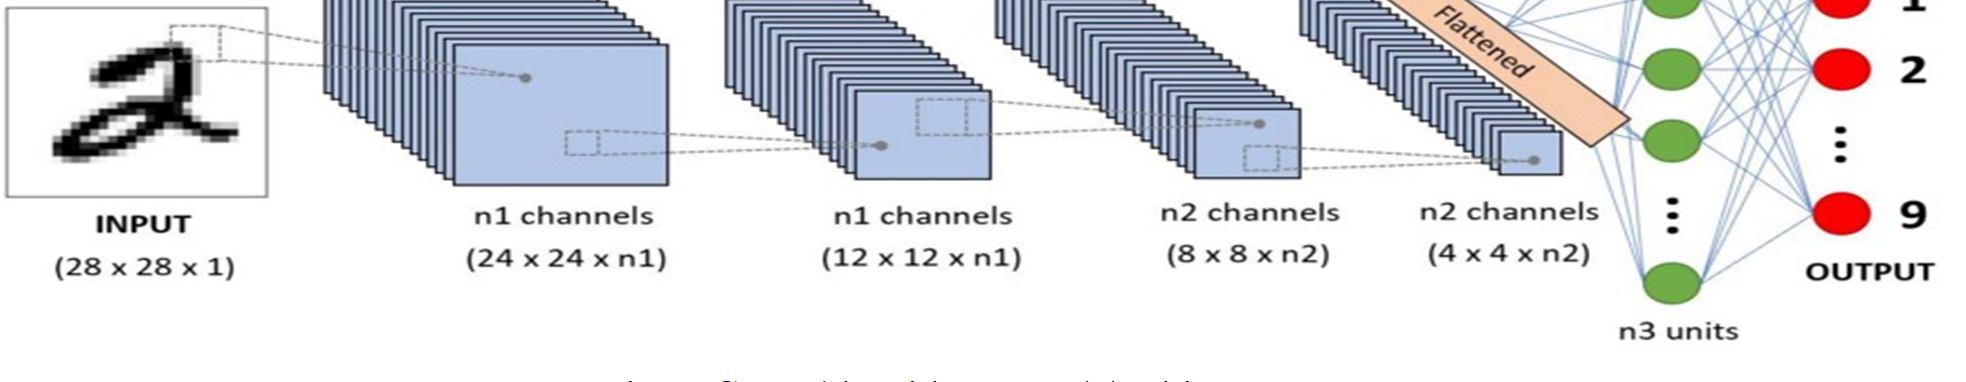
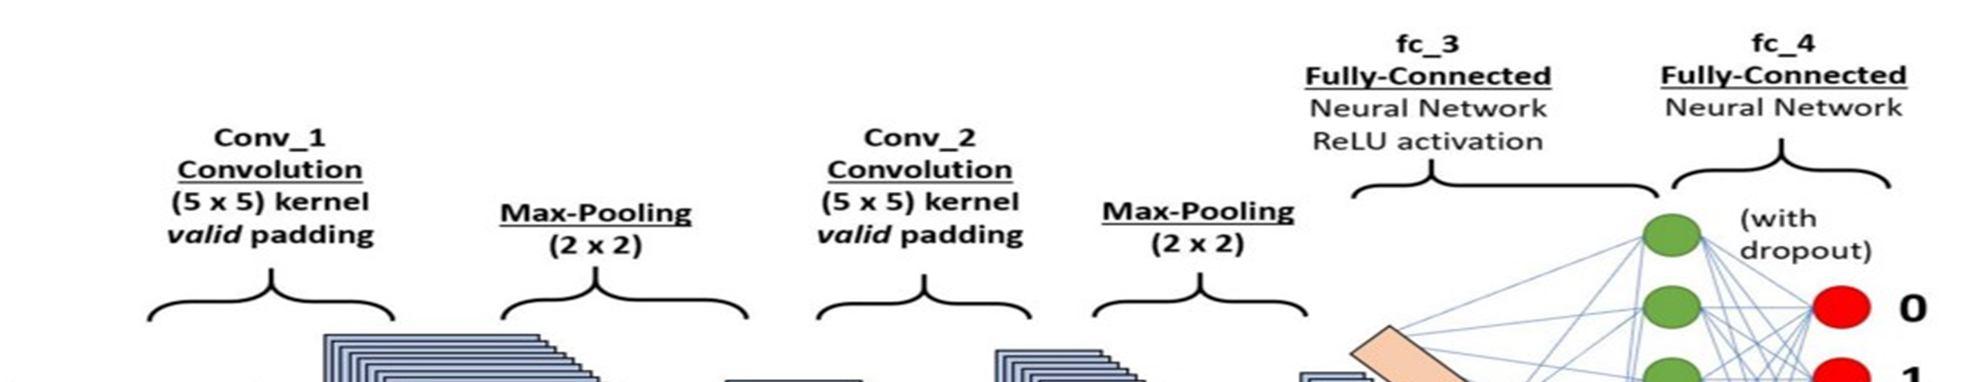
We have used Convolutional Neural Network or CNN for our project. A Convolutional Neural Network (CNN/ ConvNet) is a Deep Learning Algorithm that is mostly used for image processing. The pre-processing required in CNN is very less as compare to other Deep Learning Algorithms.
Any CNN model has 4 important layers –
Convolution Layer: It is the first layer in a CNN model. It has several filters that are used to perform convolution operations on an image. Here every image is considered as a matrix of pixel values.
ReLU Layer: It stands of Rectifier Layer Unit. This layer is responsible for performing element wise operations, by setting –ve values to 0.
Pooling Layer: In this layer, filters are applied in order to identify edges, bodies, corners, etc. It is a down-sampling operation that reduces the dimensionality of the feature map.
Fully Connected Layer: The final layer in the CNN model, a fully connected layer is nothing but an Artificial Neural Network where every nodes of one layer are connected to every node of the next layer.
1) Mathematical Model of CNN
CNN is a very simple model to understand theoretically, but there is maths involved behind the working of its each step –
Convolution Step: Convolution is a process where we take small matrix and transform it based on our values after passing over an input image. Its feature map values are calculated from the following formula –
Here, h = Kernel, f = Input Image, m & n = Rows and Columns of resultant matrix.
2) Padding Step: Padding is used to enlarge or shrink our image size, to desired size. This is done to ensure the image size of our input image is same as our output image. Padding should meet the following formula
Here, p = Padding, f = Filter dimensions.
3) Dimension of Output Matrix: The dimensions of the output matrix - taking into account padding and stride - can be calculated using the following formula –
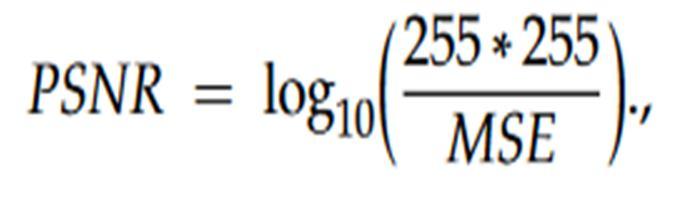
B. Peak Signal to Noise Ratio (PSNR)
Peak Signal to Noise Ratio (PSNR), Mean Square Error (MSE), Feature Similarity Index (FSIM)and Structural Similarity Index (SSIM). PSNR finds the quality of the final image.
Here, MSE is the Mean Square Error.
ISSN: 2321-9653; IC Value: 45.98; SJ Impact Factor: 7.538
Volume 11 Issue III Mar 2023- Available at www.ijraset.com
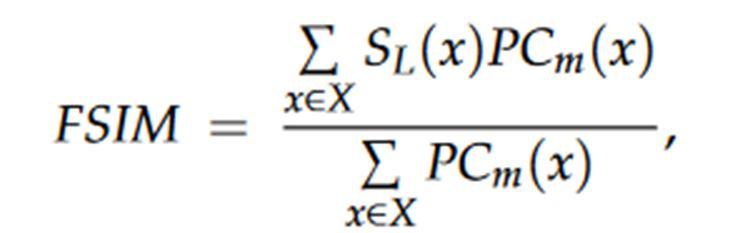
Here I(i,j) is the original image and I′(i,j) represents the thresholded image. PSNR and MSE are mainly used to analyze the quality of compressed and reconstructed image. SSIM measures the structural similarity between the source and final image while FSIM measures the feature similarity between the source and final image. There are two features that can be viewed in FSIM. They are Phase congruency and Gradient magnitude. Phase congruency (PC) is a dimensionless quantity which is significant in local structure map and is a primary feature in FSIM. PC is contrast invariant with no effect of contrast information on human visual system. Gradient magnitude (GM) is another important feature in FSIM. PC and GM are complementary to one another in describing the image local quality.
Here, x represents the whole image, SL(x) denotes the similarity in the two images and PCm is the phase congruency map. SSIM is calculated using Equation.
Here, μx and μy represents the sample means of x and y, respectively; σx and σy give the sample variances of x and y, respectively; and σxy describes the sample correlation coefficient between x and y and x and y are local windows in the input images.
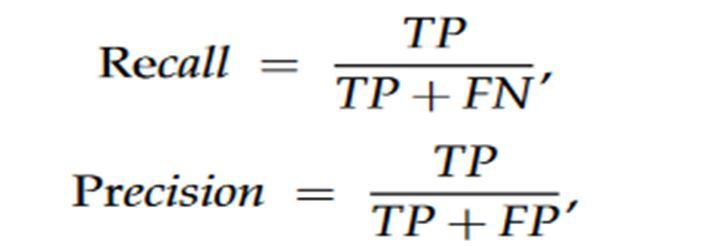
C. Precision Measurement
Precision is a measure of the number of positive class predictions that actually belong to the positive class. For an imbalanced classification problem having two classes, precision is the ratio of the number of true positives to the total number of true positives and false positives. For an imbalanced classification problem with multiple classes, precision is computed as the ratio of the sum of true positives across all classes to the sum of true positives and false positives across all classes. In an imbalanced classification, the distribution of data across the known class is biased.
F-measure is a parameter which decides the image accuracy.
The Bhattacharyya distance is a sum where the first part represents the mean difference component and the second part the covariance difference component.
They were used to assess the spectral separability of different land cover types and to select and evaluate important spectral bands for urban land cover mapping. The image processing and analysis was performed using a freeware program “MultiSpec”, designed for the processing and analysis of hyperspectral remote sensing datasets.


