1 minute read
Figure


Figure (1) shows the block diagram of the system under consideration in this system utility grid of 3 phase, 25 Kw, 50 Hz is connected to a hybrid microgrid To reduce the burden. Hybrid microgrid consisted of solar panel, wind power source, battery and various power electronics interfaces.Voltage at point of common coupling is 500 V at DC bus , power supplied by solar is 50 kW. Wind power source can supply 50 kW . Battery ( 30kW , 500 V ) is connected for the emergency conditions when there is no power available from PV source and wind power source then battery will share the power to the Load and utility grid depending on the mode of operation considered. AC load of 100 kW is connected to the AC bus.
B. Block Diagram of the System under Consideration under fault Condition at zone 1 (Near Solar Panel)
Advertisement
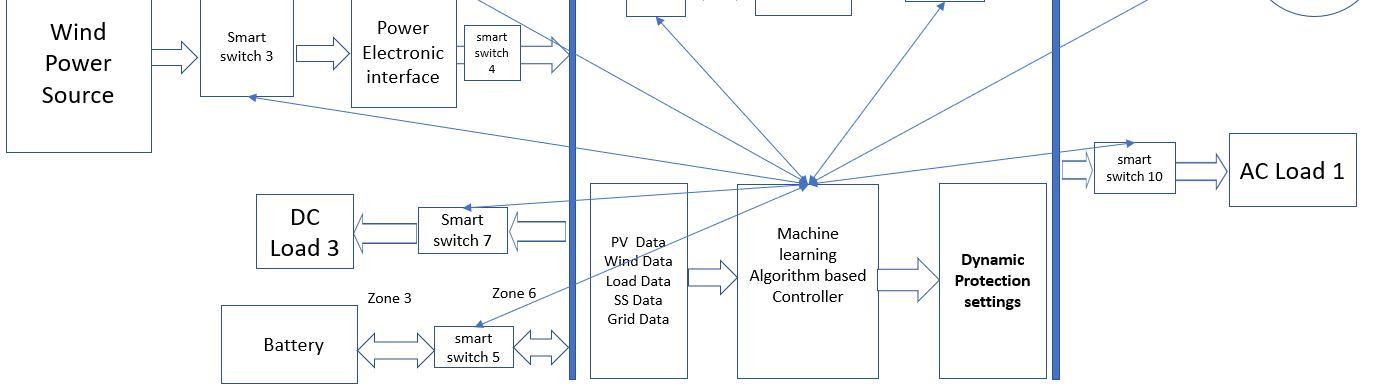
Figure 2
Based on the status of the microgrid received through monitoring devices, the protecting devices make comparison between the measured parameter and the operating curves set then provides trip signal. In this work, samples of current are taken and compared with the previous sample to check the error and to initiate the operation of the protective gears connected to the system to isolating the affected zone quickly.
III.SIMULATIONRESULTSANDCONCLUSION
A. Simulation Results and Analysis – Under Normal condition ( without fault) Analysis of the system under Normal and fault condition
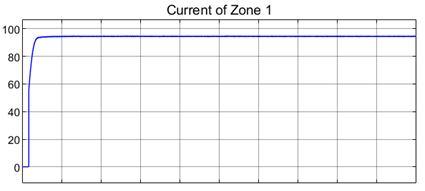
Figure 3 Figure 3 shows the current flowing through Zone 1 under normal conditions. the x-axis represents the time of simulation while the y-axis represents the current readings of the Zone in Amperes. The value of current takes about 0.03 seconds of simulation time to reach steady state value, of about 94-94A. Under normal conditions, where no disturbance or sudden change occurs in the system under consideration, the steady state value of current is maintained.