https://doi.org/10.22214/ijraset.2023.49301

11 II
February 2023
ISSN: 2321-9653; IC Value: 45.98; SJ Impact Factor: 7.538
Volume 11 Issue II Feb 2023- Available at www.ijraset.com

https://doi.org/10.22214/ijraset.2023.49301
ISSN: 2321-9653; IC Value: 45.98; SJ Impact Factor: 7.538
Volume 11 Issue II Feb 2023- Available at www.ijraset.com
Mrinmoy Dutta1 , Dr. Atanu Kr. Dutta 2
1M.Tech. student, Jorhat Engineering College, Assam
2Professor, Jorhat Institute of Science and Technology, Assam

Abstract: System Identification is an emerging area in the domain of structural engineering specially under structural health monitoring. For dynamic analysis or stimulation, the dynamic system parameters (i.e. natural frequency, mode shape, damping ratio etc.) are most important. Vibration data of actual structures are collected by different sensors. These data are analyzed with the help of different system identification technique to get inside view of the structure. This paper presents the synthetic vibration data generation of the model structure using Time History Analysis with the help of SAP2000 software. Time history analysis is performed on a cable stayed bridge. Joint acceleration, mode shapes, natural frequency etc. are found from this analysis. For system identification purpose the acceleration time history data of different locations are used to get the natural frequency of the cable stayed bridge which is a significant system identification parameter. This identification is done with the help of power spectral density (PSD) using MATLAB algorithm.
Keywords: System Identification, Time History Analysis, Power Spectral Density, Mode shape, Natural frequency
In recent years, as information technology can be easily used, system identification has become one of the significant methodologies used to understand the dynamic properties of civil engineering structures based on vibration data mainly earthquake responses. It potentially allows to detect and locate damage by studying the changes in the dynamic characteristics of a structure from an initial to a damage state. Hence, operational modal analysis using output-only response data is highly considered for identification of modal associated with natural frequency, damping ratio and mode shape in case of large structures. Modal parameters identified periodically can be considered for structural health monitoring (SHM). System Identification is the process of developing or improving a mathematical representation of a physical system using experimental data [2]. System identification is concerned with developing mathematical models from observed data, so it is a subject based on data science. It is at the core of all data-driven or measurement-based process operations, namely, design, control and monitoring where models play a critical role. An important application of structural system identification is health monitoring and assessing the structural integrity of aging civil infrastructure by the analysis of its vibration data.
System identification techniques play an important role in investigating and reducing gaps between the constructed structural systems and their structural design models, and in structural health monitoring for damage detection. It is recognized that the modalparameter system identification and physical-parameter system identification are two major branches in system identification [1]. To study a system for different purposes like, prediction, control, monitoring, design etc. a mathematical description of the system is required, which is called model. There are generally two approaches for model development – (i) a theoretical (first principles) approach that is based on fundamental law of matter and energy and (ii) an empirical approach that is based on analysis of observations (experimental or operating data). Now a days, the second approach is getting more importance due to its flexibility. The subject of system identification is concerned with the means and techniques for studying a process system through observed/ experimental data, primarily for developing a mathematical representation of that system [6]
Identification is the exercise of developing a mathematical relationship (model) between the causes (inputs) and the effects (outputs) of a system (process) based on observed or measured data. In the case of structural system identification, this can be done in the form of identifying structural parameters such as frequencies, mode shapes and damping ratio etc. A schematic diagram showing the system process is shown in Fig.1. The process of system identification is shown with the help of a schematic diagram is shown in Fig.2.

ISSN: 2321-9653; IC Value: 45.98; SJ Impact Factor: 7.538
Volume 11 Issue II Feb 2023- Available at www.ijraset.com
There are numerous methods in system identification. These methods are broadly classified as Input-output identification and Output-only identification. When both input and output signal of a system can be measured then we prefer to use Input-output Identification algorithm. In some cases, it may not be possible to record the excitation signal, then we prefer to use Output-Only Identification algorithm for identifying system parameters eg. Peak – Picking Method


Data generation and acquisition is the primary step in case of system identification process. Data are collected with the help of sensors. For bridge, sensors are places at pylon top, different locations of the deck etc. based on the fundamental behavior of the mode shape. In this work due to unavailability of sensor data, acceleration time history data of software are used as sensor data. Cable stayed bridge is modeled in SAP2000 software and acceleration time history analysis is performed to get the acceleration time history data of different locations of the structures. The details of the structures and location of data collection points will be discussed in data generation section. For input loading, earthquake excitation is used. As data at different times is required for identification, time history analysis is selected to stimulate the structures as dynamic loading case. Modal analysis is also performed on these structures using SAP2000 software to calculate the natural frequencies of the structures. To find the properties of the system these data are processed with the help of PSD using MATLAB algorithm. Peaks of the PSD plot indicate the resonating frequencies which are the natural frequencies of vibration of the structure.
A 2-D Cable Stayed Bridge is considered in this study. The model of the bridge is shown in Fig.3. The bridge consists of a concrete pylon, single plane fan type cables and a concrete deck. The length of the bridge is 252 m. The total length of the pylon is 56 m and the bridge deck is at 14 m above the pylon footing. The two ends of the bridge is supported by two hinges. The cable comprise of 6.4 mm diameter with an ultimate strength of 1600 MPa. The cables are anchored to the main girders at 18 m interval. The cables are connected to the pylon top at an interval of 3 m. Modal Analysis and Time History Analysis is performed on this structure considering 5% damping. The result of modal analysis in terms of natural frequency and mode shape and time history analysis in terms of joint acceleration are presented here. The positions of joints from where acceleration time history data are collected are shown in Fig. 3. Six different joints are selected in the bridge, two at pylon and 4 at deck level.
ISSN: 2321-9653; IC Value: 45.98; SJ Impact Factor: 7.538
Volume 11 Issue II Feb 2023- Available at www.ijraset.com
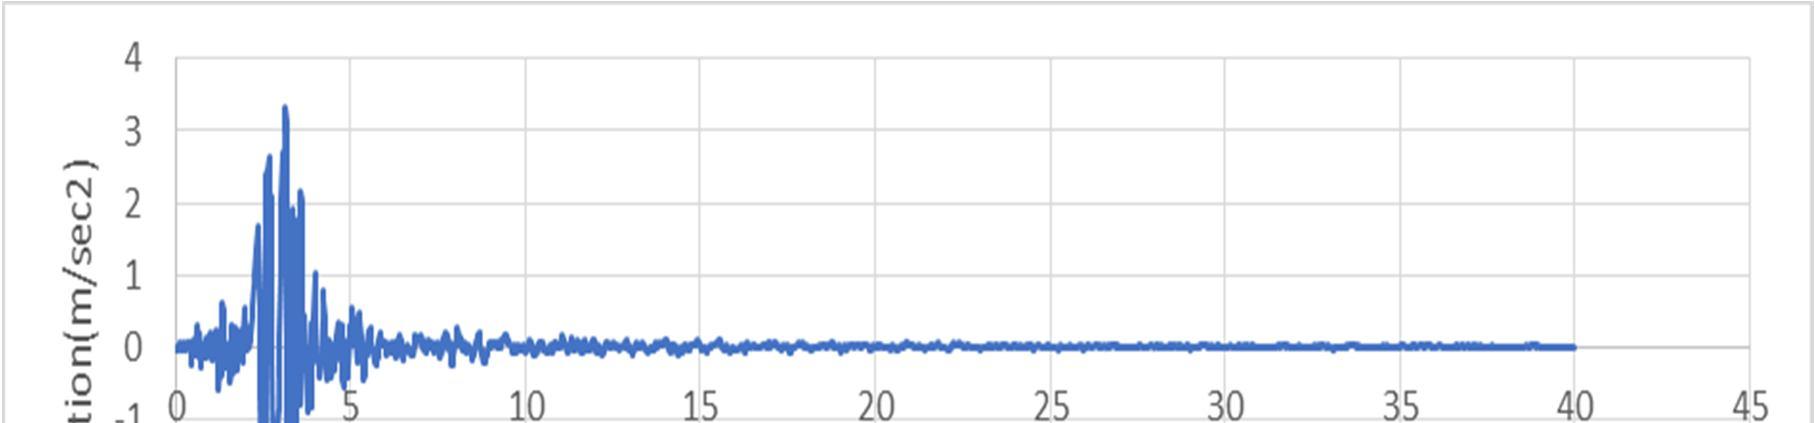
The input excitation used in the time history analysis is shown in Fig. 4.
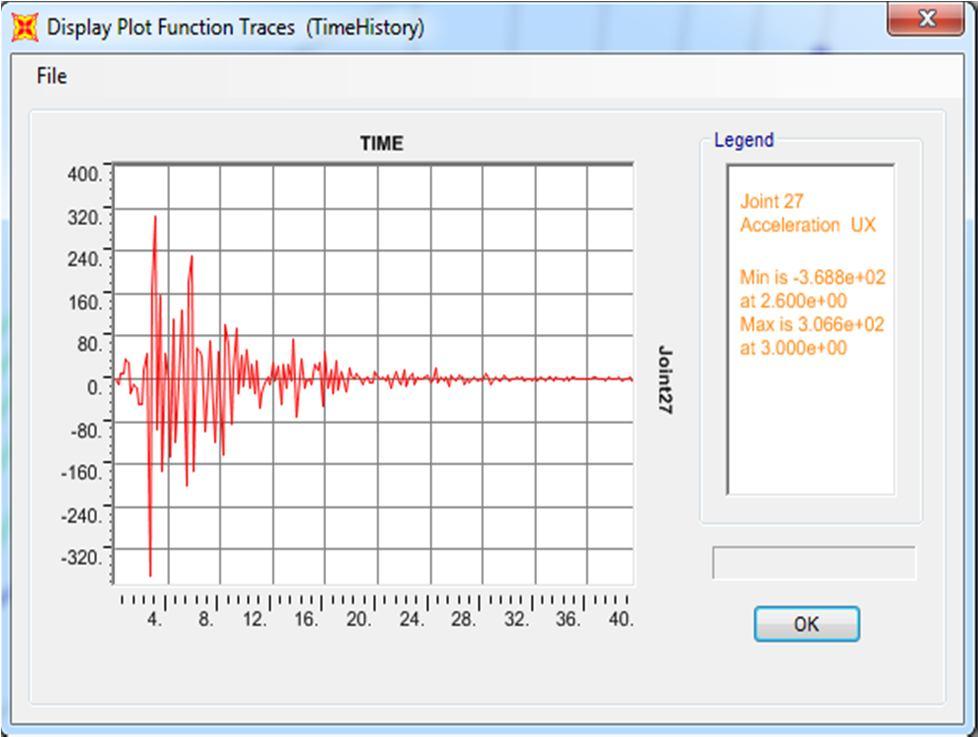
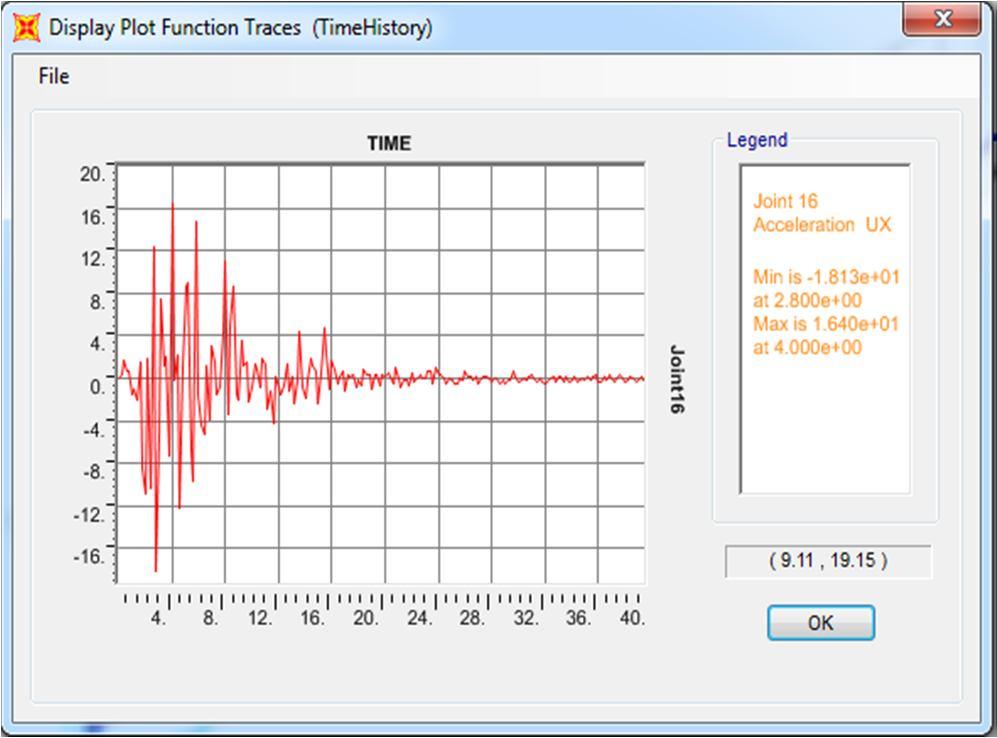
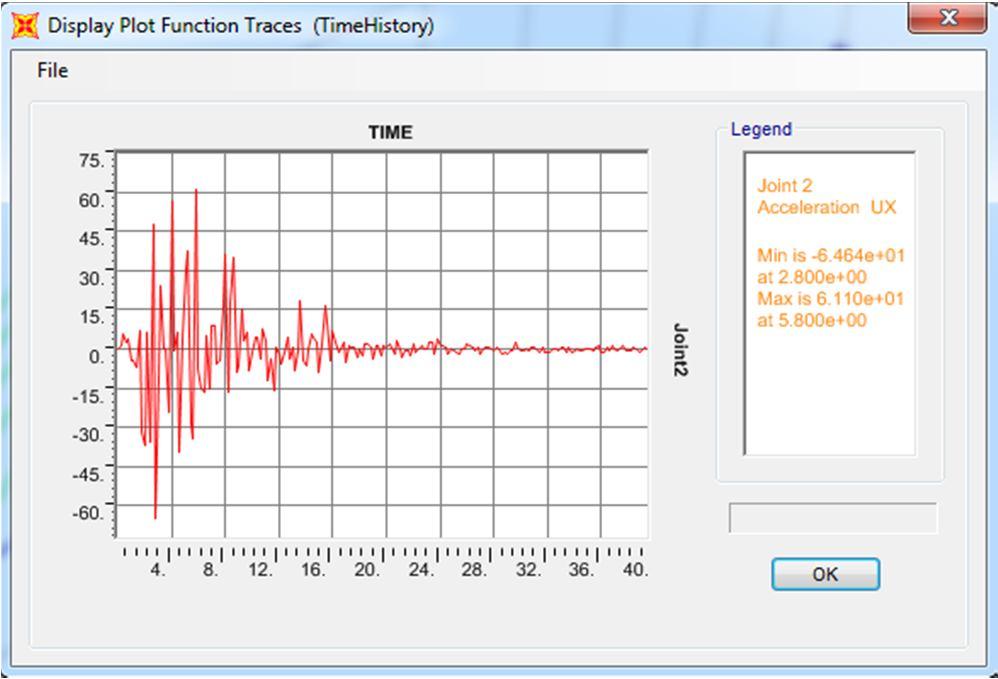
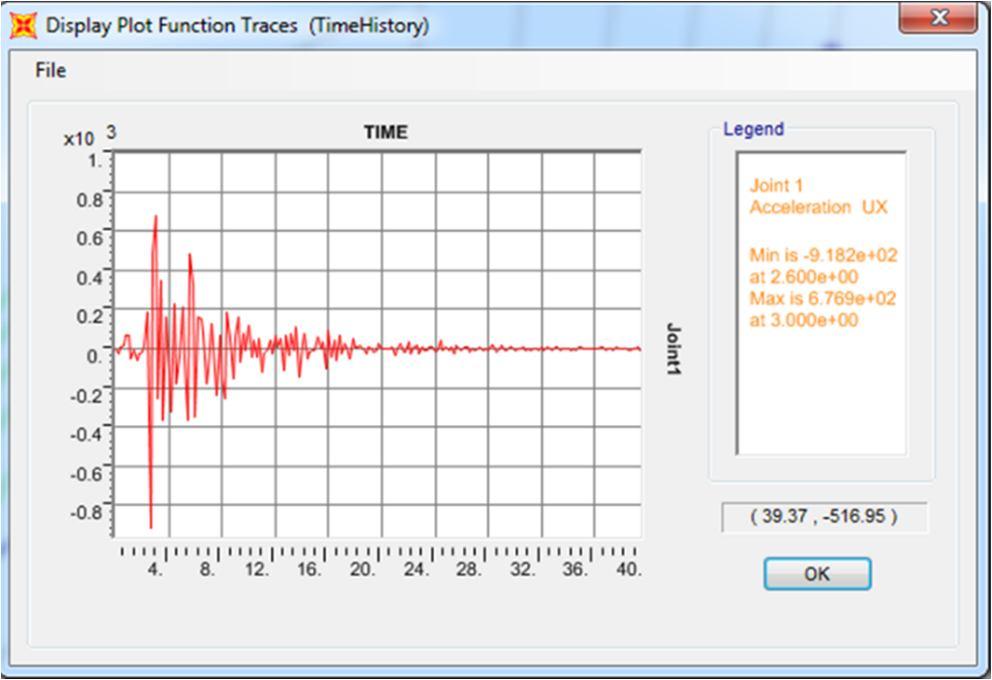
The collected joint acceleration time history data at different joints are shown from Fig. 5 to Fig. 8.

ISSN: 2321-9653; IC Value: 45.98; SJ Impact Factor: 7.538
Volume 11 Issue II Feb 2023- Available at www.ijraset.com
Modal analysis is performed on the cable stayed bridge using SAP2000 software to evaluate the natural frequencies. The evaluated frequencies of the cable stayed bridge are presented in the Table 1
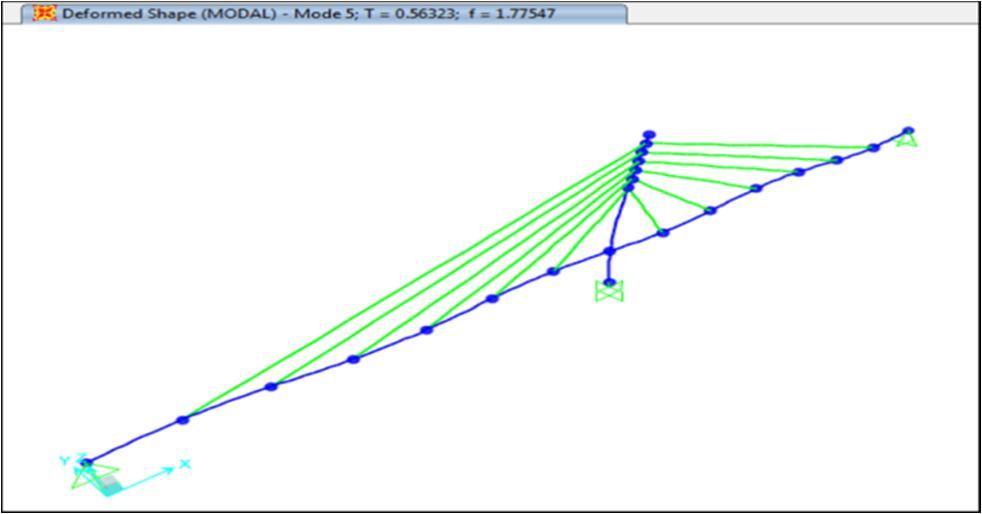
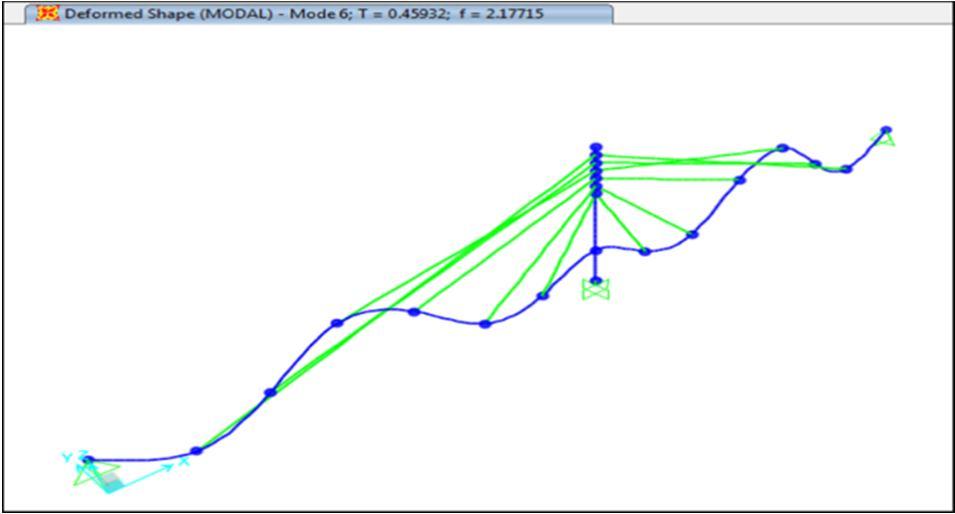
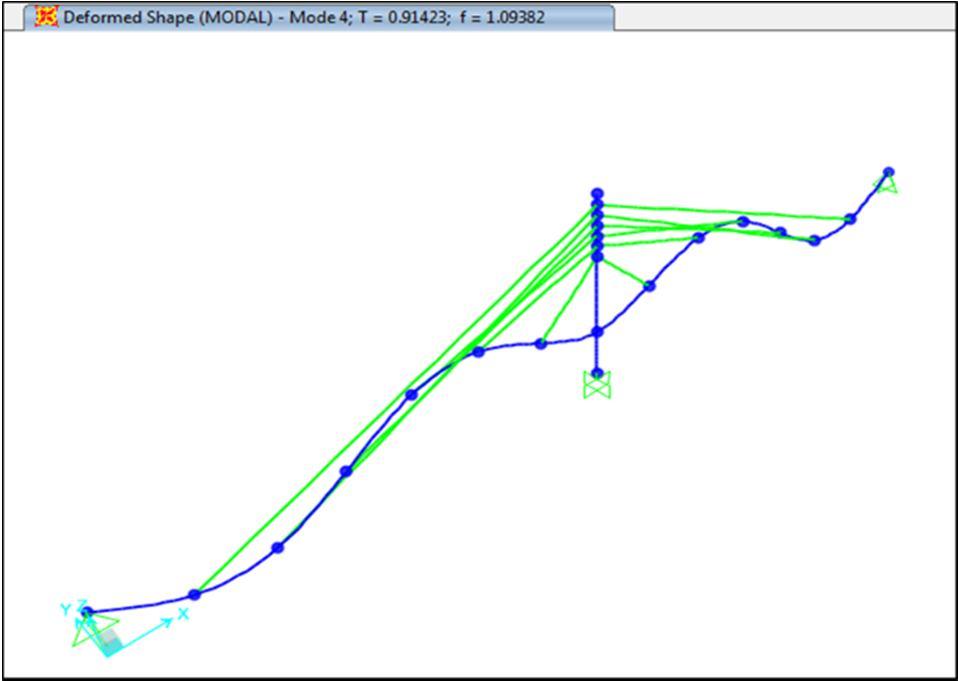
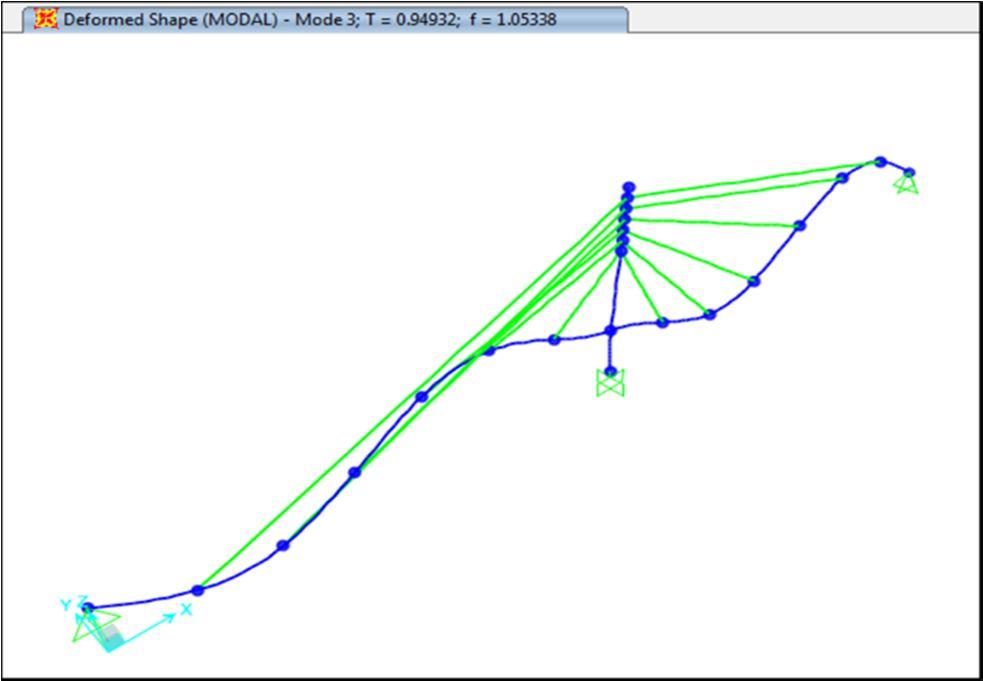
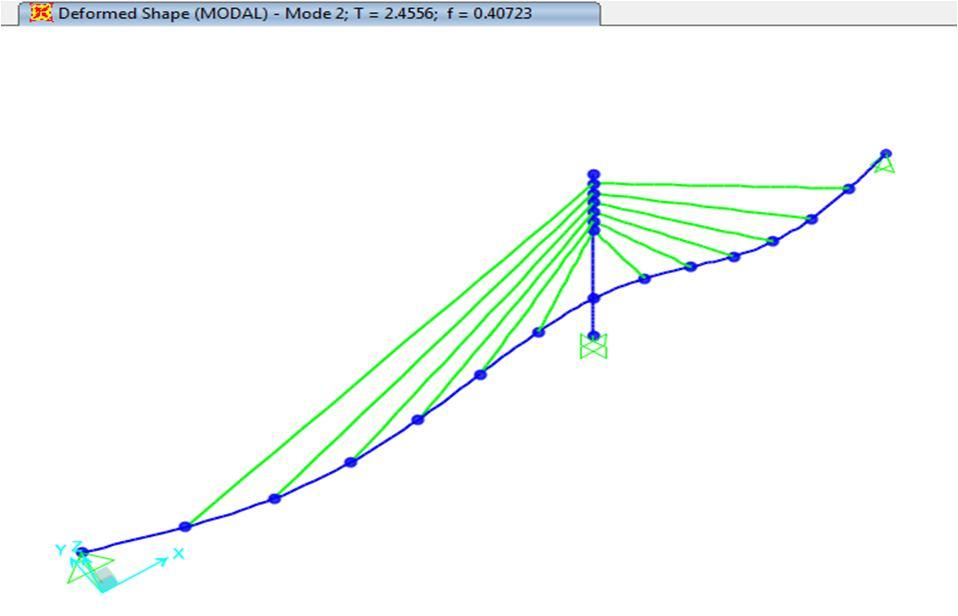
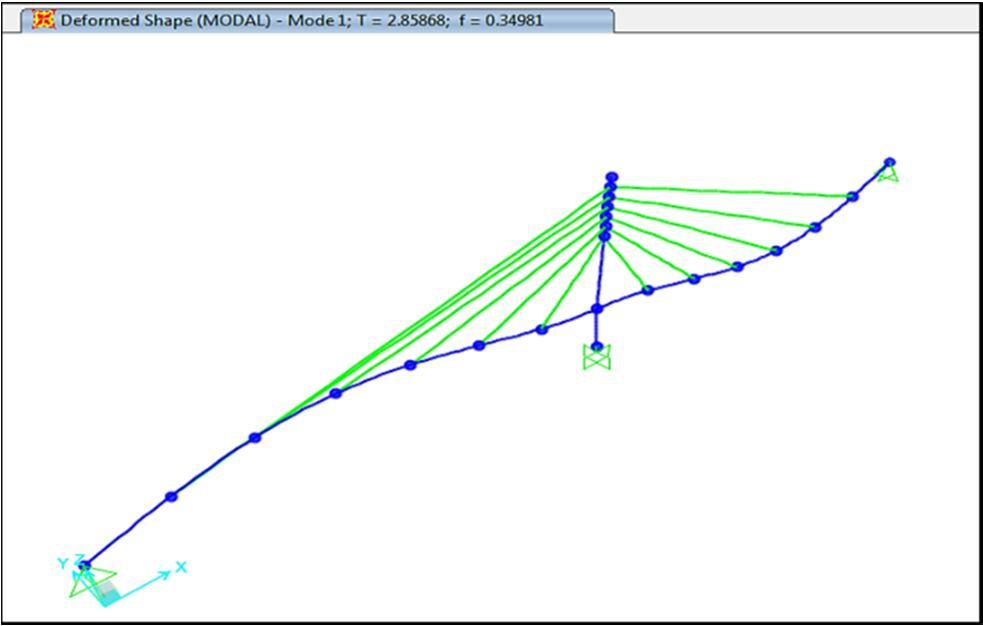
Table 1: Evaluated frequency of the bridge
The mode shape corresponding to the above mentioned modal frequencies are shown from Fig. 9 to Fig. 14
ISSN: 2321-9653; IC Value: 45.98; SJ Impact Factor: 7.538
Volume 11 Issue II Feb 2023- Available at www.ijraset.com
The acceleration data were collected at 5 Hz sampling frequency. PSD is performed on the generated data of different locations of the cable stayed bridge The PSD plot of the 6 locations are shown from Fig. 15 to Fig. 20


From the PSD Plot, it is seen that all modes are captured for the cable stayed bridge. But it is also seen that all modes are not identified in a single plot. So, it can be conclude that the position of sensors and no. of sensors plays an important role in system identification.

ISSN: 2321-9653; IC Value: 45.98; SJ Impact Factor: 7.538
Volume 11 Issue II Feb 2023- Available at www.ijraset.com
The comparative analysis of the identified frequencies and analytical modal frequencies are shown in Table 2.
Table 2: Identified frequency of the bridge
From the time history analysis of the bridge, it is seen that the first six natural frequencies are significant. In the identification, all the six natural frequencies are nearly correctly identified in the PSD plot. Again the considered 5 Hz sampling frequency is sufficient to identify the natural frequency upto 2.5 Hz i.e. the sampling rate should be the twice of the highest frequency. So, it is necessary to select the sampling rate in a wisely manner so that all the required frequency can be identified. Again, to identify a lower natural frequency, if higher sampling rate is used then it could not properly visible on the plot due to its resolution effect.
[1] Astroza,R.,Ebrahimian,H., Conte,J.P.andHutchinson,T.C.,“Systemidentificationofa full-scalefivestoryreinforcedconcretebuildingtestedontheNEESUCSD shaketable”,StructuralControlandHealthMonitoring,vol.23,Issue3,pp.535-559,2015.
[2] Au, Siu-Kui, “Fast Bayesian modal identification of structures usingknown single-input forced vibration data”, StructuralControlandHealth Monitoring, vol. 21,pp.381-402,2013.
[3] Caicedo, J.M.and Marulanda, J., “Fast mode identification technique for online monitoring”, STRUCTURAL CONTROL AND HEALTH MONITORING; vol.18,pp.416–429,2011.
[4] Caicedo, J.M., Dyke, J. S. and Johnson, E.A., “Natural Excitation Technique and Eigensystem Realization Algorithm for Phase I of the IASC-ASCE BenchmarkProblem:SimulatedData”,JOURNALOFENGINEERING MECHANICS,vol.130,pp.49-60,2004.
[5] Mustafa,S.,Debnath,N. andDutta, A.,“Bayesian Probabilistic Approach for Model UpdatingandDamage Detection for a LargeTruss Bridge”, International JournalofSteelStructures,vol.15(2),pp.473-485,2015.
[6] Nayek, R., Mukhopadhyay, S. and Narasimhan, S., “Mass normalized mode shape identification of bridge structures using a single actuator-sensor pair”, Structural Control Health Monitoring, 2018.
[7] Shrikhande,M.,FiniteElementMethodandComputationalStructuralDynamics,PHILearningPrivateLimited,2014.
[8] Zhan, J., You, J., Kong, X. and Zhang, N., “An indirect bridge frequency identification method using dynamic responses of high-speed railway vehicles”, EngineeringStructures,2021.
[9] Zhang, J. and Li, Q., “Identification of modal parameters of a 600‐m‐high skyscraper from field vibration tests”, Earthquake Engineering and Structural Dynamics,JohnWiley&Sons,Ltd.,pp.1-21,2019.