https://doi.org/10.22214/ijraset.2023.48996

11 II
February 2023
ISSN: 2321-9653; IC Value: 45.98; SJ Impact Factor: 7.538

Volume 11 Issue II Feb 2023- Available at www.ijraset.com

https://doi.org/10.22214/ijraset.2023.48996
ISSN: 2321-9653; IC Value: 45.98; SJ Impact Factor: 7.538
Volume 11 Issue II Feb 2023- Available at www.ijraset.com
Abstract: In traditional business marketing it was always done using conventional methods to do product or service marketing like newspaper and billboards etc. This has limitation i.e. it was limited to only particular geographic or any particular area The business was not able to explore the vast area or was not able to connect to its audience but this changed completely with the invention of internet. In this paper we will discuss how changing and evolving technology has changed the face of marketing and made it user friendly at the same time gave business the global exposure .With the advancement of technology one can see tremendous growth in business, healthcare, defence, banking sector and many other departments. The internet played an important role from connecting business globally to providing efficient solutions to the process and methods of business management. The use of internet lead to vast generation of data in various form like structured data and unstructured data, which in turn helped business to use data driven technology to grow business globally This aspect can be termed as Digital Transformation. The definition: Digital transformation is the process of using digital technologies to create new or modify existing business processes, culture, and customer experiences to meet changing business and market requirements. This reimagining of business in the digital age is digital transformation.
The business in digital age uses various technologies like cloud, AI, Machine learning and which can be used in B2B marketing platform. B2b as the name suggests its direct marketing of the product or services to other business or organizations.
Keywords: B2b Business, marketing, AI and ML, digital transformation, Big data, Predictive analysis.
B2b marketing uses collection of marketing techniques to business buyer. The main goal to improve lead quality, sales acceptance of leads and conversion rate. As discussed before internet is first technology boon to marketing growth which in turn gave birth to Big Data. What is Big Data? Big data is large volumes of data as structured as well as unstructured. Big data analytics uses large amount of data to find hidden patterns, correlations and other insights which can give meaningful outcome to plan marketing strategies. The traditional Data warehousing technologies provided slower and less efficient solution ‘snow have been largely displaced by Big data technologies and machine learning algorithms. AI and ML uses technical capabilities to perform the classification, cross-referencing, correlation and action inferencing. The two broad categories of data are studied in data analyticsCustomer Data and Enterprise Data.
The business uses enterprise-wide standard data structure model, so that all data are sets are easy to collect, sort, compare, contrast and interpret the result based on analytics, But , not all data can be structured so in order to increase the data consistency and veracity , the marketing analytics must also collect the customer data and segregate key customer data types as following :

1) Personal demographics data such as name, age, address, email, education, income and marital status.
2) Behavioural pr psychographic data as personality, attitude and social needs. This customer data must be available with enterprise for millions of customers. This data ais then converted into Enterprise Intelligence data as given below:
1) Customer Intelligent Data: Past purchase, Acquisition model, lifetime value.
2) Market Segmentation Data: Upsell/Cross sell, campaign response
3) Logistics Data: Sales forecast, lead generation, channel efficiency.
With this emerging trends of Big Data there is big need for automation in B2B industry. there are many technology used such as SMAC(Social, Mobility, Analytics and Cloud) and Big Data platforms. Here we will see the approach of AI and ML using Big data for prediction and classification data .
ISSN: 2321-9653; IC Value: 45.98; SJ Impact Factor: 7.538
Volume 11 Issue II Feb 2023- Available at www.ijraset.com
The term Artificial intelligence means a technology that mimics human intelligence and can carry out huge range of human capabilities such as voice recognition and image recognition and web search prediction. Machine learning itself is an application of AI which automatically learn and improve from experience and heuristic data.AI marketing approach is analysing huge data using neural network algorithm and data techniques.
Regression Analysis is used to predict the sales forecast foe the b2b marketing. Here we will see the example of it. This is a method that is well suited for forecasting sales of established products or services. Digital transformation is the process of using digital technologies to create new or modify existing business processes, culture, and customer experiences to meet changing business and market requirements. This reimagining of business in the digital age is digital transformation.
Now lets see an example of Regression Analysis in Machine learning using R Studio. Lets use the predictive model to predict Sales based on the advertising dataset. The dataset contains the advertising expenditures on 3 different platforms: TV, Radio and Newspaper and the corresponding Sales Volume generated.


Sales Volumes were recorded in thousands of units and the expenditures on advertising were recorded in thousands of dollars. In machine learning, the task of predicting numerical values, such as Sales, is also known as Regression Through this machine learning project, we will attempt to answer a very common business question:
“How much Sales can we expect to generate if we spend a given amount of money on each advertising platform?” For this purpose we have to Load the libraries that are needed for predictive analysis . Next step is is exploratory data analysis, here, we will explore the data
For code in R its as given below:
#load dataaset
df <- read.csv("advertising.csv")
#preview data
head(df,15)
ISSN: 2321-9653; IC Value: 45.98; SJ Impact Factor: 7.538
Volume 11 Issue II Feb 2023- Available at www.ijraset.com
After the exploratory data analysis we have to clean the data find and remove missing values and NA’s from the data. The next step is to get the summary of the data.
summary(df)
In machine learning, a commonly used technique to evaluate our models is known as the Validation Set Approach. In general, the machine learning process under this approach will be as follows:
1) We will split the dataset randomly into 2 parts: the Training Set and the Testing Set as illustrated below. Typically, as a rule of thumb, we will use 70% of our data as the Training Set and the remaining 30% as our Testing Set.
2) We will then build our model using the Training Set by excluding data from the Testing Set during the model building process.
3) After building the model with the Training Set, we will then attempt to use this model that we have built to predict the values in the Testing Set.
4) We will then measure how far off our predictions are as compared to the actual values in the Testing Set. This will give us a basis to measure the prediction accuracy of our model on “unseen” data
Split Data: Next step is split the data:

#for reproducibility
#otherwise different parts of the data will be assigned to training/testing set every time we run the code set.seed(11)
#These are the indices of df that you will use as training and testing sets
#train set, which we set as 70% of the total dataset train <- sample(1:nrow(df), 0.7*nrow(df))
test <- (-train)
Now that we have our training set, we can start building our machine learning model. As mentioned previously, we will be using a Regression model for our task. More specifically, we will be using the Multiple Linear Regression model in this instance.
Well, the intuition behind Linear Regression is simple. Basically, we want to create a “best-fit” line based on our dataset, as illustrated by the diagram below, where we try to “fit” the red line to our data points, which are the scatters in black.
You might also wonder, how do we define the “best-fit line” then? Well, the term for this is known as the “least-squares method”, where we are obtaining the line which minimizes the sum of squared residuals
ISSN: 2321-9653; IC Value: 45.98; SJ Impact Factor: 7.538
Volume 11 Issue II Feb 2023- Available at www.ijraset.com
Mathematically, the formula for the sum of squared residuals can be expressed as:

It may sound very technical, but it actually isn’t.
A residual is simply the difference between our prediction (Yi hat in the equation above, which is also a point on the regression line) and the actual Y value (Yi in the equation above). Therefore, each residual is simply the vertical distance between a scatter and the regression line (as illustrated by the arrows in the diagram above). Also, we “square” the residuals so that negative differences do not cancel out positive differences. We then sum them up to get the sum of the squared vertical distances. Lastly, we will use the line which minimizes the sum of the squared “vertical distances”, which is actually a “best-fit line”.
We will then obtain a regression line with an equation that looks like the one below, where the “X” variables in the formula each represents a variable that we are using to predict “Y”. In our case, our “Y” variable is Sales Volume and our “X” variables are the advertisement expenditures on TV, Radio and Newspaper platforms
Fortunately, with the functions in R, we do not need to calculate the residuals and fit the regression line manually. R will be able to do this for us.

With that said, let’s fit the regression line to our training dataset, using all variables in our dataset as predictors. From our model results, we can see that all our variables except Newspaper are significant predictors of Sales, as seen from the P Values of each variable (the column with the header “Pr(>|t|)”) in the table below. Therefore, we will create another Linear Regression model without the Newspaper variable.
lm.fit <- lm(Sales~., data=df, subset=train) #subset = train means you only extract the index from train summary(lm.fit)

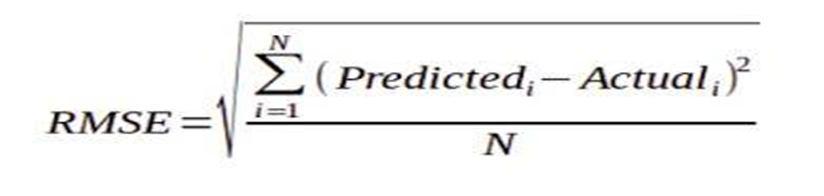
We can also compute the Training Error of our model, using the Root of Mean Squared Error (RMSE) metric. RMSE has the equation below. It basically tells us, on average, how far away are our Sales predictions from the actual Sales Volumes
ISSN: 2321-9653; IC Value: 45.98; SJ Impact Factor: 7.538
Volume 11 Issue II Feb 2023- Available at www.ijraset.com
We have computed the RMSE on our Training Set as 1.63. Therefore, we can say that, on average, for the Training Set, our predicted Sales Volumes are 1.63 thousands away from the actual Sales Volumes
rmse_train <- RMSE(predict(lm.fit1, df)[train], df$Sales[train])
rmse_train
## [1] 1.634244
Now that we have our model (“lm.fit1”), we will now use the model to predict the Sales numbers in the Testing Set. From this, we will be able to evaluate the prediction accuracy of our model as we are making predictions on “unseen” data from the Testing Set. We will compute the RMSE of our Testing Set predictions to evaluate our prediction accuracy. Based on the RMSE we have calculated, we can say that, on average, for the Testing Set, our predicted Sales Volumes are 1.69 thousands away from the actual Sales Volumes, not too bad considering that the Median Sales Volume in our dataset is 16 thousand units.
rmse_test <- RMSE(predict(lm.fit1, df)[-train], df$Sales[-train])
rmse_test
## [1] 1.685202
Now that we have our model, we can also predict Sales Volumes in the future, given the advertising amount that we are going to invest.
For example, let’s assume we would like to spend 15 thousand dollars on Radio advertisements and 15 thousand dollars on TV advertisements. Since our model did not include Newspaper advertisement spending as a predictor, we do not need it to predict Sales Volume.
The code below will allow us to predict the Sales Volume generated from the corresponding advertising investments. We see that the model has produced the predicted Sales Volume of 6.88 Thousand Units
predicted <- predict(lm.fit1, data.frame(TV=15, Radio=15))
print(paste0("Predicted Sales Volume = ",round(predicted,2)," Thousand Units", sep=""))
## [1] "Predicted Sales Volume = 6.88 Thousand Units"
this short machine learning example demonstrates how we can make use of seemingly simple models, such as Linear Regression, to make forecasts and address business questions. We managed to answer the business question of “how much Sales can we expect” with the use of a very simple model.
This is how machine learning can be used in B2b marketing.
As discussed before how A=digital transformation can lead to automation of marketing process using
1) AI Generated Digital Content Curation: This technique is useful in creating real time awareness and customer acquisition content with reports on regular data focused events.
ISSN: 2321-9653; IC Value: 45.98; SJ Impact Factor: 7.538
Volume 11 Issue II Feb 2023- Available at www.ijraset.com
2) Voice Search and Content Chatbot: In this the machine interprets the customer’s natural language words and convers, the speech search request on the internet and then AI and ML powered content is automatically contextualized to the customer engagement and shown on Chatbots.
3) Lead scoring and Propensity Modelling : Propensity Modelling is AI technique in which specific machine learning algorithm are fed with large amounts of historical data and using this AI software returns the most accurate prediction f customer and market behaviour.
4) Dynamic Pricing: In industries that typically involves large number of frequent transaction where demand and market fluctuates ,customers are ready to pay dynamic pricing.
In summary the biggest advantage Data analytics provides B2b marketers is the powerful combination of technology like AI/ML based predictive Models and large datasets of millions of customer records. Finally the 24 * 7 cloud infrastructure providing Big Data storage boosts the overall performance to near real time and rich customer insights analytics for engaging business and customers.
[1] RPubs - Sales Prediction with Machine Learning
[2] B2b Marketing Text and Cases.