https://doi.org/10.22214/ijraset.2023.48601

11 I January 2023
ISSN: 2321-9653; IC Value: 45.98; SJ Impact Factor: 7.538
Volume 11 Issue I Jan 2023- Available at www.ijraset.com

https://doi.org/10.22214/ijraset.2023.48601
ISSN: 2321-9653; IC Value: 45.98; SJ Impact Factor: 7.538
Volume 11 Issue I Jan 2023- Available at www.ijraset.com

Abstract: The dielectric behaviour and molecular structure of metal complexes Cu(II),Ni(II) and UO2((VI) of the ligand oxaloanilic acid hydrazine have been investigated using Time Domain Reflectometry (TDR) technique in the frequency range 10 MHz to 10GHz. Cole-Davidson model has been applied for fitting the complex permittivity spectra [ ε*(ω)]. The parameters εs –the static permittivity, τ- the dielectric relaxation time are evaluated at different temperatures from 2880K to 3330K and are discussed in respect of their molecular structural behaviours. The thermodynamic parameters, such as ΔH* - molar enthalpy, ΔS* - the molar entropy are obtained using Eyring.s rate equation. In the light of such data the possible structures of the present complexes are discussed.
Keywords: Dielectric , Time Domain Reflectometry


The knowledge of dielectric relaxation and static permittivity leads to understanding of the geometrical changes within the molecules. Hence, by knowing indirectly interfacial polarization, counterion moments and spatial changes in the domain size[1] of the molecules, it would be possible to speak of the structural behavior of the molecules.
The authors have undertaken the experimental study of evaluating dielectric parameters with the present metal complexes of ligand oxaloanilic acid hydrazone belonging to azo methane group chelates [2,3] under Time Domain Reflectometry (TDR) described elsewhere [4,5]. In addition, for understanding more of the dielectric behavior of the complexes, the required dipole moments have been evaluated in conjunction with which the structures [6,7] are discussed.


The metal complexes were prepared by using the methods reported elsewhere[8]. The prepared compounds were crystallined repetitively from ethanol for purity and the same were checked by elemental analysis. The solution was prepared with commercially available DMSO of 99% pure EMARCK BDH AR reagents grade chemicals were used grade, just before recording the TDR spectra. Mixtures of various compositions were done by appropriate weight fraction of the complexes weighed in Zurich- Mettler balance at room temperature (300±10K).


ISSN: 2321-9653; IC Value: 45.98; SJ Impact Factor: 7.538
Volume 11 Issue I Jan 2023- Available at www.ijraset.com
A Tektronix 7854 sampling oscilloscope with 7512 TDR unit has been used. The sample was placed in the standard military application cell (SMA) of 3.5mm and 1.52mm outer and inner diameters respectively, having the pin length 1.28mm. Its effective pin length due to fringing effect of the field was found to be 1.35mm. A time window of 5 ns was used for all such measurements. The records of permittivity spectra were obtained by using bilinear calibration method. In TDR the pulse reflected from cell without sample R1(t) is compared with pulse reflected from the cell with the sample Rx(t). These two pulses were digitized with 1024 sampling points in the selected time window of 5 ns. The two pulses are subtracted and added in the oscilloscope memory and are transferred to PC/XT, via GPIB to Fourier Transform and data processing. The permittivity spectra ε *(ω) = ε’ - j ε” were determined by using bilinear calibration method [9]. The dielectric parameters have been fitted by Debye expression [10] using nonlinear least squares fit method. Using standard experimental techniques, the measurement of refractive indices was carried out at optical frequency on a set of graded concentrations of the solute in the solvent DMSO at room temperature. Density measurements were done with the method described elsewhere.
The dielectric measurements were carried out as a function of temperature on a set of graded concentrations (weight fraction) of the metal complexes in DMSO, a non-associative polar liquid as solvent. The complex permittivity spectra ε*(ω) were fitted to ColeDavidson equation using nonlinear least squares fit method as described elsewhere to obtain dielectric parameters.
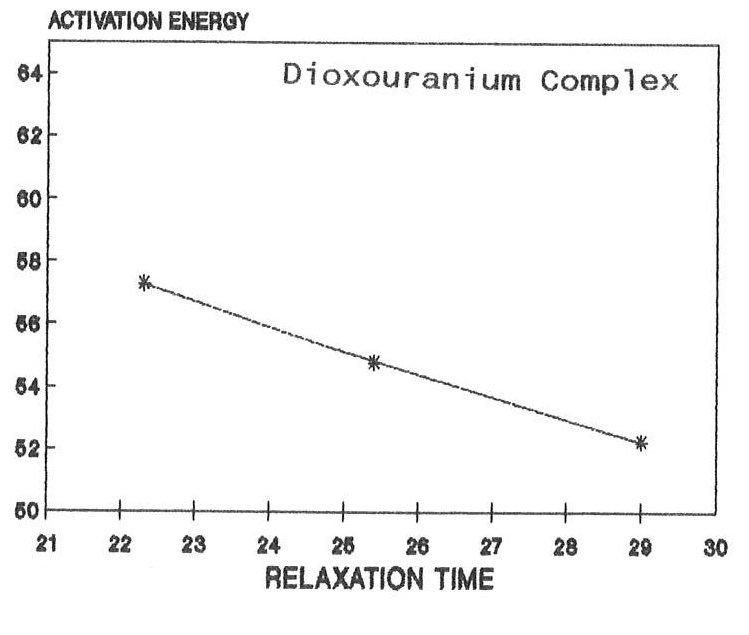
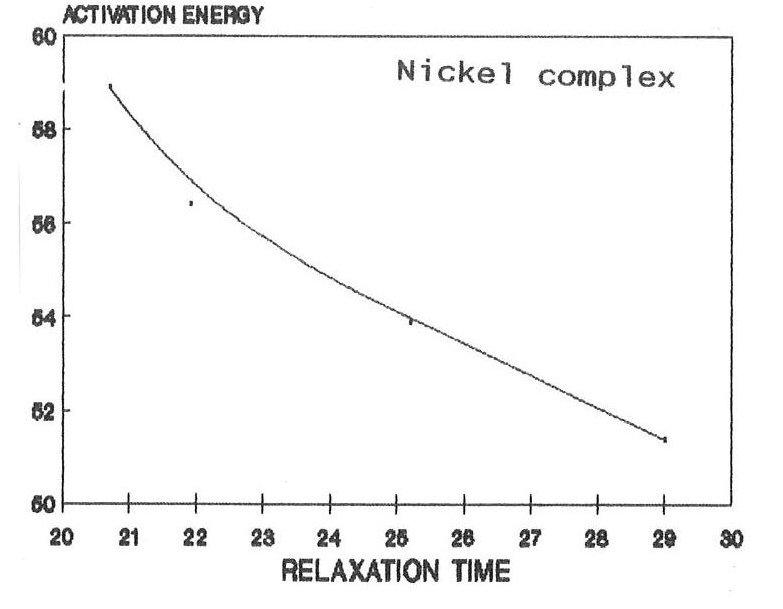
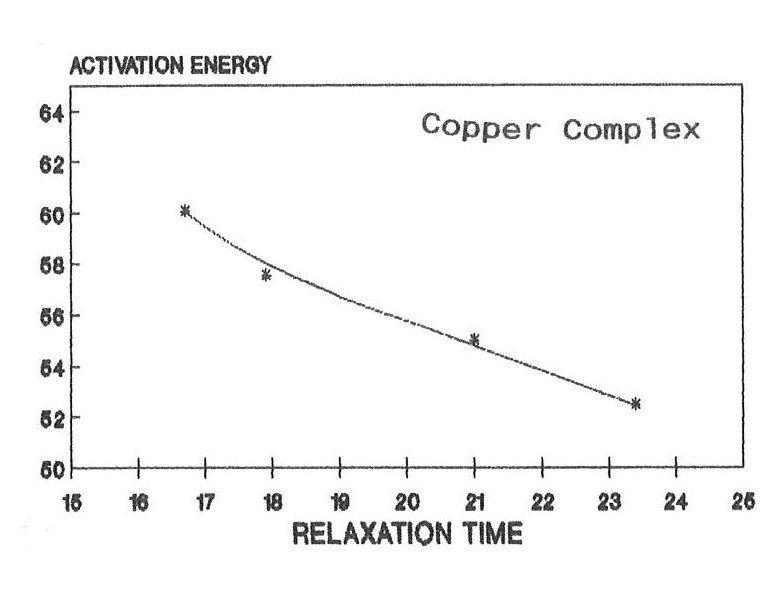
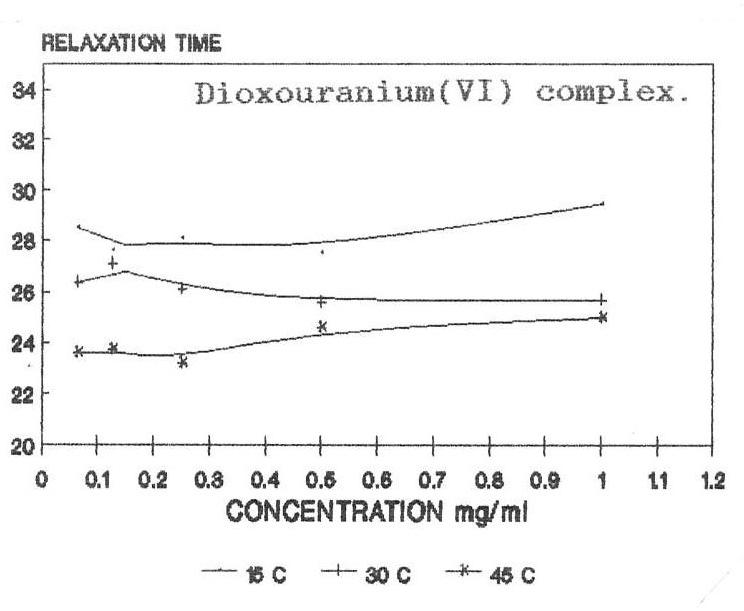
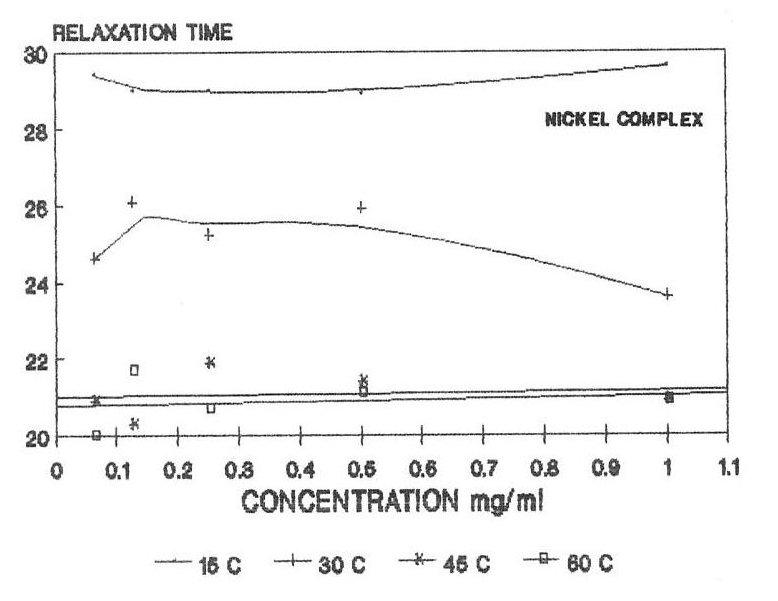
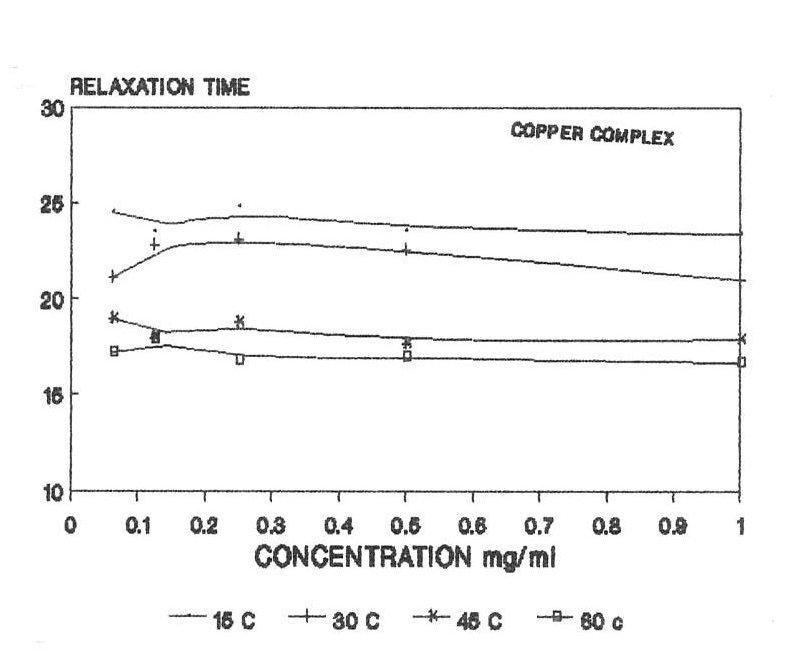
The raw and corrected spectra of the complexes are represented graphically in figs1 (a) to 1(c). The evaluated parameters εs and τ for various compositions of mixtures at different temperatures are entered in Table 1-3. The calculated molar enthalpy of activation ΔH* E (Eyering) and ΔH* A (Arrhenius) and molar entropy ΔS* E (Eyering) and Gibb’s Free energy of Activation ΔG* are also entered in the same tables 1-3. The graphical representation of the variation of relaxation time (τ) versus concentration (C) and variation of Gibb’s free energy of activation (ΔG*) versus relaxation time (τ) as against concentration 1.0 gm/cc has been shown in figs.2(a) to 2(c) and 3(a) to 3(c) respectively. The refractive indices are given for various concentration in tables 1-3.
Dipole moments have been evaluated at room temperature using following equation, by taking parameter h- 6.8 with the calibrated μ of DMSO.
Comparision between raw spectrum ϱ *(Ѡ)and corrected dielectric spectrum є *( Ѡ)for complexes (0.25 mg/ml concentration ) at 300
ε0 - ε∞ (M/m) = 4 ∏ N h µ2/9kT
For calculating radius of the molecule, Debye expression has been used. These were calculated at different temperatures as against concentration 1.000/cc.
The electric dipole moment of metal complexes, namely Cu (II), Ni (II), and UO2(VI) are emerged as 35.83D, 68.59 D and 98.3 D and Guggenheim 35.607 ,67.734, 96.915 respectively. Although these values are large as compared to the values by using Guggenheim [5] equation, such large values are reported in the literature [11] for polymers, obtained in both polar and non polar solvents. These observed/calculated values of the dipole moments may be taken as indicative of the fact that the present complexes are associated values of dipole moment, in general which in turn may be as suggestive of having tetrahedral structure. Our XRD study on these complexes almost has confirmed this fact.
In the present investigation, observed relaxation time seem to vary for all the present metal complexes with the temperature for a particular concentration. From the tables 1-3, it is clear that the relaxation time decreases as the temperature increases which is in accordance with the Debye equation.
ISSN: 2321-9653; IC Value: 45.98; SJ Impact Factor: 7.538
Volume 11 Issue I Jan 2023- Available at www.ijraset.com
In view of the above facts, keeping τ =24.6 ps to be the relaxation time for DMSO at room temperature, it may be said that either the solute-solute interaction play a role in such a way as to make reorientation of the dipoles more easier or that the τ value of solute is shorter compared to that of solvent DMSO molecule. But, the latter case is hard to justify since the solute molecules are much heavier than the solvent DMSO molecule, thus expecting a large τ for the solute molecule. Hence, it can be said that the observed dielectric absorption may be due to both inter- as well as intra- molecular rotations i.e, it may be due to overall rotation of the molecule.
It is suggested in the literature that a benzene compound studied in benzene solution has a value of τ in the range of 8 to 16 ps [12,13]. Taking this as a crude guideline, one can expect at least about 32 ps in the case of present complexes as those contain four benzene rings in their configurations. As the observed values do not agree fully with expected ones this may be partly due to the fact that presently used solvent is a polar one. However, the authors feel that they are of the right order of magnitude.
From the tables 1-3, it is found that ΔH* varies in accordance with the concentration. The negative values of ΔS* in all concentrations may indicate a more ordered molecular state. As noted in the literature, ΔG*, the Gibb’s free energy of activation and τ, relaxation time are dependent on temperature. Hence when the temperature increases there should be increase in Gibb’s free energy of activation, this makes the molecule oriented in a shorter time. As a result the relaxation time decreases, The same trend has been observed in the present complexes. The dielectric relaxation parameters for the present metal complexes have been determined at various temperatures by using the time domain reflectometry. For making these parameters more reliable, the method of calibration process based on the least squares fit has been used. As the solvent DMSO molecule is much smaller than the present solute molecule, it is very much difficult to pass a remark regarding the outcome of smaller values of relaxation time in the present findings. However, under the existing circumstances, it can be said that the observed dielectric absorption may be due to both interas well as intra- molecular rotations and as such the present result may be argued on the basis of taking into consideration the overall rotation of the molecule. Further, the mismatch of τ with the expected one (32 ps) may be due to the polar solvent DMSO molecule. In arguing these values, more stress has been put on their trend as they are found to be in right order of magnitude. Depending on the negative characteristics of ΔS* The molar entropy of activation, a more ordered molecular state has been emphasized. The dependence of the Gibb’s free energy of activation, ΔG* and relaxation time τ on the temperature has been established with the present findings
ISSN: 2321-9653; IC Value: 45.98; SJ Impact Factor: 7.538
Volume 11 Issue I Jan 2023- Available at www.ijraset.com
ISSN: 2321-9653; IC Value: 45.98; SJ Impact Factor: 7.538
Volume 11 Issue I Jan 2023- Available at www.ijraset.com
Variation of relaxation time with concentration of complexes
[1] V.A.Kogan,S.N.Sheherbak and O.A.Osipov,Zh,Obshch.,41,165(1971).
[2] V.A. Kogan, S.N.Sheherbak and O.A.Osipov,Dokl,Akad,Nauk. SSSR,199, 384(1971); Zh.Obsch.Khim., 41,382(1971);
[3] S.Sorrriso,Chem.Rev.,80,313(1980).
[4] V.A.Kogan,S.N.Sheherbak and O.A.Osipov and 7.A.Zhuehenko, Zh.Obsch.Khim.,38,1607 (1968).
[5] A.D.Garnovskii, O.A.Osipov and V.I.Minkin,” Spravochnik po Dipol’nym momentum” Reference book on Dipole moments, Izv,VysshaShkola.Moscow (1971)
[6] A.L.McClellanm,” Tables of experimental Dipole moments” Rachara Enterprises E1 cerrito, CA,Vol-2 (1974).
[7] J.A.Jahagirdar, B.G.Patil and B.R.Havinale, Ind Jour.Chem., 29(A),924 (1990).
[8] A.C.Kumbharakhane, S.M.Puranik and S.C.Mehrotra, J.mol, Liquids 1992,51,261. J.Mol.Liquids,50,143 (1991).
[9] H.A.Samulan,Proc,IRE., 39,175 (1951).
[10] R.H.Cole and D.W.Daviddson, J.Chem,Phys.,19,1484(1966).
[11] K.Higasi,Bull,Bull.Chem,Soc,Japn., 39,2157(1966)
[12] E,Tombari, G,Chryssikos,B,Gestblom and R.H.Cole, J.Mol.119.,43,53(1989).
[13] S,Mashimo, S.Kuwabara, S.Yagihora and K.Higasi., J.Chem.Phys., 90(6),3292(1989).
[14] A.Schallamach, Trans,Faraday Soc., 180, (1946).
[15] R.H.Cole, K.S.Cole, J.Chem.Phys., 9,341 (1941).