16 minute read
International for Research in Applied Science & Engineering Technology (IJRASET)


ISSN: 2321-9653; IC Value: 45.98; SJ Impact Factor: 7.538
Advertisement
Volume 11 Issue II Feb 2023- Available at www.ijraset.com
4) Variation of Pressure Drop with Varying Diameter of Cross Section of Pipeline
The variations of the diameter of cross section of the pipeline were done by keeping the bend angles of the pipe constant at 6⁰, and inlet velocity of slurry constant at 1.5 m/s. The inner diameter of the pipeline in all the cases was also maintained at 0.5 inches less than the outer diameter. The diameter of cross section of the pipeline were varied as follows – 10 inches, 15 inches, 20 inches, 25 inches, 30 inches, 35 inches respectively. The radius of curvature of pipeline bend was also kept constant at R2000. The results thus obtained are shown in Table 16 below, and also plotted in graphs.

Table 16
Variation of pressure inside the pipe with an increase in diameter of cross section of pipe
ISSN: 2321-9653; IC Value: 45.98; SJ Impact Factor: 7.538
Volume 11 Issue II Feb 2023- Available at www.ijraset.com
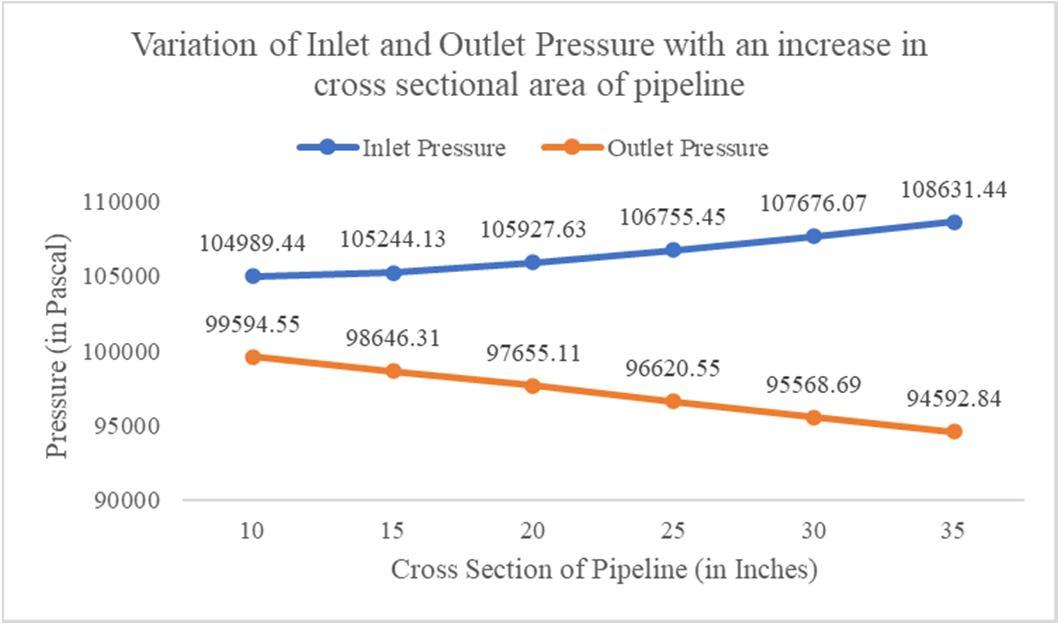
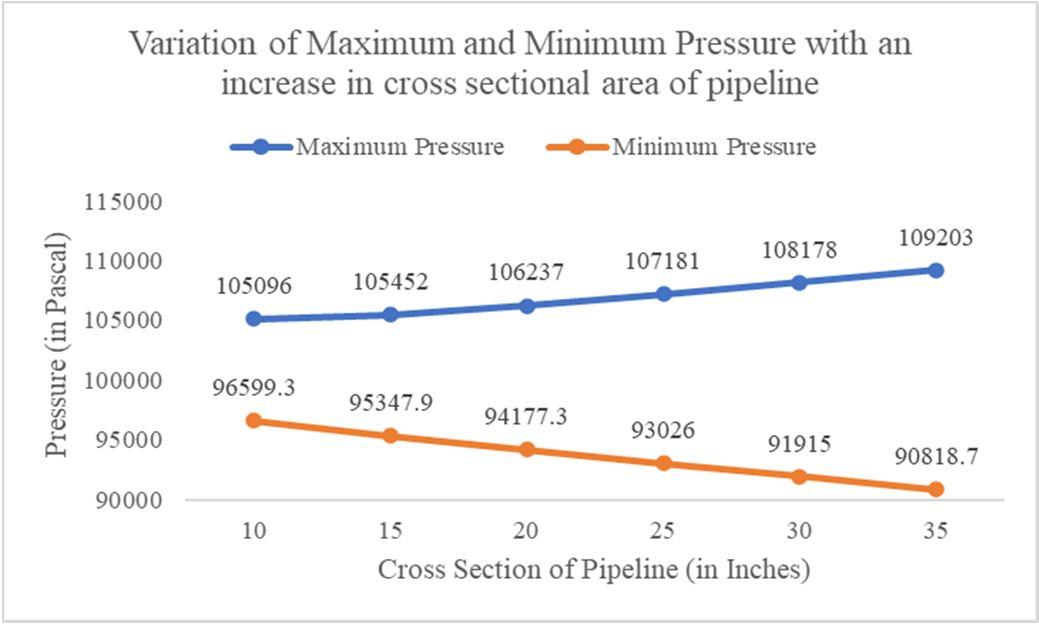
The graphs represented in fig. 52, fig. 53 and fig. 54 indicate the plot of maximum and minimum pressure inside the pipeline vs. diameter of cross section of the pipeline, pressure at the inlet and outlet of the pipe vs. diameter of cross section of the pipeline, and the pressure at various bents of the pipeline with respect to the diameter of cross section of the pipeline, respectively, which were plotted taking into consideration the values obtained from table 16. The observations made are – an increase in the size of the pipeline diameter from 10 inches to 35 inches caused the maximum velocity inside the pipeline to rise substantially from 105096 Pa to 109203 Pa, and the minimum pressure inside the pipeline to fall steeply from 96599.3 Pa to 90818.7 Pa. The pressure at the inlet of the pipeline rose notably from 104989.44 Pa to 108631.44 Pa, and the outlet pressure fell substantially from 99594.5 Pa to 94592.84 Pa. The value of pressure drop was found to be ranging between 5394.89 Pa and 14038.6 Pa, or 5.13% to 12.92%. While the pressure at all the four bends were found to be decreasing, the pressure values at bends 2, 3 and 4 decreased slowly, the same for bend 1 decreased steeply with an increase in concentration of solid particles in slurry.

E. For Radius of Curvature of Bends – R2500
1) Variation of pressure drop with varying bend angles of the pipeline
The variations of the angles of bends of the pipeline were done by keeping the area of cross section/outer diameter of the pipeline constant at 15 inches, and inlet velocity of slurry constant at 1.5 m/s. The inner diameter of the pipeline in all the cases was also maintained at 14.5 inches. The bend angles were varied as follows - 3°, 6°, 9°, 12°, 15°, and 18°, respectively. The radius of curvature of pipeline bend was also kept constant at R2500. The results thus obtained are shown in Table 17 below, and also plotted in graphs.
ISSN: 2321-9653; IC Value: 45.98; SJ Impact Factor: 7.538
Volume 11 Issue II Feb 2023- Available at www.ijraset.com
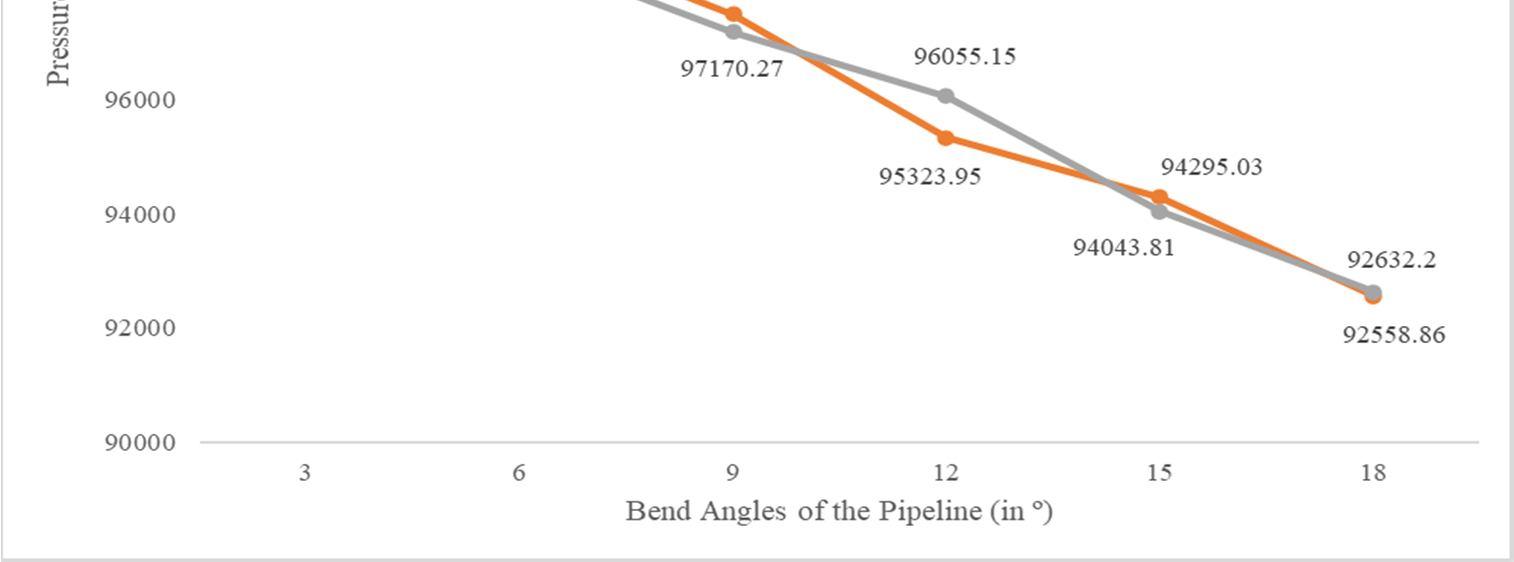
Fig. 57 – Variation pressure at various bends inside the pipeline with an increase in the bend angles of the pipe
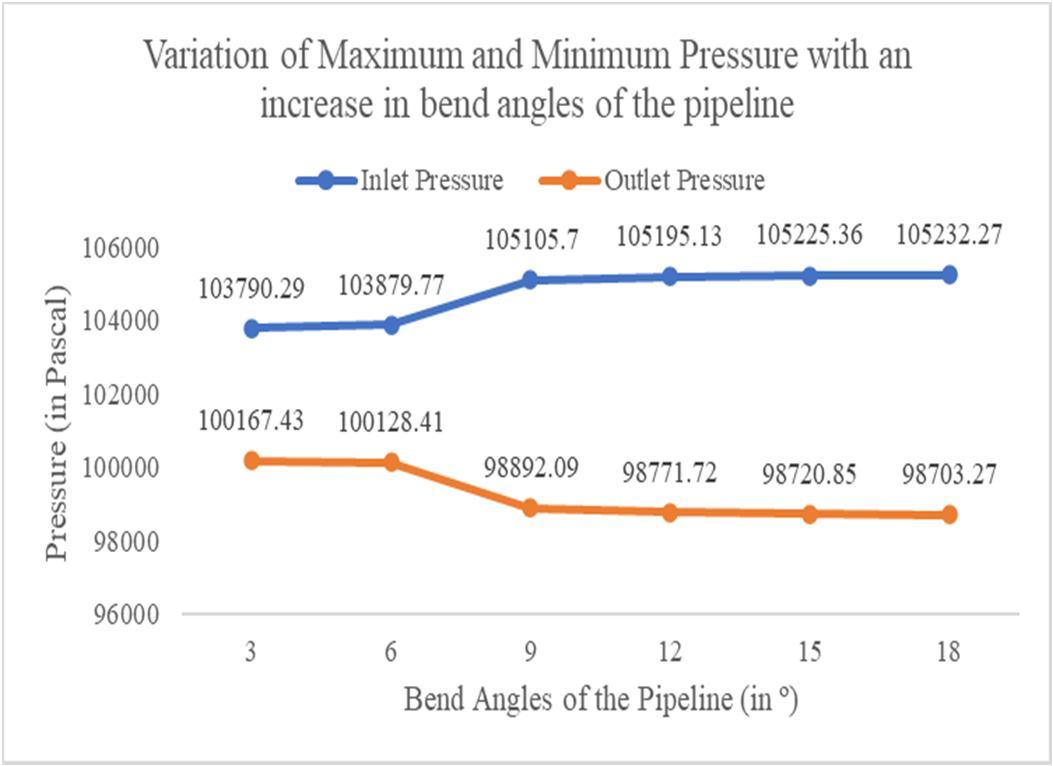
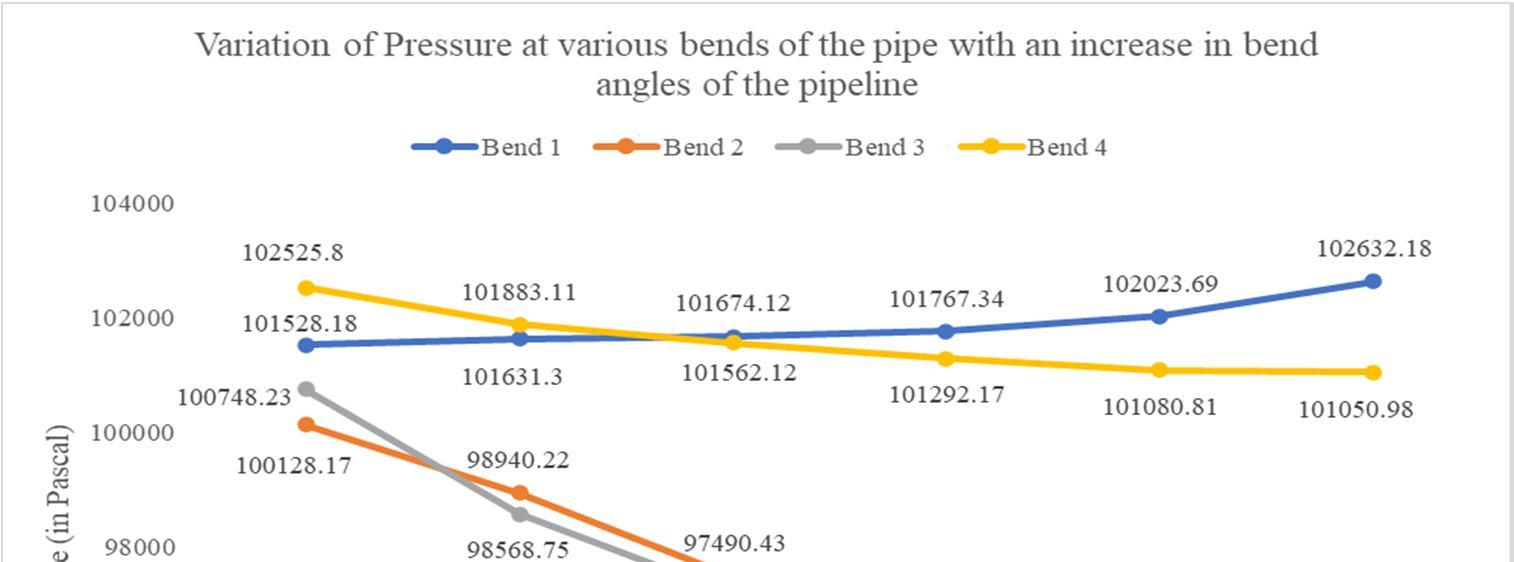
The graphs represented in fig. 55, fig. 56 and fig. 57 indicate the plot of maximum and minimum pressure inside the pipeline vs. bend angles of the pipe system, pressure at the inlet and outlet of the pipe vs. bend angles of the pipe system, and the pressure at various bents of the pipeline with respect to the bend angles, respectively, which were plotted taking into consideration the values obtained from table 17. The observations made are – with an increase in angle of bend of the pipeline system from 3⁰ to 18⁰, the maximum pressure increased marginally from 105297 Pa to 105388 Pa, and the minimum pressure dropped substantially from 97300.6 Pa to 88672 Pa. But the pressure at the inlet somewhat noticeably increased, from 103790.29 Pa to 105232.27 Pa and the outlet pressure decreased in a similar fashion from 100167.43 Pa to 98703.27 Pa respectively. The value of pressure drop was found to be ranging between 3622.86 Pa and 6529 Pa, or 3.49% to 6.2%. While the pressure at bend 1 of the pipeline system was found to be increasing, pressure at bend 4 dropped minorly, while the same in bends 2 and 3 were found to be decreasing substantially with an increase in the angles of bend of the pipeline.
2) Variation of Pressure drop with varying inlet Velocity of Slurry
The variations of the inlet velocity of slurry were done by keeping the area of cross section/outer diameter of the pipeline constant at 15 inches, and bend angles at 6⁰. The inner diameter of the pipeline in all the cases was also maintained at 14.5 inches. The inlet velocities were varied as follows – 0.5 m/s, 1.0 m/s, 1.5 m/s, 2.0 m/s, 2.5 m/s, and 3.0 m/s respectively. The radius of curvature of pipeline bend was also kept constant at R2500. The results thus obtained are shown in Table 18 below, and also plotted in graphs.
Table 18 – Variation of pressure inside the pipeline with an increase in inlet velocity of slurry
ISSN: 2321-9653; IC Value: 45.98; SJ Impact Factor: 7.538
Volume 11 Issue II Feb 2023- Available at www.ijraset.com
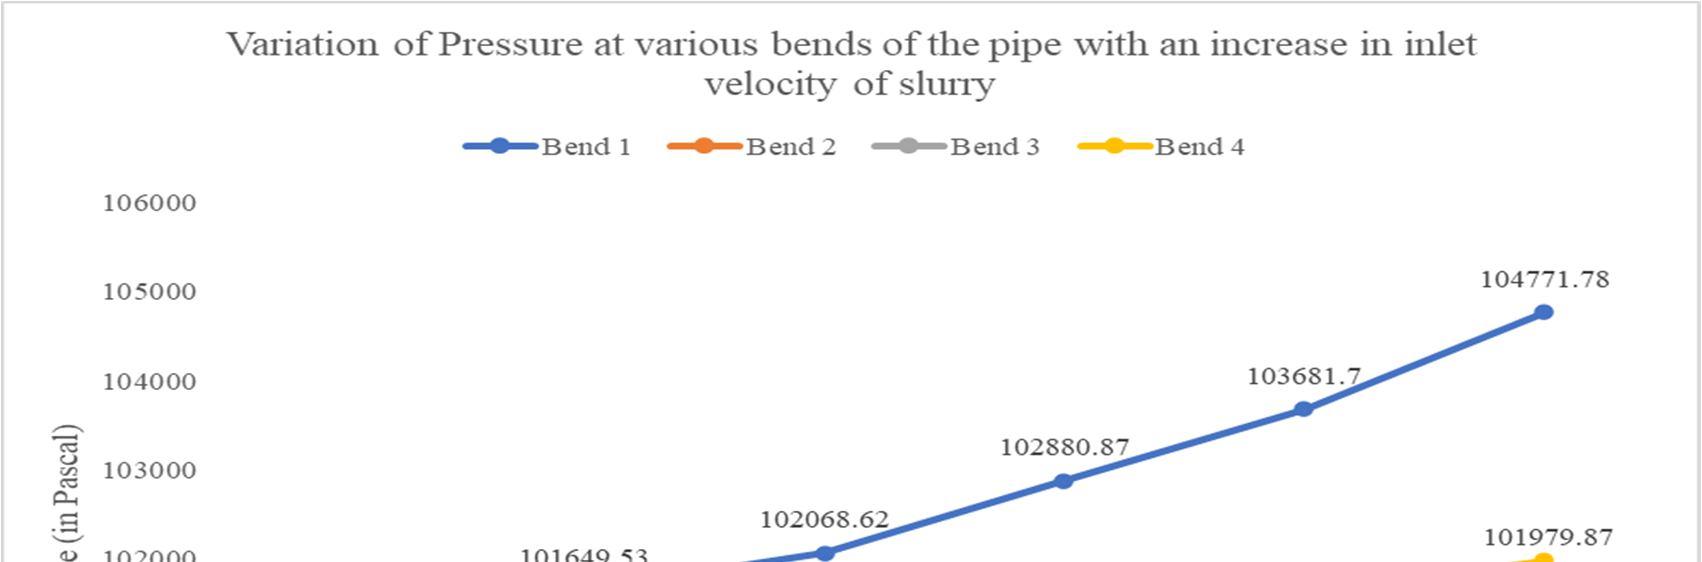
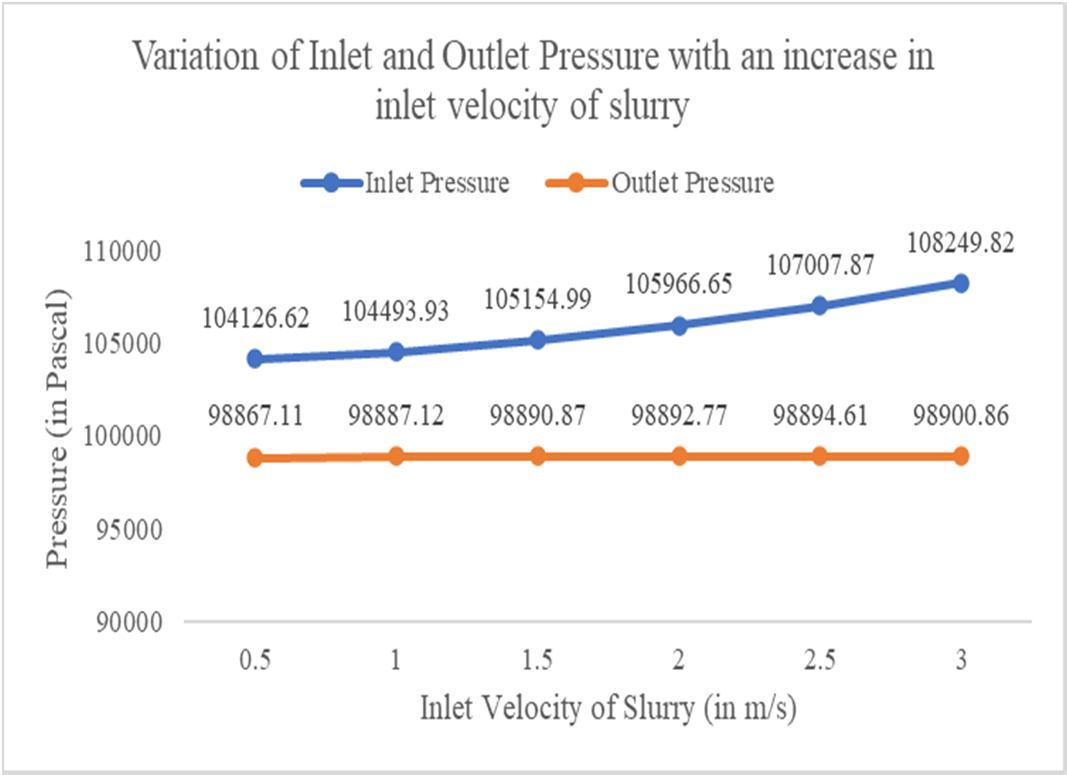
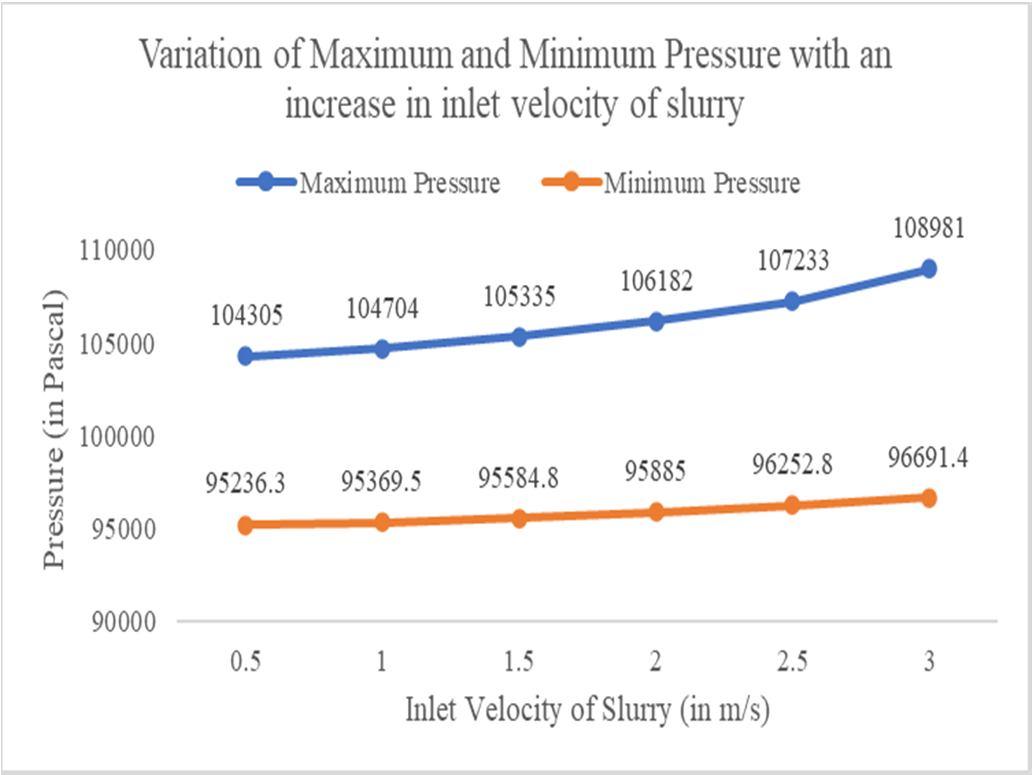
The graphs represented in fig. 58, fig. 59 and fig. 60 indicate the plot of maximum and minimum pressure inside the pipeline vs. inlet velocity of slurry, pressure at the inlet and outlet of the pipe vs. inlet velocity of slurry, and the pressure at various bents of the pipeline with respect to the inlet velocity of slurry, respectively, which were plotted taking into consideration the values obtained from table 18. The observations made are – with an increase in velocity at the inlet of the pipeline system from 0.5 m/s to 3 m/s, the maximum pressure increased substantially from 104305 Pa to 108981 Pa, and the minimum pressure increased minorly from 95236.3 Pa to 96691.4 Pa. The pressure at the inlet increased during the process, albeit the rise in pressure at the inlet was steep, i.e., from 104126.62 Pa to 108249.82 Pa, as compared to the marginal rise in pressure at the outlet of the pipe, i.e., from 98867.1 Pa to 98900.86 Pa. The value of pressure drop was found to be ranging between 5259.51 Pa and 9348.96 Pa, or 5.05% to 8.63%. The pressure at bends at all the 4 bends were found to be increasing with an increase in the inlet velocity of slurry. While pressure at bend 1 increased rapidly, the same for bends 2 and 3 increased substantially, while for bend 4, it increased marginally.

ISSN: 2321-9653; IC Value: 45.98; SJ Impact Factor: 7.538
Volume 11 Issue II Feb 2023- Available at www.ijraset.com
3) Variation of Pressure Drop with Varying Concentration of Solid Particles in Slurry
The variations of the concentration of solids in slurry were done by keeping the area of cross section/outer diameter of the pipeline constant at 15 inches, and inlet velocity of slurry constant at 1.5 m/s. The inner diameter of the pipeline in all the cases was also maintained at 14.5 inches. The concentration of solids in slurry were varied as follows – 30%, 40%, 50%, 60%, 70% and 80% respectively. The radius of curvature of pipeline bend was also kept constant at R2500. The results thus obtained are shown in Table 19 below, and also plotted in graphs.

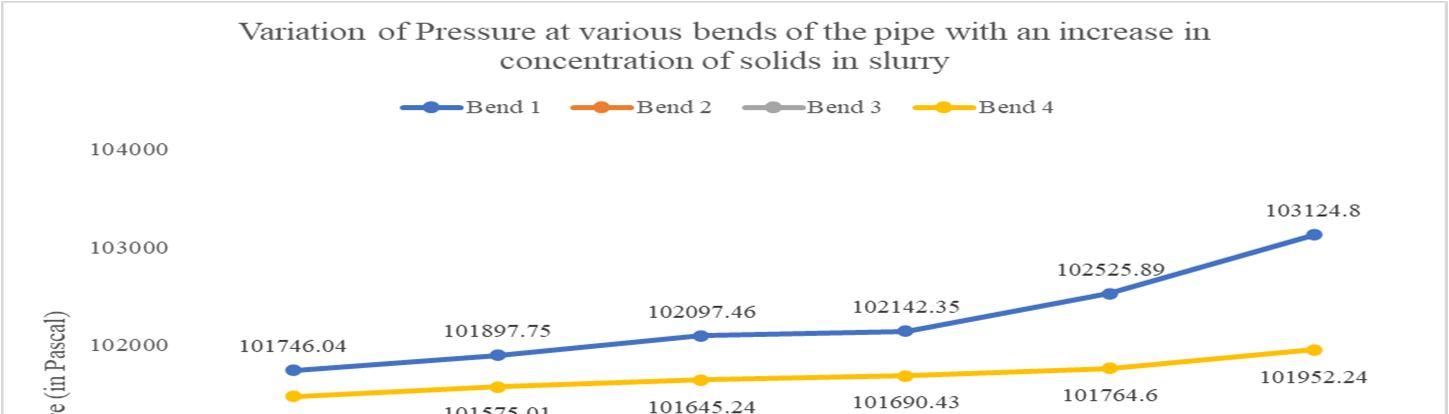

Table 19
Variation of pressure inside the pipe with an increase in concentration of solids in slurry
ISSN: 2321-9653; IC Value: 45.98; SJ Impact Factor: 7.538
Volume 11 Issue II Feb 2023- Available at www.ijraset.com
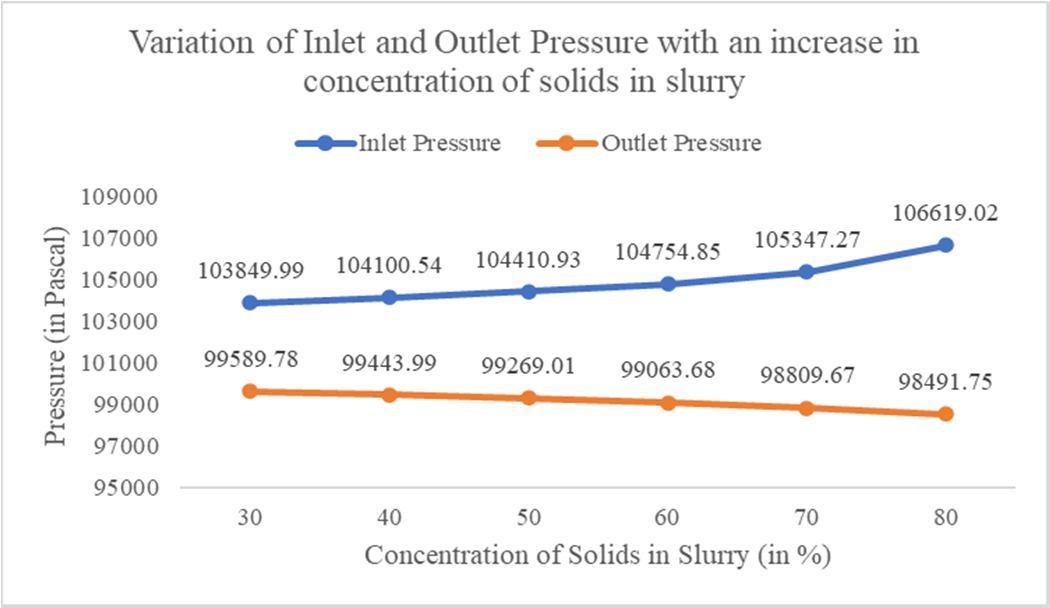
The graphs represented in fig. 61, fig. 62 and fig. 63 indicate the plot of maximum and minimum pressure inside the pipeline vs. concentration of solids in slurry, pressure at the inlet and outlet of the pipe vs. concentration of solids in slurry, and the pressure at various bents of the pipeline with respect to the concentration of solids in slurry, respectively, which were plotted taking into consideration the values obtained from table 19. The observations made are – when the concentration of solids in the slurry flowing inside the pipeline was increased from 30% to 80%, the maximum pressure was found to be increasing from 104001 Pa to 106875 Pa, while the minimum pressure inside the pipeline decreased notably from 97173.1 Pa to 94899 Pa. Also, while the inlet pressure varied in the same manner as the maximum pressure, slow initially and steeper afterwards, from 103849.99 Pa to 106619.02 Pa, the outlet pressure fell minorly during the process, from 99589.78 Pa to 98491.75 Pa. The value of pressure drop was found to be ranging between 4260.21 Pa and 8127.27 Pa, or 4.1% to 7.62%. While the pressure at bend 1 of the pipeline system were found to be increasing rapidly, the same for bend 4 was found to be falling albeit slowly, while the same in bends 2 and 3 were found to be decreasing, though for bend 2, it decreased slowly and for bend 3 it decreased rapidly after 60% solids concentration, with an increase in concentration of solid particles in slurry.
4) Variation of Pressure drop with Varying Diameter of cross Section of Pipeline

The variations of the diameter of cross section of the pipeline were done by keeping the bend angles of the pipe constant at 6⁰, and inlet velocity of slurry constant at 1.5 m/s. The inner diameter of the pipeline in all the cases was also maintained at 0.5 inches less than the outer diameter. The diameter of cross section of the pipeline were varied as follows – 10 inches, 15 inches, 20 inches, 25 inches, 30 inches, 35 inches respectively. The radius of curvature of pipeline bend was also kept constant at R2500. The results thus obtained are shown in Table 20 below, and also plotted in graphs.
Table 20
Variation of pressure inside the pipe with an increase in diameter of cross section of pipe
ISSN: 2321-9653; IC Value: 45.98; SJ Impact Factor: 7.538
Volume 11 Issue II Feb 2023- Available at www.ijraset.com
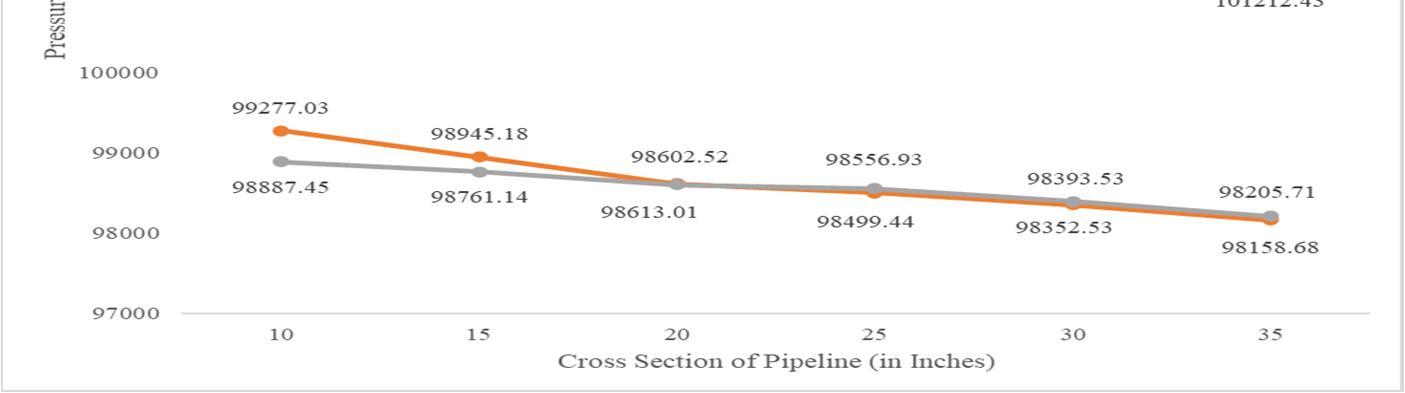
Fig. 66
Variation pressure at various bends inside the pipe with an increase in diameter of cross section of pipeline
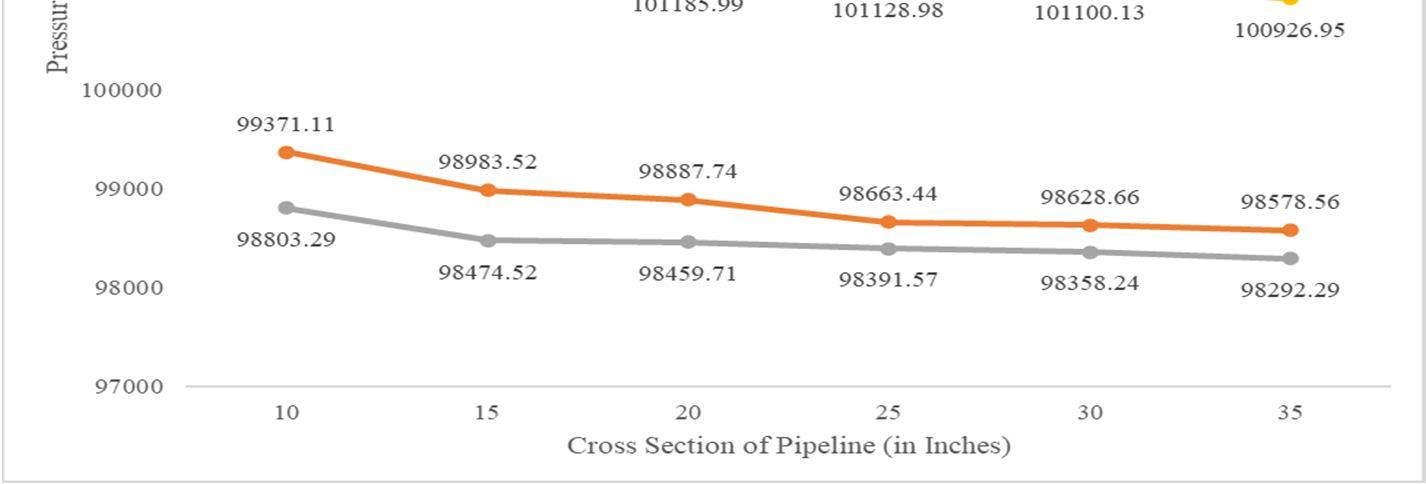

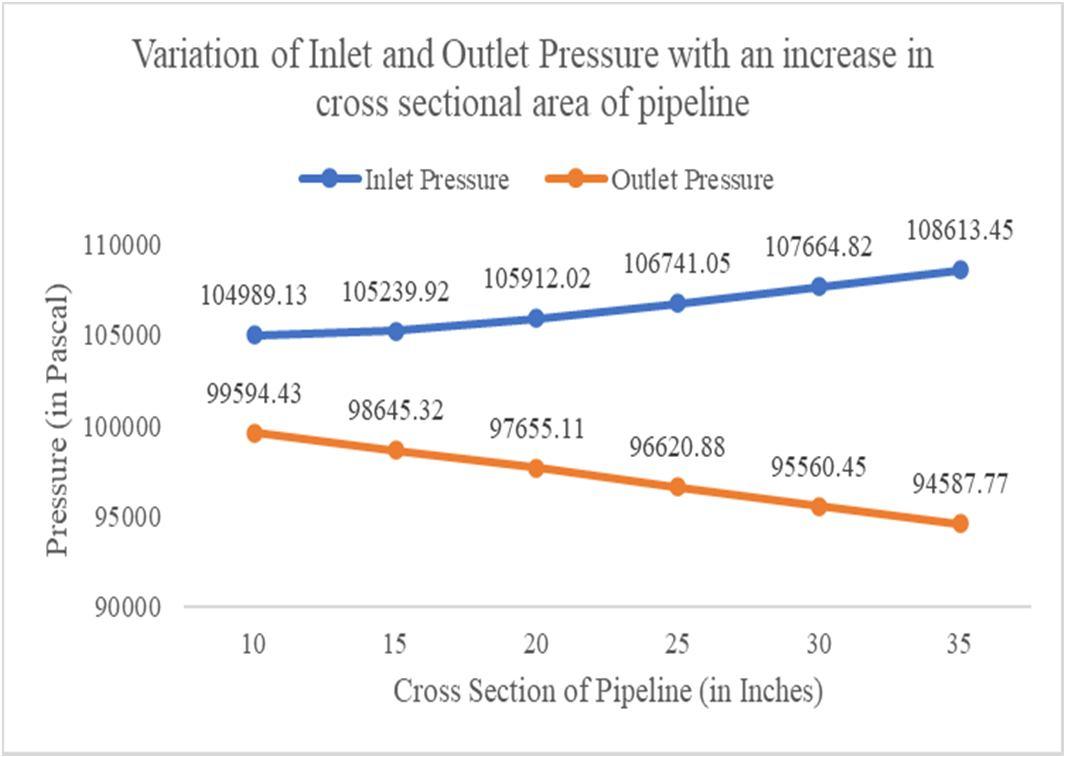
The graphs represented in fig. 64, fig. 65 and fig. 66 indicate the plot of maximum and minimum pressure inside the pipeline vs. diameter of cross section of the pipeline, pressure at the inlet and outlet of the pipe vs. diameter of cross section of the pipeline, and the pressure at various bents of the pipeline with respect to the diameter of cross section of the pipeline, respectively, which were plotted taking into consideration the values obtained from table 20. The observations made are – an increase in the size of the pipeline diameter from 10 inches to 35 inches caused the maximum velocity inside the pipeline to rise substantially from 105096 Pa to 109171 Pa, and the minimum pressure inside the pipeline to fall steeply from 96601.1 Pa to 90810.2 Pa. The pressure at the inlet of the pipeline rose notably from 104989.13 Pa to 108613.45 Pa, and the outlet pressure fell substantially from 99594.43 Pa to 94587.77 Pa. The value of pressure drop was found to be ranging between 5394.7 Pa and 14025.68 Pa, or 5.13% to 12.91%. While the pressure at all the four bends were found to be decreasing, the pressure values at bends 2, 3 and 4 decreased slowly, the same for bend 1 decreased steeply with an increase in concentration of solid particles in slurry.
VI. CONCLUSION AND FUTURE SCOPE
Comparatively a newer technique, pipeline transportation of slurry is widely used considering the several advantages it has over bulk transportation by the means of rail, road and port. Nowadays, many researchers have shown their interest and have experimented with the design of hydraulic transport systems. Several researchers have also established many mathematical relations and numerical models relating various flow parameters. Pressure drop is among the major challenges needed to be tackled by transportation plants, for it contributes to a decreased efficiency and increased loss of power, time as well as is not economical. This article investigated upon the pressure drop inside the slurry pipelines under various circumstances, under different sets of operating conditions. The overall pressure drop under these varying conditions, was found out to be lying between 3.41%-12.91%. After the calculations and plotting of graphs were done, the detailed results thus obtained were –
1) With an increase in the angles of bend of the piping system, for the case of all radius of bends of the pipeline, the maximum pressure inside the pipeline was found to be increasing marginally, but the minimum pressure fell noticeably. When compared, it was noticed that, for higher values of radius of curvature of bend, both the maximum and minimum pressure were decreasing. The inlet pressure, in all cases of radius of curvatures of bends, was found to be increasing slowly till a bend angle of 6°, after which, it increased substantially. Similarly, the outlet pressure, in all cases of radius of curvatures of bends, was found to be decreasing slowly till a bend angle of 6°, after which, it decreased substantially. The pressure drop for R500 radius of curvature of bends was found to be lying between 4438.21 Pa to 6900.92 Pa, i.e., 4.27% to 6.53%, as the bend angles increased from 3° to 18°, while the same was found to be lying between 3622.86 Pa to 6529 Pa, i.e., 3.49% to 6.2% for R2500 radius of curvature of bends. A trend of decreasing pressure drop was observed with an increase in radius of curvature of bends, which shows that a lower value of bend angle, combined with higher value of radius of curvature of bend is suitable for pipelines.
ISSN: 2321-9653; IC Value: 45.98; SJ Impact Factor: 7.538
Volume 11 Issue II Feb 2023- Available at www.ijraset.com
2) With an increase in the velocity at the inlet of the pipeline, maximum pressure inside the pipeline was found to be increasing substantially, while the minimum pressure inside the pipeline was found to be increasing minorly and this trend was observed for all the values of radius of curvature of bends. Both the pressures at the inlet and the outlet increased during the process, albeit the rise in pressure at the inlet was steep as compared to the marginal rise in pressure at the outlet in all cases of radius of curvature of bends. The pressure drop for R500 radius of curvature of bends was found to be lying between 5109.59 Pa to 8965.22 Pa, i.e., 4.91% to 8.3%, as the inlet velocity of slurry increased from 0.5 m/s to 3m/s, while the same was found to be lying between 5259.51 Pa to 9348.96 Pa, i.e., 5.05% to 8.63% for R2500 radius of curvature of bends. As the radius of curvature of bends were increased, the pressure drop remained same, more or less, as the increase was minor, which shows that a combination of higher value of radius of curvature of bend and lower inlet velocity of slurry can be preferable, subject to condition that the inlet velocity of slurry is well above the settling velocity.
3) When the concentration of solids in the slurry flowing inside the pipeline was increased, the maximum pressure was found to be increasing marginally initially, and later on, the rise was substantial, while the minimum pressure inside the pipeline notably decreased for all cases of radius of curvature of bends. Similarly, it was noteworthy that while the inlet pressure varied in the same manner as the maximum pressure, slow initially and steeper afterwards, the outlet pressure fell minorly during the process in all cases of radius of curvatures of bends. The pressure drop for R500 radius of curvature of bends was found to be lying between 4281.22 Pa to 8167.01 Pa, i.e., 4.12% to 7.65%, as the concentration of solids in slurry increased from 30% to 80%, while the same was found to be lying between 4260.21 Pa to 8127.27 Pa, i.e., 4.09% to 7.62% for R2500 radius of curvature of bends. As the radius of curvature of bends were increased, the pressure drop value remained the same, more or less, as the decrease in pressure drop values with increase in radius of curvature of bends was relatively minor, which shows that a combination of higher value of radius of curvature of bend and lower concentration of solids in slurry would be preferable considering the fact that as the radius of curvature of bends of the pipeline increase, the maximum pressure inside the pipeline reduces.
4) An increase in the diameter of the pipeline, which had a uniform circular cross section, caused the maximum pressure in the pipeline to rise substantially and the minimum pressure to fall steeply. The same was also observed with the pressures at the inlet and outlet. While the inlet pressure rose, the pressure at the outlet saw a steep decline. The pressure drop for R500 radius of curvature of bends was found to be lying between 5414.88 Pa to 14031.77 Pa, i.e., 5.15% to 12.91%, as the diameter of cross section of the pipeline increased from 10 inches to 35 inches, while the same was found to be lying between 5394.7 Pa to 14025.68 Pa, i.e., 5.13% to 12.91% for R2500 radius of curvature of bends. As the radius of curvature of bends were increased, the pressure drop value remained the same, more or less, as the decrease in pressure drop values with increase in radius of curvature of bends was relatively minor, which shows that a combination of higher value of radius of curvature of bend and lower diameter of cross section of pipe would be preferable considering the fact that as the radius of curvature of bends of the pipeline increase, the maximum pressure inside the pipeline reduces. Though, for higher carrying capacity, higher diameter of cross section would be required, and for that purpose, the other parameters such as slurry inlet velocity and concentration of solids in slurry need to be altered suitably to keep the pressure drop value in check.
Slurry being a two-phase liquid, its modelling and flow simulation as well as its actual transportation is a critical task considering the involvement of several parameters, variables, laws of physics, numerical models and mathematical equations. The chemical composition of slurry, the varying mineralogy of ores has an effect on the rheology of slurry and also affects the flow which can be a possible research field. Back flow issues, bends, changes in elevation profile and improvement of the ore of various grades are also possible areas where investigation can be carried out. The transportation of slurry via pipelines proves to be beneficial in several terms, but also along with that, it opens the doors for further research and optimization of the same.
A. Nomenclature
D Diameter of the pipeline
Shear stress at the pipe wall
P1 & P2 Pressures at sections 1 and 2
L Distance between sections 1 and 2 ρ Density of the fluid
U Average velocity of flow
Cw Concentration of solids in percent by weight
International Journal for Research in Applied Science & Engineering Technology (IJRASET)
ISSN: 2321-9653; IC Value: 45.98; SJ Impact Factor: 7.538
Volume 11 Issue II Feb 2023- Available at www.ijraset.com
Density of solid
Density of liquid
Slurry density g Acceleration due to gravity
Specific gravity of the suspending medium
S, or, Ss Ratio of the density of solids to the density of the slurry
Water dynamic viscosity, or, Saturated water absolute viscosity at t=32⁰C
Solid’s specific gravity
Cv Volume percent solids d Particle diameter µ Slurry dynamic viscosity
Vc, or, VD Critical deposition velocity
Froude’s number
Archimedes number
References
[1] Singh, J., & Singh, J. P. (2021). Numerical analysis on solid particle erosion in elbow of a slurry conveying circuit. Journal of Pipeline Systems Engineering and Practice, 12(1), 04020070.
[2] Brown, G. (2006, December). Use of CFD to predict and reduce erosion in an industrial slurry piping system. In Fifth International Conference on CFD in the process industries. CSIRO, Melbourne, Australia (pp. 13-15).
[3] Singh, J. P., Kumar, S., & Mohapatra, S. K. (2021). Simulation and optimization of coal-water slurry suspension flow through 90° pipe bend using CFD. International Journal of Coal Preparation and Utilization, 41(6), 428-450.
[4] Azimian, M., & Bart, H. J. (2014). Investigation of hydroabrasion in slurry pipeline elbows and T-junctions. Journal of Energy and Power Engineering, 8(1), 65.
[5] TURIAN, R. M., Hsu, F. L., & Selim, M. S. (1983). Friction losses for flow of slurries in pipeline bends, fittings, and valves. Particulate Science and Technology, 1(4), 365-392.
[6] Kumar, A., Kaushal, D. R., & Kumar, U. (2008). Bend pressure drop experiments compared with FLUENT. Proceedings of the Institution of Civil EngineersEngineering and Computational Mechanics, 161(1), 35-42.
[7] Mishra, R., Singh, S. N., & Seshadri, V. (1998). Pressure drop across conventional and diverging-converging pipe bends in the flow of multi-sized particulate slurries.
[8] Verma, A. K., Singh, S. N., & Seshadri, V. (2006). Pressure drop for the flow of high concentration solid-liquid mixture across 90º horizontal conventional circular pipe bend.
[9] Zhang, J., Kang, J., Fan, J., & Gao, J. (2016). Research on erosion wear of high-pressure pipes during hydraulic fracturing slurry flow. Journal of Loss Prevention in the Process Industries, 43, 438-448.
[10] Peng, W., & Cao, X. (2016). Numerical simulation of solid particle erosion in pipe bends for liquid–solid flow. Powder technology, 294, 266-279.
[11] Wood, R. J. K., Jones, T. F., Ganeshalingam, J., & Miles, N. J. (2004). Comparison of predicted and experimental erosion estimates in slurry ducts. Wear, 256(9-10), 937-947.
[12] Singh, V., Kumar, S., & Mohapatra, S. K. (2019). Modeling of erosion wear of sand water slurry flow through pipe bend using CFD. Journal of Applied Fluid Mechanics, 12(3), 679-687.
[13] Rawat, K. S., Verma, A., Uniyal, A., Gangwar, H. P., & Pratihar, A. K. (2020, March). Modeling of Ice Slurry Flow through Bend Pipe. In IOP Conference Series: Materials Science and Engineering (Vol. 802, No. 1, p. 012001). IOP Publishing.
[14] Wood, R. J. K., Jones, T. F., Miles, N. J., & Ganeshalingam, J. (2001). Upstream swirl-induction for reduction of erosion damage from slurries in pipeline bends. Wear, 250(1-12), 770-778.
[15] Kannojiya, V., & Kumar, S. (2020). Assessment of optimum slurry pipe design for minimum erosion. Scientia Iranica, 27(5), 2409-2418.
[16] Doron, P., & Barnea, D. (1995). Pressure drop and limit deposit velocity for solid-liquid flow in pipes. Chemical engineering science, 50(10), 1595-1604.
[17] Doron, P., Granica, D., & Barnea, D. (1987). Slurry flow in horizontal pipes experimental and modeling. International journal of multiphase flow, 13(4), 535-547.
[18] Verma, O. P., Kumar, A., & Sikarwar, B. S. (2020). Numerical simulation and comparative analysis of pressure drop estimation in horizontal and vertical slurry pipeline. Journal of Mechanical Engineering and Sciences, 14(2), 6610-6624.
[19] Singh, M. K., Kumar, S., & Ratha, D. (2020). Computational analysis on disposal of coal slurry at high solid concentrations through slurry pipeline. International Journal of Coal Preparation and Utilization, 40(2), 116-130.
[20] Kaushal, D. R., & Tomita, Y. (2002). An improved method for predicting pressure drop along slurry pipeline. Particulate science and technology, 20(4), 305324.
[21] Chandel, S., Seshadri, V., & Singh, S. N. (2009). Effect of additive on pressure drop and rheological characteristics of fly ash slurry at high concentration. Particulate Science and Technology, 27(3), 271-284.
[22] Turian, R. M., & Yuan, T. F. (1977). Flow of slurries in pipelines. AIChE Journal, 23(3), 232-243.
[23] Sanders, R. S., Schaan, J., Hughes, R., & Shook, C. (2004). Performance of sand slurry pipelines in the oil sands industry. The Canadian Journal of Chemical Engineering, 82(4), 850-857.


