
18 minute read
International Journal for Research in Applied Science & Engineering Technology (IJRASET)


Advertisement
ISSN: 2321-9653; IC Value: 45.98; SJ Impact Factor: 7.538

Volume 11 Issue II Feb 2023- Available at www.ijraset.com
ISSN: 2321-9653; IC Value: 45.98; SJ Impact Factor: 7.538
Volume 11 Issue II Feb 2023- Available at www.ijraset.com
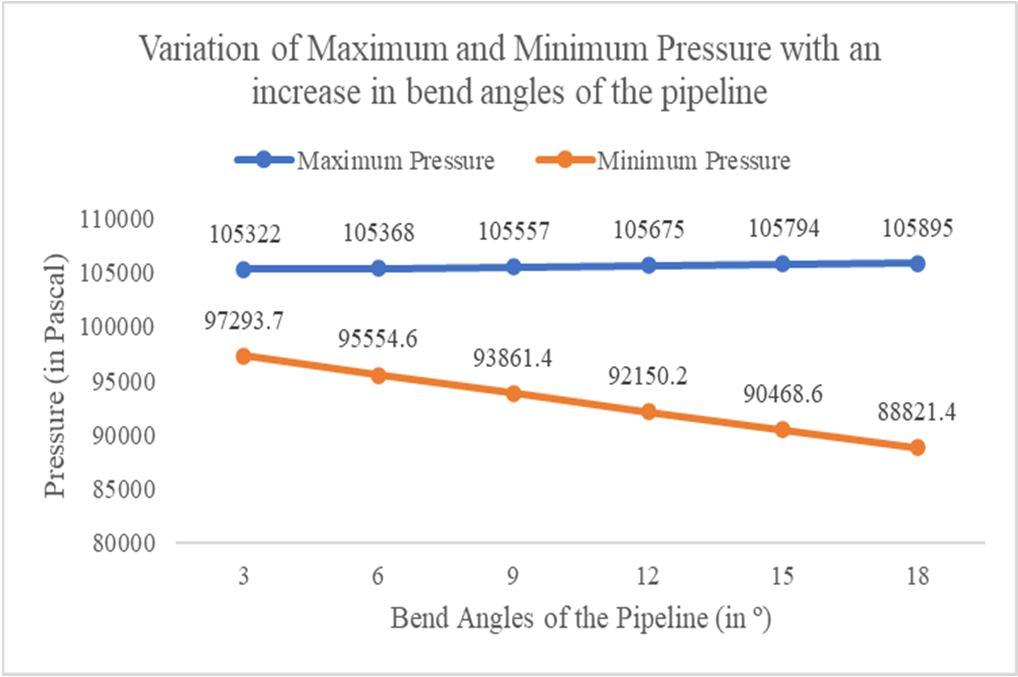
The graphs represented in fig. 7, fig. 8 and fig. 9 indicate the plot of maximum and minimum pressure inside the pipeline vs. bend angles of the pipe system, pressure at the inlet and outlet of the pipe vs. bend angles of the pipe system, and the pressure at various bents of the pipeline with respect to the bend angles, respectively, which were plotted taking into consideration the values obtained from table 1. The observations made are – with an increase in angle of bend of the pipeline system from 3⁰ to 18⁰, the maximum pressure increased marginally from 105322 Pa to 105895 Pa, and the minimum pressure dropped substantially from 97293.7 Pa to 88821.4 Pa. While the pressure at the inlet also somewhat noticeably increased, from 103831.88 Pa to 105612.41 Pa, the pressure at the outlet dropped from 99393.67 Pa to 98711.49 Pa. The value of pressure drop was found to be ranging between 5120.39 Pa and 6218.74 Pa, or 4.27% to 6.53%. While the pressure at bends 1 and 4 of the pipeline system were found to be increasing, the same in bends 2 and 3 were found to be decreasing with an increase in the angles of bend of the pipeline.
2) Variation of Pressure Drop with Varying Inlet Velocity of Slurry
The variations of the inlet velocity of slurry were done by keeping the area of cross section/outer diameter of the pipeline constant at 15 inches, and bend angles at 6⁰. The inner diameter of the pipeline in all the cases was also maintained at 14.5 inches. The inlet velocities were varied as follows – 0.5 m/s, 1.0 m/s, 1.5 m/s, 2.0 m/s, 2.5 m/s, and 3.0 m/s respectively. The radius of curvature of pipeline bend was also kept constant at R500. The results thus obtained are shown in Table 2 below, and also plotted in graphs.
Table 2
Variation of pressure inside the pipeline with an increase in inlet velocity of slurry


ISSN: 2321-9653; IC Value: 45.98; SJ Impact Factor: 7.538
Volume 11 Issue II Feb 2023- Available at www.ijraset.com
Fig. 12
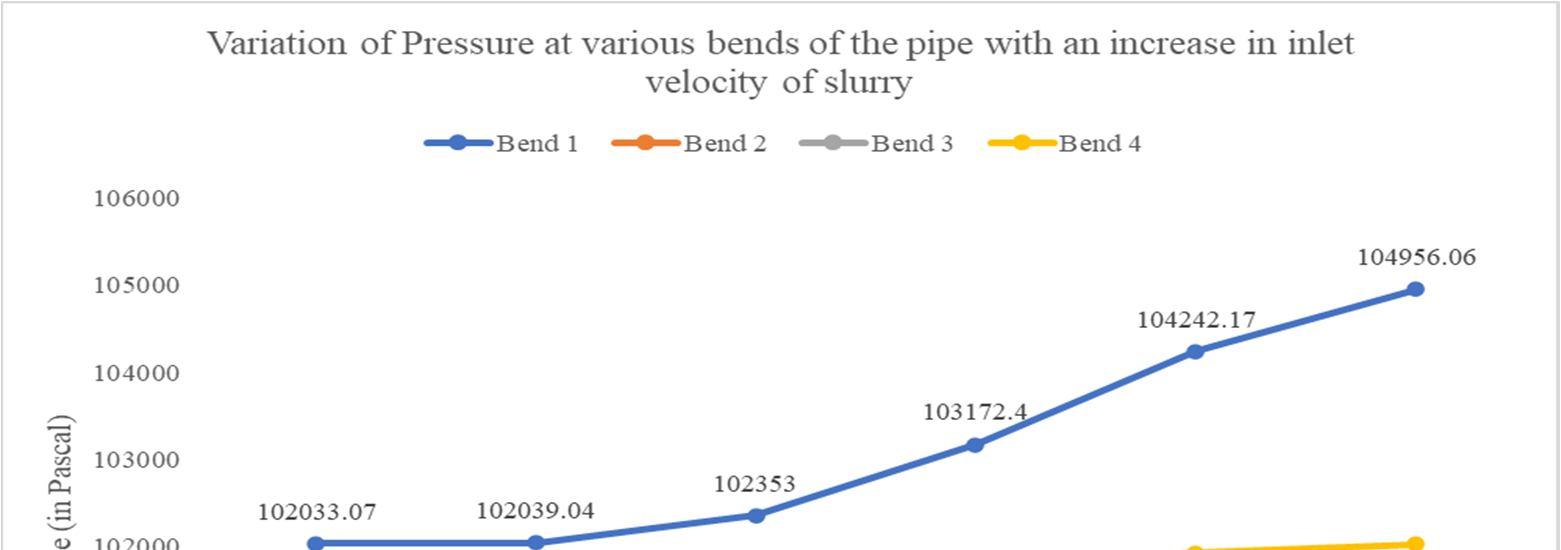
Variation pressure at various bends inside the pipeline with an increase in the inlet velocity of slurry
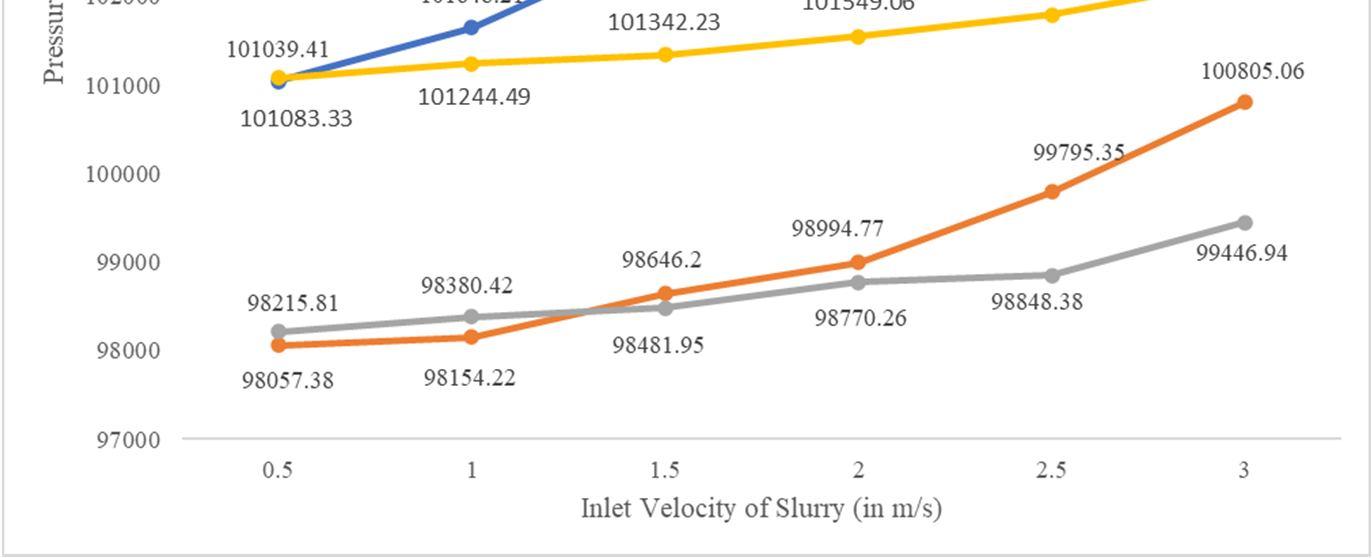

The graphs represented in fig. 10, fig. 11 and fig. 12 indicate the plot of maximum and minimum pressure inside the pipeline vs. inlet velocity of slurry, pressure at the inlet and outlet of the pipe vs. inlet velocity of slurry, and the pressure at various bents of the pipeline with respect to the inlet velocity of slurry, respectively, which were plotted taking into consideration the values obtained from table 2. The observations made are – with an increase in velocity at the inlet of the pipeline system from 0.5 m/s to 3 m/s, the maximum pressure increased substantially from 104303 Pa to 108883 Pa, and the minimum pressure increased minorly from 95237.7 Pa to 96730.6 Pa. Both the pressures at the inlet and the outlet increased during the process, albeit the rise in pressure at the inlet was steep, i.e., from 104016.37 Pa to 108023.42 Pa, as compared to the marginal rise in pressure at the outlet of the pipe, i.e., from 98906.78 Pa to 99058.2 Pa. The value of pressure drop was found to be ranging between 5109.59 Pa and 8965.22 Pa, or 4.91% to 8.3%. The pressure at bends at all the 4 bends were found to be increasing with an increase in the inlet velocity of slurry.
3) Variation of Pressure Drop with Varying Concentration of Solid Particles in Slurry
The variations of the concentration of solids in slurry were done by keeping the area of cross section/outer diameter of the pipeline constant at 15 inches, and inlet velocity of slurry constant at 1.5 m/s. The inner diameter of the pipeline in all the cases was also maintained at 14.5 inches. The concentration of solids in slurry were varied as follows – 30%, 40%, 50%, 60%, 70% and 80% respectively. The radius of curvature of pipeline bend was also kept constant at R500. The results thus obtained are shown in Table 3 below, and also plotted in graphs.
Table 3 – Variation of pressure inside the pipeline with an increase in concentration of solids in slurry
ISSN: 2321-9653; IC Value: 45.98; SJ Impact Factor: 7.538
Volume 11 Issue II Feb 2023- Available at www.ijraset.com
Increase
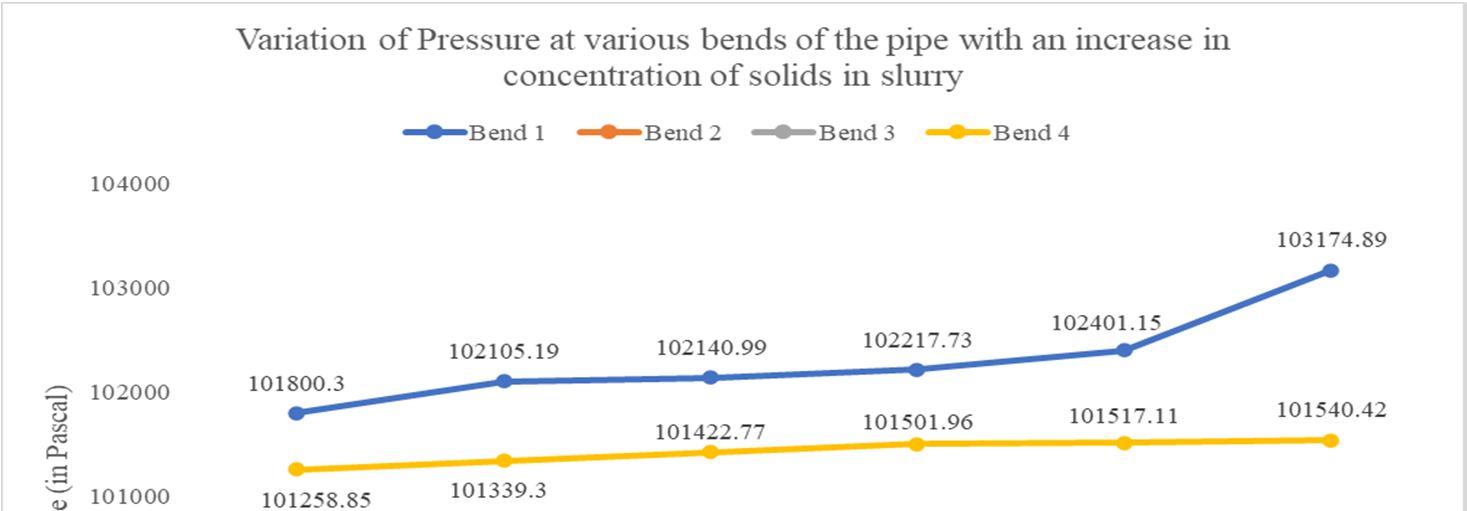
The graphs represented in fig. 13, fig. 14 and fig. 15 indicate the plot of maximum and minimum pressure inside the pipeline vs. concentration of solids in slurry, pressure at the inlet and outlet of the pipe vs. concentration of solids in slurry, and the pressure at various bents of the pipeline with respect to the concentration of solids in slurry, respectively, which were plotted taking into consideration the values obtained from table 3. The observations made are – when the concentration of solids in the slurry flowing inside the pipeline was increased from 30% to 80%, the maximum pressure was found to be increasing from 104074 Pa to 106915 Pa, while the minimum pressure inside the pipeline decreased notably from 97187.7 Pa to 94903.3 Pa. Also, while the inlet pressure varied in the same manner as the maximum pressure, slow initially and steeper afterwards, from 103870.19 Pa to 106658.2 Pa, the outlet pressure fell minorly during the process, from 99588.97 Pa to 98491.19 Pa. The value of pressure drop was found to be ranging between 4281.22 Pa and 8167.01 Pa, or 4.12% to 7.65%. While the pressure at bend 1 of the pipeline system were found to be increasing rapidly, the same for bend 4 was found to be rising albeit slowly, while the same in bends 2 and 3 were found to be decreasing, though for bend 2, it decreased slowly and for bend 3 it decreased rapidly with an increase in concentration of solid particles in slurry.


ISSN: 2321-9653; IC Value: 45.98; SJ Impact Factor: 7.538
Volume 11 Issue II Feb 2023- Available at www.ijraset.com
4) Variation Of Pressure Drop With Varying Diameter Of Cross Section Of Pipeline


The variations of the diameter of cross section of the pipeline were done by keeping the bend angles of the pipe constant at 6⁰, and inlet velocity of slurry constant at 1.5 m/s. The inner diameter of the pipeline in all the cases was also maintained at 0.5 inches less than the outer diameter. The diameter of cross section of the pipeline were varied as follows – 10 inches, 15 inches, 20 inches, 25 inches, 30 inches, 35 inches respectively. The radius of curvature of pipeline bend was also kept constant at R500. The results thus obtained are shown in Table 4 below, and also plotted in graphs.

Table 4
Variation of pressure inside the pipe with an increase in diameter of cross section of pipe
ISSN: 2321-9653; IC Value: 45.98; SJ Impact Factor: 7.538
Volume 11 Issue II Feb 2023- Available at www.ijraset.com
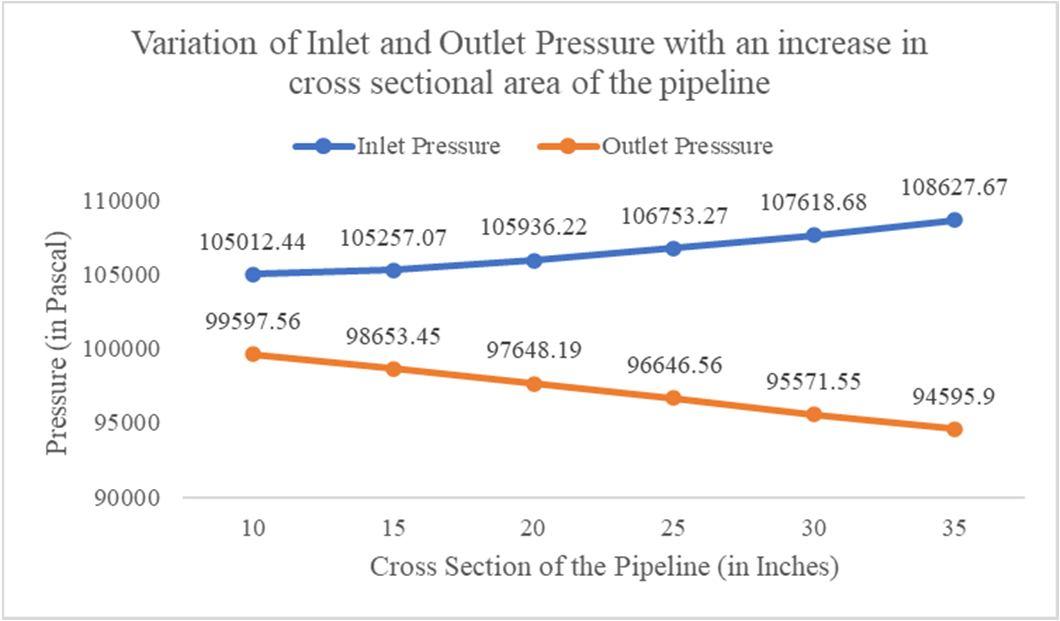
The graphs represented in fig. 16, fig. 17 and fig. 18 indicate the plot of maximum and minimum pressure inside the pipeline vs. diameter of cross section of the pipeline, pressure at the inlet and outlet of the pipe vs. diameter of cross section of the pipeline, and the pressure at various bents of the pipeline with respect to the diameter of cross section of the pipeline, respectively, which were plotted taking into consideration the values obtained from table 4. The observations made are – an increase in the size of the pipeline diameter from 10 inches to 35 inches caused the maximum velocity inside the pipeline to rise substantially from 105122 Pa to 109278 Pa, and the minimum pressure inside the pipeline to fall steeply from 96597.6 Pa to 90832.7 Pa. The pressure at the inlet of the pipeline rose notably from 105012.44 Pa to 108627.67 Pa, and the outlet pressure fell substantially from 99597.56 Pa to 94595.9 Pa. The value of pressure drop was found to be ranging between 5414.88 Pa and 14031.77 Pa, or 5.15% to 12.91%. While the pressure at bend 1 and 4 of the pipeline system were found to be increasing, while the same in bend 2 decreased and for bend 3 it increased with an increase in concentration of solid particles in slurry.
B. For Radius of Curvature of Bends – R1000
1) Variation of Pressure Drop with Varying bend Angles of the Pipeline
The variations of the angles of bends of the pipeline were done by keeping the area of cross section/outer diameter of the pipeline constant at 15 inches, and inlet velocity of slurry constant at 1.5 m/s. The inner diameter of the pipeline in all the cases was also maintained at 14.5 inches. The bend angles were varied as follows - 3°, 6°, 9°, 12°, 15°, and 18°, respectively. The radius of curvature of pipeline bend was also kept constant at R1000. The results thus obtained are shown in Table 5 below, and also plotted in graphs.
ISSN: 2321-9653; IC Value: 45.98; SJ Impact Factor: 7.538
Volume 11 Issue II Feb 2023- Available at www.ijraset.com
Fig. 21
Variation pressure at various bends inside the pipeline with an increase in the bend angles of the pipe
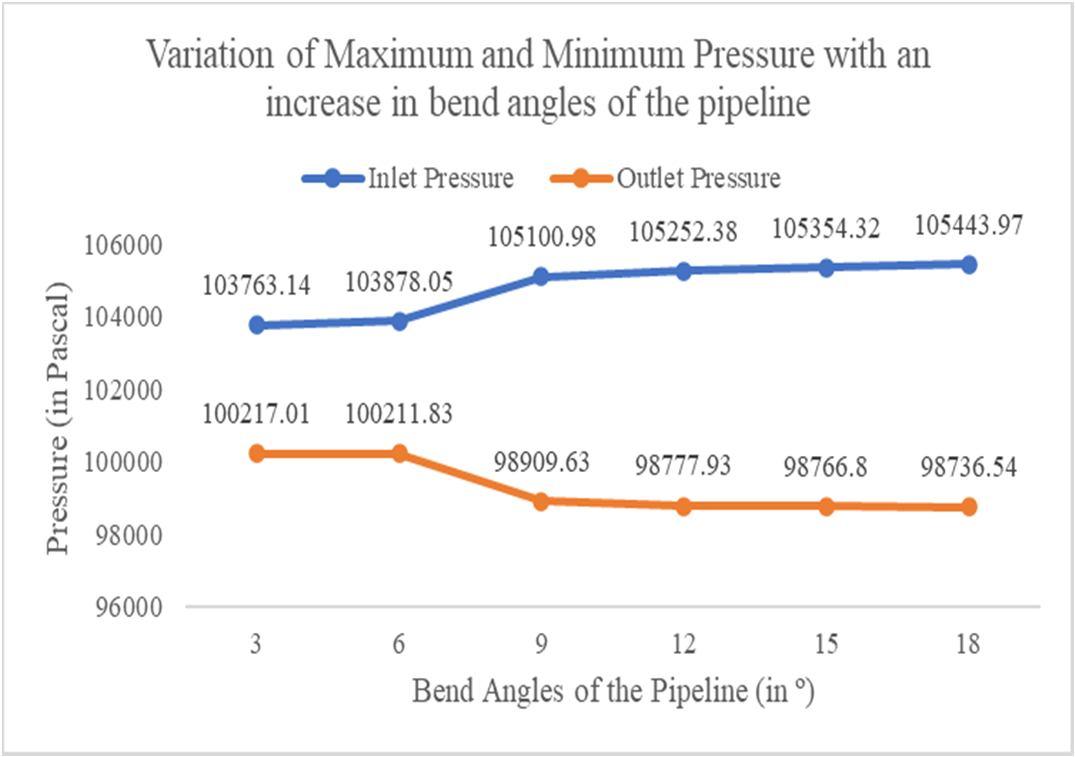
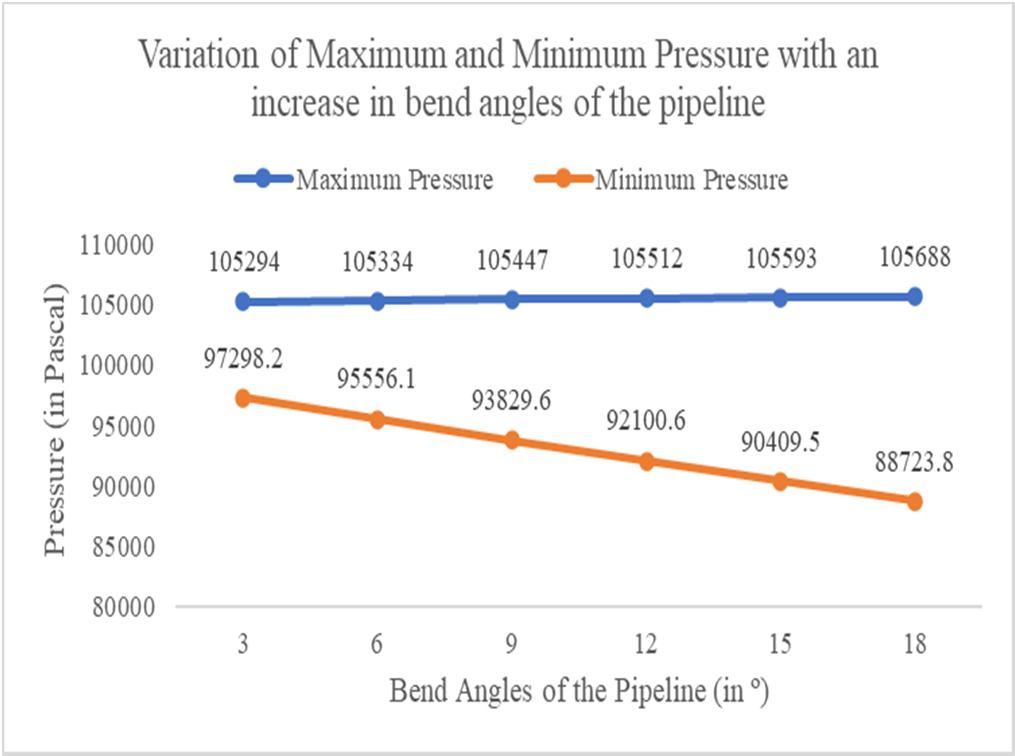
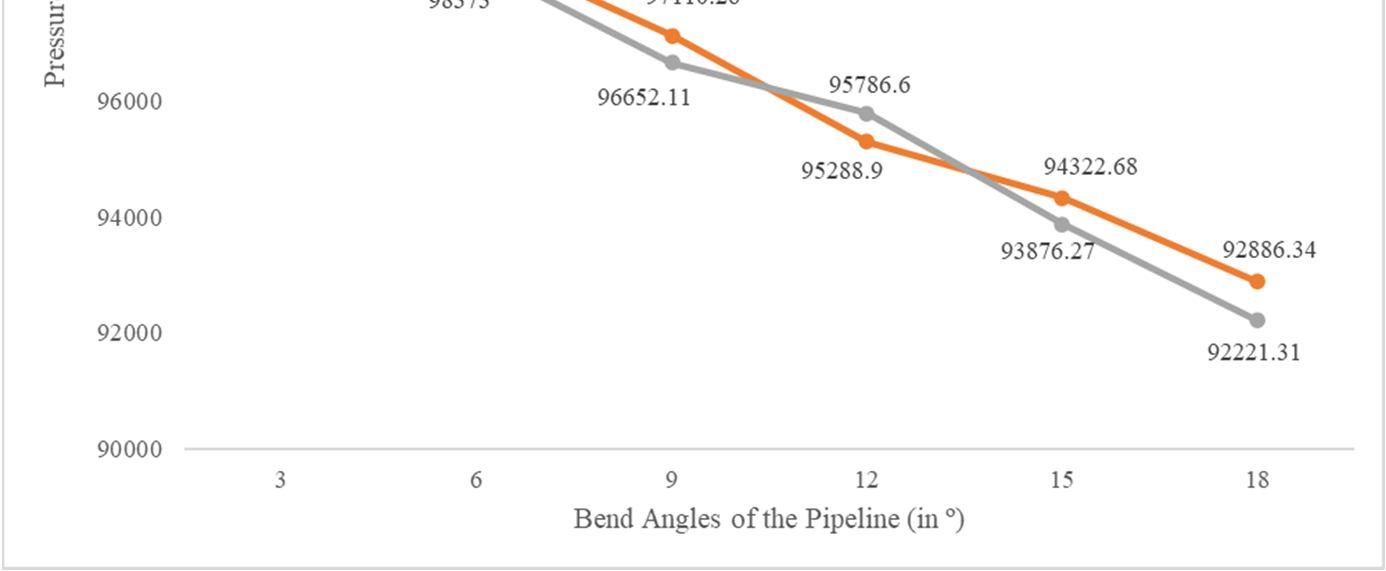
The graphs represented in fig. 19, fig. 20 and fig. 21 indicate the plot of maximum and minimum pressure inside the pipeline vs. bend angles of the pipe system, pressure at the inlet and outlet of the pipe vs. bend angles of the pipe system, and the pressure at various bents of the pipeline with respect to the bend angles, respectively, which were plotted taking into consideration the values obtained from table 5. The observations made are – with an increase in angle of bend of the pipeline system from 3⁰ to 18⁰, the maximum pressure increased marginally from 105294 Pa to 105688 Pa, and the minimum pressure dropped substantially from 97298.2 Pa to 88723.8 Pa. But the pressure at the inlet somewhat noticeably increased, from 103763.14 Pa to 105443.97 Pa and the outlet pressure decreased in a similar fashion from 100217.01 Pa to 98736.54 Pa respectively. The value of pressure drop was found to be ranging between 3546.13 Pa and 6707.43 Pa, or 3.14% to 6.36%. While the pressure at bend 1 of the pipeline system was found to be increasing, whereas, pressure at bend 4 decreased marginally and the same in bends 2 and 3 were found to be decreasing substantially with an increase in the angles of bend of the pipeline.

2) Variation of Pressure Drop with Varying Inlet Velocity of Slurry
The variations of the inlet velocity of slurry were done by keeping the area of cross section/outer diameter of the pipeline constant at 15 inches, and bend angles at 6⁰. The inner diameter of the pipeline in all the cases was also maintained at 14.5 inches. The inlet velocities were varied as follows
0.5 m/s, 1.0 m/s, 1.5 m/s, 2.0 m/s, 2.5 m/s, and 3.0 m/s respectively. The radius of curvature of pipeline bend was also kept constant at R1000. The results thus obtained are shown in Table 6 below, and also plotted in graphs.
Table 6
Variation of pressure inside the pipeline with an increase in inlet velocity of slurry
ISSN: 2321-9653; IC Value: 45.98; SJ Impact Factor: 7.538
Volume 11 Issue II Feb 2023- Available at www.ijraset.com
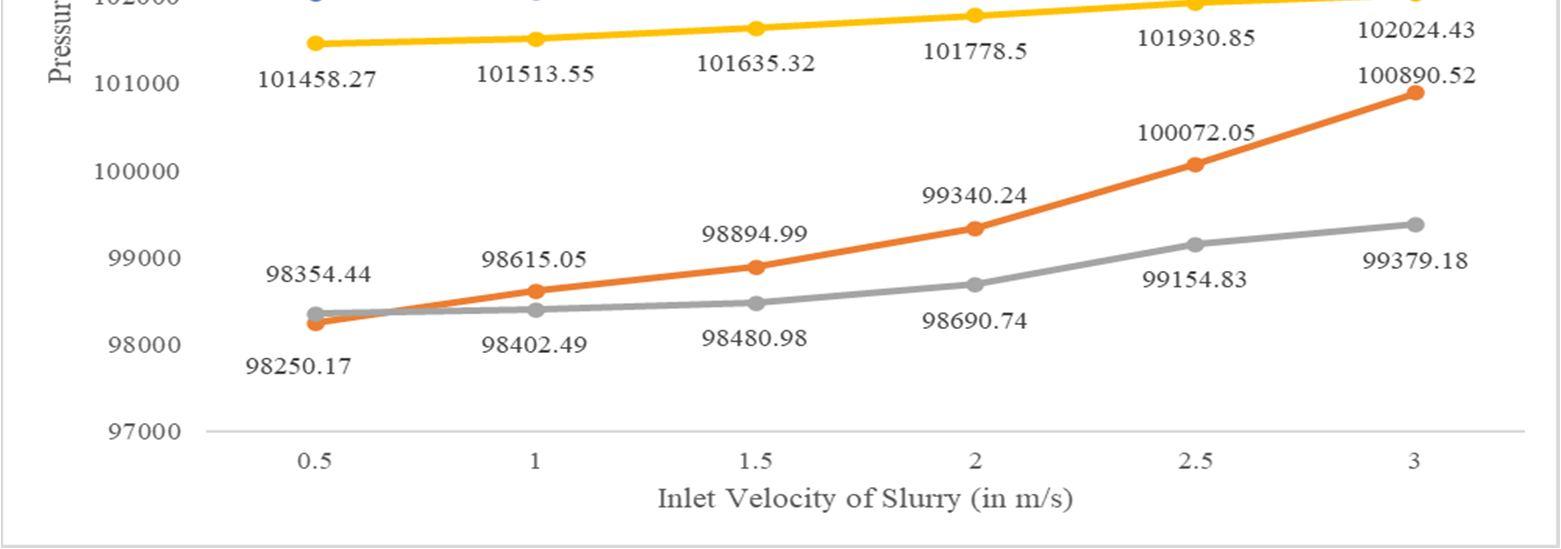
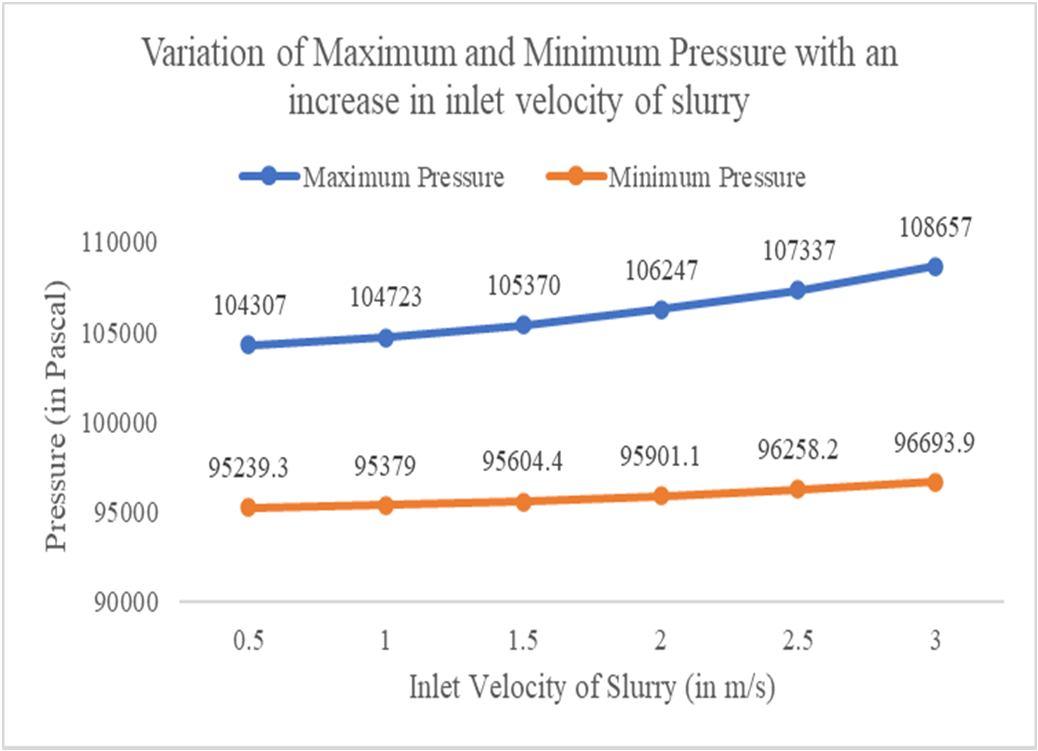
The graphs represented in fig. 22, fig. 23 and fig. 24 indicate the plot of maximum and minimum pressure inside the pipeline vs. inlet velocity of slurry, pressure at the inlet and outlet of the pipe vs. inlet velocity of slurry, and the pressure at various bents of the pipeline with respect to the inlet velocity of slurry, respectively, which were plotted taking into consideration the values obtained from table 6. The observations made are – with an increase in velocity at the inlet of the pipeline system from 0.5 m/s to 3 m/s, the maximum pressure increased substantially from 104307 Pa to 108657 Pa, and the minimum pressure increased minorly from 95239.3 Pa to 96693.9 Pa. Both the pressures at the inlet and the outlet increased during the process, albeit the rise in pressure at the inlet was steep, i.e., from 104096.31 Pa to 108267.77 Pa, as compared to the marginal rise in pressure at the outlet of the pipe, i.e., from 98891.6 Pa to 98936.65 Pa. The value of pressure drop was found to be ranging between 5204.69 Pa and 9331.12 Pa, or 4.99% to 8.61%. The pressure at bends at all the 4 bends were found to be increasing with an increase in the inlet velocity of slurry. While pressure at bend 1 increased rapidly, the same for bends 2 and 3 increased substantially, while for bend 4, it increased marginally.

ISSN: 2321-9653; IC Value: 45.98; SJ Impact Factor: 7.538
Volume 11 Issue II Feb 2023- Available at www.ijraset.com
3) Variation of Pressure Drop with Varying Concentration of solid Particles in Slurry
The variations of the concentration of solids in slurry were done by keeping the area of cross section/outer diameter of the pipeline constant at 15 inches, and inlet velocity of slurry constant at 1.5 m/s. The inner diameter of the pipeline in all the cases was also maintained at 14.5 inches. The concentration of solids in slurry were varied as follows – 30%, 40%, 50%, 60%, 70% and 80% respectively. The radius of curvature of pipeline bend was also kept constant at R1000. The results thus obtained are shown in Table 7 below, and also plotted in graphs.


Table 7
Variation of pressure inside the pipeline with an increase in concentration of solids in slurry

ISSN: 2321-9653; IC Value: 45.98; SJ Impact Factor: 7.538
Volume 11 Issue II Feb 2023- Available at www.ijraset.com
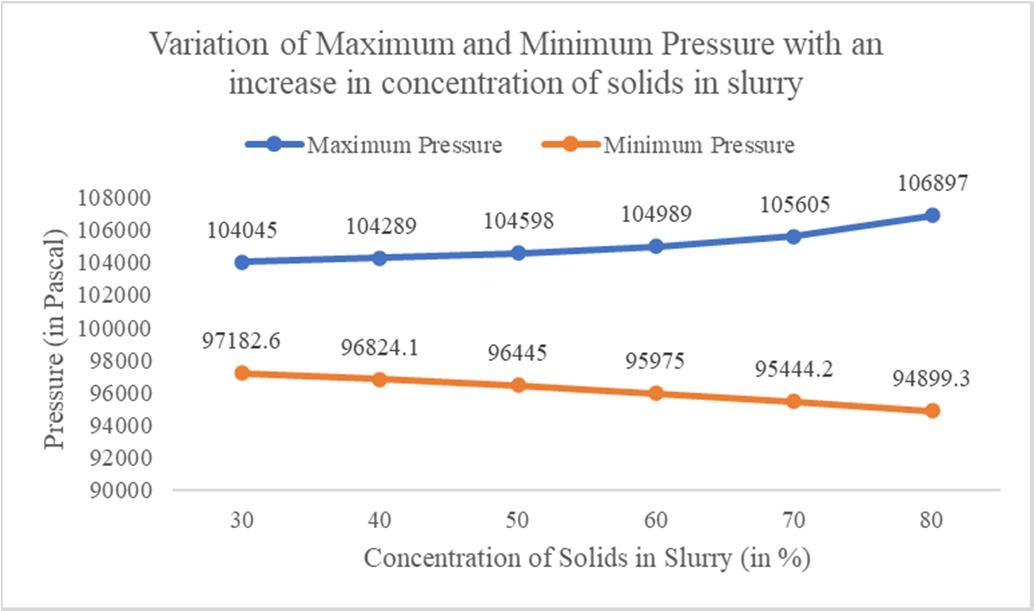
The graphs represented in fig. 25, fig. 26 and fig. 27 indicate the plot of maximum and minimum pressure inside the pipeline vs. concentration of solids in slurry, pressure at the inlet and outlet of the pipe vs. concentration of solids in slurry, and the pressure at various bents of the pipeline with respect to the concentration of solids in slurry, respectively, which were plotted taking into consideration the values obtained from table 7. The observations made are – when the concentration of solids in the slurry flowing inside the pipeline was increased from 30% to 80%, the maximum pressure was found to be increasing from 104045 Pa to 106897 Pa, while the minimum pressure inside the pipeline decreased notably from 97182.6 Pa to 94899.3 Pa. Also, while the inlet pressure varied in the same manner as the maximum pressure, slow initially and steeper afterwards, from 103861.93 Pa to 106636.14 Pa, the outlet pressure fell minorly during the process, from 99593.38 Pa to 98498.03 Pa. The value of pressure drop was found to be ranging between 4268.55 Pa and 8138.11 Pa, or 4.1% to 7.63%. While the pressure at bend 1 of the pipeline system were found to be increasing rapidly, the same for bend 4 was found to be falling albeit slowly, while the same in bends 2 and 3 were found to be decreasing, though for bend 2, it decreased slowly and for bend 3 it decreased rapidly with an increase in concentration of solid particles in slurry.
4) Variation of Pressure drop with Varying Diameter of Cross Section of Pipeline pressure inside the pipe with an increase in diameter of cross section of pipe


The variations of the diameter of cross section of the pipeline were done by keeping the bend angles of the pipe constant at 6⁰, and inlet velocity of slurry constant at 1.5 m/s. The inner diameter of the pipeline in all the cases was also maintained at 0.5 inches less than the outer diameter. The diameter of cross section of the pipeline were varied as follows – 10 inches, 15 inches, 20 inches, 25 inches, 30 inches, 35 inches respectively. The radius of curvature of pipeline bend was also kept constant at R1000. The results thus obtained are shown in Table 8 below, and also plotted in graphs.
ISSN: 2321-9653; IC Value: 45.98; SJ Impact Factor: 7.538
Volume 11 Issue II Feb 2023- Available at www.ijraset.com
The graphs represented in fig. 28, fig. 29 and fig. 30 indicate the plot of maximum and minimum pressure inside the pipeline vs. diameter of cross section of the pipeline, pressure at the inlet and outlet of the pipe vs. diameter of cross section of the pipeline, and the pressure at various bents of the pipeline with respect to the diameter of cross section of the pipeline, respectively, which were plotted taking into consideration the values obtained from table 8. The observations made are – an increase in the size of the pipeline diameter from 10 inches to 35 inches caused the maximum velocity inside the pipeline to rise substantially from 105106 Pa to 109245 Pa, and the minimum pressure inside the pipeline to fall steeply from 96597.2 Pa to 90828.6 Pa. The pressure at the inlet of the pipeline rose notably from 104933.79 Pa to 108619.79 Pa, and the outlet pressure fell substantially from 99624.16 Pa to 94620.97 Pa. The value of pressure drop was found to be ranging between 5309.63 Pa and 13998.82 Pa, or 5.05% to 12.88%. While the pressure at all the four bends were found to be decreasing, the pressure values at bends 2 and 4 decreased slowly, the same for bend 1 decreased steeply, and the same for bend 3 fell marginally till a cross section of 25 inches, after which, it fell drastically with an increase in concentration of solid particles in slurry.

C. For Radius of Curvature of Bends – R1500
1) Variation of Pressure drop with Varying bend Angles of the Pipeline
The variations of the angles of bends of the pipeline were done by keeping the area of cross section/outer diameter of the pipeline constant at 15 inches, and inlet velocity of slurry constant at 1.5 m/s. The inner diameter of the pipeline in all the cases was also maintained at 14.5 inches. The bend angles were varied as follows - 3°, 6°, 9°, 12°, 15°, and 18°, respectively. The radius of curvature of pipeline bend was also kept constant at R1500. The results thus obtained are shown in Table 9 below, and also plotted in graphs.
Table 9 – Variation of pressure inside the pipeline with an increase in bend angles

ISSN: 2321-9653; IC Value: 45.98; SJ Impact Factor: 7.538
Volume 11 Issue II Feb 2023- Available at www.ijraset.com
The graphs represented in fig. 31, fig. 32 and fig. 33 indicate the plot of maximum and minimum pressure inside the pipeline vs. bend angles of the pipe system, pressure at the inlet and outlet of the pipe vs. bend angles of the pipe system, and the pressure at various bents of the pipeline with respect to the bend angles, respectively, which were plotted taking into consideration the values obtained from table 9. The observations made are – with an increase in angle of bend of the pipeline system from 3⁰ to 18⁰, the maximum pressure increased marginally from 105297 Pa to 105436 Pa, and the minimum pressure dropped substantially from 97300.8 Pa to 88676.9 Pa. But the pressure at the inlet somewhat noticeably increased, from 103792.13 Pa to 105279.29 Pa and the outlet pressure decreased in a similar fashion from 100170.18 Pa to 98735.13 Pa respectively. The value of pressure drop was found to be ranging between 3621.95 Pa and 6544.16 Pa, or 3.48% to 6.21%. While the pressure at bends 1 and 4 of the pipeline system was found to be increasing, the same in bends 2 and 3 were found to be decreasing substantially with an increase in the angles of bend of the pipeline.


ISSN: 2321-9653; IC Value: 45.98; SJ Impact Factor: 7.538
Volume 11 Issue II Feb 2023- Available at www.ijraset.com
2) Variation of Pressure Drop with Varying inlet Velocity of Slurry
The variations of the inlet velocity of slurry were done by keeping the area of cross section/outer diameter of the pipeline constant at 15 inches, and bend angles at 6⁰. The inner diameter of the pipeline in all the cases was also maintained at 14.5 inches. The inlet velocities were varied as follows – 0.5 m/s, 1.0 m/s, m/s, and 3.0 m/s respectively. The radius of curvature of pipeline bend was also kept constant at R1500. The results thus obtained are shown in Table 10 below, and also plotted in graphs.

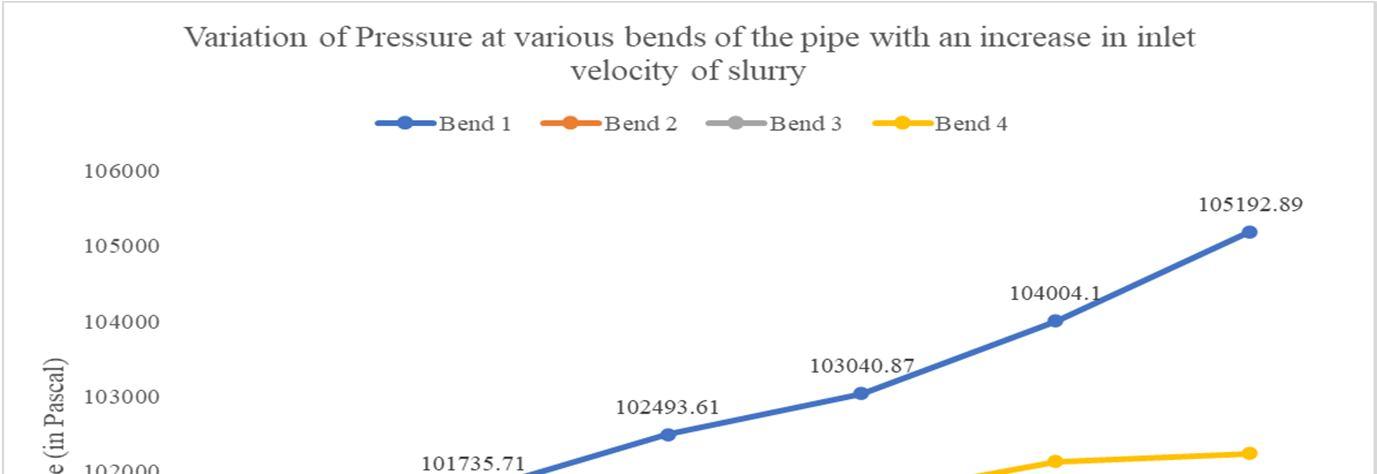
Table 10 – Variation of pressure inside the pipeline with an increase in inlet velocity of slurry values in the pipeline (in Pa)


ISSN: 2321-9653; IC Value: 45.98; SJ Impact Factor: 7.538
Volume 11 Issue II Feb 2023- Available at www.ijraset.com
The graphs represented in fig. 34, fig. 35 and fig. 36 indicate the plot of maximum and minimum pressure inside the pipeline vs. inlet velocity of slurry, pressure at the inlet and outlet of the pipe vs. inlet velocity of slurry, and the pressure at various bents of the pipeline with respect to the inlet velocity of slurry, respectively, which were plotted taking into consideration the values obtained from table 10. The observations made are – with an increase in velocity at the inlet of the pipeline system from 0.5 m/s to 3 m/s, the maximum pressure increased substantially from 104303 Pa to 108806 Pa, and the minimum pressure increased minorly from 95235.9 Pa to 96692.1 Pa. Both the pressures at the inlet and the outlet increased during the process, albeit the rise in pressure at the inlet was steep, i.e., from 104093.42 Pa to 108258.96 Pa, as compared to the marginal rise in pressure at the outlet of the pipe, i.e., from 98890.35 Pa to 98934.79 Pa. The value of pressure drop was found to be ranging between 5203.07 Pa and 9324.17 Pa, or 4.99% to 8.61%. The pressure at bends at all the 4 bends were found to be increasing with an increase in the inlet velocity of slurry. While pressure at bend 1 increased rapidly, the same for bends 2 and 3 increased substantially, while for bend 4, it increased marginally.

3) Variation of Pressure drop with Varying Concentration of Solid Particles in Slurry
The variations of the concentration of solids in slurry were done by keeping the area of cross section/outer diameter of the pipeline constant at 15 inches, and inlet velocity of slurry constant at 1.5 m/s. The inner diameter of the pipeline in all the cases was also maintained at 14.5 inches. The concentration of solids in slurry were varied as follows
30%, 40%, 50%, 60%, 70% and 80% respectively. The radius of curvature of pipeline bend was also kept constant at R1500. The results thus obtained are shown in Table 11 below, and also plotted in graphs.
ISSN: 2321-9653; IC Value: 45.98; SJ Impact Factor: 7.538
Volume 11 Issue II Feb 2023- Available at www.ijraset.com
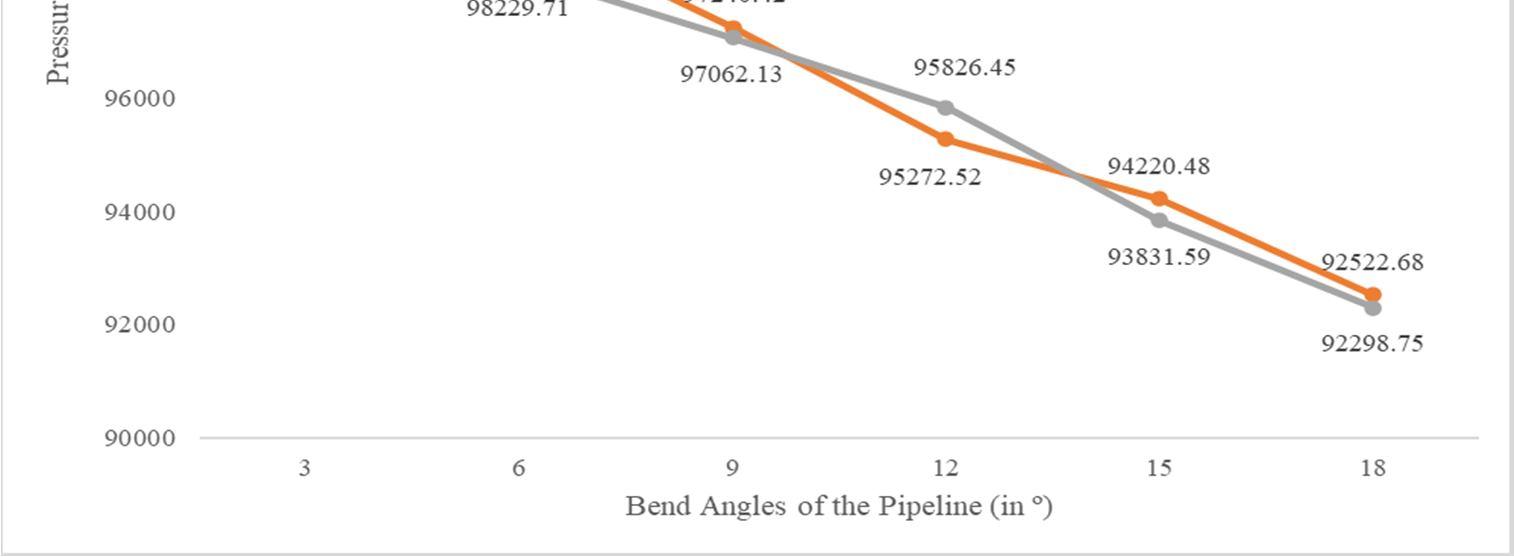
Fig. 39
Variation pressure at various bends inside the pipeline with an increase in concentration of solids in slurry
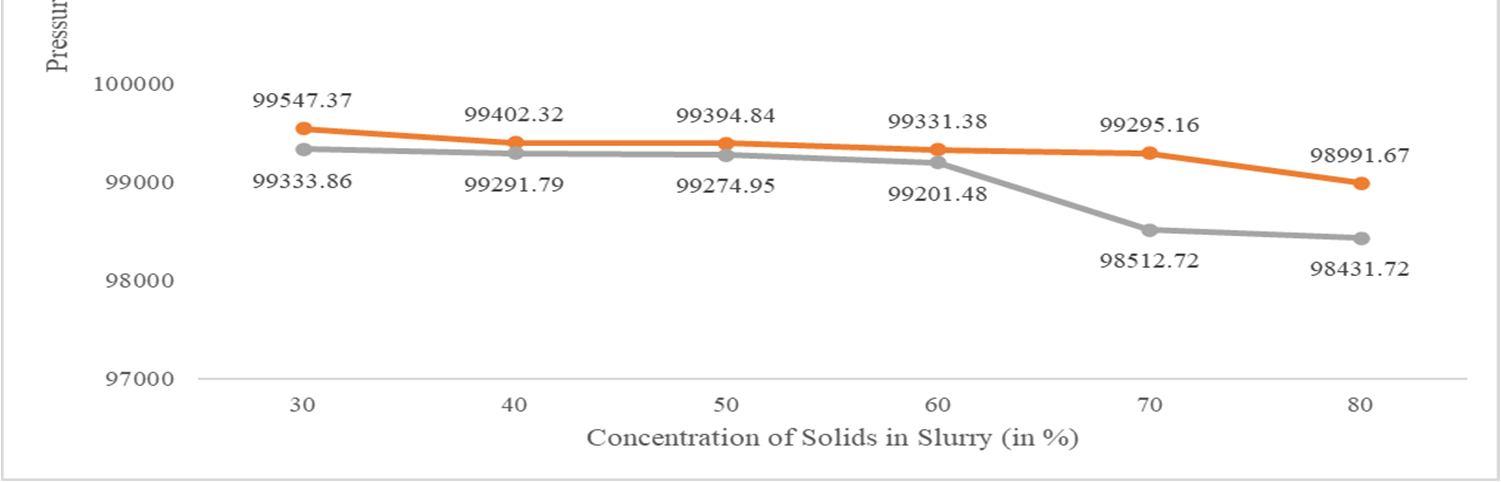

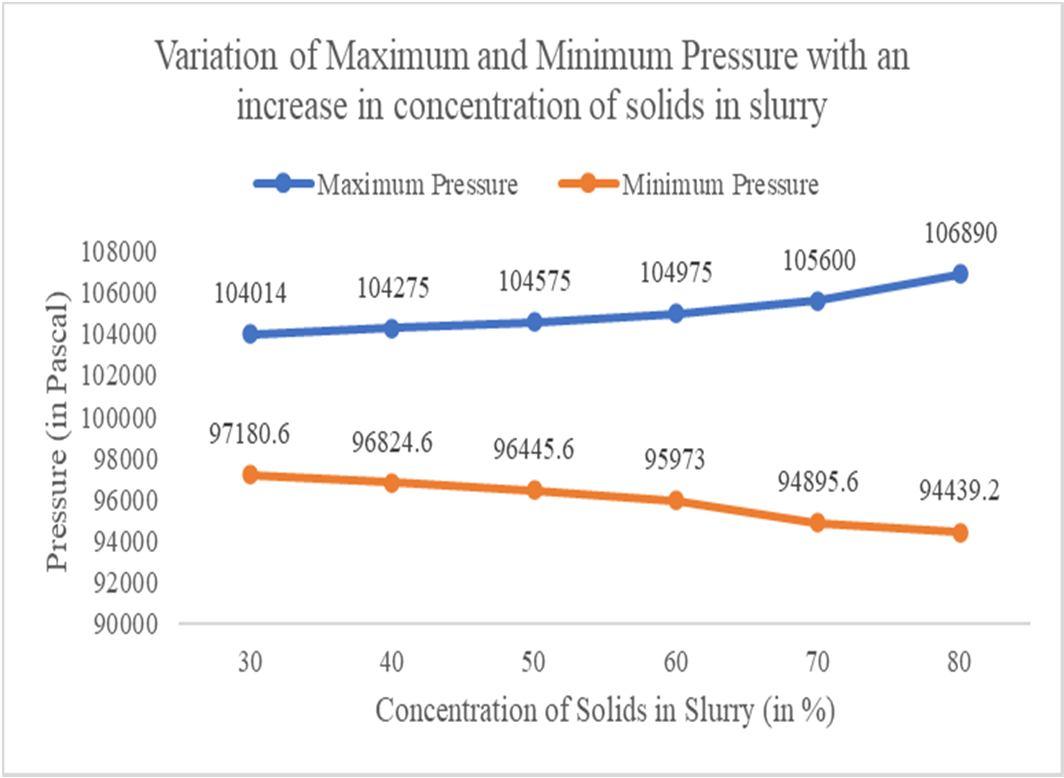
The graphs represented in fig. 37, fig. 38 and fig. 39 indicate the plot of maximum and minimum pressure inside the pipeline vs. concentration of solids in slurry, pressure at the inlet and outlet of the pipe vs. concentration of solids in slurry, and the pressure at various bents of the pipeline with respect to the concentration of solids in slurry, respectively, which were plotted taking into consideration the values obtained from table 11. The observations made are – when the concentration of solids in the slurry flowing inside the pipeline was increased from 30% to 80%, the maximum pressure was found to be increasing from 104014 Pa to 106890 Pa, while the minimum pressure inside the pipeline decreased notably from 97180.6 Pa to 94439.2 Pa. Also, while the inlet pressure varied in the same manner as the maximum pressure, slow initially and steeper afterwards, from 103861.93 Pa to 106633.29 Pa, the outlet pressure fell minorly during the process, from 99589.91 Pa to 98491.4 Pa. The value of pressure drop was found to be ranging between 4271.48 Pa and 8141.82 Pa, or 4.11% to 7.63%. While the pressure at bend 1 of the pipeline system were found to be increasing rapidly, the same for bend 4 was found to be falling albeit slowly, while the same in bends 2 and 3 were found to be decreasing, though for bend 2, it decreased slowly and for bend 3 it decreased rapidly after 60% solids concentration, with an increase in concentration of solid particles in slurry.
4) Variation of Pressure Drop with Varying Diameter of Cross Section of Pipeline
The variations of the diameter of cross section of the pipeline were done by keeping the bend angles of the pipe constant at 6⁰, and inlet velocity of slurry constant at 1.5 m/s. The inner diameter of the pipeline in all the cases was also maintained at 0.5 inches less than the outer diameter. The diameter of cross section of the pipeline were varied as follows – 10 inches, 15 inches, 20 inches, 25 inches, 30 inches, 35 inches respectively. The radius of curvature of pipeline bend was also kept constant at R1500. The results thus obtained are shown in Table 12 below, and also plotted in graphs.
Table 12 – Variation of pressure inside the pipe with an increase in diameter of cross section of pipe
ISSN: 2321-9653; IC Value: 45.98; SJ Impact Factor: 7.538
Volume 11 Issue II Feb 2023- Available at www.ijraset.com
Fig. 42
Variation pressure at various bends inside the pipe with an increase in diameter of cross section of pipeline


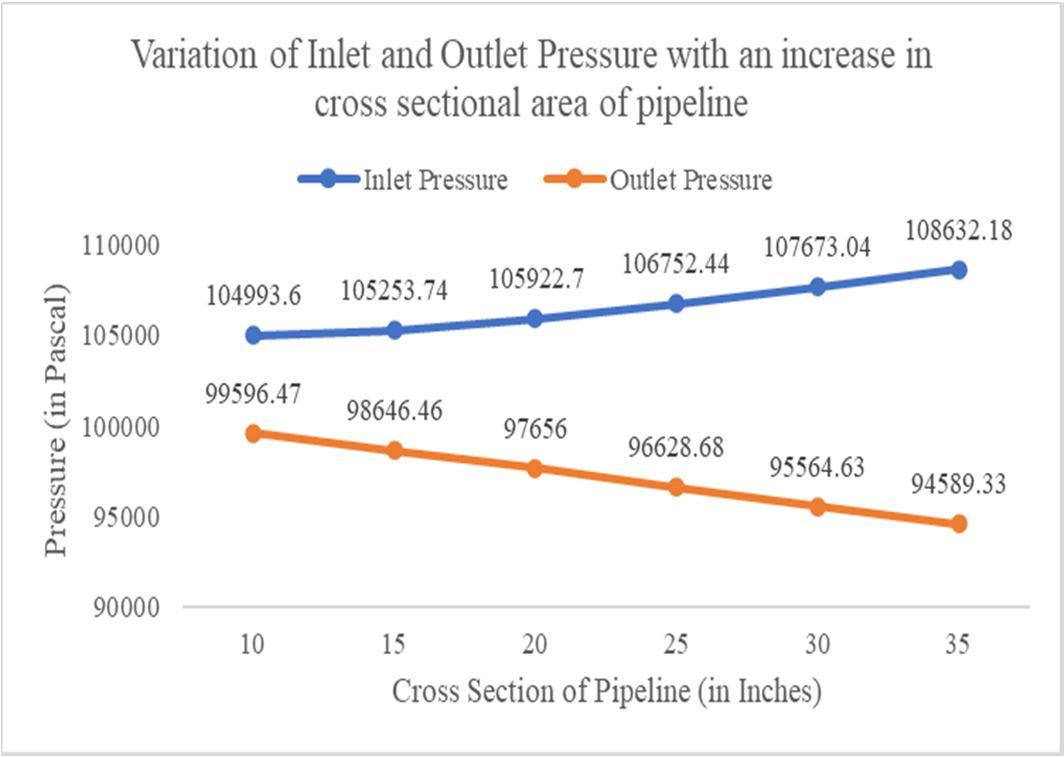
The graphs represented in fig. 40, fig. 41 and fig. 42 indicate the plot of maximum and minimum pressure inside the pipeline vs. diameter of cross section of the pipeline, pressure at the inlet and outlet of the pipe vs. diameter of cross section of the pipeline, and the pressure at various bents of the pipeline with respect to the diameter of cross section of the pipeline, respectively, which were plotted taking into consideration the values obtained from table 12. The observations made are – an increase in the size of the pipeline diameter from 10 inches to 35 inches caused the maximum velocity inside the pipeline to rise substantially from 105100 Pa to 109224 Pa, and the minimum pressure inside the pipeline to fall steeply from 96597.9 Pa to 90829.4 Pa. The pressure at the inlet of the pipeline rose notably from 104933.6 Pa to 108632.18 Pa, and the outlet pressure fell substantially from 99596.47 Pa to 94589.33 Pa. The value of pressure drop was found to be ranging between 5397.13 Pa and 14042.85 Pa, or 5.14% to 12.92%. While the pressure at all the four bends were found to be decreasing, the pressure values at bends 2, 3 and 4 decreased slowly, the same for bend 1 decreased steeply with an increase in concentration of solid particles in slurry.


