https://doi.org/10.22214/ijraset.2023.48717

11 I January 2023
ISSN: 2321-9653; IC Value: 45.98; SJ Impact Factor: 7.538
Volume 11 Issue I Jan 2023- Available at www.ijraset.com

https://doi.org/10.22214/ijraset.2023.48717
ISSN: 2321-9653; IC Value: 45.98; SJ Impact Factor: 7.538
Volume 11 Issue I Jan 2023- Available at www.ijraset.com
1M. Tech Scholar, Department of Electronics and Communication Engineering, RIMT University, Mandi Gobindgarh, Punjab, India
2Technical Head, Department of Research, Innovation and Incubation, RIMT University, Mandi Gobindgarh, Punjab India

3Professor, Department of Electronics and Communication Engineering, RIMT University, Mandi Gobindgarh, Punjab, India
Abstract: Due to facility damage and a lack of power, natural disasters disrupt vital services. When the main nodes of a hierarchical network, such as a cellular communication system, are compromised or overloaded, major communication failures frequently happen over a large geographic area. High throughput satellite (HTS) is one of the best options for disaster management as an alternate communication capability since it offers effective communication for a large area regardless of the availability of conventional terrestrial infrastructures. Conventional HTS, on the other hand, uses fixed beam bandwidth and connections for relaying data, making it ineffective when communication demand spikes in a disaster area. Therefore, the work has developed an Intelligent Disaster prediction in a communication network that alters and empowers the decision-making process to avoid a False alarm rate toward transmitting data to the digital world in a better way using the OAN-ANFIS technique based on the TEM Feature selection approach. To limit the likelihood of inaccuracy, the suggested framework first preprocesses the data by transforming unstructured data into arranged manner. The preprocessing technique handles missing values, scaling, and addressing imbalanced data. Following that, the preprocessed data is subjected to Feature selection using the TEM technique, which combines three metaheuristic algorithms, namely Xinit-FSO, LCV-ChoA, and AL-HDC, to pick the optimum feature to train the node recognition model. To obtain a high accuracy rate, the proposed Feature selection technique captures the most known feature to train the model. Finally, OAN-ANFIS predicts the various Disaster limitations of communication. The tentative outcome suggests that the proposed framework has high adaptive predictive compression approaches and achieves higher accuracy than existing strategies.
Keywords: Disaster Risk, Communication System, Electronic Communication, Artificial intelligence, Threshold ensemble perturbation Method, optimal attention network-based adaptive neuro-fuzzy interference system.
Risk occasions imply physical and digital foundations are turning out to be progressively normal and complex. In February 2021, a monstrous energy, water, and correspondence foundation failure in Texas, USA, came about because of an uncommon winter climate occasion [1], [2]. The powerful coincidence conversion of power lattice failure and natural, social, and political elements brought about a philanthropic emergency. Expanded monetary interdependencies across locales and countries have likewise significantly shown the critical impacts of disasters on supply chains. For instance, the 2004 Indian Sea Wave. Seriously disturbed the development of vehicles in Japan and made a fountain of supply deficit around the world [3], [4]. Likewise, in May 2021, a digital break of Pilgrim Pipeline prompted a far and wide fuel blackout in the mid-Atlantic US, with the potential for huge closures in the development of products, administrations, and individuals [5]. Besides, the May 2021 ransomware assault closure of JBS the biggest meat provider on the planet has shown weakness in the business area [6], and a resulting Kaseya assault has shown the potential for additional far and wide blackouts in framework and trade [7].
While the priority for these far and wide goes after is evident, there is potential for substantially more unfortunate results [8]. Artificial intelligence (AI) can be broadly used to oversee tasks for various frameworks, like foundation, online protection, and assembling [9].
ISSN: 2321-9653; IC Value: 45.98; SJ Impact Factor: 7.538
Volume 11 Issue I Jan 2023- Available at www.ijraset.com
These physical, digital, and digital actual frameworks give the establishment of working social orders. Mistakes or accidental abuse of AI for risk utilization of these frameworks can bring about destroying outcomes [10]. The arising utilization of AI can impact the probability of the result of risk occasions for these frameworks. In any case, it isn't certain if AI strategies would have forestalled or decreased the outcomes of the risk occasions portrayed previously [11]. Existing exploration is completely characterized connect with the capacity to oversee risk; and how powerful risk standards frameworks worked by AI advances [12].
It is essential to address and examine this connection between AI and risk because failures of AI-driven frameworks can be severe, possibly exceeding the effects of other types of disasters typically discussed in the risk field [13]. Although the use of AI in foundation frameworks is relatively new, the concept of AI has been around since the 1930s. Turing (1950) is credited with introducing AI as a logical strategy, as is the 1956 gathering at Dartmouth School, where it was officially launched [14]. The development of mechanical capabilities is largely to blame for AI's recent ubiquity, whereas AI-specific algorithms and methods have been around for a very long time. According to Bini (2018), power management, valued at billions of dollars in the 1970s, is comparable to moderately cost-effective advancements today. Processing, medical services, and assembly are just a few of the industries in which advancements and applications of AI techniques have become unavoidable up until this point. According to Bhattacharya and Singh (2020) [15], despite AI's growing utility and widespread use, a few studies have concluded that it is still underutilized and has not yet reached its full potential.
In set-hypothetical terms, AI strategies are thought to include a subset of ML techniques, with ML covering a significant portion of AI usage. In addition, regulated, unaided, support, and profound learning are subsets of ML [16]. This study makes use of the expertise of experts in risk and artificial intelligence to comprehend the primary characteristics of a reciprocal risk-AI approach that can utilize the characteristics of the two disciplines while also investigating potential future opportunities to expand the collaboration between risk and AI. We build a structure based on this information to understand how to use AI to manage risk, what new or additional risks AI strategies present, and whether key risk standards and suspicions are sufficient for AI-based applications. The risk professional will benefit from this arrangement framework in identifying differences between risk and AI, particularly when developing new AI-influencing techniques and models. [17], [18].
There is a requirement for a typical structure to assess whether essential suppositions are being met in a manner that is similar to an examination of presumptions and residuals in a factual report. The objective of the proposed framework is illustrated:
1) To define the proper usage of AI with the choice of mathematical models, methods, and practices.
2) To discover the prediction algorithm linking AI and catastrophe risk.
3) To assess the prediction algorithm in light of mathematical techniques and models as well as risk concepts and presumptions
4) To provide disaster risk prediction services based on AI assumptions and risk variables.
5) To calculate the disaster risk by extracting decision rules from a suggested tree-based model.
As will be examined in ensuing segments of this review, an essential rule for the choice of the study respondents is their immediate experience and topic skill in either the field of AI or disaster risk examination or both
Kannan and Vasanthi (2019) researched the presentation of four unique algorithms for disaster risk prediction. Utilizing 14 elements the disaster risk is anticipated utilizing SVM, GB, RF, and calculated relapse. The aftereffect of the review uncovered that calculated relapse accomplished the most elevated precision of 87% than different models.
Nakanishi et al. (2018) assessed machine learning algorithms that can perform better compared to the standard strategies for atherosclerosis in multi-ethnic reviews. Machine learning algorithms showed a preferable precision rate over different techniques. The review utilized Region Under Bend (AUC) as an assessment metric and an AUC of 76% is accomplished in the review outflanking other individual models to identify CHD.
Haq et al. (2018) proposed a mixture technique for identifying disaster risk utilizing seven unique algorithms. The proposed technique embraced highlight determination utilizing mRMR, and Rope to choose significant elements. The chosen highlights are utilized to arrange disaster risk utilizing calculated relapse, KNN, ANN, SVM, NB, DT, and RF. The review reasoned that strategic relapse beats different techniques with an exactness of 89% while involving help as a component choice strategy and showed that highlight determination algorithms work on model exhibitions and bring down the handling time.
Maji and Arora (2019) proposed a crossover model for recognizing disaster risk. The crossover model is developed utilizing DT and Artificial Brain Organization (ANN). The exhibition of the mixture model is assessed utilizing 10 overlay cross-approval. The model accomplished better precision of 78%, the responsiveness of 78%, and explicitness of 22.9%.
ISSN: 2321-9653; IC Value: 45.98; SJ Impact Factor: 7.538
Volume 11 Issue I Jan 2023- Available at www.ijraset.com
Dwivedi (2018) concentrated on the presentation of various machine learning algorithms for anticipating risk. The review looked at ANN, SVM, Calculated relapse, KNN, characterization tree, and NB. The presentation of these models is tried utilizing 10 crease cross approval. The review presumed that strategic relapse accomplished the most noteworthy exactness of 85% with better accuracy.
Raza (2019) proposed a strategy to work on the prediction of disaster risk utilizing outfit learning models and greater part casting ballot rules. The outfit classifier is built utilizing Outrageous Learning Machines (ELM), choice tree, pivot timberland, half and half hereditary fluffy model, and strategic relapse. The proposed group model beats different techniques by the most elevated precision score of 88%.
Mathan et al. (2018) proposed a clever strategy for distinguishing disaster risk utilizing choice trees and brain organization. The proposed model accomplished a better accuracy rate when joined with gain proportion and increase in exactness over different models, for example, data gain and Gini list. The proposed work is reasonable for distinguishing heart ailments in the beginning phase.
Amin et al. (2019) proposed a mixture model to recognize disaster risk utilizing highlight choice. The proposed model is assembled utilizing NB with casting a ballot plot and strategic relapse. The presentation of the model is assessed utilizing SVM, KNN, choice tree, and brain organization. The proposed model accomplished a precision of 87.4% and beats different models.
Fahad et al. (2014) directed an overview of grouping algorithms utilizing a trial study. The review approved the exhibition of five algorithms for strength, adaptability, runtime, and so on. The review presumed that DENCLUE, Opti matrix, and Birch show better execution regarding adaptability and proficiency than different algorithms.
Bohacik et al. (2013) examined the exhibition of a choice tree involving a changed rendition for disaster risk prediction. The prediction model accomplished a precision of 77% and explicitness of 91% utilizing 10-crease cross-approval.
Masetic and Subasi (2016) assessed the exhibition of machine learning algorithms for the characterization of disaster risk. The review incorporated includes determination and grouping procedures. Utilizing autoregressive Burg include choice, the grouping was directed utilizing C4.5, KNN, SVM, ANN, and Arbitrary Woods (RF) classifiers. The review result shows that RF accomplished a most noteworthy precision of 100 percent than different models in identifying disaster risk.
Zheng et al. (2015) fostered a PC-helped model to recognize cardiovascular breakdown. The review utilized heart sound credits to group cardiovascular breakdown. Least Squares-Backing Vector Machine (LS-SVM), Stowed away Markov Model (Well), and Artificial Brain Organization Back Proliferation (ANN-BP) classifiers are utilized to arrange the heart sound highlights. The leastsquare help vector classifier accomplished an exactness of 95% than different models. The review inferred that the proposed model enhanced cardiovascular breakdown analysis.
Acharya et al. (2017) proposed a convolution brain organization to group heartbeats for five distinct problems. The review utilized includes determination techniques to work on the grouping. The convolution brain network was developed utilizing 9 layers and the precision of the organization showed further developed execution when include determination is applied. The exactness of the model showed a superior worth of 94%.
Vivekanandan et al. (2017) proposed a clever strategy for anticipating cardiovascular disaster risk utilizing machine learning algorithms. The proposed model was created utilizing altered Differential development methodology on fluffy Scientific Order Interaction (AHP) and feed-forward Brain Organization (NN) for the prediction of disaster risk. The proposed model accomplished a precision of 83% more than other machine learning models. The presentation of the model was helped because of element determination.
Nilashi et al. (2017) proposed a scientific strategy for disaster prediction utilizing machine learning methods. Utilizing Assumption Amplification (EM), Head Part Examination (PCA), Order and Relapse Tree (Truck), and rule-based strategy the proposed technique was created and tried on different datasets. The review inferred that the blend of element determination and grouping further developed the disaster risk recognition rate on seven datasets with high exactness.
Tran et al. (2018) proposed a clever technique for characterization utilizing highlight determination and missing worth treatment. The proposed strategy is assessed on ten different quality articulation datasets utilizing different troupe techniques like brain network gathering and irregular subspace technique. The component choice is done by hereditary technique. The ascription of missing qualities and component determination further developed the tree model with better precision on all datasets.
Ani et al. (2018) proposed a changed pivot timberland for the order of infection. Utilizing LDA, the element project is utilized in changed pivot woods. The proposed model is thought about against various troupes because of pivot timberland utilizing arbitrary woods, NB, choice tree, and LDA. The proposed adjusted revolution backwoods accomplish 95% of exactness than different models.
ISSN: 2321-9653; IC Value: 45.98; SJ Impact Factor: 7.538
Volume 11 Issue I Jan 2023- Available at www.ijraset.com
Paul et al. (2018) proposed another coronary illness arrangement model and a viable dynamic master framework. The proposed model is created utilizing a hereditary algorithm and altered multi-swarm molecule swarm streamlining. The fluffy master framework utilizes highlights choice capacity utilizing measurable techniques. The gatherings are built utilizing highlight choice algorithms. The proposed model showed improved results when exactly tried with a genuine coronary illness dataset. The review exhibited that different component determination procedures adjust different datasets proficiently and showed better precision results.
Wu et al. (2019) proposed a new technique to recognize greasy liver illness utilizing machine learning algorithms. The model is created to anticipate high-risk patients utilizing RF, NB, ANN, and Strategic relapse. The model showed better execution while utilizing ten times cross approval and the RF model accomplished improved results with 92% of exactness than different techniques.
Książek et al. (2019) proposed another strategy to characterize hepatic cell carcinoma. Utilizing a hereditary algorithm includes that are pertinent are chosen and the classification of carcinoma was completed utilizing a two-stage hereditary enhancer and ten unique classifiers. The model combined with SVM and hereditary analyzer accomplished the most noteworthy precision of 88% than different models.
Burse et al. (2019) proposed a brain network-based grouping framework utilizing a multi-facet pi-sigma network for coronary illness. Utilizing bi-polar actuation capability, the brain network back spread was trained. Utilizing preprocessing methods, the model was trained with PCA as a component choice. The exhibition of the model showed a better precision aftereffect of 94.53% against different strategies.
Ramesh et al. (2019) examined the presentation of classifiers utilizing helping, and sacking procedures on DT, KNN, SVM, RF, and NB. The use of helping and sacking strategy worked on the model execution of SVM, KNN, and DT. While helping worked on the irregular woods model, the exhibition of the models was assessed utilizing different clinical datasets.
Ebenuwa et al. (2019) proposed another component determination technique utilizing positioned request closeness strategy and looked at it against relationship and data gain strategies. The chosen highlights are utilized to order ongoing sickness utilizing strategic relapse, SVM, and DT. The proposed highlight positioning technique is more proficient than different strategies as the classifier exhibitions are expanded through include choice. The element determination strategy chose the most reduced number of highlights than data gains and connection techniques
A sufficient amount of data must be used to examine the effectiveness of various machine learning algorithms for recognizing the presence of catastrophe risk. Additionally, datasets describing the condition of a chosen area are also used to compare how well different machine learning algorithms work. Any model's performance varies depending on the number of features, data instances, classes, and balance.
The inclusion of missing values, outliers, and unbalanced data can all have an impact on how well data mining models work. In the field of risk prediction, it is more expensive to anticipate a positive risk incorrectly than a negative risk. A negative case is one in which the disease is missing, while a positive risk is when the condition is present. A contingency table with rows and columns is known as a confusion matrix.
Each column represents a projected class label, whereas each row contains the actual class labels. The prediction model's outcomes are listed in the confusion matrix. The effectiveness of disaster risk prediction can be increased with the use of decision support systems. A decision support system improves the effectiveness of the decision-making process by locating facts and evidence within a massive quantity of data.
The goal of the study is to increase the rate at which risks are detected, to pinpoint significant details, to enhance risk estimation by pinpointing risk factors, and to forecast the likelihood of disaster. By locating the important aspects and then calculating risk from those traits, the quality of the remedial plans may be enhanced. Additionally, management may raise the quality of their services by anticipating catastrophe risk and providing the necessary resources and relief facilities. With the help of the suggested framework, management will gain more from the system's wellinformed judgments.
With the facts and proof in the data, the suggested approach aids in making accurate predictions. Fig 1 depicts a schematic depiction of the planned work.
ISSN: 2321-9653; IC Value: 45.98; SJ Impact Factor: 7.538
Volume 11 Issue I Jan 2023- Available at www.ijraset.com
The dataset is pre-handled before being taken care of into the brain network for expectation. The preprocessing has two stages. In the initial step, the informational index is partitioned into two sets: the preparing set and the test set. The dataset is parted into 7525 rate extent for preparing and testing separately. In the following stage, information standardization is performed utilizing MinMax scaling. The preparation set is fitted onto the Min-Max scaling and afterward, the change is finished on the preparation set followed by the change on the test set. This is a fundamental step when mathematical qualities have various scales, which is the situation with Parkinson's sickness forecast inputs. The scaling guarantees that every one of the qualities in the set is scaled to be in a predetermined reach so the brain organization can run better with more modest standard deviations.

1) Handling of Missing Data: To define a missing value a, let Coll N be the dataset in the form of a data matrix which is then decomposed to
, indicate the noticed and missing information. Let g missin signify a missing worth framework characterized by,
mis Nis if observed is N if N
Let Q denote vectors of predicted values and the relationship between missingness g mis N sin and the number of observations
CollN . As we will see later, the missing qualities systems are portrayed by the likelihood of whether a worth is distinguished or missing.
Missing completely at random (MCAR): Since absent information isn't dependent on observable and unobservable measures, this occurs. The MCAR probability is specifically defined as:
Missing at random (MAR): In MAR, the probability of a missing value is only connected to observed evidence. The likelihood of MAR is given by:
Missing at random (MAR) is a frequent thing in data sets from health science studies. Missing values can be addressed by observable predictors in this technique.
ISSN: 2321-9653; IC Value: 45.98; SJ Impact Factor: 7.538
Volume 11 Issue I Jan 2023- Available at www.ijraset.com
Missing not at random (MNAR): This applies while the missing information is neither MCAR nor MAR. The missing is not entirely set in stone by both the absent and noticed values. Taking care of missing qualities in this technique is much of the time tricky because it is reliant upon a new dataset. The MNAR probability is determined as follows:
The likelihood of whether a position
is missing or observed depends on both
2) Scaling: Scaling is a strategy for standardizing the independent features present in data within a given range. It is used during the information that was before to deal with drastically changing orders of magnitude, values, or types. If the process occurs is not performed, a neural network model will tend to consider greater values higher and evaluate lower numbers lower, irrespective of the measuring device. Outliers in the data sometimes can cause erroneous data scalability. To handle the unscaled data the work has employed a strong data scalability approach to standardize input variables in the presence of outliers from the calculation of the mean and standard deviation, and then scales the parameter using the determined values. This is accomplished by using the Median Absolute deviation -Min Max scalar to determine the minimum MinR and maximum points MaxR . As the existing Min Max scalar doesn’t focus on local points which leads to the escapism of informative data that leads to inaccurate disaster prediction, hence Median Absolute deviation based on the median
collR median R1 has collaborated. The developed MAD-Min Max Scalar is given by:
Hence, the foregoing limitations aid in the conversion of unstructured information to structured information. As a result, the relational database is further processed handling of imbalance dataset.
3) Handling imbalanced datasets and splitting: The large volume of data created regularly by electronic innovations poses a significant problem for traffic noise prediction. This phenomenon is defined not only by the body of data but also by the speed of transmission and the quantity of data; in other words, the big data characteristics. In association with information volume, a dataset is classified as big data when it is challenging to analyze using typical methodological approaches. The unbalanced dataset consists of a majority class and a minority class, with the former having a significantly larger sample size than the other classes. This distinction interrupts the information learning experience, causing machine learning to represent a majority class. This job has been handled using the random under-sampler ros approach described by:
Thereafter, the data is split using K-Fold validation that is given by:
Overall, the cleaned data is processed for optimal feature selection.
B. Feature Selection
Feature selection aids in extracting knowledgeable aspects to train the model in terms of enhancing accuracy rates. Evaluation of attributes aids in identifying node distance that enhances large delay ratios, elevated entirety vigor usage ratios, the bewilderment of the ability to interpret in order band, etc.
Selection of features interprets computation time-saving, link status evaluation between nodes, interfering nodes due to IoT incursion, most favorable announcement node selection, and intellectual spacing collection model for IoT, among other things. As a result, to select the very significant characteristic the work has developed Threshold Ensemble Perturbation Method (TEM) method as shown in fig 2
ISSN: 2321-9653; IC Value: 45.98; SJ Impact Factor: 7.538
Volume 11 Issue I Jan 2023- Available at www.ijraset.com
The proposed approach increases the prediction performance by optimizing complexity and appropriately identifying informative features to minimize significant errors. A Threshold Ensemble Perturbation Method selection technique is proposed. The knowledge of multiple filter measures can be exploited through the function perturbation cycle, resulting in a baseline extracted features that are less sensitive to overfitting.

1) Feature selection model 1: Feature selection model 1( 1FS ) is based on the flamingo bird's foraging and migratory behavior. Based on the limited information given, the Flamingo Search Algorithm attempts to discover the optimal solution in the search region (i.e. the site where the foodstuff is most copious). However, the random updating of 1 and 2 results in a changing maximum distance, resulting in a high failure rate in locating significant features. To avoid this, the FSO is coupled with Xavier initialization, which restricts the value by defining lower and upper bounds based on the attribute properties. Let us suppose that the flamingo with the greatest food in the th j measurement is bj
Assume the thi flamingo's position in the th j flamingo inhabitants is ij and, thinking about the variance of every particular flamingo's decision in nature and the impact of the abruptness of the particular climate on the flamingo's scavenging conduct, the flamingo's searching way of behaving faces a slip-up with the information passed on. The distance metric of the flamingo's nose check during scavenging action can then be determined as
Where 2 is assessed by Xavier initialization. The distance metric is largely meant to enhance the searching area of the flamingo's mouth scan in its hunting mode, where 1 denotes a random integer that matches a conventional normally distributed. To replicate the screening variety of flamingos during beak scan performance, the normality assumption is used again, and its fluctuation curve approximates the variation of the flamingo's beak detection range as
Where 2 is a sequence of numbers with a typical normal curve.
Assuming that the area where food is most plentiful in the colony is
, the distance moved can be characterized as
where 1 is assessed by Xavier initialization, which is primarily used to expand the search area of flamingos foraging and measure
ISSN: 2321-9653; IC Value: 45.98; SJ Impact Factor: 7.538
Volume 11 Issue I Jan 2023- Available at www.ijraset.com
differences between individuals in choosing. To recapitulate, the detecting assortment of the flamingo beak benefits the traveling range of the feet in the tenth iteration's moving stride of flamingos foraging, as seen in (17).
Now with the help of Xavier initialization that is given by:
The location for flamingo foraging behavior is given by:
In (19), 1 t ij indicates the location of the thi flamingo in the th j measurement of the populace in the (t + 1)th iteration, and t ij indicates the location of a flamingo's feet in the t iterative process of the flamingo populace, respectively.
The t iteration bj represents the th j dimension position of the flamingo with the best fitness in the population. ) (n k k indicates a dispersion factor, which would be any arbitrary number with n degrees of freedom and a distribution that resembles a chi-square. to increase the flamingo's hunting territory and to replicate the potential of a person's sense of nature it is used, so enhancing its worldwide merit-seeking abilities.
0,1
are two random values drawn from a regular normal distribution, ε1 and ε2 are randomized by −1 or 1. When food becomes limited in the current hunting region, the group relocates to plentiful. Considering that the position of the nutrition area in the th j coordinate is bj , the flamingo population movement formula is as follows.
In (3), 1 t ij provides the location of the thi flamingo in the th j dimensions of the populace in the t + 1 iteration, and t ij denotes the location of the thi flamingo in the th j dimension of the flamingo population in the t iteration, specifically the flamingo's feet. In the t iteration, this is the jth dimension position of the flamingo with the best fitness in the population. ) (0,n N is a Gaussian distribution number with n of that is used to expand the search area throughout flamingo migration and t jb imitate the unpredictability of individual flamingo behaviors in the specific migration process.
2) Feature selection model 2: Feature selection model 1( 1FS ) is based on Average linkage-based Hierarchical Divisive clustering that acts as automated active learning and provides the accurate accompaniment of the disaster data without local max minima points. Existing HDC leads to overfitting of labeled data that leads to non-correlated data labeling, to conquer the issue Average linkage is used
Average linkage-based Hierarchical Divisive clustering (AL-HDC) is first remembered for a solitary huge group of disaster data. At every cycle, a bunch is additionally separated into two. The central issue rule of how one partition or parts the bunch is the point by point bit by bit:
Input: Alternatives n
........1 , partiality verge value
, and preference matrix
Output: Cluster identification matrix 1n Z and the number of clusters
a) Step 1: Initially set the number of clusters to 1 1 and allocate all alternatives into this cluster,
for
b) Step 2: Find the most elevated inclination degree between the choices in a similar group utilizing Average linkage ( LA ) given by:
y , then go to Stage 3 is to apply a division strategy, In any case, Stop.
ISSN: 2321-9653; IC Value: 45.98; SJ Impact Factor: 7.538
Volume 11 Issue I Jan 2023- Available at www.ijraset.com
c) Step 3: To frame the centroids of the two recently shaped bunches, track down the two activities, u and v , that are currently in the same cluster
But the most opposed to each other:
If there are two or more equal highest preference degrees, then choose randomly. Go to Step 4.
d) Step 4: Define a new cluster 1 k k with centroids
are originally in the same cluster
Then i is owed to the bunch of
Otherwise,
Allocate the remaining alternatives
using the preference degree as a comparison with the two cluster centroids:
randomly to the same cluster with
Go to Step 2.
Finally, a subset of the feature is obtained.
3) Feature selection model 3: Finally the outcome from the three FSM is validated and based on intersection baseline features are selected. The cognitive intellect and sexual desire of chimps in group hunting are the basis for Feature selection model 3 ( 3 FS ). The independent random backups 1R 2R lead to incorrect position propagation as the base chimp optimization. To prevent the aforementioned issue, the matrices are updated using linear coefficient vectors. Pursuing the target while driving, Eqs. (21) and (22) are proposed.
Where t represents the current iteration count, a, m, and c represents the coefficient vectors, prey illustrates the vector of prey location, and CHIMP is the location vector of a chimp. A , M and C vectors are calculated by Eqs 23-25., respectively.
Which, f illustrates the non-linearly ranging from 2.5 to 0 through the iteration process. Where 1R and 2R are updated by linear coefficient vectors.
Where max i is the maximum iteration, z is a parameter that has a value between −1 and 1 and x is a random number within the interval [0, 1].
Chimps' attacking behavior is planned as follows: The chimps can investigate the position of the prey (by driving, obstructing, and pursuing) and then encircle it. To genuinely mirror chimp conduct, it is speculated the earliest aggressor, driver, hindrance, and
ISSN: 2321-9653; IC Value: 45.98; SJ Impact Factor: 7.538
Volume 11 Issue I Jan 2023- Available at www.ijraset.com
chaser are better instructed about imminent prey areas. As a result, four of the finest answers achieved thus far are saved, and other chimps are pushed to change their places by the best chimps' placements. Eqs. (25)-(28) describe this correlation (29).
The chimps attack the target in the final stage and finish the search as quickly as the prey comes to a stop. The value of f should be lowered during the attacking procedure.
It should be noted that the fluctuation range is likewise lowered f . In other words, is a variable in the range [−2 f , 2 f ], whereas for value f decreases from 2.5 to 0 during repetitions. Whenever the arbitrary values of a fall between [1, 1], The chimps' exploring is primarily based on the position of the attacker, barrier, chaser, and driving chimps. They divide to find prey and then combined to assault it.
Building Prediction models is the same as determining the output variable that is the best estimate of the target value given the known inputs. Typically, for disaster monitoring, a large number of parameters influence the target, and the connection between inputs and outputs is not linear. Different forecasting strategies are accessible, with ANFIS being chosen comparative analysis provided in previous study work for various forecasts. Creating a prediction model is a component of machine learning techniques, which requires a big dataset for training

ISSN: 2321-9653; IC Value: 45.98; SJ Impact Factor: 7.538
Volume 11 Issue I Jan 2023- Available at www.ijraset.com
For the sake of simplicity, we'll assume that the fuzzy inference system we're thinking about has one output, z, and two inputs, x and y, as illustrated in fig 3. Assume the rule base comprises two Takagi and Sugeno's type fuzzy if-then rules


Next, type-3 fuzzy reasoning is demonstrated in Fig. 4(a), and type-3 ANFIS is shown as the analogous ANFIS architecture (b). According to the description below, the node functions in the same layer belong to the same function family.
1) Layer 1: Each hub I in this layer is a square hub with a hub capability
Where F is the contribution to the hub i , and iB , is the etymological name (little, enormous, and so forth) related to this hub capability. As such, 1 i ; is the enrollment capability of iB , and it determines how much the given F fulfills the quantifier manmade intelligence. Generally, we pick ( F ) to be chime molded with the most extreme equivalent to 1 and least equivalent to 0, for example,
Where if id ia is the boundary set. As the upsides of these boundaries change, the ringer molded capabilities shift appropriately, accordingly displaying different types of enrollment capabilities on phonetic name computer-based intelligence. Truth be told, any consistent and piecewise differentiable capabilities, for example, usually utilized trapezoidal or three-sided molded enrollment capabilities, are an additionally qualified contender for hub capabilities in this layer. Boundaries in this layer are alluded to as start boundaries.
2) Layer 2: A Encountering difficulties circle node, which mixes incoming signals and outputs the result, makes up each node in this layer. Each node output, for instance, represents the firing power of a rule. In actuality, any other T-norm operator that performs generalized AND can serve as the node function for this layer.
ISSN: 2321-9653; IC Value: 45.98; SJ Impact Factor: 7.538
Volume 11 Issue I Jan 2023- Available at www.ijraset.com
3) Layer 3: This layer's nodes are all circle nodes with the label "N." The ith node determines the ratio of the firing strength of the ith rule to the total firing strength of all rules: The outcomes of this stratum would be referred to as normalized discharge rates for simplicity.
4) Layer 4: Layer 5: Each node I Consequential variables are the name given to the parameters in this layer. This layer contains a single node, a circular node with the labeling “C,” which quantifies the total output as the sum of all incoming signals, that is (35) As a result, we were able to create an adaptive network that method of dealing to a type-3 system for fuzzy inference.
Wherein iw is the outcome of layer 3 and 1 , 1G R is the parameter set.
The type-1 ANFIS is a mechanism in which the outcome for every rule is simultaneously generated by the output membership function and the firing strength. The extension for type-1 fuzzy inference systems is quite simple. Type-3 ANFIS can still be created by type-2 fuzzy and is swapped out for a discrete version that estimates the estimated centroids of area.
To optimize the weight the work has developed an optimal attention network that assists with choosing the exceptionally applicable cadenced weight that assists with working on the backup. Include choice assists with matching an agreeable backup for some random data, which is important to tackle the coordination issue of programmed backup. The work uses an optimal attention network to select the informative data as shown in fig 4. A

, where
the sample size and d is the character count. The transposition of the matrix is represented by the letter T . A column vector m i i 1,2,...., , is used to represent each sample, a row vector d i k 1,2,...., , is used to represent each feature, and i k , is used to represent the kth feature i . The term iy is connected to the noun i . In an assignment with several classes, j iy provides the label for the jth class
It is suggested to use a separate soft-attention technique. Each attention unit in the attention layer produces two values as a result of the binary classification (select/unselected): for the kth feature k , k N represent selected/unselected values, respectively, and are calculated using Formulae (18) and (19):
ISSN: 2321-9653; IC Value: 45.98; SJ Impact Factor: 7.538
Volume 11 Issue I Jan 2023- Available at www.ijraset.com
Where k lh is the result of the Lth hidden layer in the kth attention net. The variables of
, while the parameters
k N that must be understood are k N and k Nb Due to the potential proximity of k and k N Then, with each alternative falling within the range, the softmax is utilized to provide differentiable results to statistically increase the difference between selection and un-selection (0, 1). Here, we just pay attention to k it since it produces the following chance of being chosen as an attention feature kA :
matrix states that
These superficial attention nets produce the attention matrix
is used to calculate the weight of the kth feature. Take note that the attention module's parameters are condensed
The attention module has more overt benefits than the embedded feature selection method:
a) Rather than coefficient values being altered exclusively by backpropagation, the feature weights are produced by the feature selection pattern, produced by independent attention networks. The neural network E can more thoroughly take into account the intrinsic link between both parameters;
b) Convergence during training can be hastened by the fact that the feature weights are always restricted to a value between 0 and 1. The softmax design is also a fully trainable back propagation deterministic mechanism that is fully distinguishable.
c) The combined work from E and the learning module eliminates redundant and irrelevant features. Certain superfluous functionality data will be lost due to E's lower size. When this happens, the attention net corresponding to those aspects that were dropped may not have sufficient data and generate features with low feature weights. Thus, the unnecessary characteristics' production can be further muted. Naturally, it is very random which unnecessary features are to be removed.
Learning module By using pair-wised multiplication to contact the feature vectors A , we obtain the weighted features G as follows:
Frequently choosing among picking and unselecting is analogous to the process of changing the A . The training method includes backpropagation to produce an attention matrix A by resolving the objections in the following manner
Where, l A , and R is frequently an L2-norm that aids in accelerating the optimization method and avoiding overfitting. The degree of regularization is controlled by this case. The type of prediction tasks affects the loss function. The cross-entropy loss functions are typically employed for classification tasks. The mean-square error (MSE) is typically employed for regression tasks
For detecting four security vectors utilized by the Botnet, the built InitDBSCAN-ROS, Glorot-InitFSO, and CI-LoGAN detection model is compared with the respective existing technique and evaluated for Botnet detection. The proposed work is carried out in a working platform of python based on publically collected datasets.
ISSN: 2321-9653; IC Value: 45.98; SJ Impact Factor: 7.538
Volume 11 Issue I Jan 2023- Available at www.ijraset.com
Table 1 illustrates the error rate and time taken for selecting informative data. The proposed TEM illustrates a pure class sampling which gives a low error rate with a high performance rate. According to that the Disaster classes are better understood by the proposed technique and it is executed as compared to existing methods. As the error rate remains to be high for existing models that range between 0.21 to 0.15 due to poor initialization which leads to a high misprediction of disaster. Compared to existing models the proposed method performs better than existing models and achieves a low error rate of 0.02. Finally, Computational time is most important to avoid uncertain reactions within the networks. The proposed technique obtains low computation time i.e. from 3.25s. But the existing techniques achieve a high time i.e. 7.45s to 9.99s which is comparatively high and also leads to a high error rate


ISSN: 2321-9653; IC Value: 45.98; SJ Impact Factor: 7.538
Volume 11 Issue I Jan 2023- Available at www.ijraset.com
Fig 5 illustrates the convergence of the existing FOA, VOA, and GOA algorithms against the proposed TEM algorithm The convergence curve evaluates how close a given solution is to the optimum solution of the desired problem. It determines how to fit a solution. According to that, it is clearly understood that the existing FOA, VOA, and GOA technique tends to obtain a low fitness value for the iteration range between 0 to 5. But the proposed algorithms tend to achieve a better fitness value which illustrates a better optimization for selecting highly informative data for disaster prediction. The proposed method tends to achieve a moderate exploration and exploitation phase which pretends to give a better outcome

The envisaged OAN-ANFIS is assessed based on metrics such as Accuracy, Specificity, Sensitivity, Precision, F-Measure, False Positive Rate (FPR), False Negative Rate (FNR), computation time, and MSE. It is also compared to existing methodologies such as Random Forest (RF), Extreme Gradient Boosting (XGBOOST), Gradient Boosting (GBOOST), Support Vector Machine (SVM), and K-Nearest The evaluation of the suggested strategy in comparison to the widely used methods for disaster detection is shown in Table 1

TABLE2
EVALUATION OF PROPOSED OAN-ANFIS CENTERED ON VARIOUS METRICS
The proposed OAN-ANFIS analysis is depicted in Table 2, and it is centered on various performance metrics like F-Measure, FPR, and FNR. The "4" essential parameters true positive (TP), true negative (TN), false positive (FP), and also false negative (FN) are the foundation upon which the performance metrics are constructed. Because TP specifies that the predicted value and the actual value are the same, According to TN, both the actual value and the predicted value are disasters; FP identifies that the actual value is a disaster while the predicted value does not, and FN identifies that the actual value is not a disaster while the predicted value does not indicate one. As a result, an evaluation of a disaster is entirely dependent on the "4" parameters

ISSN: 2321-9653; IC Value: 45.98; SJ Impact Factor: 7.538


Volume 11 Issue I Jan 2023- Available at www.ijraset.com
ISSN: 2321-9653; IC Value: 45.98; SJ Impact Factor: 7.538
Volume 11 Issue I Jan 2023- Available at www.ijraset.com
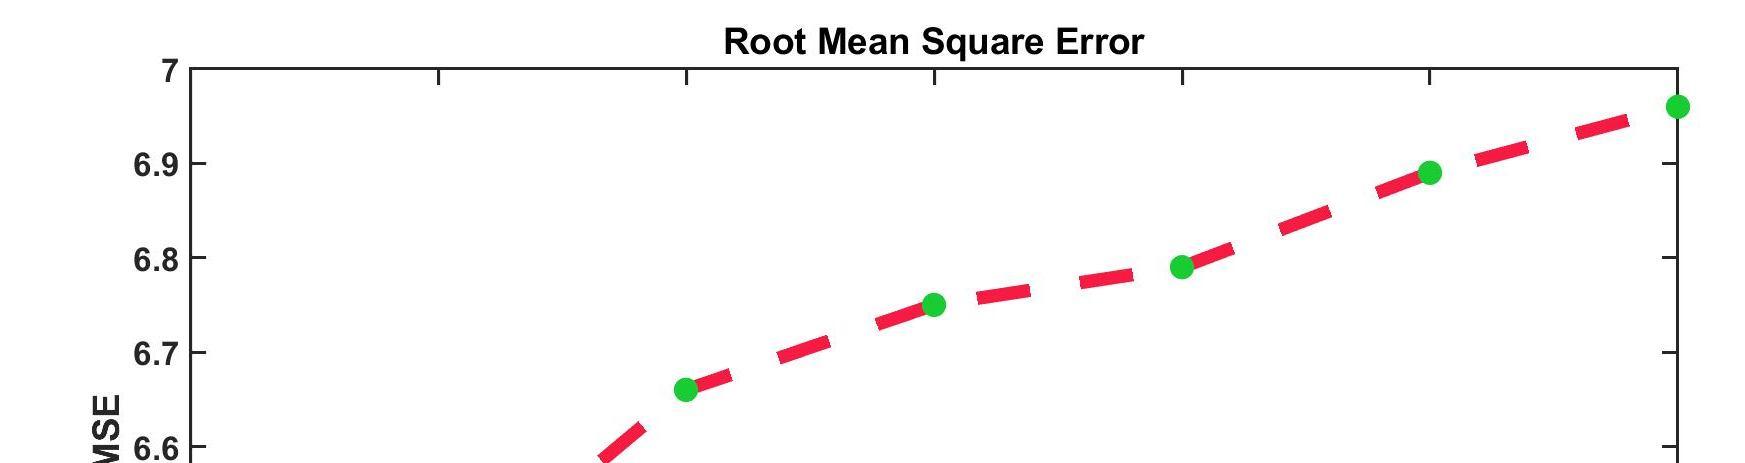
The graphical examination centered on metrics like accuracy, precision, specificity, and recall for the proposed OAN-ANFIS is shown in Fig 6. After that, the obtained metrics are compared to a variety of existing methods, including SVM, RF, XGBOOST, GBOOST, ANN, and KNN. Aiming at a design that has the potential to produce a higher Accuracy, MSE, RMSE, and MAE value to function effectively. Specifically, the proposed protocol achieves 96.75 percent accuracy, 2.2% MSE, 6.25 percent RMSE, and 2.15 percent MAE. The accuracy metrics achieved by the existing methods ranged from 80.47 percent to 91.24 percent, which is relatively less than the model proposed, while the remaining metrics ranged from 2.5 percent to 6.96 percent. However, the proposed method's achieved value was greater than that of the existing methods. The proposed OAN-ANFIS method is effective when compared to the existing method and produces an effective metrics value for disaster prediction


The proposed OAN-ANFIS graphical analysis is shown alongside the various existing methods, such as SVM, RF, XGBOOST, GBOOST, ANN, and KNN, that are focused on metrics like FPR and FNR. The work's efficacy on the diverse disaster dataset (i.e., the reliability of the proposed prediction techniques) is demonstrated by the metrics FPR. Consequently, the proposed plan achieves a lower FPR value of 0.05 and an FNR value of 0.06; However, the current method achieves high FPR and FNR values that demonstrate lower design efficacy in comparison to the proposed method. In addition, the proposed method is examined using the FPR and FNR metrics, which describe the possibility of misclassification. As a result, the proposed method results in lower FPR and FNR values; However, the existing methods produced FPR and FNR values that were higher, leading to incorrect predictions. As a result, the proposed method achieves low computation time while still achieving efficient reliability and avoiding disaster misprediction in comparison to existing methods
To overcome the existing concerns of false prediction and inaccurate decision-making towards disaster prediction the work has demonstrated an Intelligent Disaster prediction in a communication network that alters and empowers the decision-making process to avoid False alarm rate toward transmitting data to the digital world in a better way using OAN-ANFIS technique based on TEM Feature selection approach. The proposed work is a clever determination procedure that provides systems to automatically learn and improve from experience without being explicitly programmed. The work focuses on the development of computer programs that can access data and use it to learn for themselves. For this reason, the created choice strategy, TEM, satisfies the significant characteristics to restrict the probability of an error. At last, OAN-ANFIS trains and tests the chosen information, foreseeing the best solution and unsettling the false solution. The trial results showed that the structure achieves an accuracy of 96.75% and eliminates the false prediction by achieving an FPR of 0.05and FNR of 0.06 and essentially acknowledges ideal disaster determination under the network communication, this has the high enemy of impedance capacity, and that its general exhibition is superior to most other current ideal correspondence disaster choice calculations
ISSN: 2321-9653; IC Value: 45.98; SJ Impact Factor: 7.538
Volume 11 Issue I Jan 2023- Available at www.ijraset.com
I would like to convey my heartfelt appreciation to my supervisor, Er. Ravinder Pal singh, Technical Head, Department of Research, Innovation and Incubation and Dr. Monika Mehra, Professor, Department of Electronics and Communication Engineering at RIMT University Mandi Gobindgarh for launching an engaging project, their dedication, stimulating debate and valuable advice. They have been a constant source of encouragement and useful direction and oversight throughout the project.
[1] S. Bhattacharya, and A. Singh, “Why the tremendous potential of uploading health educational material on medical institutions’ websites remains grossly underutilized in the era of the Fourth Industrial Revolution?,” J. Educ. Health Promot., vol. 9, 2020.
[2] J. Lathrop, and B. Ezell, “A systems approach to risk analysis validation for risk management,” Saf. Sci., vol. 99, pp.187-195, 2017.
[3] C.A. MacKenzie, K. Barker, and J.R. Santos, “Modeling a severe supply chain disruption and post-disaster decision making with application to the Japanese earthquake and tsunami,” IIE Trans., vol. 46, no. 12, pp.1243-1260, 2014.
[4] H. Miller, and K. Matussek, “VW executive tally in diesel scandal grows with Stadler arrest.” Automotive News. (2018, June 18).
[5] R. Nateghi, and T. Aven, “Risk analysis in the age of big data: The promises and pitfalls,” Risk Anal., vol. 41, no. 10, pp.1751-1758, 2021.
[6] A. Bilen, and A.B. Özer, “Cyber-attack method and perpetrator prediction using machine learning algorithms,” PeerJ Comput. Sci., vol. 7, p.e475, 2021.
[7] T. Ring, “Connected cars–the next target for hackers,” Netw. Secure., vol. 11, pp.11-16, 2015.
[8] D.E. Sanger, and N. Perlroth, “Pipeline attack yields urgent lessons about US cybersecurity,” The New York Times, 2021.
[9] M.U. Scherer, “Regulating artificial intelligence systems: Risks, challenges, competencies, and strategies,” Harv. JL & Tech., vol. 29, p.353, 2015.
[10] L. De Haan, and A. Ferreira, “Extreme value theory: an introduction,” Springer Science & Business Media, 2007.
[11] B.M. de Silva, D.M. Higdon, S.L. Brunton, and J.N. Kutz, “Discovery of physics from data: universal laws and discrepancies,” Front. Artif. Intell., vol. 3, p.25, 2020.
[12] D. Eisenberg, T. Seager, and D.L. Alderson, “Rethinking resilience analytics,” Risk Anal., vol. 39, no. 9, pp.1870-1884, 2019.
[13] Graham, B, Bond, R., Quinn, M. and Mulvenna, M., 2018. Using data mining to predict hospital admissions from the emergency department. IEEE Access, 6, pp.10458-10469
[14] R. Hajar, “Risk factors for coronary artery disease: historical perspectives,” Heart views: the official journal of the Gulf Heart Association, vol. 18, no. 3, p. 109, 2017.
[15] A.U. Haq, J.P. Li, M.H. Memon, S. Nazir, and R. Sun, “A Hybrid Intelligent System Framework for the Prediction of Heart Disease Using Machine Learning Algorithms,” Mob Inf Syst , pp. 1-21, 2018.
[16] K. He, D. Ge, and M. He, “Big data analytics for genomic medicine,” Int. J. Mol. Sci., vol. 18, no. 2, p. 412, 2017.
[17] N.G. Hedeshi, and M.S. Abadeh, “Coronary artery disease detection using a fuzzy-boosting PSO approach,” Comput. Intell. Neurosci., vol. 6, pp. 1-12, 2014
[18] K. Foy, “With lidar and artificial intelligence, road status clears up after a disaster.” MIT News. https://news.mit.edu/2020/lidarand-ai-road-status-clears-afterdisaster-0415, (2020, April 21).
[19] Y. Gil, and B. Selman, “A 20-year community roadmap for artificial intelligence research in the US.” arXiv preprint arXiv:1908.02624, 2019
[20] G. Chandrashekar, and F. Sahin, “A survey on feature selection methods,” Comput. Electr. Eng., vol. 40, no. 1, pp. 16-28, 2014

[21] N.V. Chawla, and D.A. Davis, “Bringing big data to personalized healthcare: A patient-centered framework,” J. Gen. Intern. Med., vol. 28, no. 3, pp. 660–665, 2013.
[22] N.A. Greenblatt, “Self-driving cars and the law.” IEEE Spectrum, vol. 53, no. 2, pp. 46–51, 2016
[23] B. Shneiderman, “Why algorithms urgently need independent oversight.” Proceedings of the National Academy of Sciences, vol. 113, no. 48, pp. 13538–13540, 2016.
[24] S.A. Bini, “Artificial intelligence, machine learning, deep learning, and cognitive computing: What do these terms mean and how will they impact health care?” J Arthroplasty, vol. 33, no. 8, pp. 2358– 2361, 2018
Kamal Lekhak Department of Electronics and Communication Engineering, RIMT University, Mandi Gobindgarh, Punjab

ISSN: 2321-9653; IC Value: 45.98; SJ Impact Factor: 7.538
Volume 11 Issue I Jan 2023- Available at www.ijraset.com