INTERNATIONAL JOURNAL OF INNOVATIVE TECHNOLOGY AND CREATIVE ENGINEERING (ISSN:2045-8711) VOL.3 NO.7 JULY 2013 Table 5: Experimental & Regression Model Values (Train Data)
S.No
Experimental Ra
1 2 3 4 5 6 7 8 9 10 11 12 13 14 15 16 17 18 19 20 21 22
5.56 6.286 6.99 7.542 5.52 5.964 6.224 6.322 5.862 5.128 5.96 5.168 5.428 5.423 4.914 4.857 4.68 5.462 5.784 6.992 5.176 5.186
First Order Multiple Regression Ra 5.1206 5.4631 5.8056 6.1481 5.1966 5.533 6.823 7.112 5.226 5.568 5.911 6.253 5.297 5.6395 5.982 6.3245 5.32 6.0373 6.3798 6.7223 5.176 6.1079
23
6.384
6.4504
6.71684
24 25 26 27
6.678 5.868 6.184 6.65
6.7929 5.242 6.232 6.95
5.68620 5.78137 7.13576 6.54200
28 29 30 31 32
6.562 6.678 6.549 5.674 6.342
6.8782 6.945 6.2132 6.324 6.8982
7.52406 7.64231 7.57550 5.65548 5.68207
33
4.557
6.0374
6.86505
34 35 36 37 38 39 40 41 42 43 44 45 46 47 48 %
5.743 6.642 7.682 5.576 6.528 6.243 7.868 6.436 6.84 7.264 7.501 7.2 7.54 7.642 7.523 Deviation
6.24 6.7224 7.0049 6.242 6.4504 6.245 6.92 6.1432 6.4857 7.824 7.1707 6.124 6.556 6.898 7.241 15.236
6.22740 5.71806 7.55987 5.67144 7.48800 5.30598 6.93056 5.93885 6.42720 6.34093 6.22164 4.59990 6.09609 7.13726 5.55306 3.4265
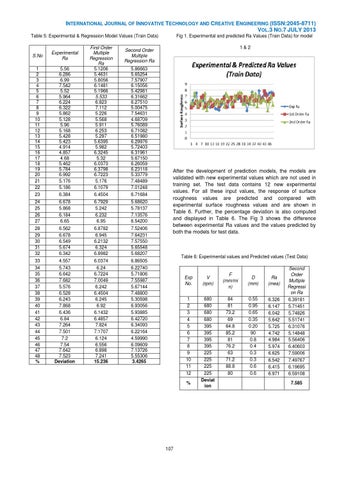
Fig 1. Experimental and predicted Ra Values (Train Data) for model 1&2
Second Order Multiple Regression Ra 5.86663 5.65254 7.57907 6.15056 5.42981 6.31662 6.27510 5.00475 7.54631 4.68709 5.76089 6.71082 6.51980 6.29976 5.72403 6.31961 5.67150 6.26059 6.23118 5.33779 7.48489 7.01248
After the development of prediction models, the models are validated with new experimental values which are not used in training set. The test data contains 12 new experimental values. For all these input values, the response of surface roughness values are predicted and compared with experimental surface roughness values and are shown in Table 6. Further, the percentage deviation is also computed and displayed in Table 6. The Fig 3 shows the difference between experimental Ra values and the values predicted by both the models for test data.
Table 6: Experimental values and Predicted values (Test Data)
Exp No.
V (rpm)
1 2 3 4 5 6 7 8 9 10 11 12
680 680 680 680 395 395 395 395 225 225 225 225 Deviat ion
%
107
F (mm/mi n)
D (mm)
Ra (mea)
84 81 73.2 69 64.8 85.2 81 76.2 63 71.2 88.8 80
0.55 0.95 0.65 0.35 0.20 90 0.8 0.4 0.3 0.3 0.6 0.6
6.326 6.147 6.042 5.642 5.725 4.742 4.984 5.974 6.625 6.542 6.415 6.971
Second Order Multiple Regressi on Ra 6.39181 5.71451 5.74826 5.51741 6.31076 5.14848 5.56406 6.40603 7.59006 7.49767 6.19695 6.59108 7.585