INTERNATIONAL JOURNAL OF INNOVATIVE TECHNOLOGY AND CREATIVE ENGINEERING (ISSN:2045-8711) VOL.5 NO.2 FEBRUARY 2015
Fig 2.Images Considered for Experimentation 5. SIMILARITY AND PERFORMANCE MEASURES To find the similarity measures between the images, various metrics are used to measure the distance between features of the images. Some of the well known distance metrics used in for image retrieval is presented below. The Euclidean Distance is calculated as below
d E ( x1 , x 2 ) =
i= n
( x1 (i ) − x2 (i )) ∑ i =1
2
… (3.12) Where x1(i) is the feature vector of input image i and x2(i) is the feature vector of the target image i in the image database. In the texture based image retrieval system Euclidean distance is used to find the distance between the features vectors of the target image It and each of the image in the image database (Ii). The difference between two images Ii and It can be expressed as the distance ‘d’ between the respective feature vectors Fs(Ii) and Fs(It). From the given input image Ii and the target image It the Euclidean Distance is calculated as,
(
( )
)
dE Fs Ii , Fs( It ) =
i=n
∑ Fs( Ii ) − Fs( It ) i=1
(
)
2
… (3.13) Where Fs(Ii) is the feature set of the input image Ii, Fs(It) is the n-dimensional feature vector of the target image It respectively. Precision Precision measures the fraction of retrieved documents that are relevant to a specific query and is analogous to positive predictive value. No. of relevant images retrieved P (%) = × 100 -- (3.14) Total no. of images Retrieved
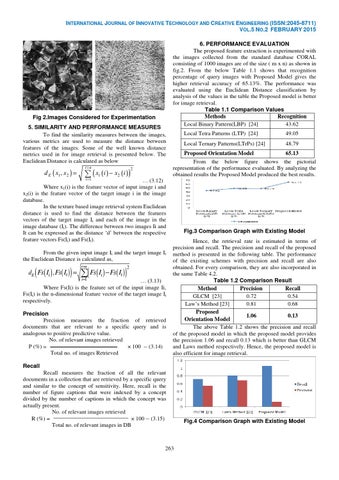
6. PERFORMANCE EVALUATION The proposed feature extraction is experimented with the images collected from the standard database CORAL consisting of 1000 images are of the size ( m x n) as shown in fig.2. From the below Table 1.1 shows that recognition percentage of query images with Proposed Model gives the higher retrieval accuracy of 65.13%. The performance was evaluated using the Euclidean Distance classification by analysis of the values in the table the Proposed model is better for image retrieval. Table 1.1 Comparison Values Methods Recognition Local Binary Pattern(LBP) [24] 43.62 Local Tetra Patterns (LTP) [24]
49.05
Local Ternary Patterns(LTrPs) [24]
48.79
Proposed Orientation Model 65.13 From the below figure shows the pictorial representation of the performance evaluated. By analyzing the obtained results the Proposed Model produced the best results.
Fig.3 Comparison Graph with Existing Model Hence, the retrieval rate is estimated in terms of precision and recall. The precision and recall of the proposed method is presented in the following table. The performance of the existing schemes with precision and recall are also obtained. For every comparison, they are also incorporated in the same Table 4.2. Table 1.2 Comparison Result Method Precision Recall GLCM [23] 0.72 0.54 Law’s Method [23] 0.81 0.68 Proposed 1.06 0.13 Orientation Model The above Table 1.2 shows the precision and recall of the proposed model in which the proposed model provides the precision 1.06 and recall 0.13 which is better than GLCM and Laws method respectively. Hence, the proposed model is also efficient for image retrieval.
Recall Recall measures the fraction of all the relevant documents in a collection that are retrieved by a specific query and similar to the concept of sensitivity. Here, recall is the number of figure captions that were indexed by a concept divided by the number of captions in which the concept was actually present. No. of relevant images retrieved R (%) = × 100 -- (3.15) Total no. of relevant images in DB
263
Fig.4 Comparison Graph with Existing Model