14 | GBD 2010
15 | GBD 2010
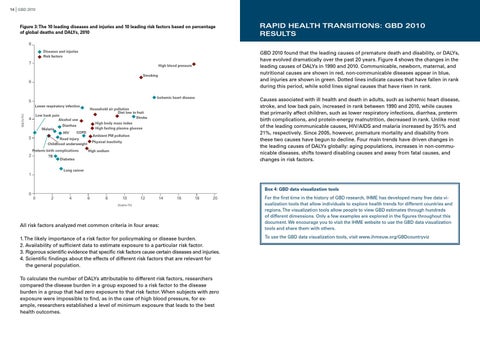
Figure 3: The 10 leading diseases and injuries and 10 leading risk factors based on percentage of global deaths and DALYs, 2010
RAPID HEALTH TRANSITIONS: GBD 2010 RESULTS
8 Diseases and injuries Risk factors
7
GBD 2010 found that the leading causes of premature death and disability, or DALYs, have evolved dramatically over the past 20 years. Figure 4 shows the changes in the leading causes of DALYs in 1990 and 2010. Communicable, newborn, maternal, and nutritional causes are shown in red, non-communicable diseases appear in blue, and injuries are shown in green. Dotted lines indicate causes that have fallen in rank during this period, while solid lines signal causes that have risen in rank.
High blood pressure Smoking
6
Ischemic heart disease
5
DALYs (%)
Lower respiratory infection
4
3
High body mass index High fasting plasma glucose
Diarrhea COPD
HIV
Ambient PM pollution
Road injury Childhood underweight Preterm birth complications
2
TB
Physical inactivity High sodium
Diabetes Lung cancer
1
0
Household air pollution Diet low in fruit Stroke
Low back pain Alcohol use Malaria
Causes associated with ill health and death in adults, such as ischemic heart disease, stroke, and low back pain, increased in rank between 1990 and 2010, while causes that primarily affect children, such as lower respiratory infections, diarrhea, preterm birth complications, and protein-energy malnutrition, decreased in rank. Unlike most of the leading communicable causes, HIV/AIDS and malaria increased by 351% and 21%, respectively. Since 2005, however, premature mortality and disability from these two causes have begun to decline. Four main trends have driven changes in the leading causes of DALYs globally: aging populations, increases in non-communicable diseases, shifts toward disabling causes and away from fatal causes, and changes in risk factors.
Box 4: GBD data visualization tools 0
2
4
6
8
10
12
14
16
18
20
Deaths (%)
All risk factors analyzed met common criteria in four areas: 1. The likely importance of a risk factor for policymaking or disease burden. 2. Availability of sufficient data to estimate exposure to a particular risk factor. 3. Rigorous scientific evidence that specific risk factors cause certain diseases and injuries. 4. Scientific findings about the effects of different risk factors that are relevant for the general population. To calculate the number of DALYs attributable to different risk factors, researchers compared the disease burden in a group exposed to a risk factor to the disease burden in a group that had zero exposure to that risk factor. When subjects with zero exposure were impossible to find, as in the case of high blood pressure, for example, researchers established a level of minimum exposure that leads to the best health outcomes.
For the first time in the history of GBD research, IHME has developed many free data visualization tools that allow individuals to explore health trends for different countries and regions. The visualization tools allow people to view GBD estimates through hundreds of different dimensions. Only a few examples are explored in the figures throughout this document. We encourage you to visit the IHME website to use the GBD data visualization tools and share them with others. To use the GBD data visualization tools, visit www.ihmeuw.org/GBDcountryviz